
Modularized Design of ACDCD: An Improved Spectral Clustering-Based Approach


Abstract
:1. Introduction
2. Methods
2.1. The Concept of Modular Design
2.2. Quantification of Relevance of Product Function and Structure
2.3. Modular Method Based on Improved Spectral Clustering Algorithm
3. Analysis of Existing ACDCD and the IACDCD
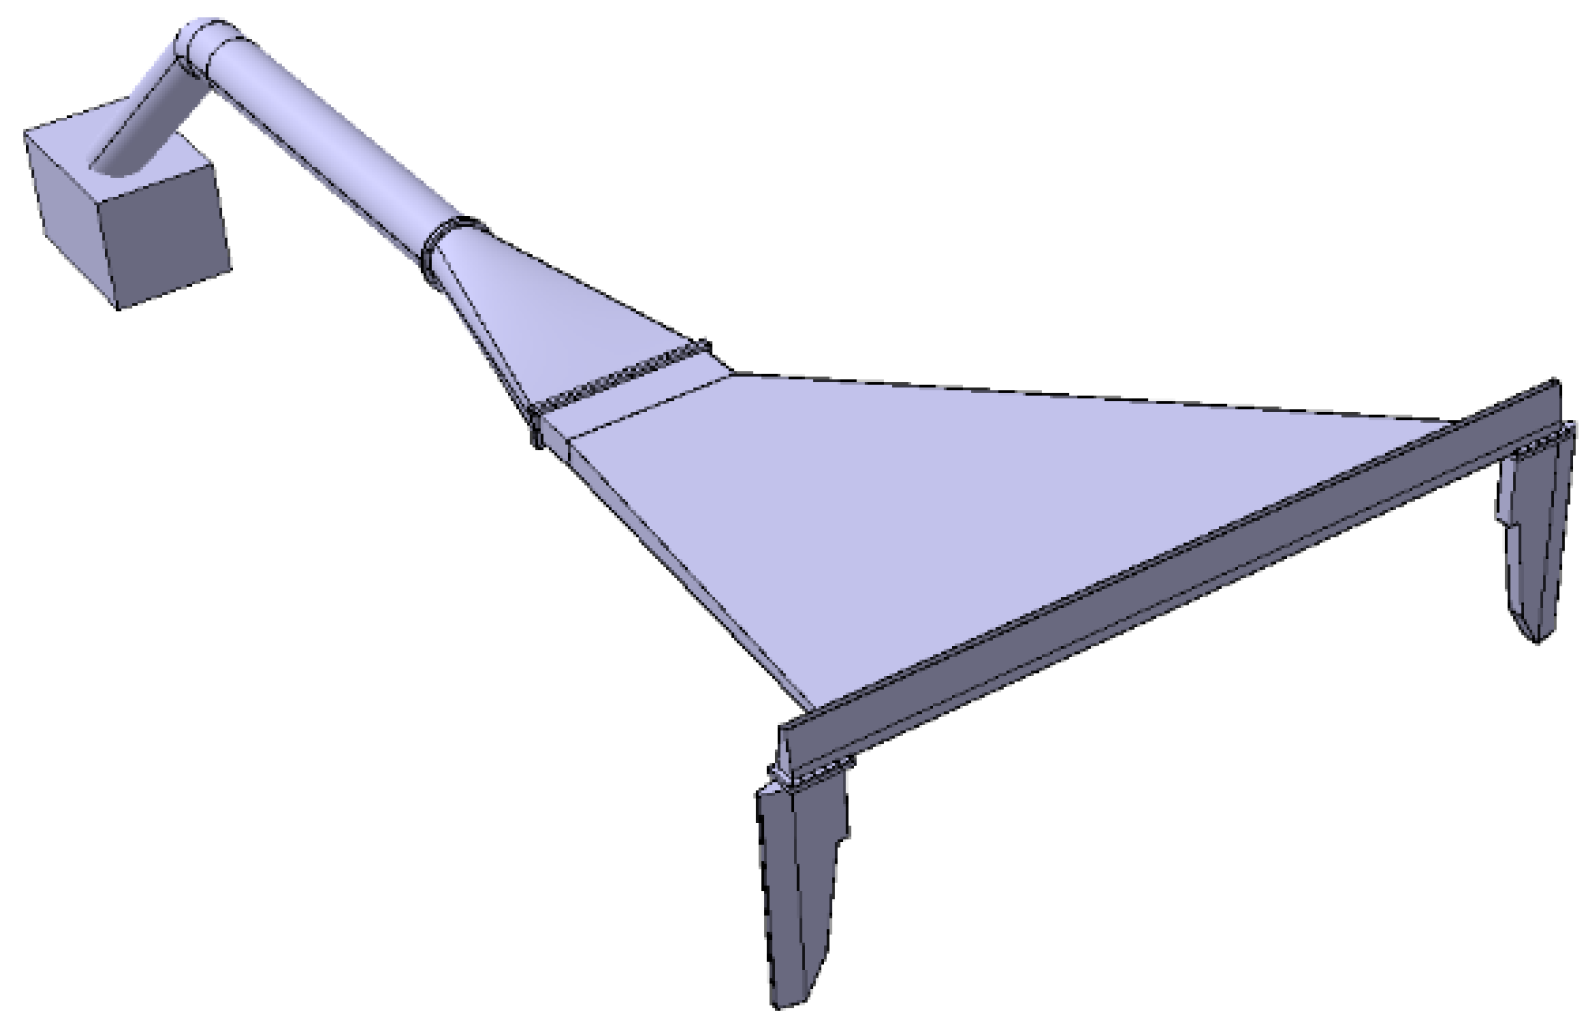
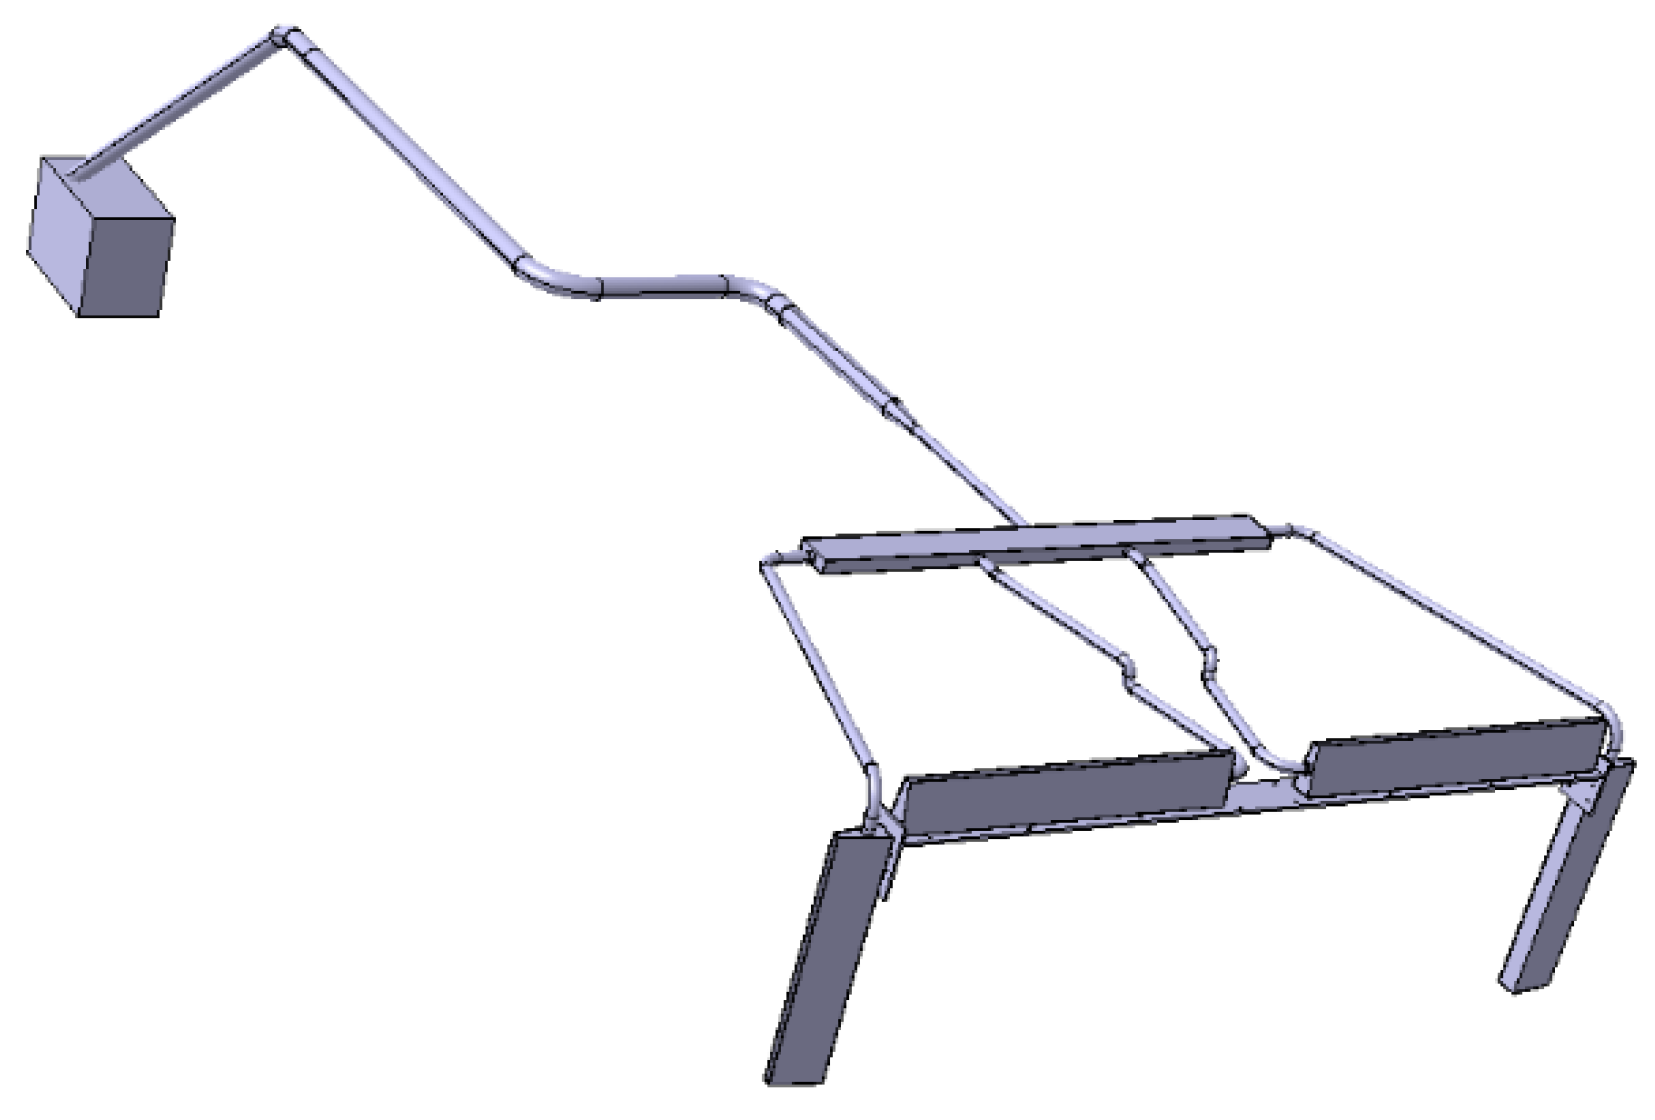
3.1. Analysis of Existing ACDCD
3.2. The Improved ACDCD
4. Case Analysis
4.1. Quantification of Relevance of Different ACDCD
4.2. Modular Process of ACDCD
4.3. Comparison and Analysis of Clustering Methods
4.4. Comparison and Analysis of Clustering Quantity
4.5. Comparison and Analysis of Actual Results
5. Conclusions
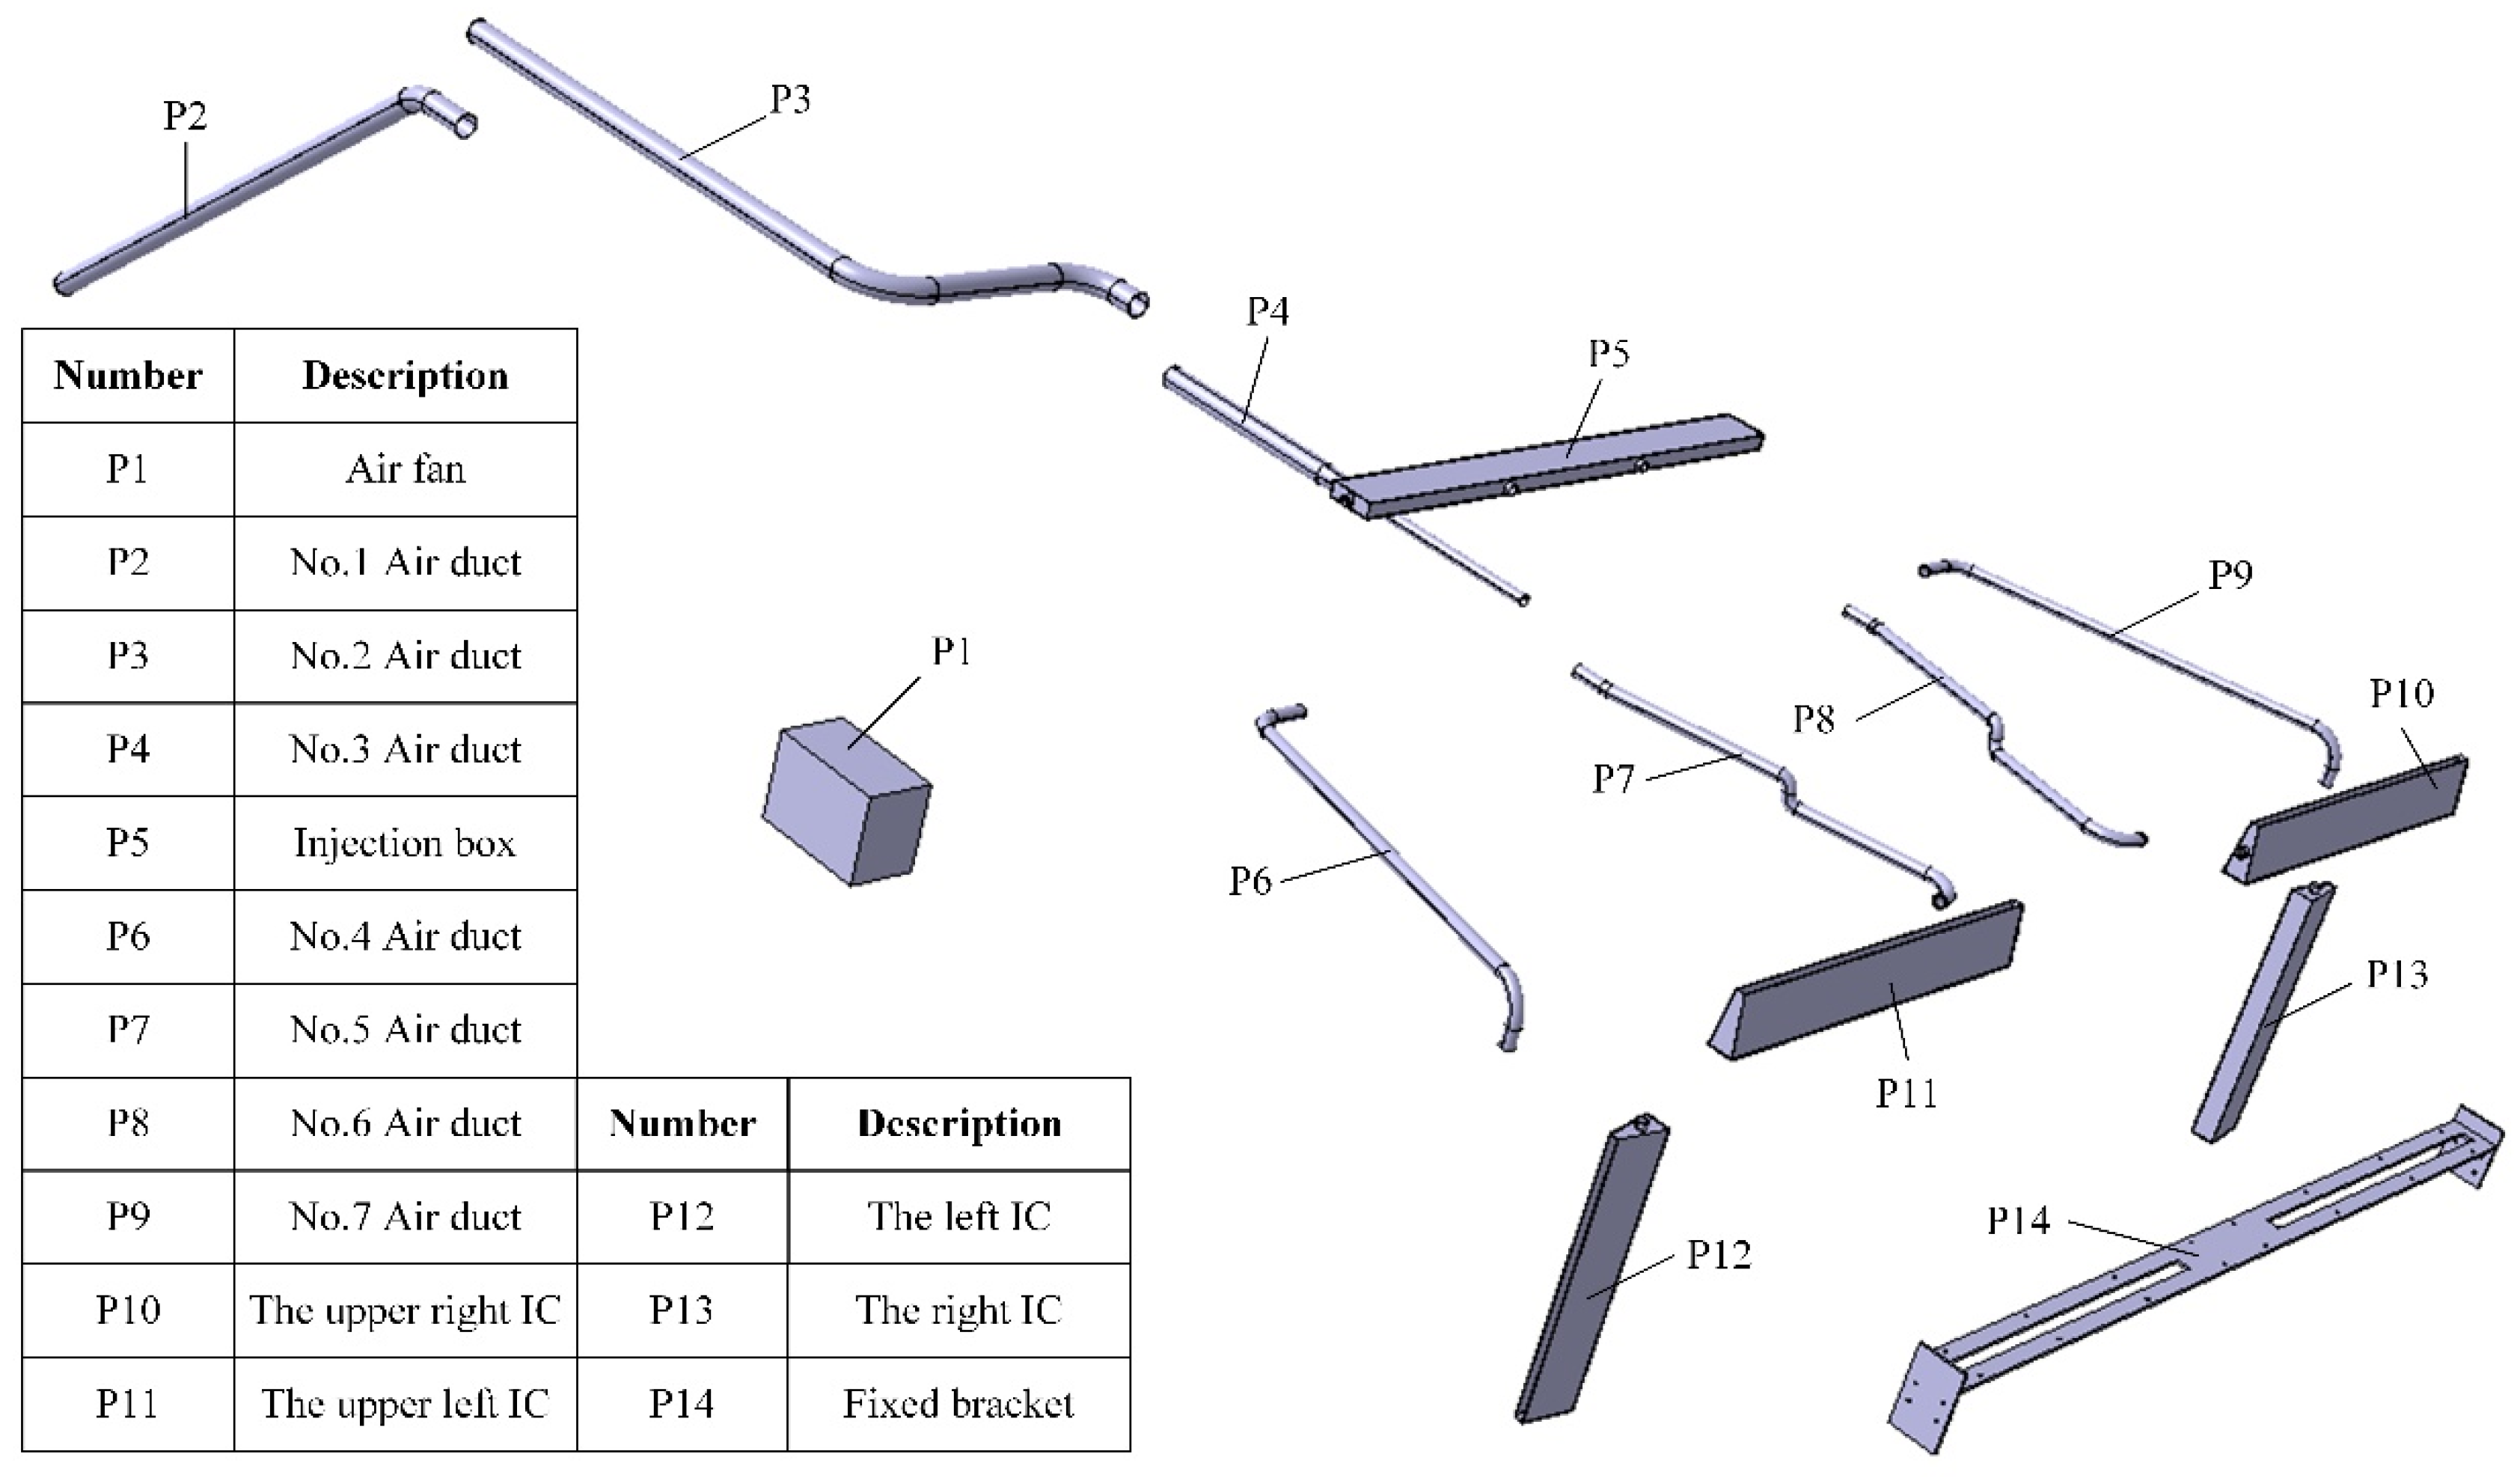
- An improved ACDCD was proposed in this paper to adapt to more application scenarios, reduce the complexity of the ACDCD and improve the flexibility of the ACDCD. The injection box and the fixed bracket were removed. The IC size and the pipeline system were unified. Moreover, the angle of the individual ICs was adjusted by a bolt that connected the IC to the fixed bracket.
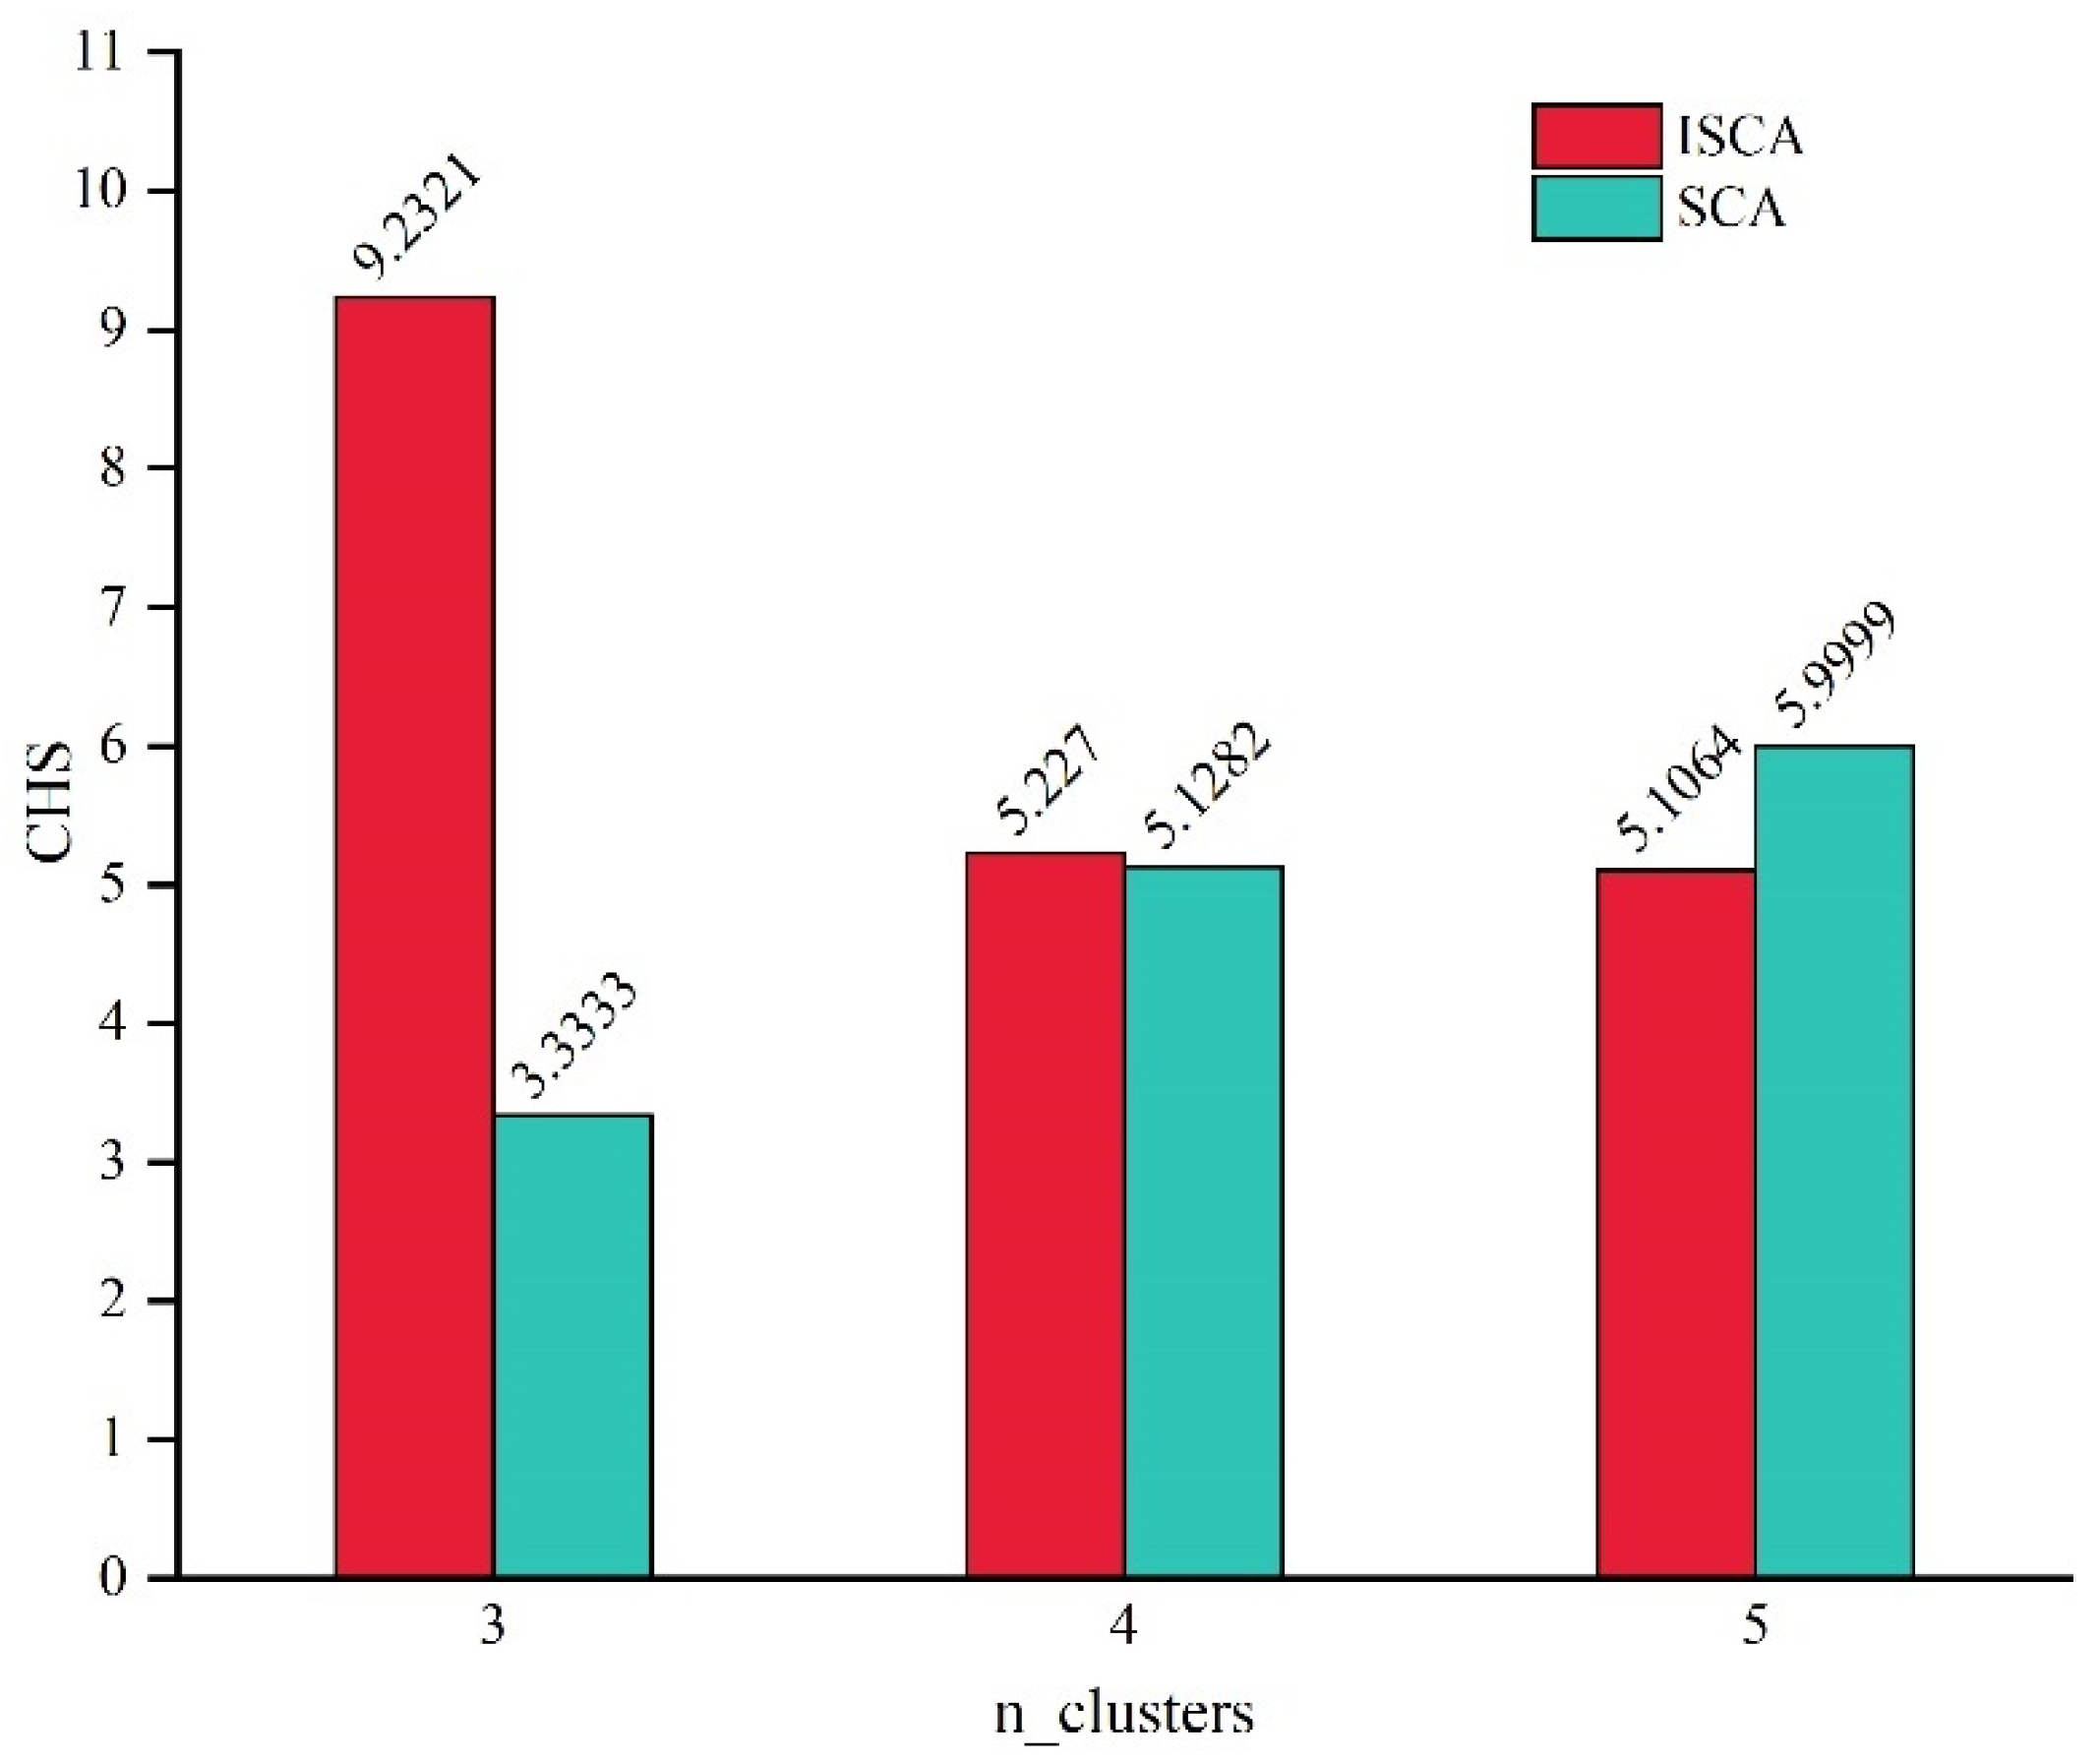
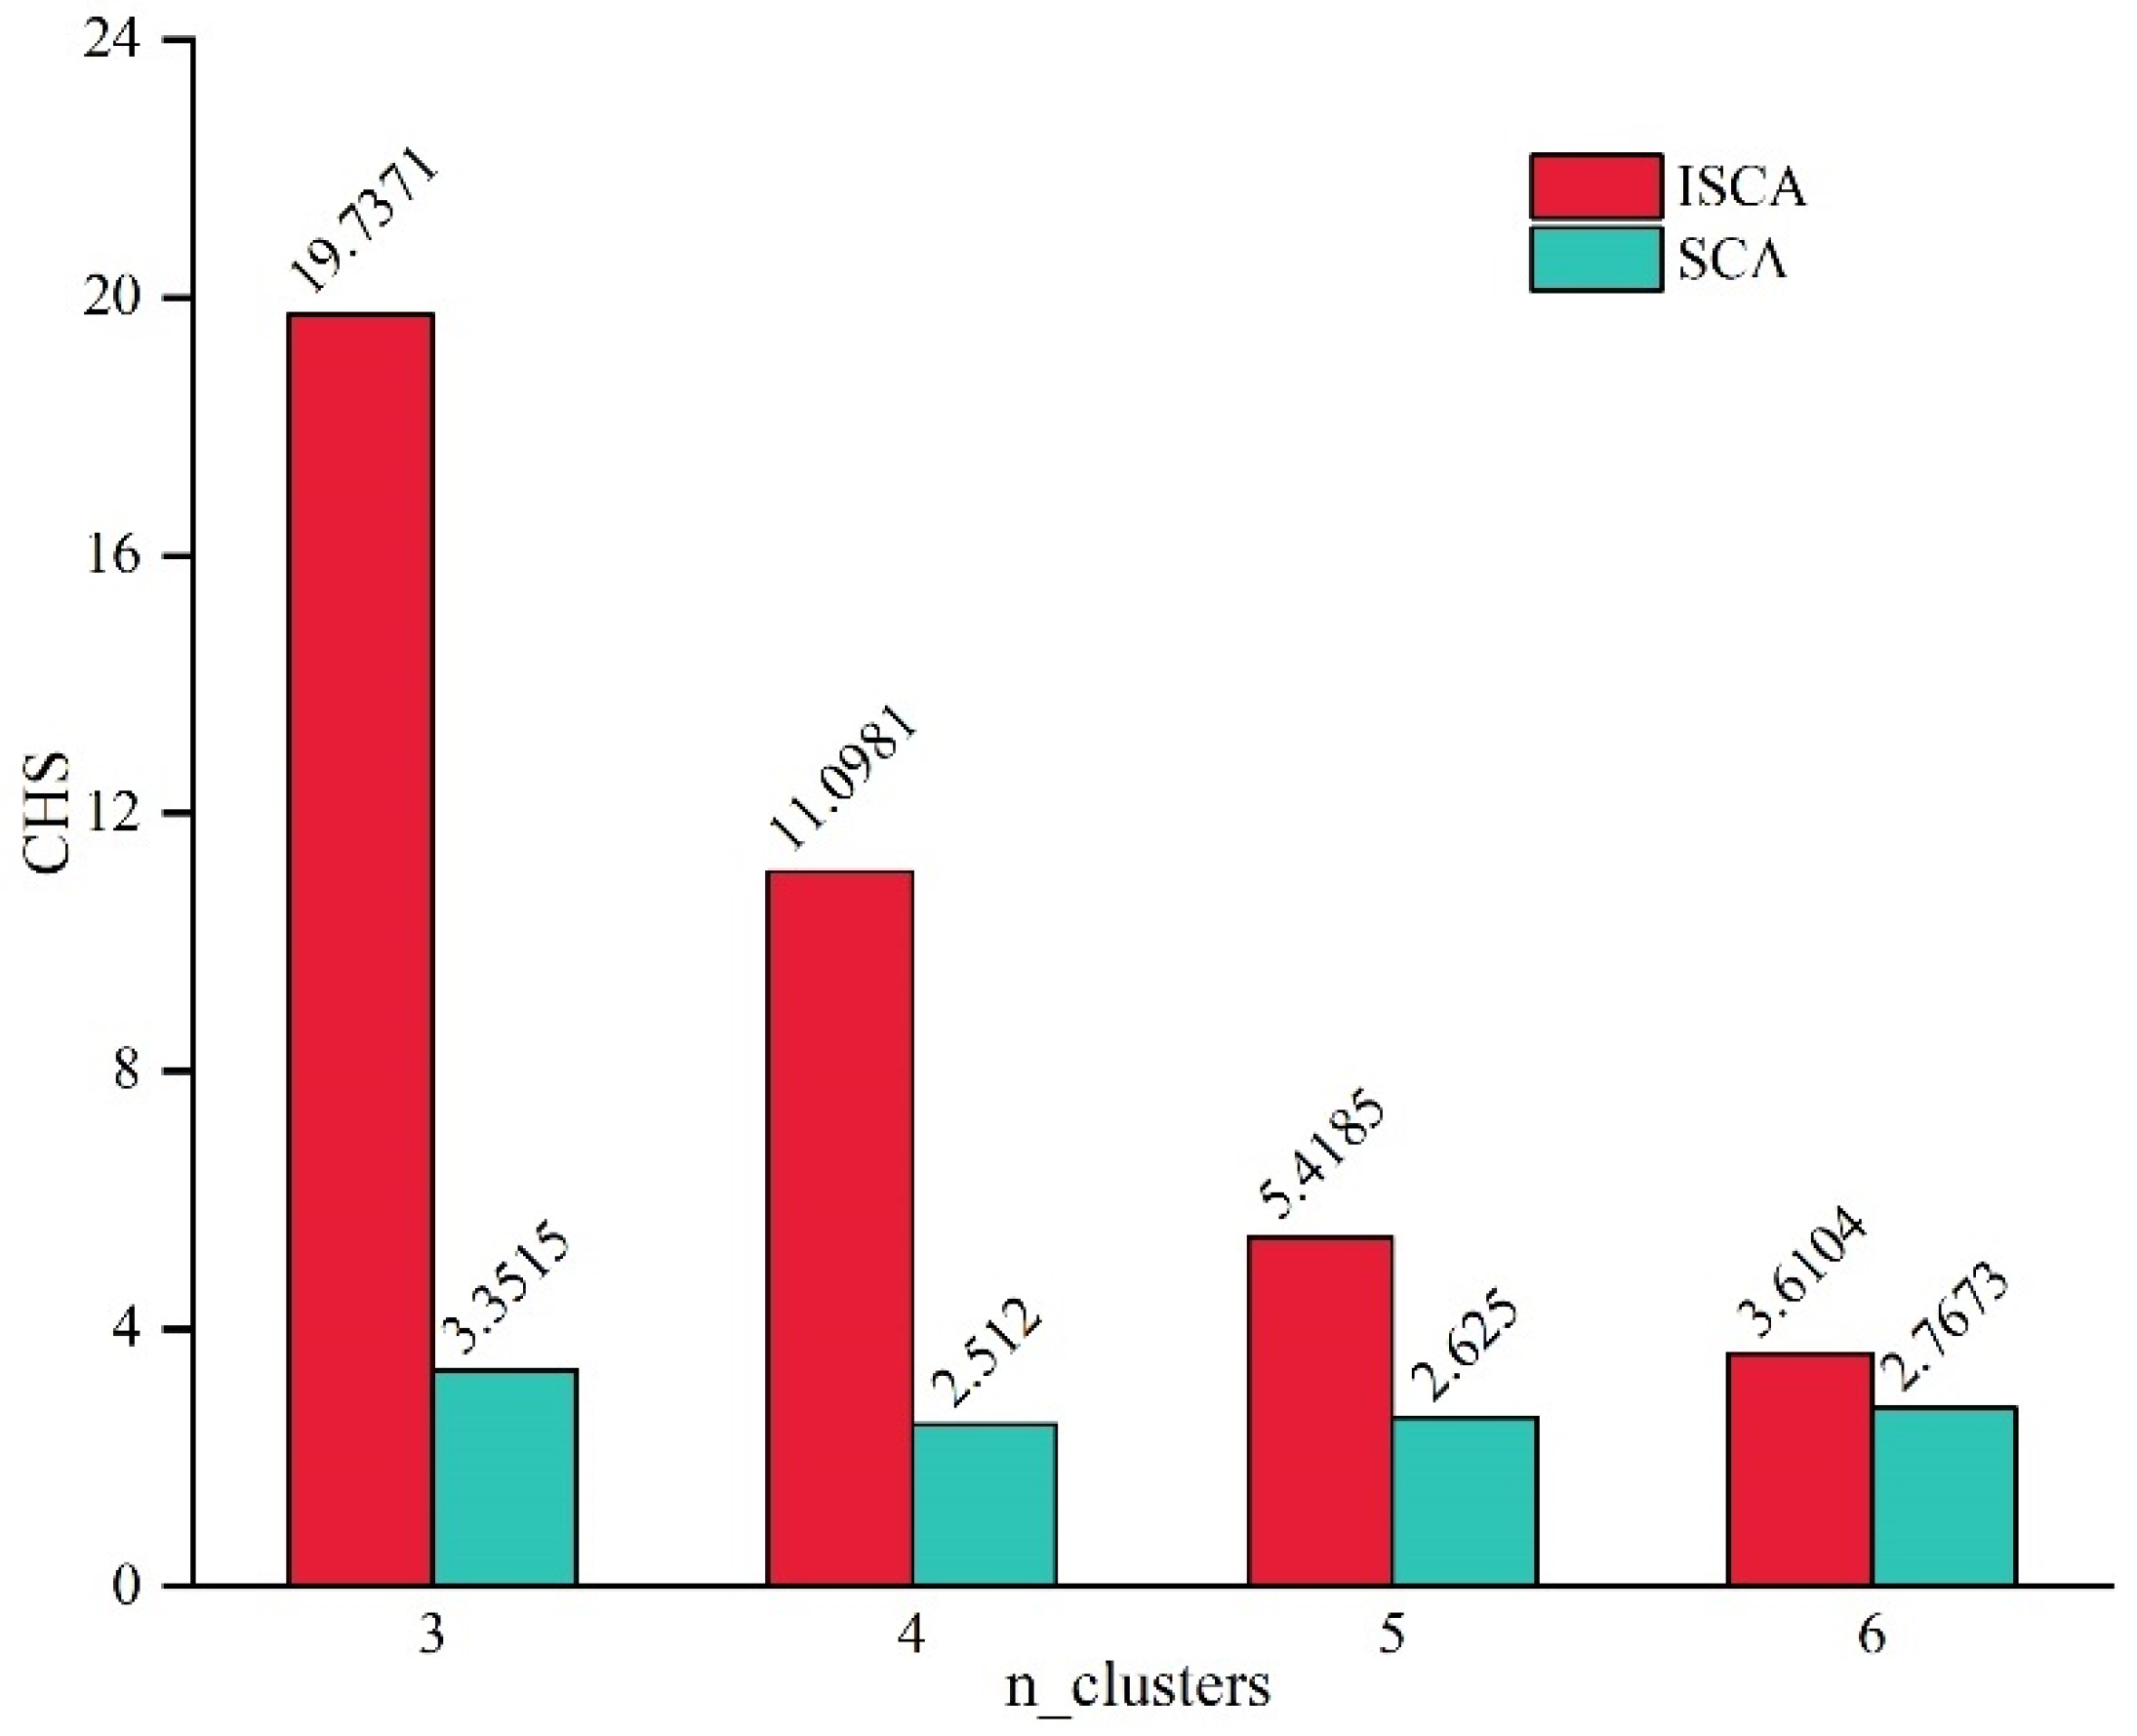
- We proposed a modular method of ACDCD based on the improved spectral cluster algorithm (ISCA) module division. A similarity matrix construction method considering the functional and structural correlation matrix of components was proposed to strengthen the connection relationship of components. The ISCA was more effective than the SCA when both the number of components and the cluster number were small.
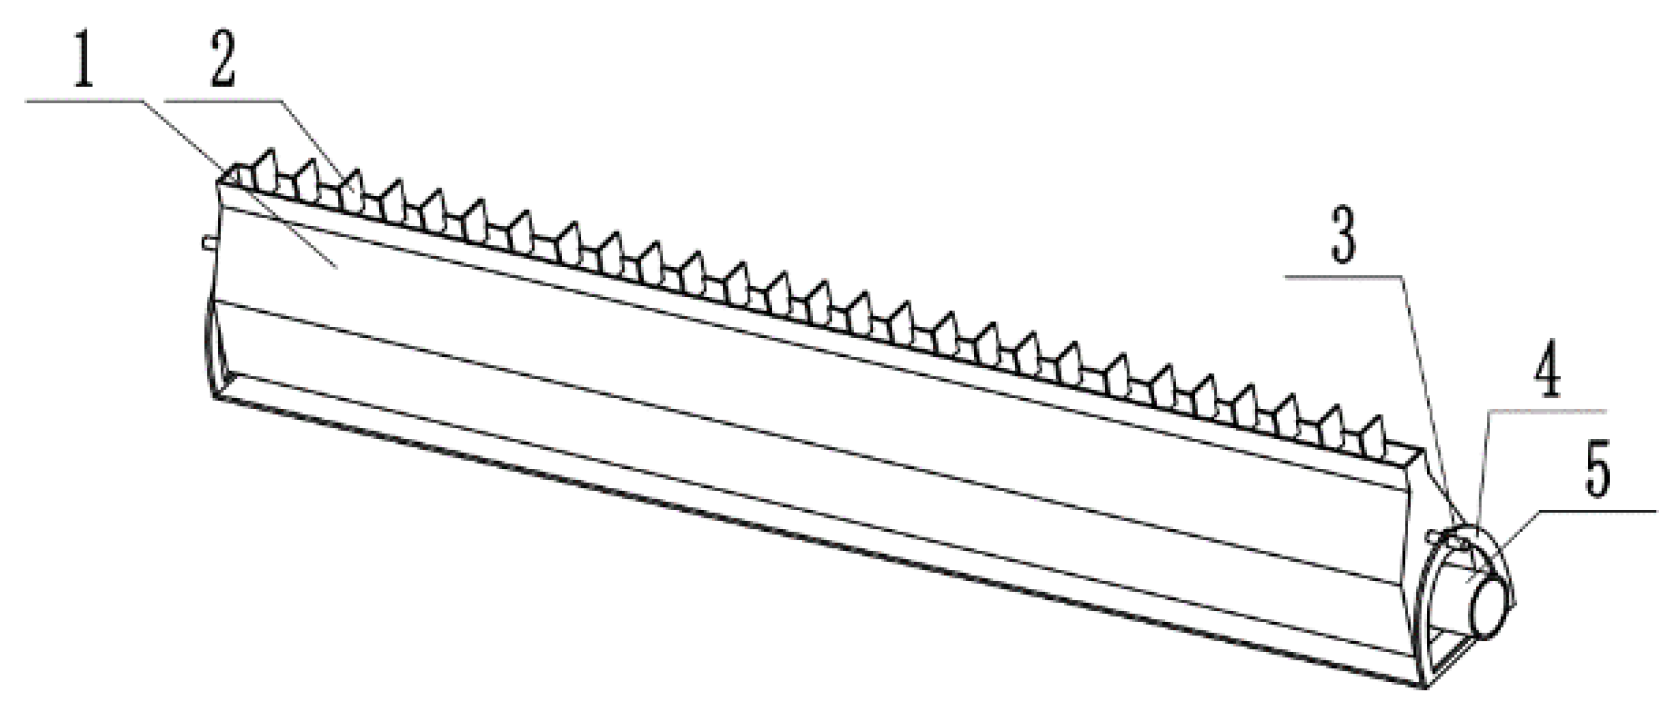
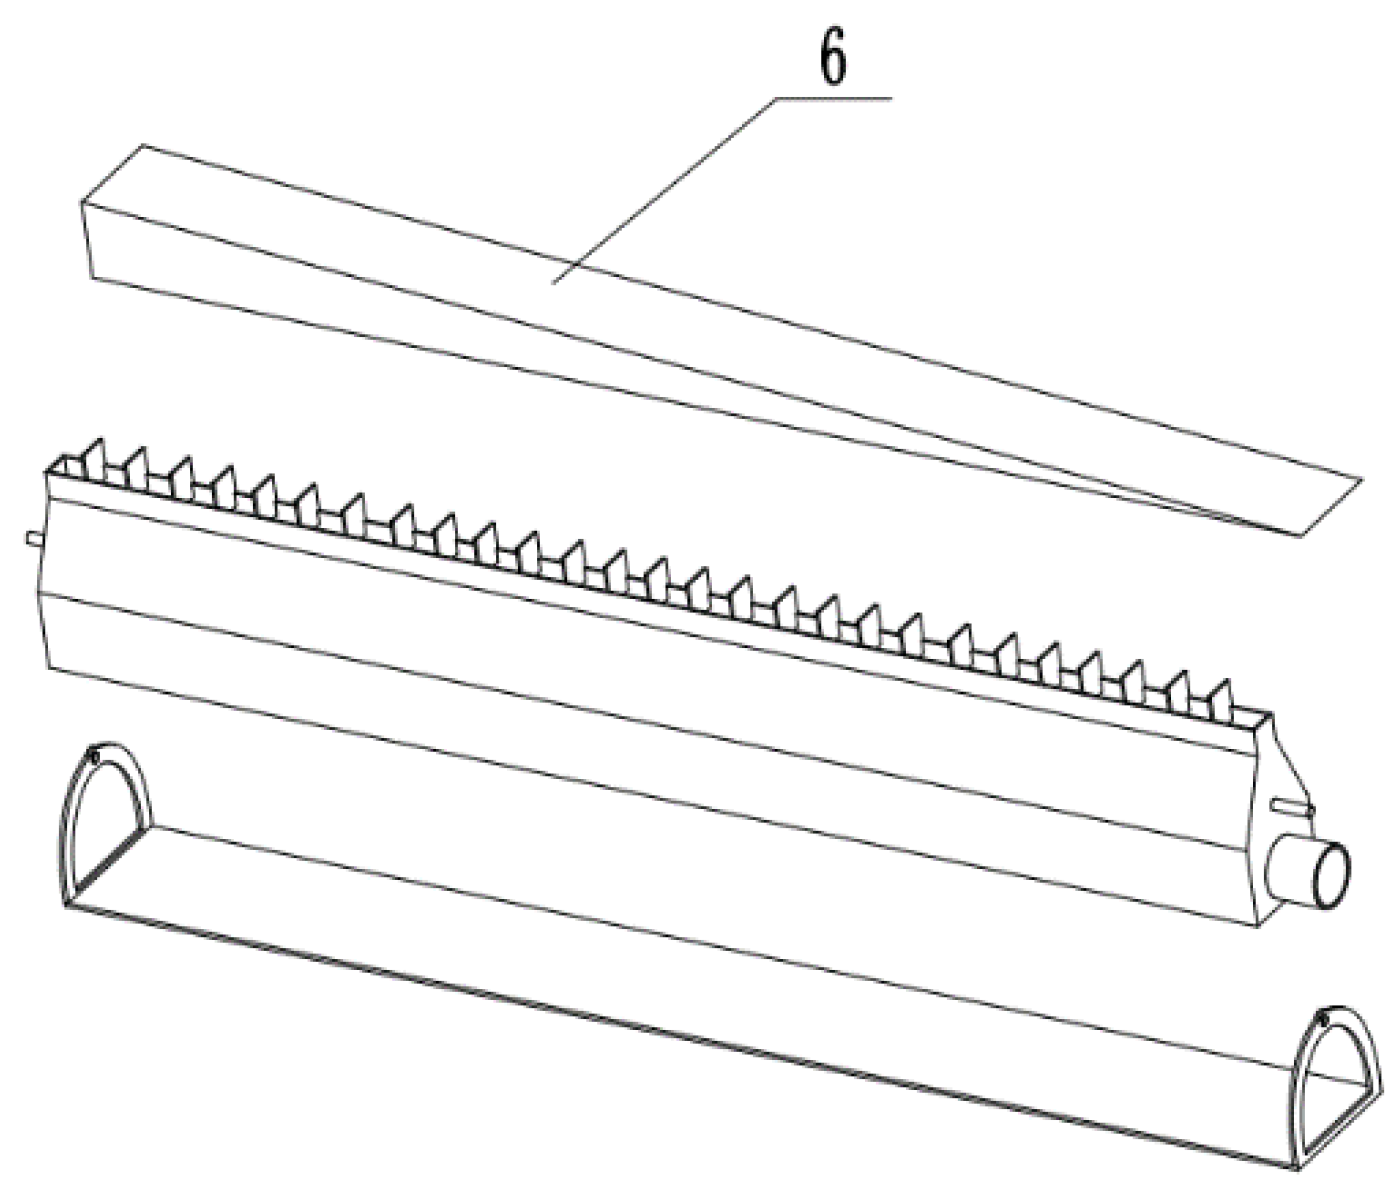
- The two existing ACDCDs and the IACDCD were modularized using the improved spectral cluster module division method. From the analysis of the optimal division, it was proved that modularizing the IC for the ACDCD was necessary. As an important component, the size of the IC varies with the size of the tunnel and the roadheader. Therefore, unifying the IC was necessary. The IACDCD unified the design of the IC to realize the purpose of easy replacement, easy maintenance and the iterative design of the IC while ensuring IC function to the greatest extent.
Author Contributions
Funding
Institutional Review Board Statement
Informed Consent Statement
Data Availability Statement
Conflicts of Interest
References
- Tang, M.J.; Zhu, M.J. 2010–2018 Occupational disease incidence and current status. PLA Prev. Med. J. 2020, 38, 37–40. [Google Scholar]
- Wang, H.; Cheng, W.M.; Sa, Z.Y.; Liu, J.; Zhang, R.; Chen, D.W. Experimental study of the effects of air volume ratios on the air curtain dust cleaning in fully mechanized working face. J. Clean. Prod. 2021, 293, 126109. [Google Scholar] [CrossRef]
- Li, Y.C.; Liu, J. Numerical simulation of dust control using air curtain based on gas-solid two-phase flow. J. Liaoning Tech. Univ. 2012, 31, 765–769. [Google Scholar]
- Wang, W.Z. Research on modularized design method of the mine trackless auxiliary transport vehicle. Coal Eng. 2019, 51, 12–15. [Google Scholar]
- Baldwin, C.Y.; Clark, K.B. Managing in an age of modularity. Harv. Bus. Rev. 1997, 75, 84–93. [Google Scholar] [PubMed]
- Monique, S.; Márcia, E.S.E.; Henrique, G.D. The role of modularity in sustainable design: A systematic review. J. Clean. Prod. 2018, 176, 196–209. [Google Scholar]
- Waguih, E.; Hoda, E. A New Engineering Design Paradigm—The Quadruple Bottom Line. Procedia CIRP 2014, 21, 18–26. [Google Scholar]
- Modrak, V.; Bednar, S.; Semanco, P. Decision-Making Approach to Selecting Optimal Platform of Service Variants. Math. Probl. Eng. 2016, 2016, 9840679. [Google Scholar] [CrossRef] [Green Version]
- Xiong, Y.X.; Du, G.; Jiao, R.J. Modular product platforming with supply chain postponement decisions by leader-follower interactive optimization. Int. J. Prod. Econ. 2018, 205, 272–286. [Google Scholar] [CrossRef]
- Li, Z.K.; Miao, L.; Song, Y. Modular combination design of mine rescue capsule based on load simulation. J. Donghua Univ. (Eng. Ed.) 2019, 36, 117–128. [Google Scholar]
- Chen, H. Design of orifice blowout-preventing and dust-suppressing device based on modularization. Coal Mine Mach. 2019, 40, 20–22. [Google Scholar]
- Wu, D.; Liu, Z.; Wang, S. Modular design of crossing boreholes drilling rig in underground coal mine. Saf. Coal Mines 2021, 52, 126–130. [Google Scholar]
- Hao, W.; Ye, N. Design of Monitoring system for underground coal mine drainage pump. Shanxi Coking Coal Sci. Technol. 2014, 38, 7–9. [Google Scholar]
- Li, X.R.; Li, Z.K.; Yang, J.R. Module division of elevator car based on the mixed modular method. Mech. Res. Appl. 2012, 25, 47–49. [Google Scholar]
- Wang, G.; Yang, L.; Zhang, Y.S. Modularized design of coal-mine paste filling station based on fuzzy theory. World J. Eng. 2018, 15, 743–750. [Google Scholar] [CrossRef]
- Li, Z.K.; Cheng, Z.H.; Feng, Y.X.; Yang, J.J. An integrated method for flexible platform modular architecture design. J. Eng. Des. 2013, 24, 25–44. [Google Scholar] [CrossRef]
- Pang, Y.W.; Xie, J.; Nie, F.P.; Li, X.L. Spectral Clustering by Joint Spectral Embedding and Spectral Rotation. IEEE Trans. Cybern. 2020, 50, 247–258. [Google Scholar] [CrossRef]
- Liu, G.; Qi, N.; Chen, J.X.; Dong, C.; Huang, Z.Q. Enhancing clustering stability in VANET: A spectral clustering-based approach. China Commun. 2020, 17, 140–151. [Google Scholar] [CrossRef]
- Sapkota, N.; Alsadoon, A.; Prasad, P.W.C.; Elchouemi, A.; Singh, A.K. Data Summarization Using Clustering and Classification: Spectral Clustering Combined with k-Means Using NFPH. In Proceedings of the 2019 International Conference on Machine Learning, Big Data, Cloud and Parallel Computing (COMITCon), Faridabad, India, 14–16 February 2019; pp. 146–151. [Google Scholar]
- Li, H.; Tao, F.; Wen, X.Y.; Wang, H.Q.; Luo, G.F. Modular design of product service system oriented to mass personalization. China Mech. Eng. 2018, 29, 2204–2214. [Google Scholar]
- Tong, S.Z. Modular Principle, Design Method and Application; China Standards Press: Beijing, China, 2000. [Google Scholar]
- Cui, G.S.; Li, X.L.; Dong, Y.S. Subspace clustering guided convex nonnegative matrix factorization. Neurocomputing 2018, 292, 38–48. [Google Scholar] [CrossRef]
- Yin, W.W. Research on Modular Design for Mechatronic Products Based on Secondary Development of SolidWorks; China University of Mining and Technology: Beijing, China, 2020. [Google Scholar]
- Li, Y.C. Study on Control of Dust at Driving Fully Mechanized Face Based on Air Curtain Technology; Liaoning Technical University: Fuxin, China, 2010. [Google Scholar]
- Liu, Z.T. Experimental Study on Dust Control of High Pressure Air Curtain in Driving Face; Liaoning Technical University: Fuxin, China, 2019. [Google Scholar]
- Pakkanen, J.; Juuti, T.; Lehtonen, T. Brownfield Process: A method for modular product family development aiming for product configuration. Des. Stud. 2016, 45, 210–241. [Google Scholar] [CrossRef] [Green Version]


| Values | Description |
|---|---|
| 8 | Cooperate to perform the same function |
| 6 | High degree of synergy |
| 4 | Moderate degree of synergy |
| 2 | Less synergy |
| 0 | No synergistic functional relationship |
| Values | Description |
|---|---|
| 8 | Very strong connectivity |
| 6 | Connection relation |
| 4 | General Connection Relationship |
| 2 | Weak connection relation |
| 0 | No connection relationship |
| P1 | P2 | P3 | P4 | P5 | P6 | P7 | P8 | |
|---|---|---|---|---|---|---|---|---|
| P1 | 0 | 4 | 0 | 0 | 0 | 0 | 0 | 0 |
| P2 | 4 | 0 | 4 | 0 | 0 | 0 | 0 | 0 |
| P3 | 0 | 4 | 0 | 4 | 0 | 0 | 0 | 0 |
| P4 | 0 | 0 | 4 | 0 | 6 | 0 | 0 | 0 |
| P5 | 0 | 0 | 0 | 6 | 0 | 0 | 6 | 0 |
| P6 | 0 | 0 | 0 | 0 | 0 | 0 | 6 | 0 |
| P7 | 0 | 0 | 0 | 0 | 6 | 6 | 0 | 6 |
| P8 | 0 | 0 | 0 | 0 | 0 | 0 | 6 | 0 |
| P1 | P2 | P3 | P4 | P5 | P6 | P7 | P8 | |
|---|---|---|---|---|---|---|---|---|
| P1 | 0 | 2 | 0 | 0 | 0 | 0 | 0 | 0 |
| P2 | 2 | 0 | 2 | 0 | 0 | 0 | 0 | 0 |
| P3 | 0 | 2 | 0 | 4 | 0 | 0 | 0 | 0 |
| P4 | 0 | 0 | 4 | 0 | 8 | 0 | 0 | 0 |
| P5 | 0 | 0 | 0 | 8 | 0 | 0 | 6 | 0 |
| P6 | 0 | 0 | 0 | 0 | 0 | 0 | 8 | 0 |
| P7 | 0 | 0 | 0 | 0 | 6 | 8 | 0 | 8 |
| P8 | 0 | 0 | 0 | 0 | 0 | 0 | 8 | 0 |
| P1 | P2 | P3 | P4 | P5 | P6 | P7 | P8 | |
|---|---|---|---|---|---|---|---|---|
| P1 | 0 | 2.6 | 0 | 0 | 0 | 0 | 0 | 0 |
| P2 | 2.6 | 0 | 2.6 | 0 | 0 | 0 | 0 | 0 |
| P3 | 0 | 2.6 | 0 | 4 | 0 | 0 | 0 | 0 |
| P4 | 0 | 0 | 4 | 0 | 7.4 | 0 | 0 | 0 |
| P5 | 0 | 0 | 0 | 7.4 | 0 | 0 | 6 | 0 |
| P6 | 0 | 0 | 0 | 0 | 0 | 0 | 7.4 | 0 |
| P7 | 0 | 0 | 0 | 0 | 6 | 7.4 | 0 | 7.4 |
| P8 | 0 | 0 | 0 | 0 | 0 | 0 | 7.4 | 0 |
Publisher’s Note: MDPI stays neutral with regard to jurisdictional claims in published maps and institutional affiliations. |
© 2022 by the authors. Licensee MDPI, Basel, Switzerland. This article is an open access article distributed under the terms and conditions of the Creative Commons Attribution (CC BY) license (https://creativecommons.org/licenses/by/4.0/).
Share and Cite
Bi, Q.-P.; Li, Y.-C.; Li, R.; Shen, C.; Lou, H.-Z.; Zhang, Y.-Y. Modularized Design of ACDCD: An Improved Spectral Clustering-Based Approach. Sustainability 2022, 14, 1651. https://doi.org/10.3390/su14031651
Bi Q-P, Li Y-C, Li R, Shen C, Lou H-Z, Zhang Y-Y. Modularized Design of ACDCD: An Improved Spectral Clustering-Based Approach. Sustainability. 2022; 14(3):1651. https://doi.org/10.3390/su14031651
Chicago/Turabian StyleBi, Qiu-Ping, Yu-Cheng Li, Rong Li, Cheng Shen, Huan-Zhi Lou, and Yuan-Yuan Zhang. 2022. "Modularized Design of ACDCD: An Improved Spectral Clustering-Based Approach" Sustainability 14, no. 3: 1651. https://doi.org/10.3390/su14031651
APA StyleBi, Q.-P., Li, Y.-C., Li, R., Shen, C., Lou, H.-Z., & Zhang, Y.-Y. (2022). Modularized Design of ACDCD: An Improved Spectral Clustering-Based Approach. Sustainability, 14(3), 1651. https://doi.org/10.3390/su14031651