Article

What Is the Socioeconomic Impact of the Tucuruí Dam on Its Surrounding Municipalities?

by
Andrés Velastegui-Montoya
1,2,*,
Aline de Lima
2 and
Viviana Herrera-Matamoros
1,3
1
Facultad de Ingeniería en Ciencias de la Tierra (FICT), ESPOL Polytechnic University, Guayaquil P.O. Box 09-01-5863, Ecuador
2
Geoscience Institute, Federal University of Pará, Belém 66075-110, Brazil
3
Department of Geoinformatics—Z_GIS, University of Salzburg, 5020 Salzburg, Austria
*
Author to whom correspondence should be addressed.
Sustainability 2022, 14(3), 1630; https://doi.org/10.3390/su14031630
Submission received: 19 December 2021 / Revised: 17 January 2022 / Accepted: 27 January 2022 / Published: 30 January 2022
(This article belongs to the Special Issue Indicators of Social Sustainability and Wellbeing)

Abstract

:
Hydroelectric energy is known for being renewable, clean, efficient and harmless in comparison to other nonrenewable energy sources. Nonetheless, the installation of a hydroelectric power complex (HC) in places, such as the Amazon, have proven to cause land cover changes, and alter local population dynamics. Issues like migration and city expansion can cause economic, social and cultural impacts locally, while the benefits are seen in other regions. The main objective of this study is to evaluate the socioeconomic indicators of the municipalities directly affected by the Tucuruí HPC. The study took into consideration three scenarios: the post-inauguration of the HC in 1988 (phase I), the beginning of construction in 2000 (phase II), and the completion of the Tucuruí HC in 2010 (phase III). Two types of multivariate analysis were conducted: the principal component analysis and cluster analysis, in order to identify the variables related to quality of life, and to be able to group the municipalities which have a similar quality of life. During the three scenarios studied, Tucuruí remained the only municipality with the highest quality of life index in the entire region, revealing the inequality present in the study area, which is something to be considered during the development of public policies.

1. Introduction

Choosing a particular type of energy to supply a given country or region depends on the need to satisfy local demand, as well as on the country´s increased level of inclusion in the international economic market [1,2,3]. In Brazil, this increased inclusion became evident with the export of primary products, such as agriculture and mineral commodities, that attracted continuous interest in the country’s natural and energy resources [1,4]. During the last 50 years, Brazil´s economic growth has been directly related to large infrastructural projects, such as hydroelectric plants, to attend to the increase in electricity consumption, associated with the expansion of urban areas, and the increment of industrial and non-industrial activities [3,5,6,7].
In the Brazilian territory, hydroelectric dams are promoted under the concept of “energy security”. As a result, the country presents the highest hydroelectric potential in South America and supplies enough energy to meet the growing regional demand [4]. The main argument used to promote hydropower as Brazil´s preferred option is based on the temporary security in the supply of energy due to the formation of a reservoir and by the great hydroelectric potential still available in the Brazilian territory [7]. In addition, hydropower is considered to be the least-expensive option in terms of monetary investment per kWh of generation [8]. Nonetheless, the social and environmental costs are tremendous, given that the construction of such large projects are nourished by existing economic inequalities at the national and international level. These large projects are a way for the national economic center to appropriate the natural and human resources of a certain area inside the national territory [7,8].
The Brazilian energy model maintains a large part of its energy matrix derived from renewable resources, and has done so since the 1970s. Nevertheless, it was not until the 1990s that, as a result of the conjunctures of the oil crisis and the stimulus of the Japanese government, the Tucuruí hydroelectric complex (THC) was built with the objective of developing the energy intensive industry of aluminum in the Brazilian Amazon [4]. This led to Brazil becoming a worldwide example in the use of renewable energies [9,10]. Hydroelectricity became the main source of energy, and its lower cost allowed for the expansion of the energy matrix to meet future demand [11,12].
Hydropower is renewable, clean, efficient and allows multiple uses of water [13,14,15]. However, the installation of this type of mega project in the Amazon usually cause changes in land cover [16]. These changes are related to alterations in population dynamics and complementary infrastructure, affecting the way of life of the local populations [17,18,19]. The construction of the THC became a milestone in the socioeconomic dynamics of the region, which caused labor mobility, forming labor markets in the border areas of natural resource extraction. It also led to the resettling of residents of the flooded area, causing significant social problems in the region [4]. Migration and the expansion of cities substantially modified the regional structure, causing economic, environmental, social and cultural impacts locally, while the energetic benefits occurred in other regions [14,20,21,22,23,24]. Therefore, to ensure equitable social, economic and environmental development, it is important to evaluate whether the municipalities located near the reservoirs of hydroelectric plants have benefited in any way from the construction of the megaproject.
The construction of a development model that works under new economic bases and in harmony with the carrying capacity of natural systems requires the agents responsible for its conception to dispose of the extensive data collection and information that are representative of the various dimensions involved in the topic. In this context, the use of multivariate analysis methods is proposed for a better exploration of socioeconomic data, in which the municipalities are characterized by a set of variables and are interpreted as an indicator of the municipal quality of life [25,26].
The analysis of socioeconomic data is highlighted as a mechanism to identify the quality of life in the seven municipalities affected by the Tucuruí reservoir. In this study we will answer the following research question: what impacts have the construction of the Tucuruí megaproject had on the quality of life of its surrounding municipalities? The study encompasses a period of 19 years of operation, expansion and completion of the Tucuruí Hydropower Complex (HC), where socioeconomic and landcover variables were analyzed using the principal component analysis (PCA) method. Given its two decades of operation, the large hydroelectric reservoir presents an ideal case to understand the possible equitable improvements in the regional living standards that are associated with its presence.

2. Materials and Methods
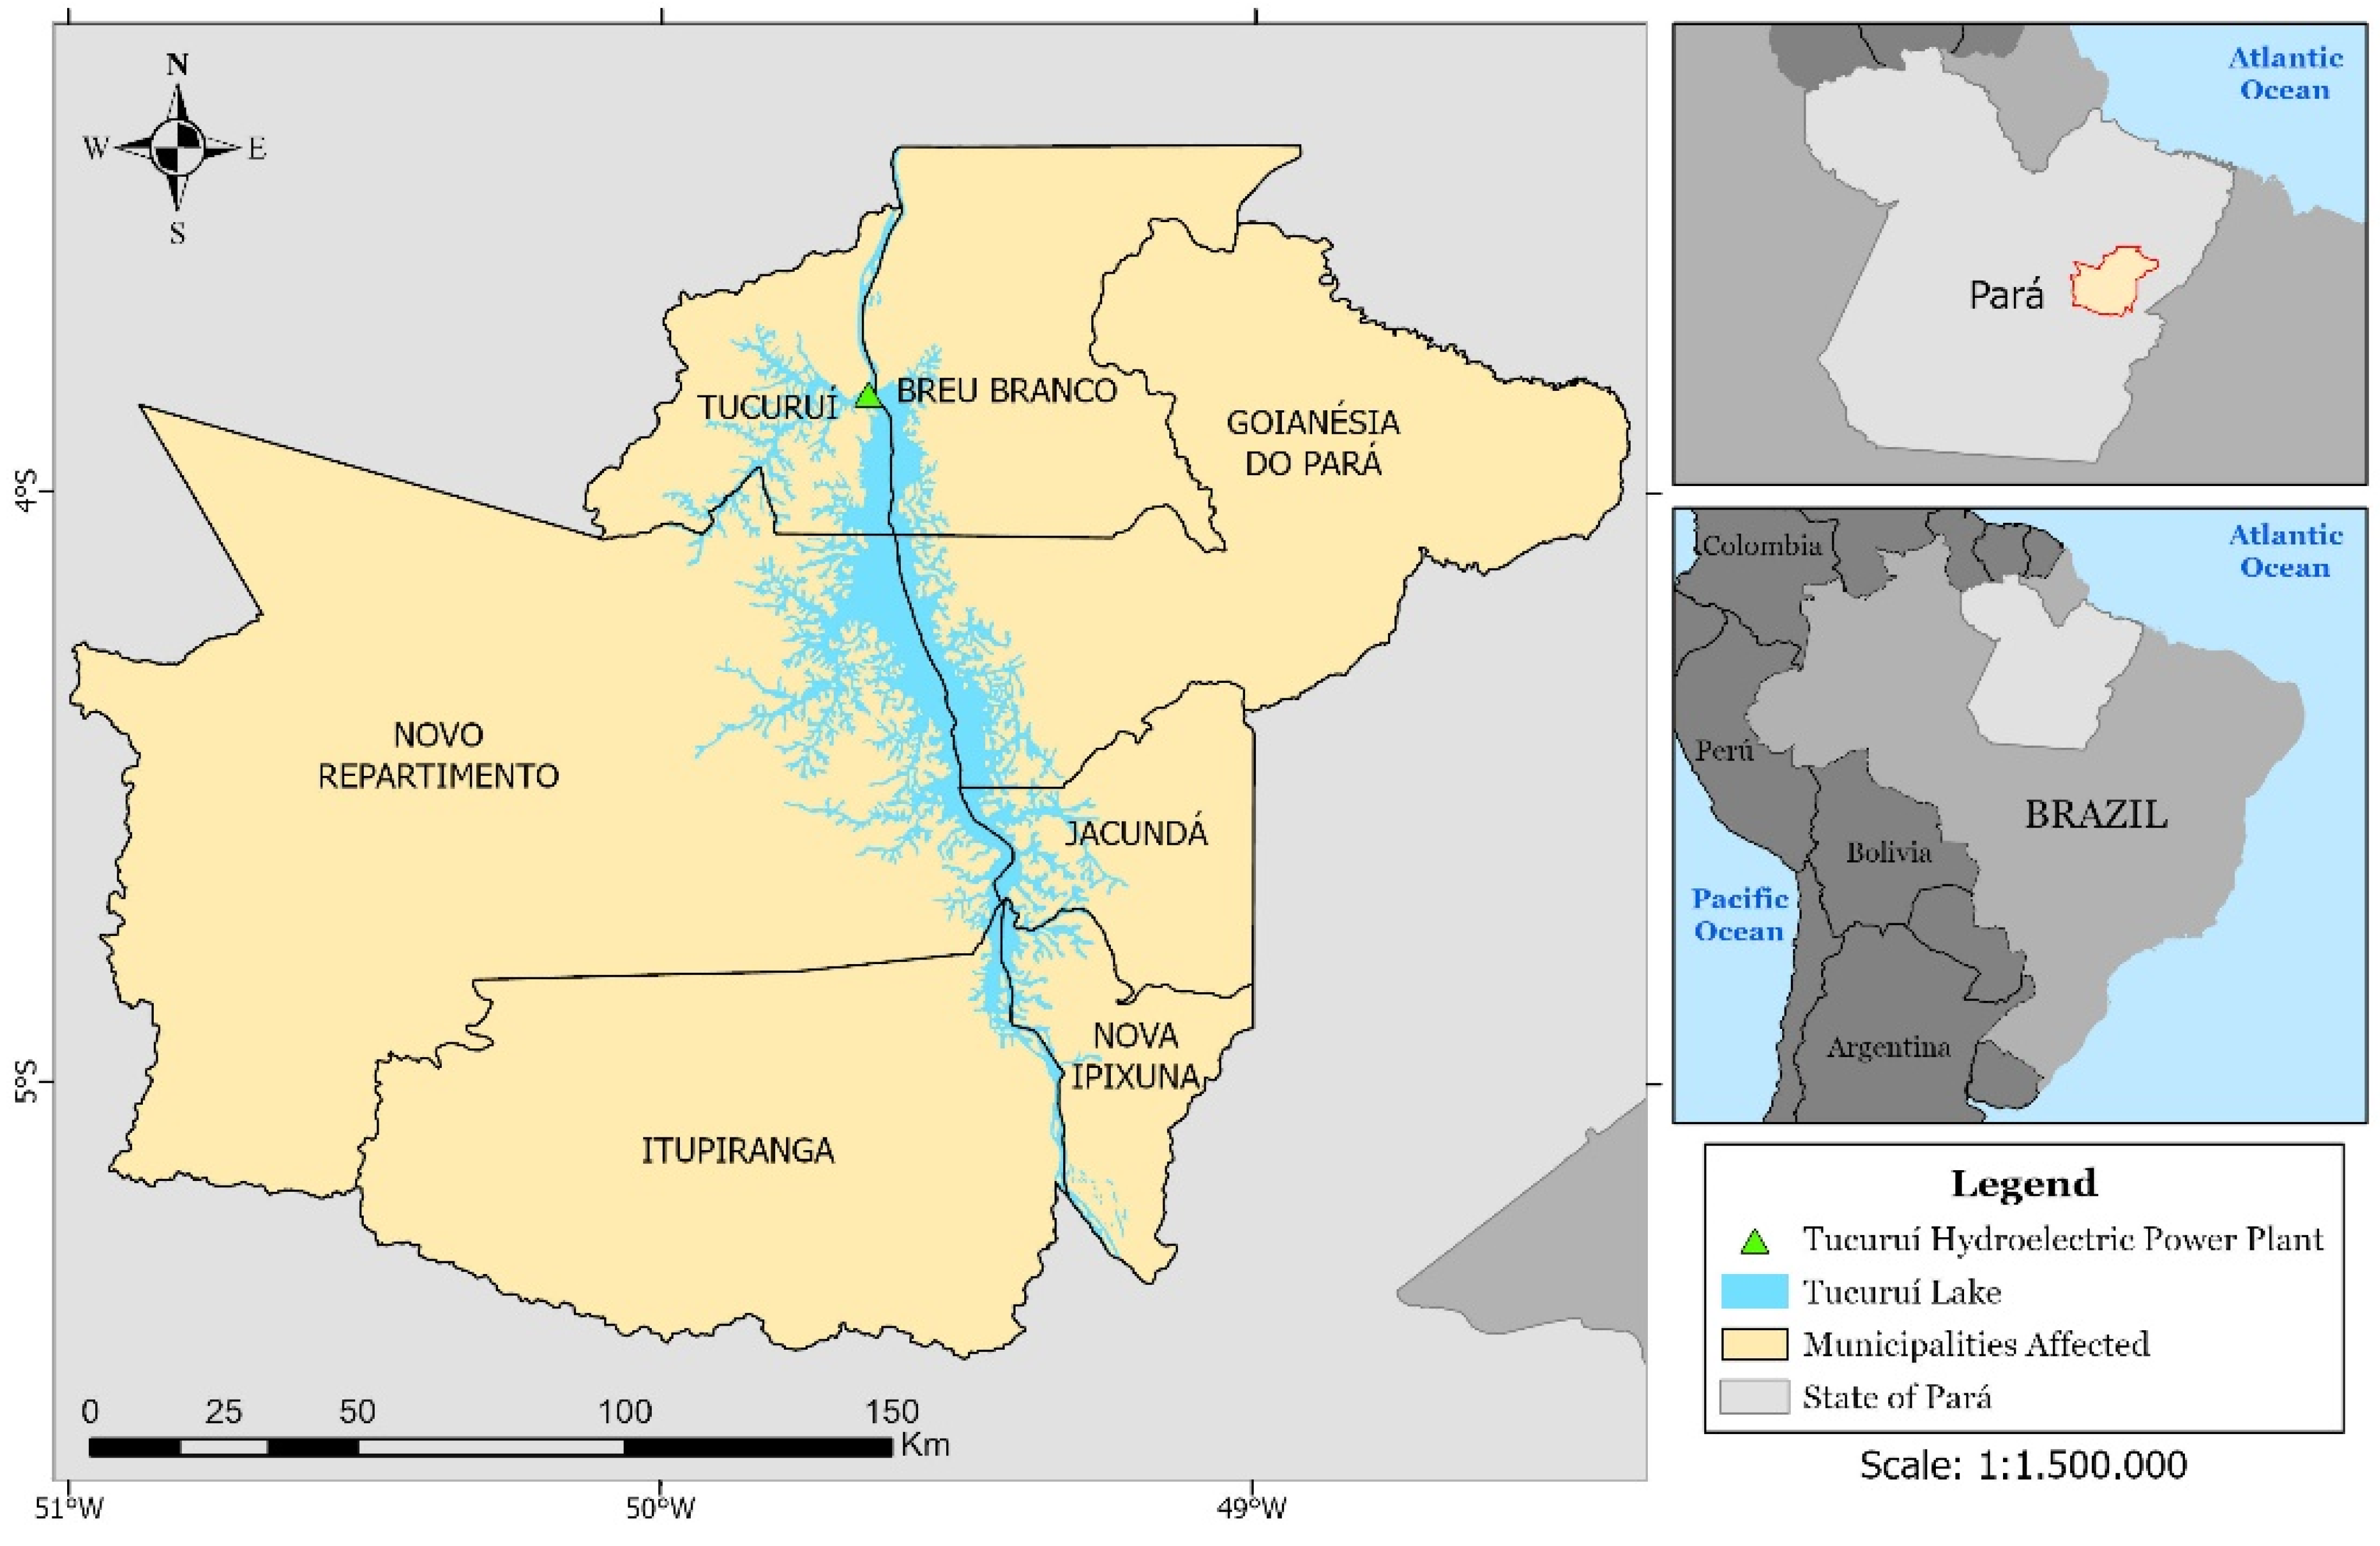
2.1. Study Area

The study area corresponds to the municipalities of Tucuruí, Novo Repartimento, Itupiranga, Breu Branco, Goianésia do Pará, Jacundá and Nova Ipixuna (03°24′–05°28′ S, 48°22′–50°59′ W), all of which are connected by the Tucuruí reservoir (Figure 1).
The Tucuruí hydroelectric plant was the first large-scale hydroelectric project in the Amazon region [12]. It was built under the military dictatorship in Brazil that lasted between 1964 and 1985. As a result, the demand and development of the hydroelectric plant followed the economic evolution of the country, while at the same time detached from the environmental protection policies that only begun to be implemented by the law n. 6938 on 3 August 1981, as established by the National Policy of Environment and the Federal Constitution of 1988 [27].
The hydroelectric plant began commercial operation on 10 November 1984, with 4490 MW (Megawatts) of installed capacity in phase I of construction [20,28]. Its implementation was an important milestone in the regional socioeconomic dynamics, due to its large scale. Nonetheless, in 1984, the Tucuruí HC obstructed the Tocantins River, located in the state of Pará, and flooded an area of 2430 km2 [20,28,29]. The resettlement program for residents of the flooded areas generated important economic, political and social problems in the region, some of them related to the gross underpayment of compensation and suspected corruption [14,20].
In 1998, phase II of construction began, corresponding to the expansion of the hydroelectric power plant, and reaching an installed capacity of 8370 MW of electrical energy by 2007 [29]. In 2010, the Tucuruí floodgates were inaugurated, which made it possible to resume navigability along the Tocantins River, thus completing the Tucuruí hydroelectric megaproject [30].

2.2. Variables

The study is based on the definition of key variables that would make it possible to quantify and qualify the effects of the HPC in its surrounding municipalities. In the Amazon, the implementation of the HPC does not necessarily involve an equal social and economic development process for the affected region [5,9,12,13,19,21]. Usually, only a few municipalities benefit from the presence of the HPC, which justifies the need to use multivariate analysis to measure the degree of intervention in these areas.
The selected variables were chosen based on the availability of official census and land cover data. Additionally, the importance of the “life quality” of the seven affected municipalities was considered based on the good factorial relationship between the variables. Some of the variables used in this study for the correlation between socioeconomic data and deforested areas have been previously used by Sousa [31]. All of the information regarding the variables came from the official censuses by the Brazilian Institute of Geography and Statistics (IBGE), corresponding to the years 1991, 2000 and 2010 [32].
The variables used in this study are: TP—total population; TFR—total fertility rate; LEAB—life expectancy at birth; HDI—Human Development Index by municipality; in education (HDIE); HDIL—HDI by longevity; HDIR—HDI by rent; GDP—gross domestic product per capita; CPEISE—complete primary education and incomplete secondary education; CSEITE—complete secondary education and incomplete tertiary education; IMR—infant mortality rate and; IMR5—infant mortality among children five years of age and under.
Variables related to the temporal landcover around the Tucuruí reservoir were also used, corresponding to the post-inauguration periods of phase I (1988), beginning of construction (phase II) (1999) and completion of the Tucuruí HC (phase III) (2010). These variables correspond to anthropized areas (ANA), urbanized areas (UZA) and the percentage of flooded areas (PFA), and they were obtained during the mapping carried out in previous studies [33,34].
Given that the variables do not have the same scales or units, it was necessary to normalize them, in order to make them dimensionless, resulting in values between 0–1. For the statistical analysis, two multivariate methods were used; the principal component analysis (PCA), and the cluster analysis.
The PCA was used to reduce the original 14 correlated variables to a set of uncorrelated variables defined as principal components. Each principal component (C) is a linear combination of the original variables. Once the two principal components (C1 and C2) have retained enough information of the original variables, every municipality represented by the 14 variables can be represented by the two new components (C1 and C2) [26,35]. The PCA allowed the discrimination of variables during the process of groups formation, as indicated by the variable´s correlation coefficient in the lineal combination of the principal component. The higher the absolute value of the correlation coefficient, the higher the weight of the variable in the lineal combination. On the other hand, the conglomerate analysis allowed the separation of the municipalities in clusters, based on the mean Euclidian distance between them [36].
The processing was carried out using the SPSS software (Statistical Package for the Social Sciences) Statistics, created by IBM (International Business Machines) to analyze and understand large amounts of data, using advanced statistical procedures [37].

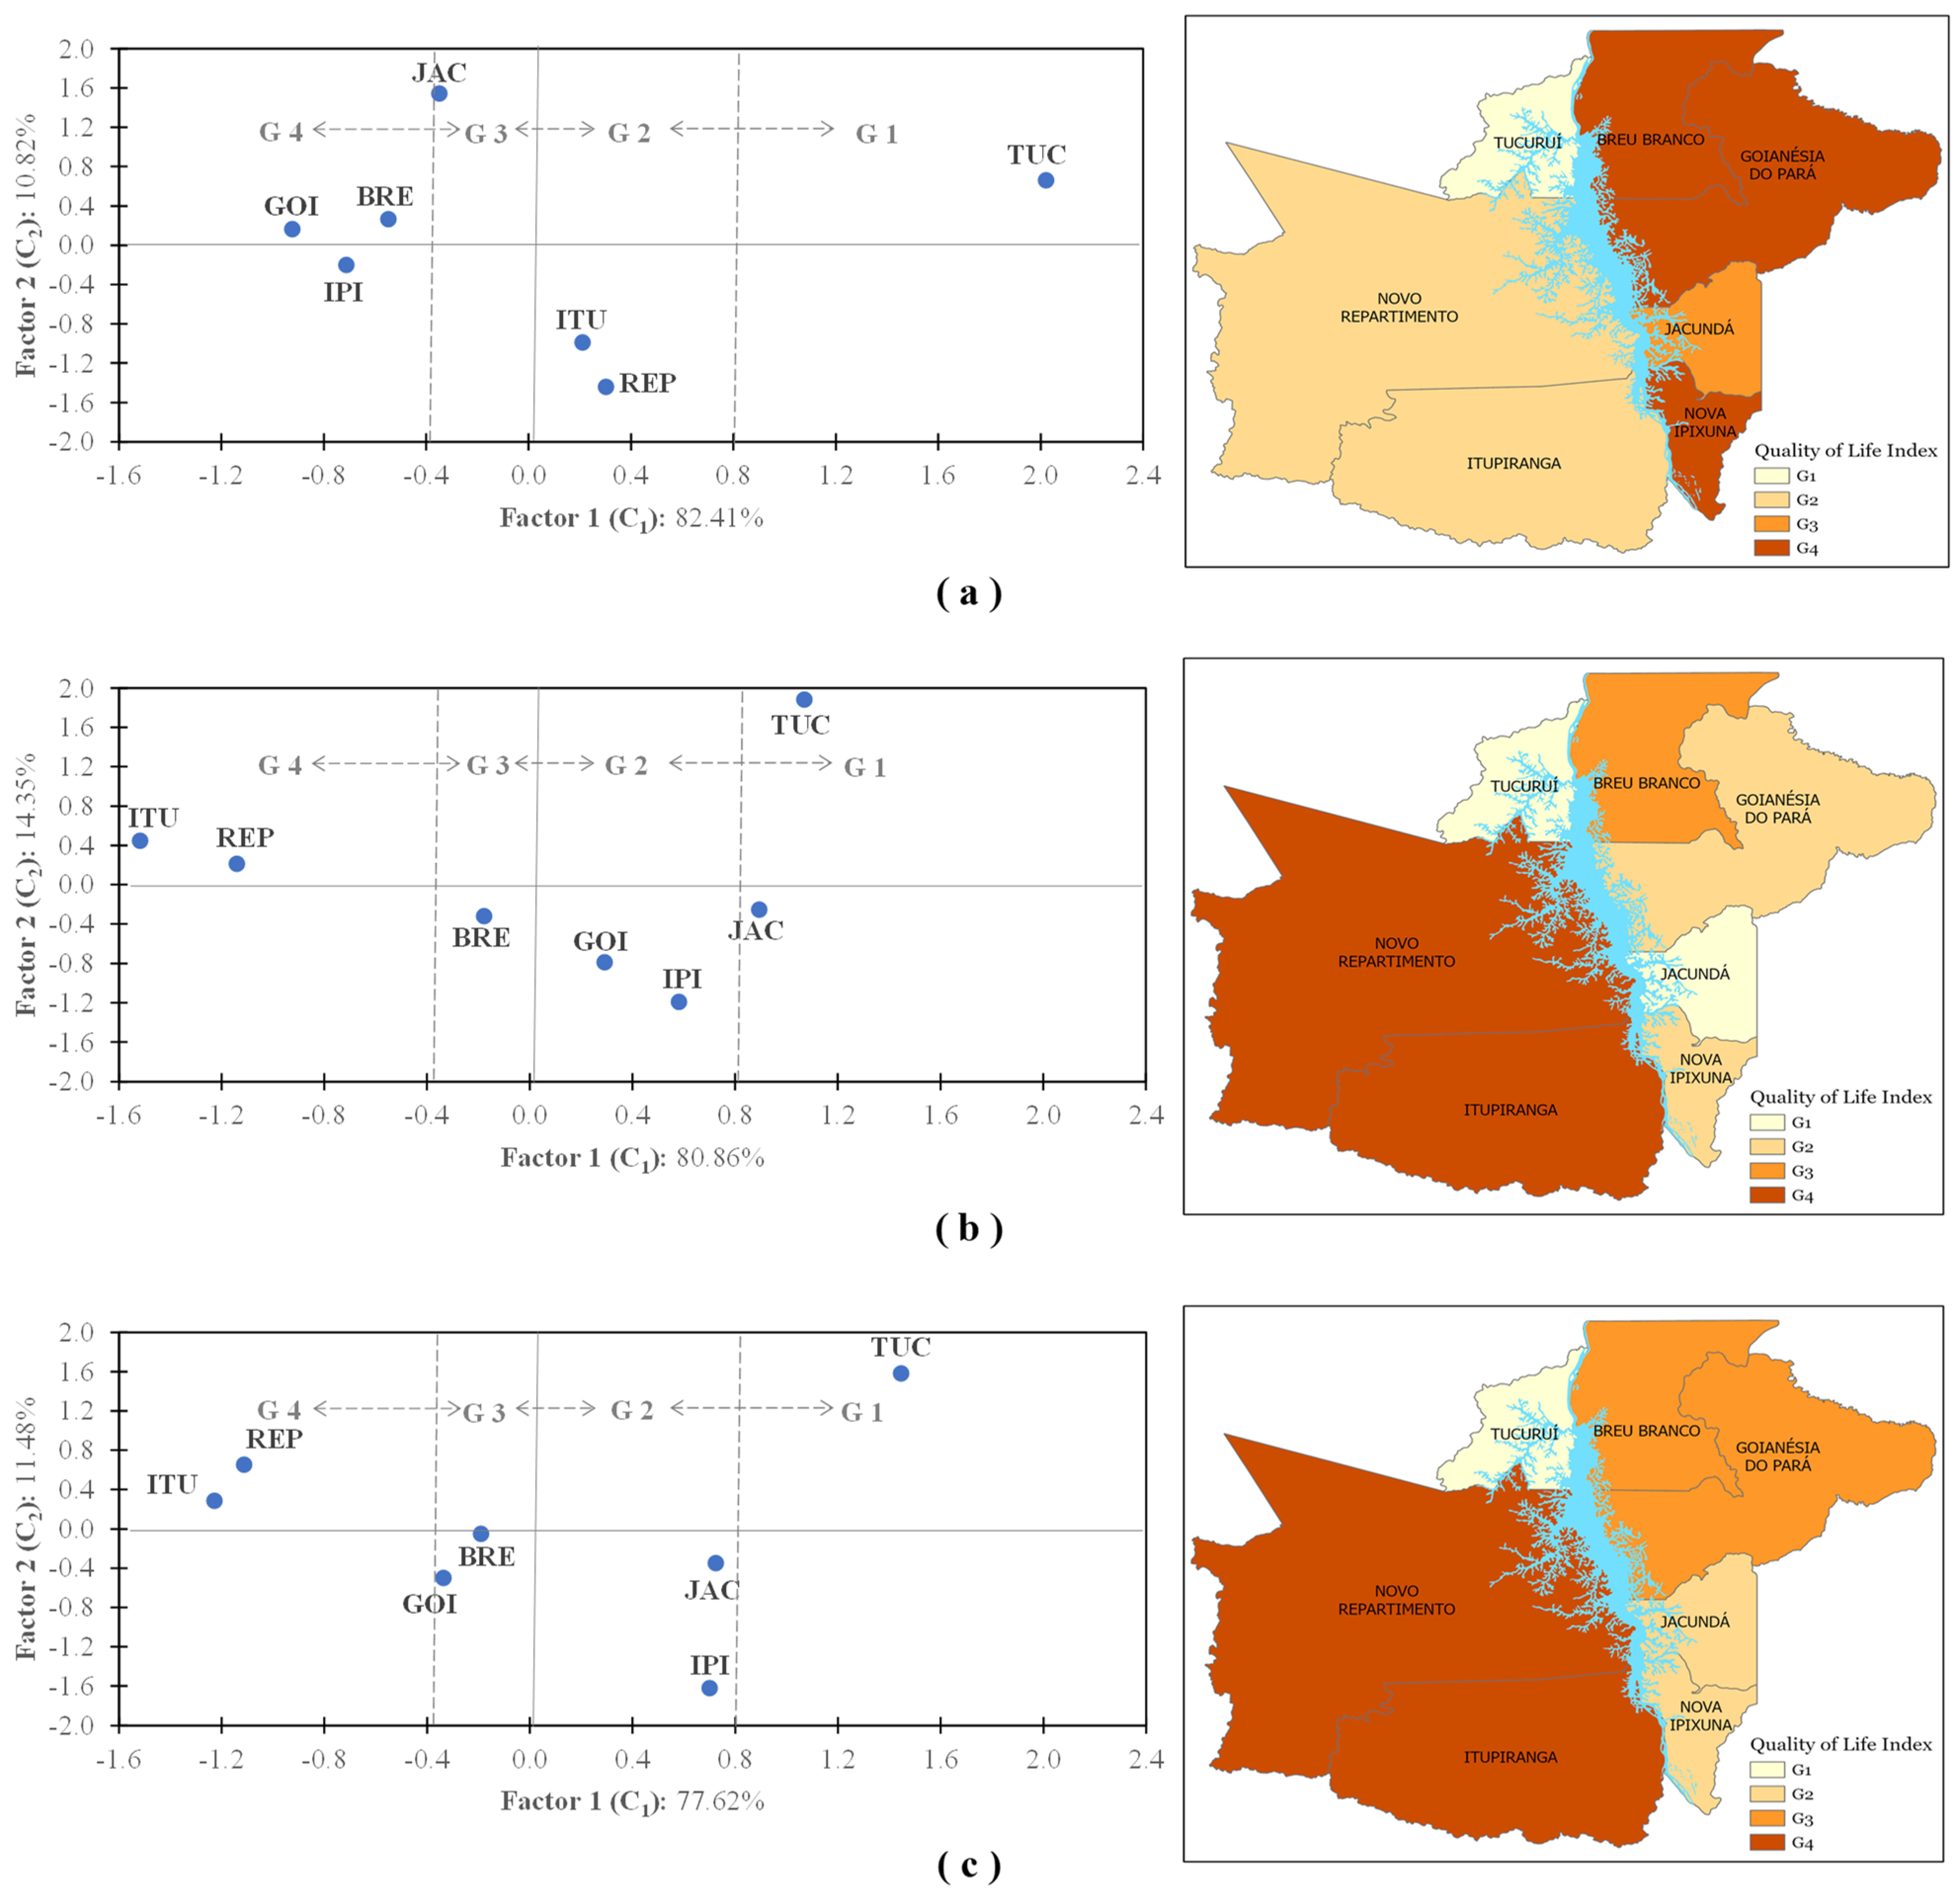
3. Results and Discussion

The results of the principal component analysis for the post-inauguration scenarios of phase I, beginning of construction (phase II), and completion of the Tucuruí HC (phase III) are shown in Table 1. This includes the correlation coefficients between the original variables and the principal components (C1 and C2), as well as the order of the variables according to their discriminatory capacity.
For the 1991 scenario, the most discriminatory variables were HDIE, CPEISE, CSEITE, UZA, LEAB and HDIL, while the least discriminatory variables were ANA, TP, TFR, HDIR, and GDP. In the 2000 scenario, the variables that were more discriminatory were slightly different, these being HDIE, CPEISE, LEAB, HDIL, and IMR, while the least discriminatory variables were TP, UZA, ANA, HDIR, and GDP. Finally, for the 2010 scenario, the most discriminatory variables were CSEITE, GDP, PFA, HDIE and CPEISE, while the least discriminatory variables were TFR, TP, ANA, UZA and LEAB.
The variables a priori could be separated in two classes: the variables for which high values indicate a higher quality of life, denominated as class 1 variables (UZA, LEAB, CPEISE, HDIE, HDIL, HDIR, CSEITE, PFA, TP y GDP), and the rest of variables which high values indicate a lower living standard, denominated as class 2 (IMR5, IMR, TFR, ANA).
Table 1 shows how for all the scenarios (1991, 2000 and 2010), the first component (C1) presented a positive correlation with the variables of class 1, and had a negative correlation with the variables of class 2. As a result, the better the indicators of the municipality, the higher their respective C1 value will be. In addition, the first component retained 78% of the information contained in the original 14 variable set for the year 1991, 81% for the year 2000, and 71% for the year 2010, and thus can be considered as a “life quality index” for the municipalities.
The second component (C2) during the 1991 scenario highlighted the variables ANA, TP and UZA as the variables with the highest positive correlation. On the other hand, the variables that presented the highest negative correlation were TFR, HDIR, GDP and HDIL. This indicates that the second component is associated with higher population rates, and lower TFR, HDIR, GDP and HDIL rates. During the year 2000, the second component (C2) highlighted the variables TF, UZA, CSEITE and ANA as the variables with the highest positive correlation, and the variables HDIR, GDP, HDIL and LEAB with the highest negative correlation, effectively indicating a positive association to population size (TF, UZA, ANA) and secondary education rates (CSEITE), and a negative association to human development index (HDIR, HDIL, GDP and LEAB). Nonetheless, given that the second component only retained 13%, 12% and 15% of the information from the original variables, its practical meaning would not receive as much importance as the first component, which will be directly connected to “life quality”.
In terms of values by municipality (Table 2), in the 1991 scenario, the lowest values of C1 corresponded to the municipalities Goianésia do Pará, Nova Ipixuna, Breu Branco and Jacundá, classifying them as the municipalities with the lowest standard of living. On the other hand, the Tucuruí municipality presents the highest value, indicating the best standard of living in the region.
For the year 2000, the lowest values of C1 highlighted the municipalities of Itupiranga and Novo Repartimiento with the highest negative values, therefore, classifying them as the municipalities with the worst standard of living. This is a drastic change if we consider that the same municipalities had positive values in the year 1991. The municipalities Jacundá, Goianésia do Pará and Nova Ipixuna experienced the opposite, a drastic change from negative values to positive, indicating improvements in their quality of life. The Tucuruí municipality remains the municipality with the best standard of living of all during the tree time periods. The changes between the year 2000 and 2010 were minor, considering that mostly all of the municipalities maintained a similar value in both years, with the exception of the municipality Goianésia do Pará, which experienced a drop to negative values once again.
In terms of the second component (C2), in the year 1991, the municipalities with the lowest values were Novo Repartimento, Itupiranga and Nova Ipixuna. As mentioned before, the C2 component is related to the ANA and TP variables. This is evident when realizing that between 1988 and 2000, around 1438 municipalities were created, and 1145 of them had less than ten thousand inhabitants [38]. On the other hand, the municipalities that presented high positive values of C2 were Tucuruí and Jacundá, with Tucuruí being the oldest municipality of the region.
In the 2000 scenario, the lowest C2 values were related to the municipalities Nova Ipixuna, Goianésia do Pará and Breu Branco. Tucuruí maintained its position as the most populated municipality, with a population of 60,918 [39] and thus remained number 1 with the highest C2 value. Finally, for the 2010 scenario, the lowest C2 values appeared in Nova Ipixuna, Goianésia do Pará and Jacundá. Tucuruí remained in the first place, with the highest positive value, followed by Novo Repartimento.
The ordered pairs graph based on the principal component analysis of each factor, inferred four categories with two clusters of municipalities for each of the scenarios studied (Figure 2).
It should be noted that for the years 1991, 2000 and 2010, the municipality of Tucuruí stands out alone, maintaining the highest values (G1), with a slightly lower index in C1 for the years 2000 and 2010, compared to the scenario of 1999. This coincides with the results obtained from first principal components (C1) (Table 2).
The upper intermediate category (G2), in the first scenario of 1991, is represented by the grouping of the municipalities Novo Repartimento (REP) and Itupiranga (ITU) (Figure 2a), forming a homogeneous set, in relation to factor C1, with a mean of 0.255 and standard deviation of 0.045. However, for the years 2000 and 2010, these municipalities fell into the category of worst quality of life index (G4) (Figure 2b,c). In the year 2000, the C1 factor presented a mean of −1329, with a standard deviation of 0.19, whereas, for the year 2010, the mean value of the C1 factor was −1171, with a standard deviation of 0.060. Consequently, this data is consistent with the order of the municipalities according to the quality of life shown in Table 2, with the exception of 2010, in which the municipalities of Novo Repartimento and Itupiranga occupy the third and fifth place, respectively.
In the low intermediate category (G3) of 1991, the municipality of Jacundá (JAC) stood out in isolation (Figure 2a). For the years 2000 and 2010, Jacundá presented a relevant improvement in its life quality index (Figure 2b,c), within the G1 and G2 categories, respectively. These categories agree with the municipal order, according to life quality (Table 2), in which Jacundá is consolidated as the municipality with the second-best life quality index in the region, during the years 2000 and 2010.
The last category (G4), illustrates how during the 1991 scenario, the municipalities Breu Branco, Nova Ipixuna and Goianésia do Pará are characterized as a heterogeneous group with the worst indicators for quality of life. The group had a factor 1 mean (C1) equal to −0.728 and a standard deviation of 0.15 (Figure 2a). Nonetheless, during the years 2000 and 2010, these municipalities reflected improvements in different proportions (Figure 2b,c). In 2000, the municipality of Breu Branco moved to the G3 category, and the municipalities of Goianésia do Pará and Nova Ipixuna were placed in the G2 category, with a mean value of C3 equal to 0.23 and standard deviation of 0.313. For the 2010 scenario, the municipalities of Breu Branco and Nova Ipixuna remained in the same categories as in 2000, while the municipality of Goianésia do Pará fell to the G3 category, with a mean value of C5 equal to 0.056 and standard deviation of 0.459. It is important to highlight that the order displayed in Figure 2 coincides with the hierarchies of the municipalities according to the life quality index of Table 2, with the exception of the 2010 scenario, where the municipalities of Goianésia do Pará, Nova Ipixuna and Breu Branco are located in the fourth, sixth and seventh position, respectively.
By 1991, the municipalities of Novo Repartimento, Goianésia do Pará and Itupiranga contained the largest extensions of anthropized areas [34]. However, out of the three municipalities, Novo Repartimento and Itupiranga experienced the best life quality (cluster G2), while Goianésia do Pará had the worst life quality in the entire region (cluster G4) (Figure 2a). In 2000 and 2010, the municipalities of Novo Repartimento, Itupiranga and Goianésia do Pará continued to have the largest anthropized areas [33]. Itupiranga and Novo Repartimento continued in the G4 cluster, without any improvement in their life quality indicators, while Goianésia do Pará showed an improvement in theirs (Figure 2b,c), by being located in the G2 and G3 clusters, for the years 2000 and 2010, respectively.
The municipality of Tucuruí was the only one that presented the highest values in all its original variables associated with the main component C1, which reveals a high life quality pattern. At the same time, it has the lowest values in all its original variables associated with the C2 component, which accentuates Tucuruí as the municipality with the best life quality in the study region. This confirms an inequality in the socioeconomic indexes of the region. It is important to consider this peculiarity in the planning of future megaprojects of similar dimensions, as well as in the development of public policies in favor of the affected communities and/or municipalities. It is important to allow the effective administration of the resources obtained from the financial compensation received by each impacted municipality, to promote the socio-economic and environmental development of the region.
Law n° 7990/1989 defines the financial compensation that electrical service concessionaires in Brazil must pay to the states and municipalities in whose territory there are facilities located for the production of electrical energy, or areas occupied by reservoirs. Therefore, the financial compensation is proportional to the flooded areas [40]. The resources resulting from the financial compensation must be applied in accordance with local interests and needs [41]. Therefore, it is expected that the resources distributed to the municipalities will be invested to minimize the negative impacts of hydroelectric projects, in such a way that allows for adjusting the social and economic local structure to the new conditions imposed by the construction of the hydroelectric power station, with the intention to promote the social and economic development of all municipalities.
For the Amazon region, the implementation of large projects and the improvement in the quality of life are factors that can be positively correlated, but the lack of integration of public policies in general have not made it a reality. Territorial ordering is linked to deforestation, which expands towards conservation areas, by virtue of biodiversity or water potential [4,7]. The result is the consumption of these goods without a vision for the future. In Brazil, the clearest example is the so called “water crisis” that affects the southern and southeastern states of the country. Their main hydrographic basins have been transformed into reservoirs, responsible for supplying several municipalities and state capitals, in addition to the main industrial and agricultural pole of the country [8]. As a result, actions in these regions in the south and southeast suffered the consequences of the climatic extremes, with the reduction of rainfall and the difficulty of maintaining the energy supply [27]. The Tucuruí HPP and the states of the northern region (Brazilian Amazon) suffer from these effects due to the fact that the hydroelectric plant acquires a more important role in the national energy distribution network, and local consumers begin to pay more for electric consumption.
According to Rocha [42], the Tucuruí hydroelectric project began from exogenous development models and became an enclave of construction in the region. This transformed the structure and dynamics of the subregional system, modifying the space from an economic and cultural point of view, and reorganizing the local territory.
All the conjuncture referred to in this study should be considered in evaluation studies of the variation of the socioeconomic indicators in regions affected by this type of megaproject. In the same way, it is necessary to consider all of the municipalities affected by the hydroelectric dams, and not only focus on the main or most important municipality, as this does not correspond to the regional reality. Other studies have evaluated the level of sustainability of ten hydroelectric energy producing municipalities within the State of Pará using the sustainability barometer. They only considered the municipalities that exclusively house the hydraulic turbine, and of these, Tucuruí presented the best level of sustainability among the ten municipalities [5]. Therefore, it can be interpreted that the Tucuruí HC contributed to achieving this level of sustainability. However, this result is not a true reflection of the development of the entire affected region. It is necessary to include all of the municipalities affected by each megaproject in order to demonstrate the reality of the “development” produced by hydroelectric plants in the affected regions.

4. Conclusions

The results classified four categories of municipalities with different life quality indexes for the 1991, 2000 and 2010 scenarios. Goianésia do Pará, Nova Ipixuna and Breu Branco are in the category of municipalities with the worst indicators of life quality for the first scenario, and Itupiranga and Novo Repartimento remained in the same category, for the years 2000 and 2010. The municipalities of Jacundá, Itupiranga and Novo Repartimento were categorized with a regular life quality index in 1991. On the contrary, for the scenario 2000 the municipalities of Breu Branco, Goianésia do Pará and Nova Ipixuna were categorized with a regular life quality, and by 2010 the municipality of Jacundá was included in this category. In addition, the municipalities of Novo Repartimento, Goianésia do Pará and Itupiranga have the largest extensions of anthropogenic areas in the region, without showing significant improvements in their living standards for the years 1991, 2000 and 2010. The municipality of Tucuruí always stood out in isolation, categorizing itself as the municipality with the best life quality index.
Therefore, the conformation of the groups in this study concludes that even though, according to the law n° 7990/1989, all of these municipalities have received compensation to promote their social and economic development and minimize the impact of the hydropower complex in the area, only one municipality has managed to consistently use these resources to benefit its population. It is clear that the finding of such differences requires the joint consideration of all of the municipalities affected by this type of megaproject when developing public policies for the equitable benefit of the entire impacted region, including future impact evaluation studies produced by these undertakings. Nonetheless, it is important to clarify that the differences in life quality observed in this study are based uniquely on the variables included and expanding the number of variables can create differences in the results. In addition, even though our main focus was the Tucuruí dam and its effect on life quality, the differences in life quality can also be connected to other reasons that were not covered in the present study.

Author Contributions

Conceptualization, A.V.-M.; Formal analysis, A.V.-M. and A.d.L.; Investigation, A.V.-M.; Methodology, A.V.-M. and A.d.L.; Project administration, A.V.-M.; Supervision, A.V.-M. and A.d.L.; Writing—original draft, A.V.-M.; Writing—review & editing, A.V.-M., A.d.L. and V.H.-M. All authors have read and agreed to the published version of the manuscript.

Funding

The APC was funded by ESPOL Polytechnic University.

Institutional Review Board Statement

Not applicable.

Informed Consent Statement

Not applicable.

Data Availability Statement

The data presented in this study are available on request from the corresponding author.

Acknowledgments

This study was supported by the research project of the ESPOL University (Escuela Superior Politécnica del Litoral): “Evaluación del proceso de cobertura de la Tierra alrededor de centrales hidroeléctricas en la Amazonía brasileña: la evolución de la central hidroeléctrica de Tucuruí” (Evaluation of the land cover process around hydroelectric plants in the Brazilian Amazon: the evolution of the Tucuruí hydroelectric plant) with code no. FICT-07-2018.

Conflicts of Interest

The authors declare no conflict of interest. The funders had no role in the design of the study; in the collection, analyses, or interpretation of data; in the writing of the manuscript, or in the decision to publish the results.

References

  1. Dunning-Davies, J. Energy Sources and the World’s Energy Requirements. In Concise Thermodynamics; Dunning-Davies, J., Ed.; Woodhead Publishing: Sawston, UK, 2011; Volume 2, pp. 85–93. ISBN 978-1-904275-31-2. [Google Scholar]
  2. Daglish, T.; de Bragança, G.G.F.; Owen, S.; Romano, T. Pricing Effects of the Electricity Market Reform in Brazil. Energy Econ. 2021, 97, 105197. [Google Scholar] [CrossRef]
  3. De Jong, P.; Sánchez, A.S.; Esquerre, K.; Kalid, R.A.; Torres, E.A. Solar and Wind Energy Production in Relation to the Electricity Load Curve and Hydroelectricity in the Northeast Region of Brazil. Renew. Sustain. Energy Rev. 2013, 23, 526–535. [Google Scholar] [CrossRef]
  4. Fearnside, P.M. Environmental and Social Impacts of Hydroelectric Dams in Brazilian Amazonia: Implications for the Aluminum Industry. World Dev. 2016, 77, 48–65. [Google Scholar] [CrossRef]
  5. FAPESPA—Fundação Amazônia de Amparo a Estudos e Pesquisas do Pará. Barômetro da Sustentabilidade dos Municípios Produtores de Energia e Com Potencial Hidrelétrico do Estado do Pará; FAPESPA: São Paulo, Brazil, 2015.
  6. EPE—Empresa de Pesquisa Energética. Balanço Energético Nacional 2011: Ano Base 2010; EPE: Rio de Janeiro, Brazil, 2011.
  7. Tundisi, J.G.; Goldemberg, J.; Matsumura-Tundisi, T.; Saraiva, A.C.F. How Many More Dams in the Amazon? Energy Policy 2014, 74, 703–708. [Google Scholar] [CrossRef]
  8. Galvão, J.; Bermann, C. Crise Hídrica e Energia: Conflitos No Uso Múltiplo Das Águas. Estud. Av. 2015, 29, 43–68. [Google Scholar] [CrossRef]
  9. Tolmasquim, M.T.; de Barros Correia, T.; Addas Porto, N.; Kruger, W. Electricity Market Design and Renewable Energy Auctions: The Case of Brazil. Energy Policy 2021, 158, 112558. [Google Scholar] [CrossRef]
  10. André Cremonez, P.; Feroldi, M.; Cézar Nadaleti, W.; de Rossi, E.; Feiden, A.; de Camargo, M.P.; Cremonez, F.E.; Klajn, F.F. Biodiesel Production in Brazil: Current Scenario and Perspectives. Renew. Sustain. Energy Rev. 2015, 42, 415–428. [Google Scholar] [CrossRef]
  11. MME—Ministério de Minas e Energia. Plano Nacional de Energia 2030; MME: Brasília, Brazil, 2007.
  12. Caetano de Souza, A.C. Assessment and Statistics of Brazilian Hydroelectric Power Plants: Dam Areas versus Installed and Firm Power. Renew. Sustain. Energy Rev. 2008, 12, 1843–1863. [Google Scholar] [CrossRef]
  13. Blanco, C.J.C.; Secretan, Y.; Mesquita, A.L.A. Decision Support System for Micro-Hydro Power Plants in the Amazon Region under a Sustainable Development Perspective. Energy Sustain. Dev. 2008, 12, 25–33. [Google Scholar] [CrossRef]
  14. Sternberg, R. Hydropower: Dimensions of Social and Environmental Coexistence. Renew. Sustain. Energy Rev. 2008, 12, 1588–1621. [Google Scholar] [CrossRef]
  15. Pottmaier, D.; Melo, C.R.; Sartor, M.N.; Kuester, S.; Amadio, T.M.; Fernandes, C.A.H.; Marinha, D.; Alarcon, O.E. The Brazilian Energy Matrix: From a Materials Science and Engineering Perspective. Renew. Sustain. Energy Rev. 2013, 19, 678–691. [Google Scholar] [CrossRef]
  16. Velastegui-Montoya, A.; de Lima, A.; Adami, M. Multitemporal Analysis of Deforestation in Response to the Construction of the Tucuruí Dam. ISPRS Int. J. Geo-Inf. 2020, 9, 583. [Google Scholar] [CrossRef]
  17. De Lima Andrade, A.; dos Santos, M.A. Hydroelectric Plants Environmental Viability: Strategic Environmental Assessment Application in Brazil. Renew. Sustain. Energy Rev. 2015, 52, 1413–1423. [Google Scholar] [CrossRef]
  18. Furlan de Souza, C.; Liesenberg, V.; Schimalski, M.B.; Casemiro Soares, P.R. Evaluating the Monetary Environmental Compensation over a Hydroelectric Power Plant Based on Opportunity Cost Simulation, GIS, and Remote Sensing Images. Remote Sens. Appl. Soc. Environ. 2021, 23, 100573. [Google Scholar] [CrossRef]
  19. De Oliveira Serrão, E.A.; Silva, M.T.; Ferreira, T.R.; de Paulo Rodrigues da Silva, V.; de Salviano de Sousa, F.; de Lima, A.M.M.; de Ataide, L.C.P.; Wanzeler, R.T.S. Land Use Change Scenarios and Their Effects on Hydropower Energy in the Amazon. Sci. Total Environ. 2020, 744, 140981. [Google Scholar] [CrossRef] [PubMed]
  20. Fearnside, P.M. Social Impacts of Brazil’s Tucuruí Dam. Environ. Manag. 1999, 24, 483–495. [Google Scholar] [CrossRef] [PubMed]
  21. Fearnside, P.M. Environmental Impacts of Brazil’s Tucuruí Dam: Unlearned Lessons for Hydroelectric Development in Amazonia. Environ. Manag. 2001, 27, 377–396. [Google Scholar] [CrossRef] [PubMed]
  22. Nuti, M.R. Análise Das Estimativas de População Atingida Por Projetos Hidrelétricos. In Integração, Usinas Hidroelétricas e Impactos Socioambientais; Verdum, R., Ed.; Instituto de Estudos Socioeconómicos: Brasília, Brazil, 2007; Volume 1, pp. 57–86. [Google Scholar]
  23. Carvalho, E.; Nogueira, J.; Rodrigues, W. Mensuração dos Impactos Ambientais de Empreendimentos Hidroelétricos: O uso do Método de Valoração Contingente. Rev. Bras. Recur. Hidr. 2009, 14, 39–45. [Google Scholar] [CrossRef]
  24. Von Sperling, E. Hydropower in Brazil: Overview of Positive and Negative Environmental Aspects. Energy Procedia 2012, 18, 110–118. [Google Scholar] [CrossRef] [Green Version]
  25. Curi, P.R. Agrupamento de Países Segundo Indicadores de Padrão de Vida. Rev. Saúde Pública 1993, 27, 127–134. [Google Scholar] [CrossRef] [Green Version]
  26. Corrar, L.J.; Paulo, E.; Dias Filho, J.M. ANÁLISE MULTIVARIADA Para os Cursos de Administração, Ciências Contábeis e Economia, 1st ed.; Atlas: São Paulo, Brazil, 2007; Volume 1, ISBN 9788522447077. [Google Scholar]
  27. Grün, R. Apagão Cognitivo: A Crise Energética e Sua Sociologia. Dados 2005, 48, 891–928. [Google Scholar] [CrossRef]
  28. La Rovere, E.L.; Mendes, F.E. Tucuruí Hydropower Complex, Brazil. Available online: https://archive.internationalrivers.org/sites/default/files/attached-files/csbrmain.pdf (accessed on 18 December 2021).
  29. Fearnside, P.M. Greenhouse Gas Emissions from a Hydroelectric Reservoir (Brazil’s Tucuruí Dam) and the Energy Policy Implications. Water Air Soil Pollut. 2002, 133, 69–96. [Google Scholar] [CrossRef]
  30. MPDG—Ministério do Planejamento Desenvolvimento e Gestão. 11° Balanço Completo do PAC—4 Anos (2007–2010); MPDG: Brasília, Brazil, 2012.
  31. Melo De Sousa, L. Estoques de Carbono Resultantes de Mudanças de uso e Cobertura do Solo e Sua Relação Com os Indicadores Socioeco-Nômicos nos Municípios de Paragominas e Ulianópolis, Pará; Belém, Brazil, 2016. Available online: http://repositorio.ufpa.br/jspui/bitstream/2011/11026/1/Dissertacao_EstoquesCarbonoResultantes.pdf (accessed on 18 December 2021).
  32. IBGE. Instituto Brasileiro de Geografia e Estatística Censo Demográfico. Available online: https://www.ibge.gov.br/pt/estatisticas/sociais/populacao/2098-np-censo-demografico/22827-censo-2020-censo4.html?=&t=o-que-e (accessed on 7 January 2022).
  33. Montoya, A.D.V.; de Lima, A.M.M.; Adami, M. Analysis of the Land Cover Around a Hydroelectric Power Plant in the Brazilian Amazon. Anu. Inst. Geocienc. 2019, 42, 74–86. [Google Scholar] [CrossRef]
  34. Montoya, A.D.V.; de Lima, A.M.M.; Adami, M. Mapping and Temporary Analysis of the Landscape in the Tucuruí-Pa Reservoir Surroundings. Anu. Inst. Geocienc. 2018, 41, 553–567. [Google Scholar] [CrossRef]
  35. Leite, G.; Brigatte, H.; De Aguilar, E.B. Análise Multivariada de Indicadores Socioeconômicos dos Países do G-20. Rev. Econ. Mackenzie 2009, 7, 125–147. [Google Scholar]
  36. Tabachnick, B.G.; Fidell, L.S. Using Multivariate Statistics, 7th ed.; Ullman, J.B., Ed.; Pearson: Boston, MA, USA, 2019; ISBN 9780134790541. [Google Scholar]
  37. IBM Corp. IBM SPSS Statistics for Windows; IBM: Armonk, NY, USA, 2015. [Google Scholar]
  38. Fernandes, A.S.A.; de Araújo, S.M.V.G. A Criação de Municípios e a Formalização de Regiões Metropolitanas: Os Desafios da Coordenação Federativa. Urbe. Rev. Bras. Gestão Urbana 2015, 7, 295–309. [Google Scholar] [CrossRef] [Green Version]
  39. Brinkhoff, T. Pará (Brazil): State, Major Cities & Towns—Population Statistics. Available online: http://www.citypopulation.de/en/brazil/cities/para/ (accessed on 28 August 2021).
  40. Silveira, C.A.C. Metodologia Utilizada Pela ANEEL Para Rateio dos Recursos Arrecadados Com a Compensação Financeira Pela Utilização dos Recursos Hídricos Para Fins de Geração de Energia Elétrica. In Proceedings of the XIX Simpósio Brasileiro de Recursos Hídricos, Maceió, Brazil, 27 November–1 December 2011; Associação Brasileira de Recursos Hídricos: Maceió, Brazil, 2011; pp. 1–15. [Google Scholar]
  41. COMASE—Comitê coordenador das atividades de Meio Ambiente do Setor. Compensação Financeira e Royalties Pela Exploração de Recursos Hídricos; COMASE: Charleroi, Belgium, 1993. [Google Scholar]
  42. Rocha, G.D.M. Territorial e Político—Institucional e Desenvolvimento Local Na Amazônia: O Caso de Tucuruí (PA). In Proceedings of the X Encontro de Geógrafos da América Latina, São Paulo, Brazil, 20–26 March 2005; Universidade de São Paulo: São Paulo, Brazil, 2005; pp. 12575–12596. [Google Scholar]
Figure 1. Tucuruí Lake and the seven municipalities affected by the reservoir.
Sustainability 14 01630 g001
Figure 2. Ordered pairs graph of the seven municipalities affected by the reservoir, based on the two factors resulting from the principal components analysis, between the group of C1 variables, and clusters for the years (a) 1991, (b) 2000 and (c) 2010.
Sustainability 14 01630 g002
Table 1. Correlation coefficients between the original variables (*) and the main components, of the 1991, 2000 and 2010 scenarios.
Variables1991 2000 2010
C1C2Order C1C2Order C1C2Order
ANA−0.500.7214 −0.850.3412 −0.710.3212
UZA0.950.264 0.840.5213 0.760.3711
LEAB0.93−0.195 0.97−0.153 0.84−0.5210
CPEISE0.950.182 0.970.122 0.910.035
HDIE0.990.121 0.990.061 0.940.114
HDIL0.93−0.206 0.96−0.154 0.85−0.517
HDIR0.85−0.3811 0.87−0.3811 0.910.256
CSEITE0.950.203 0.910.358 0.940.211
IMR5−0.920.217 −0.960.196 −0.840.518
IMR−0.920.218 −0.960.195 −0.840.529
PFA0.910.139 0.930.257 0.940.273
TP0.710.6813 0.500.8514 0.680.3213
GDP0.88−0.3310 0.90−0.3010 0.940.242
TFR−0.84−0.4812 −0.900.059 −0.61−0.7014
% Variance7813 8112 7115
% Variance Acum.7891 8193 7186
(*) ANA—anthropized; UZA—urbanized area; areas; LEAB—life expectancy at birth; CPEISE—complete primary education and incomplete secondary education; HDI—Human Development Index by municipality; in education (HDIE); HDIL—HDI by longevity; HDIR—HDI by rent; CSEITE—complete secondary education and incomplete tertiary education; IMR—infant mortality rate and; IMR5—infant mortality among children 5 years of age under; PFA—percentage of flooded areas; TP—total population; GDP—gross domestic product per capita; TFR—total fertility rate.
Table 2. Main components of the municipalities and order of the “life quality” indicated by factor 1 (C1 and C2) of the 1991, 2000 and 2010 scenarios.
Municipality1991 2000 2010
C1C2Order C1C2Order C1C2Order
Breu Branco−0.550.265 −0.18−0.325 −0.19−0.057
Goianésia do Pará−0.920.166 0.29−0.794 −0.34−0.504
Itupiranga0.21−0.993 −1.520.457 −1.230.295
Jacundá−0.351.544 0.89−0.252 0.72−0.352
Nova Ipixuna−0.71−0.207 0.58−1.193 0.70−1.626
Novo Repartimento0.30−1.442 −1.140.216 −1.110.653
Tucuruí2.020.661 1.071.881 1.451.581
Publisher’s Note: MDPI stays neutral with regard to jurisdictional claims in published maps and institutional affiliations.

