Article

Cultural Dimensions in Colombia and Chile According to the Spanish Version of the Dorfman and Howell Questionnaire

by
Delio I. Castaneda
1,*,
Andres Raineri
2 and
Camilo A. Ramírez
1
1
Departamento de Administración, Pontificia Universidad Javeriana, Bogotá 110231, Colombia
2
School of Management, Pontificia Universidad Católica de Chile, Santiago 8331150, Chile
*
Author to whom correspondence should be addressed.
Sustainability 2022, 14(3), 1623; https://doi.org/10.3390/su14031623
Submission received: 7 December 2021 / Revised: 26 December 2021 / Accepted: 12 January 2022 / Published: 30 January 2022
(This article belongs to the Special Issue Sustainability in Organizational Culture and Intercultural Management)

Abstract

:
Culture influences the way people can be managed successfully according to the organizational objectives including sustainability. Hofstede´s cultural dimensions have been widely studied in different contexts. Dorfman and Howell designed an instrument in English to measure those dimensions. However, there is no validated Spanish version for this instrument. The objective of this article is to provide to the Ibero-American community a Spanish version of the Dorfman and Howell instrument. The questionnaire was translated into Spanish and adapted to the Chilean and Colombian populations. The study included 1136 participants, 500 from Chile and 636 from Colombia. Exploratory and confirmatory factor analysis were supported by the KMO and the Bartlett tests. Results indicate a better fit of a five-factor model, in similarity with the English language original instrument, as follows: masculinity–femininity, paternalism, power distance, uncertainty avoidance, and individualism–collectivism. Construct validity of the scales was confirmed in the Chilean sample, showing results consistent with previous meta-analytical research. The Dorfman and Howell instrument is a valid questionnaire for the evaluation of cultural dimensions in Spanish-speaking populations. The measurement of culture is a tool that leaders have available to facilitate the understanding and management of people. Organizations with operations in different countries or with intercultural context may use the results of this instrument to tune up their interventions.

1. Introduction

The beliefs, habits, assumptions, expectations, philosophy, traditions, and understandings shared by a collective of individuals has been considered the essence of culture (i.e., [1,2,3,4]). Culture can also be understood as a cohesive system of meanings and symbols in terms of which social interactions take place [5]. Awadh and Saad [6] include in the definition of culture the patterns of communication and explanation of behaviors that guides people. Culture is expressed through symbols, ceremonies, myths, rituals, language, and stories which affect the behavior of employees [7]. Organizational culture arose as a concept to explain the sharing of the above mentioned elements by members of organizations [8]. The understanding of culture is a tool that leaders have available to manage successfully their collaborators to achieve organizational objectives.
Previous research shows that organizational culture has a powerful effect on the performance and long-term effectiveness of firms, including the achievement of sustainability goals [9,10], as well as on a wide array of employees attitudes and behaviors (see Taras et al. [10] for a meta-analysis). To explain how culture affects outcome variables, Schein [11] emphasizes the existence of cultural levels, from the least perceptible, such as non-conscious basic assumptions about core values that guide decisions, to consciously and explicitly shared values and beliefs, to the most visible level of culture, in which Schein includes directly observable artifacts. These levels of organizational culture shape how people behave and things are done [11]. Furthermore, sharing the appropriate organizational culture allows organizational members to align their beliefs, motivations and behaviors towards the achievement of organizational goals [12]. Shared values have a strong influence on the people in the organization and dictate how they act and perform their duties [13]. Organizational culture impacts how decisions are made, who makes them, how rewards are distributed, how employee performance is affected, who is promoted and how the organization responds to its environment [7]. It also has effects on employees’ attitudes, organizational effectiveness [14] and on innovation [15].
The work of Hofstede is one of the most significant cross-cultural studies [16]. Hofstede [17] defined culture as the collective programing of the mind that each individual carries. Hofstede´s model offers an empirically measurable means for operationalizing culture through qualitative and quantitative research approaches [18]. The initial analysis of Hofstede [1] considered four dimensions of culture. The first one, called power distance, was defined as the extent to which a society accepts unequal distribution of power in organizations. The second dimension was individualism–collectivism; individualism occurs when people are supposed to take care of themselves, and collectivism was characterized by expectations to take care of their members. The third dimension, uncertainty avoidance, is related to the extent to which people feel threatened by ambiguous situations and try to avoid them. The fourth dimension is masculinity–femininity, which indicated the dominant values of a society. Most of the dimensions seem uncontroversial in terms of content and replicability.
The original formulation of Hofstede’s cultural dimensions was based on the aggregation of individual level perceptions of Hostede´s cultural dimensions at a country level, within workers from a single global corporation [1]. Influenced by the later, organizational culture has been viewed as a concept that can be measured by questionnaires leading to Likert-type profiles [1]. More recently, an emphasis has been placed on the need for research on the psychometric properties of organizational culture measures [19].
The use of aggregated individual perceptions to infer national level cultural dimensions, has led criticisms to the use of Hofstede´s research by other authors towards committing what has been labeled an ecological fallacy. That is, projecting national-level culture characteristics on individuals and organizations [20], for example, by a tendency of practitioners to stereotype nationals from a specific country, based on averages obtained from individual level data aggregation acquired from a sample which might not be representative of an individual´s cultural beliefs. Such criticisms suggest the need for more research on the relation of individual level perceptions of cultural dimensions and individual level outcomes.
Dorfman and Howell [2] made an adaptation of Hofstede´s scale and enriched the instrument with the review of other authors [21]. The purpose of their research was to develop an instrument to measure dimensions of national culture at an individual level to study individual level perceptions of Hofstede´s cultural dimensions and individual level outcome measures. Dorfman and Howell [2] included in their instrument a new scale measuring paternalism, which assesses the appropriateness of managers taking a personal interest in workers´ lives and taking care of them. The work of Dorfman and Howell [2] is an effort to extend Hofstede´s work to the individual level of analysis. Previous research (e.g., [22,23,24]) shows that Dorfman and Howell [2] scales are psychometrically more reliable than Hofstede´s [17] scales. Furthermore, the inclusion of paternalism as an additional dimension makes Dorfman and Howell [2] instrument particularly suitable to conduct cultural research in societies where such cultural construct has been identified as fundamental in understanding how culture influences work related issues, as is the case of Latin America, India, Turkey, the Middle East and China among other regions and countries [25,26]. Finally, Dorfman and Howell’s scales have the advantage of being designed to capture data at an individual unit of analysis facilitating research focusing on the association between individual employees’ cultural values and job-related attitudes (e.g., [27,28]). That is, the Dorfman and Howell [2] adaptation of Hofstede’s national culture dimensions allows for the study of cultural orientation at the individual level with a reliable psychometric instrument [29]. One important advantage of the Dorfman and Howell [2] instrument is that it permits collecting data about national culture at the individual level irrespectively if respondents shared or not the same cultural values at a particular location, and therefore allowing for the study of individual differences in cultural values [30]. There are multiple studies about the relationship between individual level perceptions of cultural dimensions and individual level attitudinal and behavioral outcomes using Dorfman and Howell [2] scales. For example, Jiang [28] showed that individualism negatively correlated to trust and commitment whereas task mastery correlated positively, while power distance is related to trust only. Wu [31] measured Hofstede’s cultural dimensions, using Dorfman and Howell [2] instrument, and concluded that work-related cultural values in a specific culture are not static and change over time.
Dorfman and Howell [2] initially developed an instrument with a total of 57 items to represent the five cultural dimensions. An initial test of the scale was obtained by administering the instrument to a sample of 100 United States and Mexican students. As a result, many items were modified and deleted. This scale was applied to 243 management and engineering personnel in Mexico and 509 management and engineering personnel in Taiwan. The Taiwan sample consisted of 503 Chinese nationals and 6 U.S. citizens working in two plants owned by a U.S. multinational corporation. The Mexico samples consisted of 203 Mexican nationals and 40 U.S. citizens working in U.S. multinational companies as part of the maquiladora industry in Mexico. Dorfman and Howell [2] found that the Chinese respondents held stronger beliefs in the cultural values of collectivism and paternalism than their U.S. counterparts. Chinese also had higher scores on masculinity and uncertainty avoidance scales. The Mexican sample demonstrated stronger beliefs than their U.S. equals in the cultural dimensions of collectivism, uncertainty avoidance and paternalism.
Culpepper and Watts [32] conducted a principal components analysis on four of the Dorfman and Howell scales (Power distance, collectivism, masculinity and uncertain avoidance). Culpepper and Watts [32] study supported the unidimensionality, convergent validity and discriminant validity of these four Dorfman and Howell scales. Dorfman and Howell [2] instrument has been widely used to establish relationships between individual level cultural values and several attitudinal and outcome measures (e.g., [28,29,33,34]). For example, Clugston et al. [33] found that power distance is related to normative commitment, uncertainty avoidance is associated with continuance commitment and collectivism to workgroup commitment. Jiang [28] found that individualism is negatively associated with trust and commitment, while power distance is positively related to trust. Durán-Brizuela et al. [34] found a negative relationship between power distance and work role performance. In addition, the Dorfman and Howell [2] scales have been used to show the moderation effect of individual cultural values on the association of several relationships, such as the moderation of power distance on the relationship between perceived organizational support and job performance [27], and the moderation of power distance on the effect of authoritarian leadership on employees’ learning-goal orientation [35].
The Dorfman and Howell [2] cultural values scales has been translated to different languages beyond its original English version, such as Arabic [36], Spanish [22], Chinese [31] and Hindi [37]. However, research on cultural values using this and other questionnaires has been obstructed by the absence of evidence about the convergent and discriminant validity properties of the scales in different languages and cultural settings [32]. Because of the need to have a valid and psychometrically tested Spanish version of the Dorfman and Howell [2] scales the purpose of this research is the translation into Spanish, and the psychometric validation, of the Dorfman and Howell [2] cultural values scales in the following two Latin-American countries: Colombia and Chile.

2. Materials and Methods

2.1. Participants

The study included 1136 participants, of whom 500 were from Chile and 636 from Colombia. Each sample was divided into two, to carry out an exploratory and confirmatory factor analysis. Table 1 presents the descriptive characteristics of each sample.

2.2. Procedure

Translation. To guarantee a proper translation of the Dorfman and Howell instrument, we adopted a team-based collaborative translation-back translation procedure [38,39]. Three Spanish speakers fluent in English in Chile and the same number of individuals in Colombia translated the English version of the instrument into Spanish. The final Colombian translated version was discussed simultaneously with the Chilean translated version until a consensus was achieved about a final version. Translators from both countries judged the readability, cultural fit, and comprehension of the translated version on each country. Translators took notes whenever encountering an item which they considered to have ambiguous phrasing or understanding in their country. Concerns were then discussed by translators and researchers, and appropriate changes were made through several iterations of this process until the final version of the survey was reached. Then, a consensual version was translated back into English by a native English speaker fluent in Spanish. No bias in the translation process was found.
Application. The final version of the instrument was reviewed and approved by the Ethical Research Committee of the university Faculties. The questionnaire was completed by participants in one of two versions, digital and paper, after signing their consent to participate in the research.
Instrument. The translated version of the Dorfman and Howell cultural values instrument has 29 original items and five dimensions. The first dimension is uncertainty avoidance, which has five items. An example question is “Rules and regulations are important because they inform employees what the organization expects of them”. The second dimension is individualism–collectivism with six items. One of the questions is “Being accepted by the members of your workgroup is very important”. The third dimension is power distance with six items. An example question is “Managers should seldom ask for the opinions of employees”. The fourth dimension is paternalism with seven items. An example of question is “Managers should help employees with their family problems”. Finally, the fifth dimension is masculinity–femininity with five items. One of the items of the dimension is “Solving organizational problems usually requires an active forcible approach which is typical of men”.

2.3. Data Analysis

An exploratory factor analysis (EFA) and a confirmatory factor analysis (CFA) were carried out for each country’s data set, on different samples. In the EFA analysis, items with a factor weight equal to or less than 0.4 were eliminated, following Izquierdo, Olea and Abad [40] procedural suggestions. Statistical analyses were performed using SPSS Statistics for the EFA and SPSS AMOS for the CFA. The classic fit indices reported in the literature (CFU, TLI and RMSEA) were reviewed.

3. Results

3.1. Exploratory Factor Analysis

For the application of the EFA in the Chilean group, the sampling adequacy values were first examined. Results yielded a Kaiser–Meyer–Olkin (KMO) Test = 0.756, which should be greater than 0.60 to indicate sufficient items for each factor [41]. In addition, a Bartlett’s test of sphericity was performed to assess the amount of collinearity between variables (p < 0.00), indicating this data is suitable for factor analysis. To identify the number of factors to retain, a parallel factor analysis was used, the results of which recommended a five-factor structure (see Table 2).
In the Chilean sample, items were grouped into the five original dimensions. That is, masculinity–femininity, paternalism, power distance, uncertainty avoidance and individualism–collectivism. However, item 8 of the instrument showed lower than expected associations with their respective factors.
In the case of the Colombian sample, the KMO = 0.780 and the Bartlett Test = 0.000 indicate the adequacy of the data to perform factor analysis. The EFA recommended five factors as expected from the original instrument (see Table 3).
In the Colombian sample, as expected, results show that the items are grouped into the expected factors, with the exceptions of item 21 which shows a lower-than-expected association with its respective factor (<0.4).

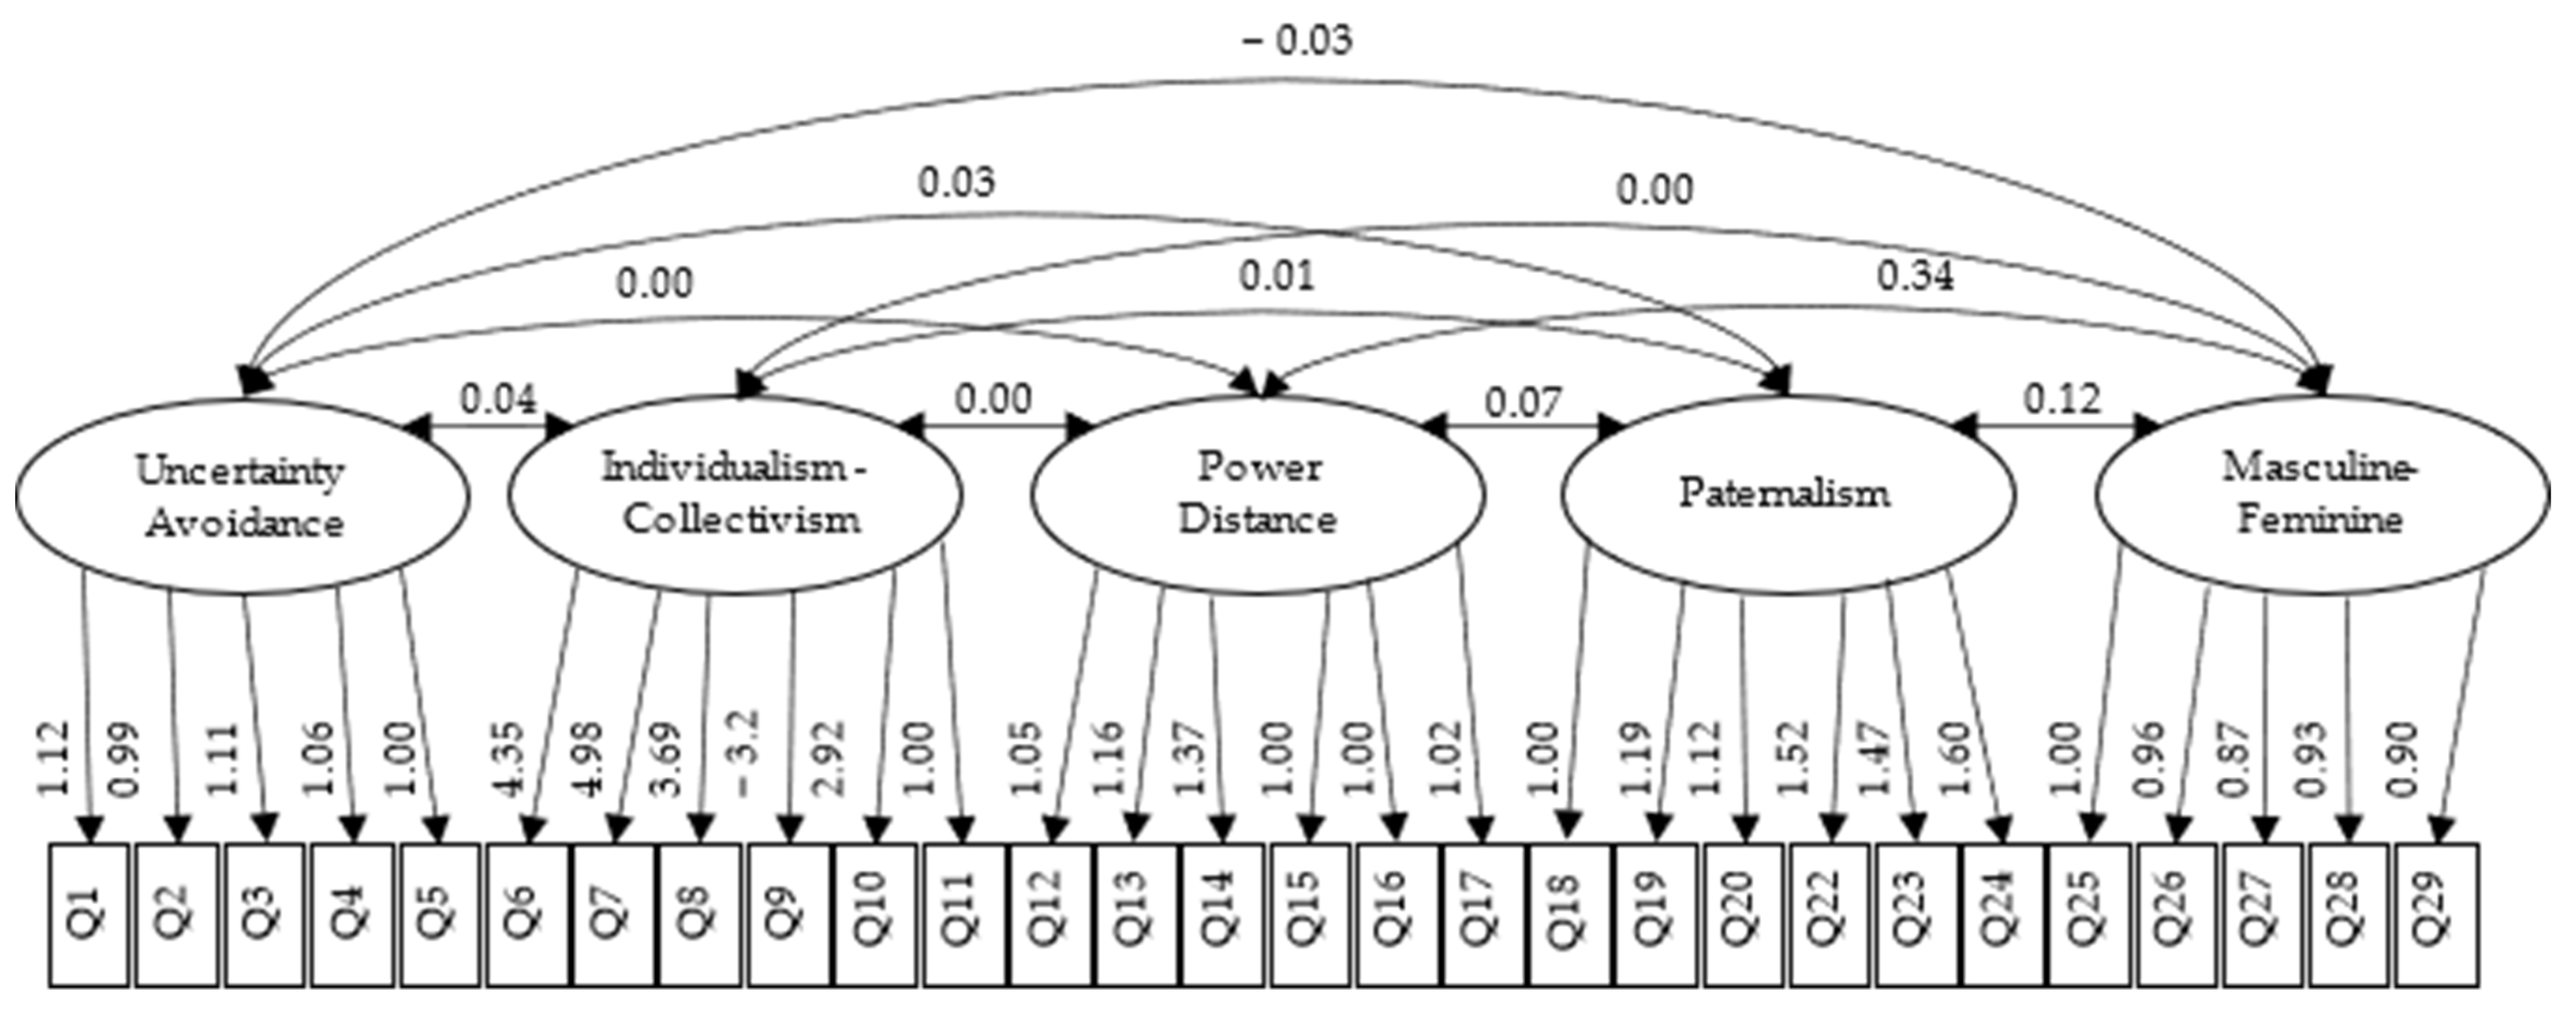
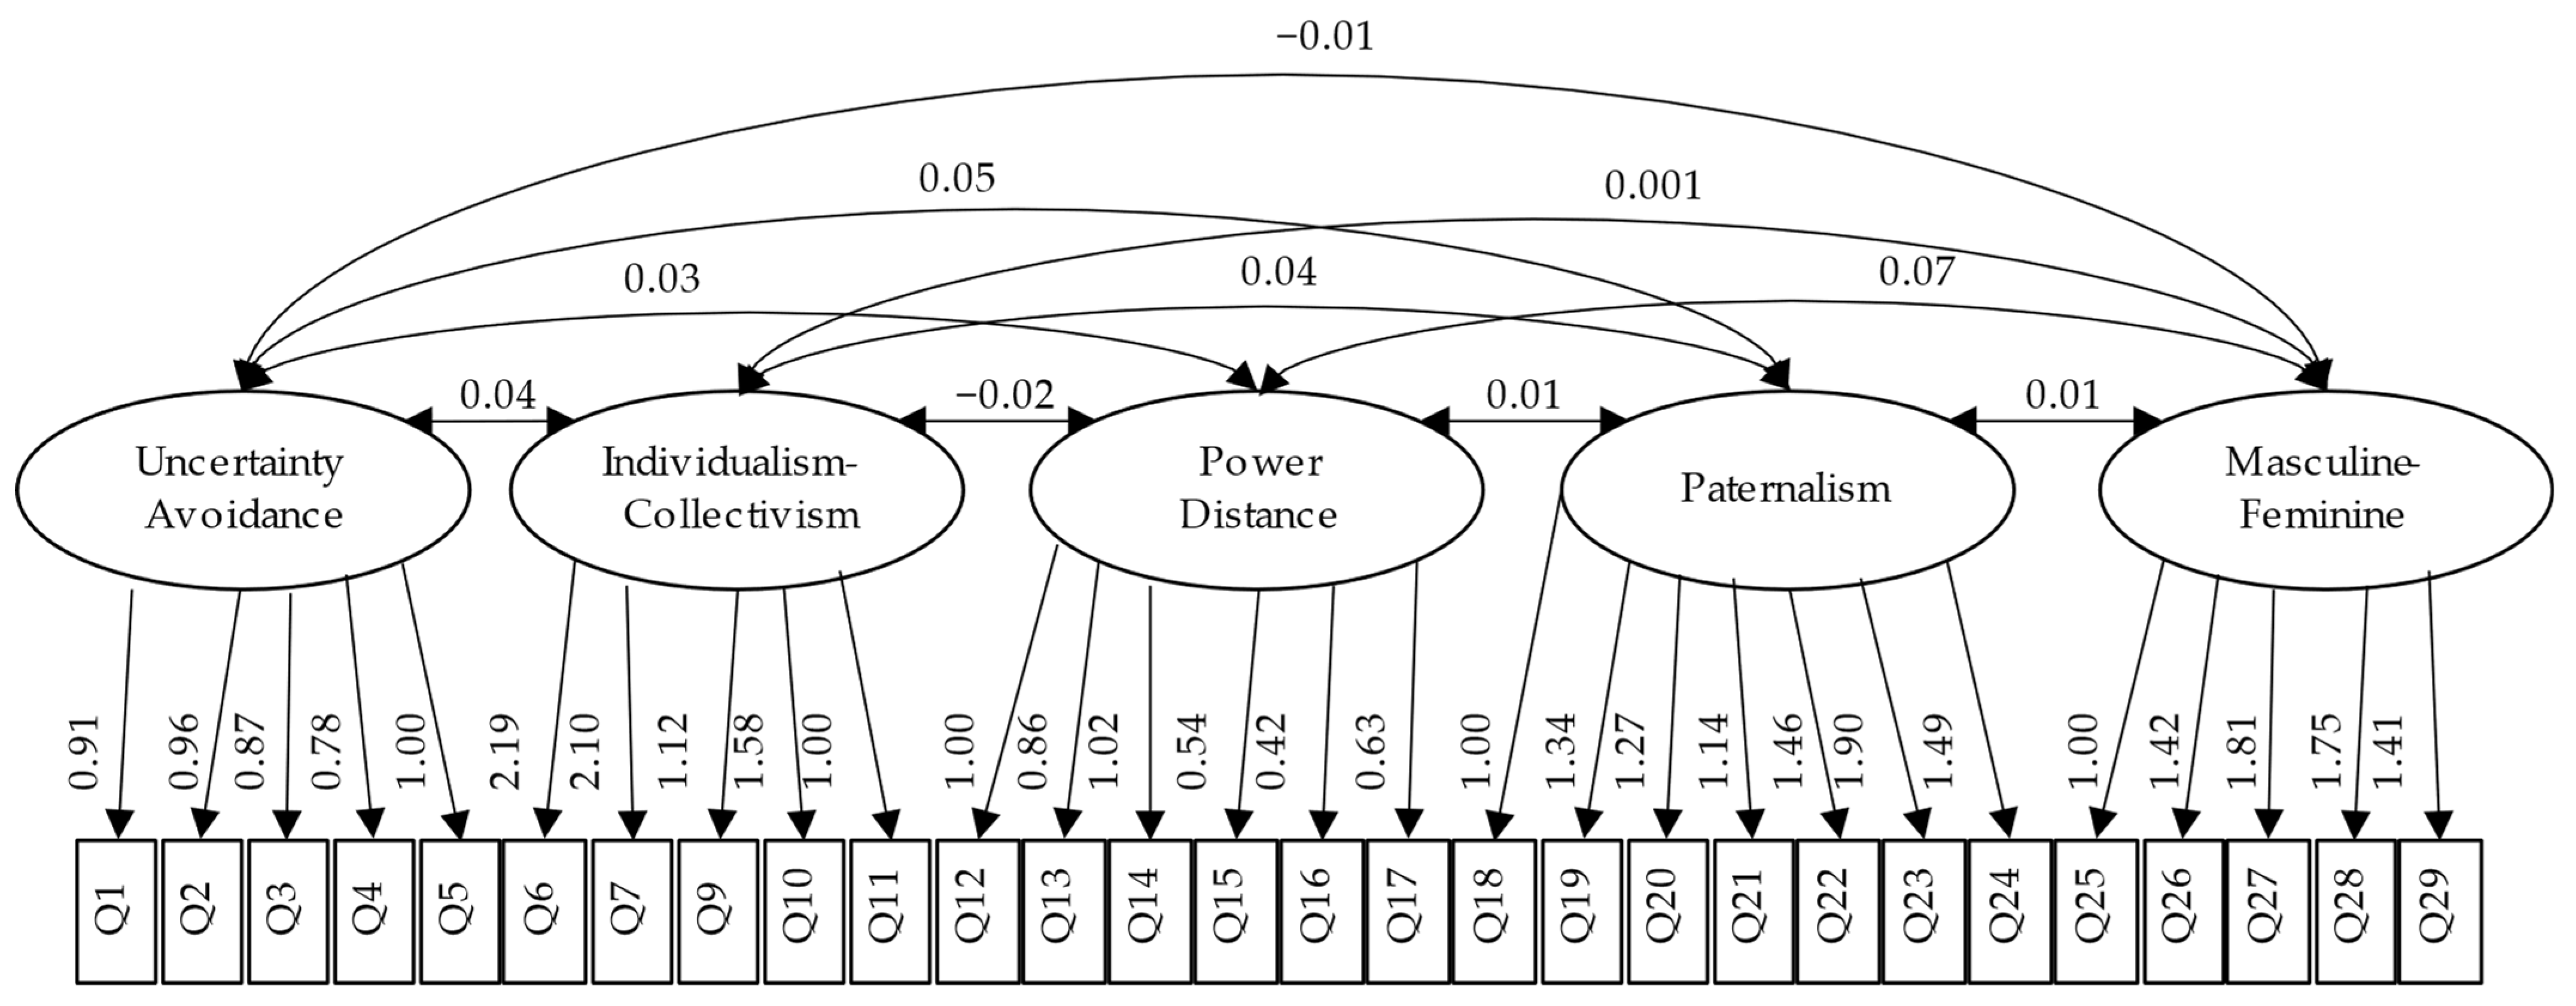
3.2. Confirmatory Factor Analysis

Once the EFA was estimated, the measurement model was again tested using CFA. In the case of the Chilean sample, the five factors were defined as follows: uncertainty avoidance with five items, individualism–collectivism with five items, power distance with five items, paternalism with seven items and masculinity–femininity with five items. The CFA showed an adequate fit (CFI = 0.89; TLI = 0.875; RMSEA = 0.05). The square chi value was 439.945 with 305 degrees of freedom. The weights were significant for its value. The covariances were not significant, so the dimensions are not related to each other.
The Colombian sample showed the following: uncertainty avoidance five items, individualism–collectivism six items, power distance six items, paternalism seven items, and masculinity–femininity five items. Adequate indicators were obtained (CFI = 0.87; TLI = 0.85; RMSEA = 0.06) with a chi-square value of 788.256 and 350 degrees of freedom. The weights were also significant in their factor. The factors were not related to the others in the scale.
Furthermore, a five-factor model was compared in each country with a one factor model. Table 4 summarizes the results, which indicate that the five-factor model has a better fit.
Table 5 and Table 6 show the mean, standard deviation, and internal consistency of the Chilean and Colombian samples.
As can be seen in Table 5, in the Chilean sample there are some dimensions that correlate with each other (r < 0.05 marked with*), which could indicate a possible relationship between uncertainty avoidance and individualism–collectivism and, also, with power distance and paternalism. In turn, paternalism can be related to individualism–collectivism. This result may be explained by characteristics of the culture. All cultural dimensions showed good internal consistency in their responses (α > 0.6). The dimension with the highest scores was uncertainty avoidance, while masculinity–femininity showed the lowest scores.
In the data of the Colombian sample shown in Table 6, similar correlations were found as in the Chilean sample (r < 0.05, marked with *), so it could be partially explained by aspects related to culture. Each of the cultural dimensions showed good internal consistency in their responses (α > 0.6), except individualism–collectivism (α = 0.339) which showed a variation among the responses obtained. As in the Chilean sample, the dimension that presented the highest scores was uncertainty avoidance, while masculinity–femininity had the lowest scores, with high variability in the answers given.
Figure 1 and Figure 2 show the models proposed by the confirmatory factor analysis for the Chilean and Colombian samples, when considering those items with coefficients greater than 0.4. The factorial loads are shown for each item regarding its dimension.
To further test the psychometric properties of the Spanish version of Dorfman and Howell culture scales, the construct validity of the Spanish instrument was tested using the Chilean sample, where job satisfaction correlated positively with individualism (R2 = 0.21, p < 0.05), positively with uncertainty avoidance (R2 = 0.24, p < 0.05), and negatively with masculinity correlates (R2 = 0.19, p < 0.05), thus replicating, both in its effect size and direction, previous meta analytic research on the effect sizes of individual level work culture perceptions [10]. Similarly, in the Chilean sample organizational citizen behavior correlated positively with individualism (R2 = 0.17, p < 0.05) and with uncertainty avoidance (R2 = 0.13, p < 0.05), the results again replicated comparable results from previous meta-analytic research [10].

4. Discussion

The purpose of this study was to test the validity of a Spanish version of the Dorfman and Howell [2] questionnaire of cultural dimensions. The results obtained in our study show that the questionnaire is adequate to be applied to the Spanish speaking population. The goodness-of-fit indices confirm that five factors are maintained in the factor analysis of the Chilean and Colombian adaptation of the Dorfman and Howell instrument, corresponding to the original dimensions described by Dorfman and Howell [2], and which better reflect the data than those of a single factor model. Furthermore, in our study, the Dorfman and Howell [2] scales had Cronbach alpha reliabilities comparable to those of previous research in different cultural settings (e.g., [29,31,32,36,42,43]). Furthermore, the construct validity of the Spanish instrument was tested using the Chilean sample, replicating, both in its effect size and direction, previous meta analytic research on the effect sizes of individual-level work culture perceptions on employees attitudes and behaviors [10].
However, our results suggest caution while interpreting the collectivism subscale. An item from the Dorfman and Howell [2] collectivism scale (here item 8: “Being accepted by the members of your work group is very important”) shows marginal and non-acceptable factor loadings in the EFA of both the Colombian and Chilean samples. This same item has also shown low factor loading when studying the collectivism scale reliability with a sample from India [42]. In addition, Nazarian et al. [30], in a study on the hotel industry in England, found low-factor loading of another item of the collectivism scale, which decreased the reliability of that scale, as it did in Dorfman and Howell’s [2] original study and in Goktan et al. [42]. The fact that the collectivism scale has shown comparatively lower reliability in multiple studies conducted across different cultural contexts has been attributed to local differences in interpretation of some of its items [42].
Our study has some additional strengths and limitations. One of the strengths of this study is the simultaneous, team-based, collaborative and interactive translation process by researchers from both countries. The latter allowed for exploring for any potential local misinterpretations of language translated locally in one country or in the other country, as well as searching for a translation of the questionnaire that is acceptable and appropriately interpreted by populations from both countries [38,39]. Even though the two samples used from different countries allowed to confirm the questionnaire’s original factor structure, they also pose some limitations to our conclusions. Both samples are of a convenience nature and as such are not representative of the population of their respective sample. Both samples have their own biases, such as having a roughly smaller proportion of females. In addition, the Chilean sample has a larger proportion of participants above 40 years of age, while the Colombian sample has a larger proportion of participants younger than 40 years old. Furthermore, both samples were composed mostly by workers holding professional levels of education and organizational positions. A more representative sample of workers should give additional information about this translated version of the questionnaire. For future studies, we suggest adapting the same questionnaire to other Spanish speaking populations, which might culturally vary from our study samples in age range, educational level, activity sector, or generational group. Most frequently, researchers use some, and not all, of the scales of the Dorfman and Howell [2] questionnaire of cultural dimensions. This study allows researchers in Spanish speaking populations to use a valid version of the individual scales needed according to their research objectives, and to leaders to have an additional tool to understand and manage their human talent effectively.

5. Conclusions

Culture is one of the most relevant variables in understanding the behavior of workers. Having a model that identifies the cultural dimensions, and which of them are predominant, constitutes an opportunity for leaders to measure them and take the necessary actions to manage the desired culture oriented to results. The latter is particularly relevant when pursuing sustainability. Previous research indicates that cultural values mediate the achievement of sustainable development goals [9]. When asked which instrument to use that fits Latin American contexts, the Dorfman and Howell questionnaire showed a good fit; therefore, it is recommended, in its Spanish version, which has been validated in this research.
It was concluded that in two Latin American countries, Colombia and Chile, the number of factors, which is five, correspond to the original instrument. In addition, the scales had Cronbach alpha reliabilities similar to other studies in different cultural settings.
The measurement of culture is a tool that leaders have available to facilitate the understanding and management of people. Organizations with operations in different countries or with intercultural context may use the results of this instrument to tune up their interventions.

Author Contributions

Conceptualization: D.I.C. and A.R.; Methodology: D.I.C., A.R. and C.A.R.; Validation: D.I.C., A.R. and C.A.R.; Formal analysis: D.I.C., A.R. and C.A.R.; Investigation: D.I.C. and A.R.; Resources: D.I.C. and A.R.; Data curation: D.I.C., A.R. and C.A.R.; Writing: D.I.C. and A.R.; Project administration: D.I.C. and A.R.; funding adquisition: D.I.C. and A.R. All authors have read and agreed to the published version of the manuscript.

Funding

Pontificia Universidad Javeriana and Pontificia Universidad Catolica de Chile.

Institutional Review Board Statement

Research boards of Pontificia Universidad Javeriana and Pontificia Universidad Catolica de Chile.

Informed Consent Statement

Informed consent was obtained from all subjects involved in the study.

Data Availability Statement

All data are in the text.

Conflicts of Interest

The authors declare no conflict of interest.

References

  1. Hofstede, G. Culture’s Consequences; SAGE Publications: Beverly Hills, CA, USA, 1980. [Google Scholar]
  2. Dorfman, P.W.; Howell, J.P. Dimensions of National Culture and Effective Leadership Patterns: Hofstede Revisited. Adv. Int. Comp. Manag. 1988, 3, 127–150. [Google Scholar] [CrossRef]
  3. Brown, K.; Osborne, S. Managing Change and Innovation in Public Service Organizations; Routledge: Oxfordshire, UK, 2012. [Google Scholar]
  4. Schein, E.H. Organizational Culture and Leadership, 4th ed.; Jossey-Bass: San Francisco, CA, USA, 2010. [Google Scholar]
  5. Alvesson, M. Understanding Organizational Culture; SAGE Publications: London, UK, 2012. [Google Scholar]
  6. Awadh, A.M.; Saad, M. Impact of Organizational Culture on Employee Performance. Int. Rev. Manag. Bus. Res. 2013, 2, 168–175. [Google Scholar]
  7. Suvaci, B. The impact of organizational culture on employees’ protean and boundaryless career attitudes: An empirical study of the banking sector in Turkey. J. Bus. Manag. 2018, 24, 1–25. [Google Scholar] [CrossRef]
  8. Ouchi, W. Theory Z: How American Business Can Meet the Japanese; Addison-Wesley: Boston, MA, USA, 1981. [Google Scholar]
  9. Zheng, X.; Wang, R.; Hoekstra, A.Y.; Krol, M.S.; Zhang, Y.; Guo, K.; Sanwal, M.; Sun, Z.; Zhu, J.; Zhang, J.; et al. Consideration of culture is vital if we are to achieve the Sustainable Development Goals. One Earth 2021, 4, 307–319. [Google Scholar] [CrossRef]
  10. Taras, V.; Kirkman, B.L.; Steel, P. Examining the impact of Culture’s Consequences: A three-decade, multilevel, meta-analytic review of Hofstede’s cultural value dimensions’: Correction to Taras, Kirkman, and Steel. J. Appl. Psychol. 2010, 95, 888. [Google Scholar] [CrossRef]
  11. Schein, E.H. Organizational culture. Am. Psychol. 1990, 45, 109–119. [Google Scholar] [CrossRef]
  12. Hofstede, G.; Hofstede, G.J.; Minkov, M. Cultures and Organizations: Software of the Mind, 3rd ed.; McGraw Hill: New York, NY, USA, 2010. [Google Scholar]
  13. Odiakaose Odor, H. Organisational Culture and Dynamics. Int. J. Sci. Res. Manag. 2018, 6, 31–39. [Google Scholar] [CrossRef] [Green Version]
  14. Gregory, B.T.; Harris, S.G.; Armenakis, A.A.; Shook, C.L. Organizational culture and effectiveness: A study of values, attitudes, and organizational outcomes. J. Bus. Res. 2009, 62, 673–679. [Google Scholar] [CrossRef]
  15. Naranjo-Valencia, J.C.; Jiménez-Jiménez, D.; Sanz-Valle, R. Innovation or imitation? The role of organizational culture. Manag. Decis. 2011, 49, 55–72. [Google Scholar] [CrossRef]
  16. Bhagat, R.S.; McQuaid, S.J. Role of subjective culture in organizations: A review and directions for future research. J. Appl. Psychol. 1982, 67, 653–685. [Google Scholar] [CrossRef]
  17. Hofstede, G. The Cultural Relativity of the Quality of Life Concept. Acad. Manag. Rev. 1984, 9, 389–398. [Google Scholar] [CrossRef] [Green Version]
  18. Azizi, N.; Rowlands, B. The Moderating Effects of Organisational Culture on the Relationship between Knowledge Sharing and IT Risk Management Success; ECIS: London, UK, 2018. [Google Scholar]
  19. Puppatz, M.; Burmeister, A.; Deller, J. The assessment of organizational culture in cross-cultural settings: Investigating the psychometric quality and cultural equivalence of three quantitative instruments. Int. J. Sel. Assess. 2017, 25, 43–60. [Google Scholar] [CrossRef] [Green Version]
  20. Brewer, P.; Venaik, S. The Ecological Fallacy in National Culture Research. Organ. Stud. 2014, 35, 1063–1086. [Google Scholar] [CrossRef]
  21. Dorfman, P.W.; Howell, J.; Bautista, J. Dimensions of national culture and work related beliefs: Hofstede revisited. 1986; unpublished manuscript. [Google Scholar]
  22. Fernandez, D.R.; Carlson, D.S.; Stepina, L.P.; Nicholson, J.D. Hofstede’s Country Classification 25 Years Later. J. Soc. Psychol. 1997, 137, 43–54. [Google Scholar] [CrossRef]
  23. Kirkman, B.L.; Lowe, K.B.; Gibson, C.B. A quarter century of Culture’s Consequences: A review of empirical research incorporating Hofstede’s cultural values framework. J. Int. Bus. Stud. 2006, 37, 285–320. [Google Scholar] [CrossRef]
  24. Nicholson, J.D. The Relationship between Cultural Values, Work Beliefs, and Attitudes towards Socio-Economic Issues: A Cross Cultural Study; Florida State University: Tallahassee, FL, USA, 1991. [Google Scholar]
  25. Pellegrini, E.K.; Scandura, T.A. Paternalistic Leadership: A Review and Agenda for Future Research. J. Manag. 2008, 34, 566–593. [Google Scholar] [CrossRef]
  26. Aguinis, H.; Villamor, I.; Lazzarini, S.G.; Vassolo, R.S.; Amorós, J.E.; Allen, D.G. Conducting management research in Latin America: Why and what’s in it for You? J. Manag. 2020, 46, 615–636. [Google Scholar] [CrossRef] [Green Version]
  27. Farh, J.-L.; Hackett, R.D.; Liang, J. Individual-level cultural values as moderators of perceived organizational support–employee outcome relationships in china: Comparing the effects of power distance and traditionality. Acad. Manag. J. 2007, 50, 715–729. [Google Scholar] [CrossRef]
  28. Jiang, Z. Linking Individual value orientations to employee attitudes: An exploratory analysis. J. Employ. Couns. 2018, 55, 124–142. [Google Scholar] [CrossRef]
  29. Mancheno-Smoak, L.; Endres, G.M.; Polak, R.; Athanasaw, Y. The individual cultural values and job satisfaction of the transformational leader. Organ. Dev. J. 2009, 27, 9–21. [Google Scholar]
  30. Nazarian, A.; Atkinson, P.; Foroudi, P. Influence of national culture and balanced organizational culture on the hotel industry’s performance. Int. J. Hosp. Manag. 2017, 63, 22–32. [Google Scholar] [CrossRef]
  31. Wu, M. Hofstede’s cultural dimensions 30 years later: A study of Taiwan and the United States. Intercult. Commun. Stud. 2006, 15, 33–42. [Google Scholar]
  32. Culpepper, R.A.; Watts, L.R. Measuring cultural dimensions at the individual level: An examination of the Dorfman and Howell (1988) scales and Robertson and Hoffman (1999) scale. Acad. Strateg. Organ. Leadersh. 1999, 3, 22–34. [Google Scholar]
  33. Clugston, M.; Howell, J.P.; Dorfman, P.W. Does cultural socialization predict multiple bases and foci of commitment? J. Manag. 2000, 26, 5–30. [Google Scholar] [CrossRef]
  34. Durán-Brizuela, R.; Brenes-Leiva, G.; Solís-Salazar, M.; Torres-Carballo, F. Effects of power distance diversity within workgroups on work role performance and organizational citizenship behavior. Rev. Tecnol. Marcha 2016, 29, 63–76. [Google Scholar] [CrossRef]
  35. Wang, H.; Guan, B. The positive effect of authoritarian leadership on employee performance: The moderating role of power distance. Front. Psychol. 2018, 9, 357. [Google Scholar] [CrossRef] [Green Version]
  36. Sabri, H.A. Re-examination of Hofstede’s work value orientations on perceived leadership styles in Jordan. Int. J. Commer. Manag. 2012, 22, 202–218. [Google Scholar] [CrossRef] [Green Version]
  37. Vidyarthi, P.R.; Anand, S.; Liden, R.C. Do emotionally perceptive leaders motivate higher employee performance? The moderating role of task interdependence and power distance. Leadersh. Q. 2014, 25, 232–244. [Google Scholar] [CrossRef]
  38. Behr, D. Translating questionnaires for cross-national surveys: A description of a genre and its particularities based on the ISO 17100 categorization of translator competences. Int. J. Transl. Interpret. Res. 2018, 10, 5–20. [Google Scholar] [CrossRef]
  39. Harkness, J.A. Questionnaire translation. In Cross-Cultural Survey Methods; Harkness, J., Van de Vijer, F., Moher, P., Eds.; John Wiley & Sons, Inc.: Hoboken, NJ, USA, 2003. [Google Scholar]
  40. Izquierdo, I.; Olea, J.; Abad, F.J. Exploratory factor analysis in validation studies: Uses and recommendations. Psicothema 2014, 26, 395–400. [Google Scholar] [CrossRef] [PubMed] [Green Version]
  41. Tabachnick, B.G.; Fidell, L.S. Using Multivariate Statistics, 6th ed.; Pearson: Boston, MA, USA, 2013. [Google Scholar]
  42. Goktan, A.B.; Gupta, A.; Mukherjee, S.; Gupta, V.K. Relating Cultural Values with Opportunity Evaluation Evidence from India. N. Engl. J. Entrep. 2017, 20, 6–24. [Google Scholar] [CrossRef]
  43. Kennedy, J.C.; Ho, M.-H.R. The Influence of Values on Entrepreneurial, Professional, and Career Motivations. In Entrepreneurship–Professionalism–Leadership; Spriger: Berlin, Germany, 2020; pp. 151–171. [Google Scholar] [CrossRef]
Figure 1. Proposed model to the Chilean sample.
Sustainability 14 01623 g001
Figure 2. Proposed model to the Colombian sample.
Sustainability 14 01623 g002
Table 1. Descriptive characteristics of the sample.
Characteristics ChileColombia
Number (%)Number (%)
Gender
Male263 (52.6%)356 (55.9%)
Female237 (47.4%)277 (43.6%)
No answer0 (0%)3 (0.5%)
Age (years)
20–2999 (19.8%)191 (29.9%)
30–39120 (24%)251 (39.5%)
40–4980 (16%)122 (19.2%)
50–59158 (31.6%)63 (9.9%)
60–6938 (7.6%)8 (1.3%)
70 or more5 (1%)1 (0.2%)
Position Level
Adviser34 (6.8%)52 (8.2%)
Executive141 (28.2%)74 (11.6%)
Professional299 (59.8%)319 (50.2%)
Technician26 (5.2%)191 (30.0%)
Total382636
Table 2. Exploratory Factor Analysis Chilean sample.
Exploratory (n = 250)
Masculinity-
Femininity (Omega=0.88)
Paternalism (Omega = 0.83)Power
Distance (Omega = 0.81)
Individualism-Collectivism (Omega = 0.81)Uncertainty Avoidance (Omega = 0.80)
Item 1−0.0620.122−0.0980.0210.653
Item 20.133−0.0030.0260.1710.656
Item 3−0.1800.0780.0390.0000.700
Item 4−0.1750.023−0.0960.1230.604
Item 5−0.0080.0670.0220.1020.731
Item 6−0.0500.135−0.0550.7600.109
Item 7−0.036−0.028−0.1100.7380.101
Item 80.0650.080−0.2650.3090.154
Item 9−0.0430.0940.0920.667−0.003
Item 10−0.0420.109−0.0710.6900.125
Item 11−0.0120.0450.2300.6290.026
Item 120.0500.1040.7290.014−0.040
Item 130.1170.0600.560−0.0130.008
Item 140.015−0.0320.8000.066−0.042
Item 150.072−0.1090.661−0.043−0.081
Item 160.2510.0380.6250.0370.070
Item 170.2830.1500.492−0.0420.010
Item 180.0030.6470.0080.123−0.145
Item 19−0.0540.5610.227−0.0050.188
Item 200.0500.682−0.0220.176−0.110
Item 21−0.0780.5200.010−0.0030.221
Item 220.0680.7340.0440.0880.096
Item 23−0.0180.6970.0650.0040.105
Item 240.2270.596−0.1350.0670.044
Item 250.7340.0450.139−0.046−0.125
Item 260.682−0.0260.165−0.122−0.062
Item 270.7280.0460.1860.015−0.024
Item 280.8470.0160.0680.037−0.013
Item 290.8360.0450.068−0.037−0.091
Table 3. Exploratory Factor Analysis Colombian sample.
Exploratory (n = 319)
Masculinity–Femininity (Omega = 0.87)Paternalism (Omega = 0.81)Power
Distance (Omega = 0.76)
Individualism–Collectivism (Omega = 0.78)Uncertainty Avoidance (Omega = 0.81)
Item 10.010−0.001−0.0810.0760.660
Item 2−0.0790.0260.0550.0840.661
Item 30.095−0.024−0.0860.1200.773
Item 4−0.098−0.0150.1010.0930.664
Item 5−0.1230.0820.0450.0420.617
Item 6−0.0540.031−0.0880.6970.250
Item 70.0180.048−0.1030.6960.295
Item 8−0.0680.2440.0960.4030.224
Item 90.0390.0550.1360.653−0.006
Item 100.057−0.0480.0070.695−0.017
Item 110.2230.0660.3810.518−0.047
Item 120.052−0.1620.6490.026−0.006
Item 130.0310.0680.5860.1150.086
Item 140.3470.0090.569−0.1970.110
Item 150.1490.0490.6340.0510.028
Item 160.2850.0290.5700.060−0.049
Item 170.241−0.1920.5040.005−0.101
Item 180.1630.603−0.0550.0150.015
Item 19−0.1360.6650.1880.161−0.131
Item 200.2380.582−0.197−0.0700.123
Item 21−0.2790.3440.0510.2410.010
Item 22−0.0680.730−0.0810.1070.001
Item 23−0.0350.712−0.100−0.032−0.015
Item 240.0240.6430.0780.0140.083
Item 250.6800.0410.316−0.045−0.088
Item 260.784−0.0220.2670.009−0.099
Item 270.7730.0490.0920.074−0.096
Item 280.7950.0900.1990.057−0.035
Item 290.780−0.0570.1430.0670.021
Table 4. Models with the Colombian and Chilean samples.
ModelsChi SquareddfCFITLIRMSA
One-factor model (Chile)0.0003500.2320.1710.123
Five-factor model (Chile)0.0003310.8900.8750.048
One-factor model (Colombia)0.0003500.4880.4470.124
Five-factor model (Colombia)0.0003220.8870.8670.061
Table 5. Descriptive Statistics, Pearson Correlations, and Internal Consistencies cultural dimensions in Chilean sample.
ScalesUncertainty AvoidanceIndividualism–CollectivismPower DistancePaternalismMasculine–Feminine
Uncertainty avoidance 1
Individualism–Collectivism 0.156 * 1
Power distance 0.136 * −0.013 1
Paternalism 0.194 ** 0.302 ** 0.022 1
Masculine–Feminine −0.023 0.056 0.306 ** 0.090 1
M4.23123.38642.14473.21771.7184
(SD)(0.5919)(0.6068)(0.5423)(0.5623)(0.6461)
Alpha0.7810.6730.6380.7150.829
Note: * Significant correlation (p < 0.05); ** Significant correlation (p < 0.01).
Table 6. Descriptive Statistics, Pearson Correlations, and Internal Consistencies cultural dimensions in Colombian sample.
ScalesUncertainty AvoidanceIndividualism/CollectivismPower DistancePaternalismMasculine–Feminine
Uncertainty avoidance 1
Individualism/Collectivism −0.013 1
Power distance 0.029 0.174 ** 1
Paternalism 0.090 0.114 * 0.256 ** 1
Masculine–Feminine −0.048 0.189 ** 0.563 ** 0.284 ** 1
M4.30473.51572.42273.23561.9448
(SD)(0.5665)(0.9008)(0.6675)(0.6380)(0.8895)
Alpha0.8200.3390.7970.7530.915
Note: * Significant correlation (p < 0.05); ** Significant correlation (p < 0.01).
Publisher’s Note: MDPI stays neutral with regard to jurisdictional claims in published maps and institutional affiliations.

