Abstract
This study aims to quantitatively identify the economic value of the comprehensive improvement of environmental degradations caused by climate change. The research method applied to that is the choice experiment. Fine particulate matter, algae bloom, and heat waves were selected as individual attributes constituting environmental problems. It was found that the willingness to pay could not be induced for any level of improvement in algal bloom. It was concluded that if heat waves improved to the medium level where the number of heat-related illnesses and estimated deaths decreased by 50% compared to the current level, there would be a loss in value by USD 13.33. The value of improving environmental problems is USD 7.69 per household per year, and the improvement of fine particulate matter was the highest value attributed by consumers. This study is significant in that it comprehensively evaluates severe environmental problems, reflects their priorities and importance, and assesses the value for each level. It provides important foundational data for establishing effective budget input strategies to maximize consumer benefits and aids in the preparation of effective policies by establishing more detailed goals to achieve net-zero carbon emissions and the Sustainable Development Goals.
1. Introduction
Mankind has entered the fourth industrial era with remarkable economic growth, bolstered by the creation and innovation of the technological civilization. However, the consequence of such anthropogenic development and growth has been serious climate change and environmental degradations. As a result, many countries recognize that extreme climate events, air pollution, and rising average temperature are no longer simple climate changes, but climate crises that threaten human survival. Against this backdrop, voices of self-reflection are being raised for the protection of the global environment. To this end, the international community unanimously adopted the Sustainable Development Goals (SDGs) as a next development regime. The SDGs consist of 17 goals and 169 targets, and lay the groundwork for all of mankind to respond to climate change and achieve goals including economic growth and social development as well as environmental conservation, embracing all mankind and “leaving no one behind”. In addition, the Paris Agreement, containing the response to climate change effective from 2021, was adopted at the 21st United Nations Framework Convention on Climate Change (UNFCCC) Climate Change Conference in Paris (COP21) in December 2015, by which a universal new climate regime was established, where all 195 parties would participate reflecting their respective situations. The Intergovernmental Panel on Climate Change (IPCC) Special Report “Global Warming of 1.5 °C”, required achieving net zero carbon emissions by 2050 to fulfill the Paris Conference objectives. This net-zero carbon emission goal, where the emission and absorption of carbon dioxide completely offset each other, must be achieved by 2050 [1]. Accordingly, 121 countries joined the “Climate Ambition Alliance: Net Zero 2050” after the Paris Conference, and the declaration of net-zero carbon emissions from major countries has accelerated, starting with the European Union in December 2019.
As such, the international community is obligated to participate in a major way towards responding to climate change. At the same time, it also bears the responsibility to urgently resolve the environmental problems caused by climate change which each country faces, in order to achieve net-zero carbon emissions and the SDGs. To this end, research is required on areas that must be first resolved among environmental problems that each country faces. South Korea has also continuously participated in climate change research as a member of the United Nations (UN), UNFCCC, and IPCC [2], and cannot be exempt from such issues as it is among the countries affected by the ratifications of agreements by the international community. Accordingly, there have been studies utilizing text big data analysis to derive the priorities of environmental problems caused by climate change in South Korea [3,4], and a study on the selection of the priorities of strategies for organizing cities responding to climate change using the Analytic Hierarchy Process AHP technique [5]. As a result, heat waves, air pollution, and algal bloom (water pollution) problems caused by abnormal climates have emerged as major issues. In particular, fine particulate matter and heat waves among air pollutants have been designated as national disasters due to their gravity, and policy response levels are being raised in ways such as establishing a standard manual for crisis management [6,7].
The gravity of the problems of fine particulate matter, algal bloom, and heat waves, which have emerged as challenges to be resolved on priority, is augmenting due to human health hazards such as cardiovascular and respiratory diseases, heat-related illnesses, and infectious diseases borne from other sources, for which strategic budget input as well as improvement and management policies are required more urgently. To this end, studies have been conducted [8,9,10,11,12,13,14,15,16,17,18] to quantitatively evaluate the value of improving relevant environmental problems, but were limited in that their considerations were circumscribed to individual environmental problems. Since environmental problems are interlinked; it is deemed necessary for changes in the value of environmental improvement, reflecting the priorities and importance of individual environmental problems, to be presented in an integrated manner, but such research is difficult to find.
Accordingly, the purpose of this study is to provide socioeconomic data by quantitatively identifying the economic value of the comprehensive improvement of environmental problems caused by the damages of climate change. The methodology applied to this end is the choice experiment (CE), which has the advantage of evaluating the value by separating by each level of individual issues constituting environmental problems. Specifically, environmental problems that are major issues (like fine particulate matter, algal bloom, and heat waves) are established as three attributes, and their values are estimated for each level. The results of this study are considered to be critical for preparing effective policies and establishing effective budget input strategies through more detailed and strategic goals to achieve net-zero carbon emissions and the SDGs. The rest of this study proceeds as follows. Section 2 introduces theoretical background and literature review of estimating non-market goods and services, with respect to the choice experiments. Section 3 presents structure of alternatives in survey questionnaire. Section 4 elaborates statistics of data set and estimation results. Finally, concluding remarks, limitation of this research, and further discussions are in Section 5.
2. Theoretical Background
2.1. Methods of Estimating Values of Environmental Degradations
Values are often distinguished into use value and non-use value, where non-use value is classified into existence value, option value, and bequest value [19,20]. Use value is the value obtained by the use of parks and wild resources, and existence value is defined as the utility gained by the mere fact that certain resources exist even though they are neither currently used nor are likely to be used in the future. Option value is an expected value, like an insurance premium, which is not currently used but for which there is a willingness to pay for future choices based on the possibility of future usage. Bequest value is a willingness to pay assuming conservation for posterity.
Methods of evaluating such values are largely classified into the revealed preference and stated preference methods. Among them, the stated preference method has been mainly used in the fields of environmental and resource economy to denominate non-market goods, such as environmental and public goods that are not directly traded in the market, by economic or monetary values. This is a method that inquires, using questionnaires and other formats, how virtual transactions would be made in a situation based on a virtual market, and evaluates, in regard to preferences thereof, the economic value of non-market goods based on the virtual market. A direct method in the stated preference method is the contingent valuation method (CVM), and an indirect method is the choice experiment (CE). The CVM estimates the willingness to pay (WTP) or the willingness to accept (WTA) through such virtual market setting. CE is a method where multiple alternatives are constituted variously combining the attributes and levels of each attribute of a product, which are then presented to respondents for them to select the most preferred alternative, and the results are then analyzed [21]. CE is similar to the CVM in that it estimates WTP based on respondents’ statements regarding the virtual market. However, while the CVM estimates only the WTP for total utility regardless of the number of attributes constituting the product, CE bears the advantage of being able to obtain the change in the WTP, i.e., marginal willingness to pay (MWTP) when each attribute constituting the product increases by one unit.
The application of CE is appropriate, as there are various attributes that can be expected from the improvement of environmental problems. This study places significance on evaluating the value of individual issues constituting environmental issues by classifying the issues by each level.
2.2. Previous Studies Applying Choice Experiment
CE is an approach that evaluates the value of environmental goods, and was first applied to the value estimation study of recreational areas by [22]. Preceding studies applying CE in relation to climate change and environmental problems are as follows.
Nthambi et al. [23] broached the gravity of the drought in sub-Saharan African agriculture caused by the effects of climate change, and applied CE to 283 farms in Makueni County, Kenya, in relation to the various attributes of dam construction projects. Results found that NGOs were most preferred as project managing institutes, and that when farmers’ networks were responsible instead of NGOs, benefits of US dollar (USD) 320,426 were lost. When government agencies were responsible, benefits of USD 1,170,996 were lost. Rolfe et al. [24] conducted a study for the case of Victoria, Australia to determine the social value and identify the priorities of attributes for protecting the potential loss of coastal assets, including coastal parks, beaches, and landscapes due to climate change. Results found that both visitors and residents hold similar values for protecting parks and campsite beaches. However, while residents considered beach protection to be more important, visitors placed greater value on the importance of parks and campsites. Hynes et al. [25] conducted research establishing the spectrum of biodiversity, number of young fish, restored area, and annual amount of tax payment per capita as attributes for ecological restoration services related to the restoration of kelp forests in Norway. According to the results, the WTP of the highest grade was found in all attributes, with the value of kelp forest ecological restoration being Euro (EUR) 121.95.
Jin et al. [13] applied CE to verify whether the WTP’s effect on reducing the risk of mortality and morbidity from air pollution varies depending on major diseases caused by air pollution. According to the test of preference heterogeneity, there were no differences between types of diseases, based on which it was argued that WTP for policy purposes should not be differentiated according to the type of disease. In addition, as air pollution becomes more serious, the value of statistical life (VSL) and value of statistical injury (VSI) were Chines Yuan (CNY) 5,540,000 (USD 1,580,000) and CNY 820,000 (USD 230,000), respectively, demonstrating higher estimates than previous ones in China. Hee-kyun Oh and Hee-chan Lee [9] conducted an economic value estimation study using CE on dam functions (drought damage prevention, flood damage prevention, and water purification) in preparation for climate change, to derive a MWTP of Korean Won (KRW) 17,751 per household. Taylor and Longo [16] conducted a CE study to evaluate recreational damage related to algal bloom caused by nutrients flowing into Varna Bay, Bulgaria, demonstrating that respondents were willing to pay an average on time tax of Bulgaria Leva (BGN) 18.97 (EUR 9.73) on a program providing seaweed-free beaches. Yoo et al. [17] conducted a CE in Seoul, South Korea, to quantify environmental costs caused by the four major effects of air pollution (death, disease, pollution damage, and decreased visibility). According to the results, the monthly WTP of households to reduce the concentration of major pollutants in Seoul by 10% was approximately KRW 5494 (USD 4.6), and the total annual WTP of all citizens in Seoul was approximately KRW 203.4 billion (USD 106.95 million).
In addition, studies estimating the economic value of environmental problems using the CVM based on the stated preference method are as follows. Srisawasdi et al. [26] analyzed factors associated with individual WTPs, using the WTP to mitigate air pollution in Mae Moh District, Thailand and double-hurdle regression techniques. The results found that the weighted average WTPs in the scenarios of 50% and 80% reduction were Thailand Baht (THB) 251.3 and 307.9 (USD 8.4 and 10.3), respectively. Van et al. [27] estimated the WTP for urban air pollution reduction in Hanoi, Vietnam, and found that more than two-thirds of surveyed residents were willing to pay air environment funds, and that the average value of WTP was Vietnam Dong (VND) 1,227,000 per month. Guo et al. [28] demonstrated that Chinese urban residents were willing to pay an average of CNY 65 (approximately USD 10) per year to improve the air quality and raise it to meet the World Health Organization (WHO) standards. Ofori and Rouleau [15] estimated the public support or WTP for seaweed cleanup policies to remove invasive seaweed from the beach. Overall, household income, household education, years of residence, distance to the beach, and attitude towards invasive seaweed were found to significantly affect the WTP of all households, with monthly average WTPs of Ghana Cedi (GHS) 59.62 (USD 12.42), GHS 26.28 (USD 5.48), and GHS 33.43 (USD 6.96) for high income, low income, and all households, respectively. Zhang et al. [18] estimated that Beijing residents’ WTP for the benefits of the construction of urban green roofs would alleviate the urban heat island effect, where the average household was found to be willing to pay CNY 148.582 per year.
Since stated preference method such as CE and CVM are designed to valuing non-market goods and services, there are relatively a large number of studies available these days. CE has an advantage to clarify and separate level of attributes for estimating MWTP. In this sense, we carefully choose CE as our primary model among many others to meet our research goal.
3. Research Design
3.1. Establishment of Attributes and Levels
In applying CE, it is important to derive the properties of the products suitable for the purpose of the study. Based on the results of previous studies on similar goods such as climate change and environmental issue priorities, air pollution, water pollution, drought, and heat waves, attributes suited to the purpose of this study were selected. Three attributes comprising fine particulate matter, algal bloom, and heat waves were selected based on previous studies [3,4,5] regarding the derivation of major attributes and priorities in improving environmental problems.
In addition, reports from a national portal site with recognized public confidence were reviewed on priority to establish the level for each attribute. For fine particulate matter, the project report by So-eun Ahn et al. [8] of the Korea Environment Institute (KEI) and Air Quality Guidelines (AQG) of the WHO [29] were applied, reflecting the measurements of “monthly fine particulate matter pollution level by city” for 2019 and 2020 through Air Korea run by the Korea Environment Corporation. Based on reports from the National Institute of Environmental Research [30] and the Water Environment Information System [31], indicators such as the number of warnings for algae (algal bloom) issued for major rivers (Han River, Nakdong River, Geum River, and Yeongsan River) over the past five years, eutrophication index, and good water achievement rates were considered. For heat waves, based on the figures in the 2020 operational report on the emergency room monitoring system for heat-related illnesses by Soo-kyung Lee et al. [32] of the Korea Disease Control and Prevention Agency, indicators of heat-related illness and estimated deaths over the past five years were considered, and data from the Korea Meteorological Administration Open Weather Data Portal [33] on days of heat waves over the last 5 years were applied. The levels of each attribute of the results were commonly represented by three stages: low (remaining constant), medium (partial improvement), and high (complete improvement). In addition, in order to increase the respondents’ understanding and immersion in the survey, contents consistent with the level of attributes were briefly described, and in tandem, related pictures were designed and expressed. In terms of the offered price, the means of payment was charges and the payment method applied was annual payment. The levels of annual charges were ultimately selected as USD 13.42, USD 23.48, and USD 33.54 in consideration of medical service fees and status of medical benefits for heat-related illnesses from the Health Insurance Review & Assessment Service [34], and the results of WTP estimation in previous studies [10,11,14,17,35,36,37].
In order to increase the objectivity of the attributes and levels constituted through this series of processes and the research design of the offered price, feasibility was secured by a preliminary survey and analysis conducted by collecting 60 sets of responses to questionnaires. The attributes and levels of environmental problem improvements ultimately applied in this study are presented in Figure 1.
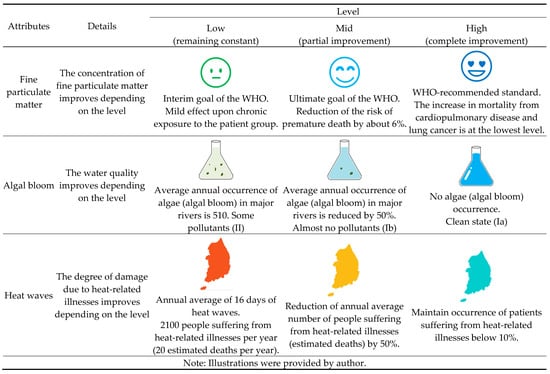
Figure 1.
Attributes and levels of improving Environmental problems.
3.2. Design and Composition of Choice Alternative Sets
In order to conduct a CE, choice sets are derived so that alternatives composed of various conditions of corresponding attributes and levels can affect the choice probability of respondents. Since this study consists of four attributes including price, where three stages constitute the levels of each attribute, a total of 81 choice alternatives can be created (by calculating it as 34). However, since it is impossible to obtain answers by presenting all of these choices to respondents, a minimum set of choices should be derived so that model estimation is possible while minimizing loss of explanatory power. Therefore, orthogonal main effects design is used to ensure orthogonality among individual attributes and to derive a reasonable number of alternatives. This mitigates the disadvantage of high correlation between attributes in the random utility model [38].
Following the results of orthogonal design using SAS to form a reasonable set of choice alternative sets, the D-efficiency of fine particulate matter, algal bloom, heat waves, and prices of annual charges were all 100. The optimal number of reasonable alternatives (18) with the lowest mean prediction error value (0.71), was derived. This was again derived as a set of nine pairs of choice sets composed of two choice alternatives. In addition, in order to reduce the cognitive burden of respondents, the questionnaire was classified into Type-A, B, and C by block design, and composed so that only three pairs of choice sets would be presented to all individual respondents. In real situations, consumers sometimes forfeit their choices without preferring any alternative. Since such respondents should be considered, the non-choice selection, “neither choice selected” was included in the choice set. This is a necessary factor for the parameter estimation of the alternative specific constant (ASC), which allows for the identification of whether respondents prefer or are uninterested in alternatives [39]. In order to facilitate understanding, a case of choice sets used in this study is presented in Figure 2.
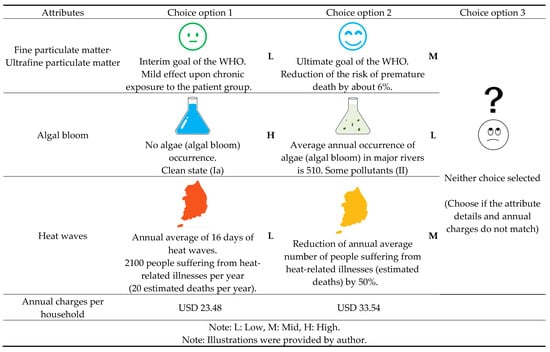
Figure 2.
Example of choice set.
3.3. Application of Choice Experiment
The choice experiment (CE) is theoretically based on Hanemann’s [40] discrete choice model and McFadden’s [41] random utility model. Quantitative methods of estimating the parameters of attribute variables in CE include the conditional logit model, mixed logit model, and latent class model. The methods differ in that they estimate a singular number of points, a distribution with continuous values, and multiple number points when estimating parameters [21]. Among them, the conditional logit model devised by McFadden [41] provided a statistical framework for modeling how the attributes and levels of the corresponding goods affect respondents’ choice probability. The random utility theory forms the most basic foundation for the conditional logit model. The probability utility model divides, in relation to selection, the standardized utility part, which can actually be measured, and the unobservable error part. The existence of errors indicates that the choice of a particular alternative can be expressed probabilistically. The indirect utility function that the individual respondent i can obtain from the choice alternative j within the choice alternative set can be expressed as Equation (1) below.
The utility function consists of the definite part and the probability part is an observable standardized indirect utility function; is the current choice alternative; and is the demographic characteristic of the respondent . , an unobservable probabilistic error, indicates utility that cannot be explained by the characteristics of goods and is the basis for the maximum likelihood method.
With all other conditions constant, if respondent satisfies for all alternatives, except for alternative within choice alternative set , choice will be chosen. This indicates that the utility for when j is chosen is greater than when is chosen. In this case, the probability equation in which the respondent chooses the choice alternative may be presented by the following Equation (2).
In order to estimate Equation (2), an assumption of the distribution of error terms is necessary. Multinomial logit or conditional logit models were mainly used at the initial emergence of the CE. This is because parameter estimation is facilitated by assuming that the probability error in Equation (1) follows the identical type I extreme distribution [41]. In this case, the probability that the respondent i chooses the choice alternative is expressed as the following Equation (3).
Multinomial responses of each respondent collected through questions from the CE can be interpreted as choice results for maximizing the utility of respondents. The results of the choices of individual respondents , to whom the CE questions are asked, regarding the choice alternative are either “yes” or “no”. The log-likelihood function to which this is applied is expressed as the following Equation (4).
In this equation, represents the number of respondents, and Figure 2 represents the number of alternatives. Further, respondent chooses the th alternative) and is the indicator function. In other words, is 1 when the th respondent chooses the th choice alternative, and is otherwise 0. When the maximum likelihood method is applied to Equation (4), values of necessary parameters can be estimated [42]. The observable part of the indirect utility function can be expressed in a linear function as presented in the following Equation (5).
Here, are individual attribute vectors, and is the coefficient of individual attributes, which are parameters to be estimated through the model. After substituting Equation (5) for Equation (3), and substituting this again for Equation (4), then applying the maximum likelihood method, the identical estimate can be obtained.
Next, the MWTP for each attribute can be derived by applying Roy’s identity to Equation (5). In other words, the MWTP for an increase (improvement) by one unit from the current level for the individual benefit attribute variables constituting the goods can be obtained by a total differentiation of Equation (5). This can be expressed by the following Equation (6).
4. Empirical Analysis
4.1. Data
The population of this study comprises evaluators of the benefits of environmental improvement. These consist of adults aged 20 or older in South Korea who pay annual charges per household and reside in the metropolitan area (Seoul, Gyeonggi) or metropolitan cities (Busan, Daegu, Incheon, Gwangju, Daejeon, and Ulsan). Specifically, the units of the sample are general households, and subjects of the survey were limited to heads of households and their spouses. The sampling was conducted by the convenience sampling method considering household proportional allocation by region based on the number of resident-registered households by administrative district (city, county, district) aggregated in the resident registration population status of Statistics Korea (2021) as of October 2021. The data was collected from 6 December to 13 December 2021. Of the total 774 copies of the questionnaire ultimately collected, 690 copies (Type-A: 230 copies, Type-B: 230 copies, Type-C: 230 copies) comprising the effective sample were used in this analysis, excluding 84 copies, which were incomplete. The demographic characteristics of the sample used in the analysis of the study are presented in Table 1 below.

Table 1.
Demographic profiles (n = 690).
First, priorities were surveyed by open-ended questions to identify the perception of the sample regarding environmental problems to be resolved first. According to the results, the frequency of responses to fine particulate matter as the first priority was highest at 604 (87.5%) respondents, and responses to heat waves as the second priority was highest at 436 (63.2%) respondents. The frequency of responses to algal bloom as the third priority was highest at 400 (58.0%) responses, and other suggested responses included heavy rain, extreme cold, and marine pollution. These results are presented in Table 2 below.
Table 2.
Recognition of Environmental Problems.
4.2. Results of Estimation by Conditional Logit Model
First, fine particulate matter (PM), algal bloom (ALGAE), and heat waves (HEAT) are classified into low (L), medium (M), and high (H), respectively, depending on the degree of improvement. Attributes by level are expressed as dummy variables. Among each attribute, the lowest level (L) and the annual charges per household were set as reference alternatives for the current state. The choice alternative variable (ALT) is a dummy variable that sets the reference alternative as 1 and other alternatives as 0. While it affects the choice of alternatives, it is used as an alternative constant representing the collective influence of variables excluded from the model. The presented annual charges per household (BID) is a ratio scale. Age, education, and income among demographic characteristics were input to the ratio scale. The gender was set as “1” for male, and “0” for female. Marital status was set as “1” for marriage, and “0” otherwise. As for jobs, “1” was set as white-collar jobs for managerial/office workers, public servants, and educational positions, while “0” was coded for other jobs. The variable names and coded contents input to the conditional logit model for estimating the economic value of improving environmental problems are presented in the following Table 3.
Table 3.
Definitions and codes of variables.
This study estimated the conditional logit model in two forms. Model 2 is an extended model in which the interaction term between the ASC and the demographic characteristic variable are input to identify the effect of variables that cannot be explained only by the improvement alternative of the basic model (Model 1). The number of observations, 2070, is determined by the number of respondents (690) and the number of choice alternatives presented to individual respondents. In this study, nine sets of choice alternatives were classified into three types (Type-A, B, and C), and three choice alternatives were presented for each type. First, a test on the offered price (BID) must theoretically always derive a negative (−) sign, and as the offered price (BID) demonstrates significant negative (−) influence at the 1% significance level in both models, this study evaluates the models to be theoretically valid. Therefore, the estimation results for Model 2 are evaluated in this study.
According to the estimation results, among the attribute variables, algal bloom (ALGAE) did not demonstrate statistically significant influence regardless of the level. The remaining fine particulate matter and heat wave variables demonstrated significant positive (+) influence at the 1% level. This implies that when the levels of these attributes increase, the probability of choosing choice alternatives increases relative to the current level. In other words, as fine particulate matter and heat waves improve, consumer utility increases. Demographic variables were input to the model in the form of the product of ASC and individual variables to reflect the heterogeneity of preferences. Marital status (p < 0.01) and jobs (p < 0.10) showed significant influence, indicating that the preference for the combinations of improvements of environmental problems was higher for those married than unmarried, and those working in non-white collar jobs. The results are presented in Table 4 below.
Table 4.
Estimates of conditional logit models.
4.3. Estimation of Marginal Willingness to Pay
The marginal willingness to pay (MWTP) refers to the increase in value as the level of each attribute is additionally improved or increased by one unit. The sum of the MWTPs for attributes produces the total value of the non-market good. The estimation results of the MWTP derived by the application of the conditional logit model are presented in Table 5 below. According to the t-value of the MWTP for individual attributes, the improvement of fine particulate matter to the medium level alone can significantly positively affect the change in value. For algal bloom, the change in value was not statistically significant for any level of improvement. For heat waves, the change in value due to its improvement to the medium level was found to be significant but bearing a negative (−) sign.
Table 5.
Estimates of implicit prices.
Specifically, if fine particulate matter level improves to where the WHO’s final goal of reducing the risk of premature death by approximately 6% is achievable, each household would pay KRW 25,059 per year. However, KRW 5737 would be paid for an improvement to the highest level in terms of the increase in mortality rates from cardiopulmonary disease and lung cancer, which matches the lowest level as per the WHO-recommended standard, but this was not statistically significant.
The improvement of algal bloom refers to an improvement from the current state in which there is an annual average of 510 occurrences of algae (algal bloom) in major rivers with some pollutants, to the medium stage where there is a 50% reduction in algae (algal bloom) with little pollutants, and then to a clean state where there are no algae (algal bloom). As no significant value appears for any level of improvement in the attributes of algal bloom, the WTP for improvement thereof is considered to be “0.”
Heat waves occur on an average of 16 days per year, and if the current state with approximately 2100 patients suffering from heat-related illnesses and 20 estimated deaths is improved to the medium level where the number of patients suffering from heat-related illnesses and estimated deaths are reduced by 50%, there will in fact be a loss in value by USD 13.33. In addition, it was found that a loss in value by USD 2.74 occurs for the improvement to a high level where the occurrence of patients suffering from heat-related illnesses is maintained below 10%, but this was not statistically significant.
If the MWTP of an attribute that is not statistically significant is set as “0”, the value of improving environmental problems is estimated to be USD 7.69. This amount refers to a charge that residents, within the scope of direct or indirect benefits of the improvement of environmental problems, are willing to pay annually per household. Assuming improvement from the current level to the medium or high level, consumers attributed the highest value to the improvement of fine particulate matter among related parameters.
5. Conclusions
This study was conducted for the purpose of providing socioeconomic data by quantitatively identifying the economic value of improvements in managing environmental problems caused climate change. CE was applied as the research method to achieve the purpose of the study. Fine particulate matter, algal bloom, and heat waves were selected as individual attributes constituting environmental problems, and the levels of improvement from the current state, in accordance with the characteristics of each issue, were commonly represented by three stages: low, medium, and high. This study is significant in that it presented in an integrated manner the environmental problems emerging as major issues to reflect their priorities and importance, and evaluated their values by distinguishing each attribute by level. This data will be important for establishing effective budget input strategies that can maximize consumer benefits and policies through more detailed and strategic goals to achieve net-zero carbon emissions and the SDGs under given budget constraints.
The summary and implications of this study are as follows. The conditional logit model was applied as a statistical model for estimating the WTP. According to the results, both fine particulate matter and heat wave variables among attribute variables demonstrated significant positive (+) influence at the 1% level, and algal bloom was not statistically significant regardless of the level. This indicates that the probability of choosing alternatives increases relative to the current level when the levels of improvement in fine particulate matter and heat waves increase, and consumer utility increases as the attributes improve. In addition, among the demographic variables, marital status and jobs demonstrated significant influence. The preference for the combinations of improvements in environmental problems was higher for those married than unmarried, and those working in non-white collar jobs.
The MWTP, which refers to the increase in value resulting from an additional improvement of the level of an attribute by one unit, was estimated using the conditional logit model estimation results. If fine particulate matter is improved to a level where the WHO’s final goal of reducing the risk of premature death by approximately 6% is achievable, each household would pay USD 21.01 per year. However, there was found to be no WTP for improvement to a higher level (WHO-recommended standard). As there seems to be satisfaction with improvement to a medium level, but neither expectation nor resistance to further improvement, reasonable policy goals and budget investment policies should be established for improving the fine particulate matter environment. It was found that WTP could not be induced for any level of improvement in algal bloom. It may be interpreted that consumers do not find value in reducing the number of algal bloom occurrences and improving pollutants to the point where they would invest money at the present state. This may have arisen from recognizing the current annual average frequency of algae (algal bloom) occurrence in major rivers and the state where some pollutants are present as already having been improved. This result also indicates satisfaction with the current state, while also suggesting that an adjustment of level settings may be necessary. It was found that if the heat waves are improved to the medium level where the number of heat-related illnesses and estimated deaths decreases by 50% compared to the current level, there will be in fact a loss in value by USD 13.33, with there being no WTP for improvement to a higher level (maintaining the occurrence of patients suffering from heat-related illnesses below 10%). It can be interpreted that consumers do not expect the moderate improvement of heat waves and do not agree with budget investments for such efforts. This indicates no expectation of improvement at the current level if the amount is compensated in terms of the WTA, and there will be resistance if a charge is levied for more improvement than necessary. Ultimately, the value of improving environmental problems is USD 7.69, and among the attributes, consumers ascribed the highest value to the improvement of fine particulate matter.
The results of this study were different from those of previous studies conducted with algal bloom and heat waves among environmental problems as single attributes [10,11,15,18,36]. Furthermore, the WTP was evaluated to be relatively high compared to the research results of the USD 4.69 of Kim et al. [14] and USD 5.84–6.06 of Cho and Cho [12], which estimated the value of fine particulate matter as a single attribute. This result is deemed to illustrate the greater importance of fine particulate matter compared to the issues of algal bloom and heat waves. Fine particulate matter was designated by the WHO in 2019 as a first-class carcinogen along with asbestos and benzene, and its impact is compelling in Asia, where industrialization in developing countries is rapidly progressing. In addition, there are significant amount of research conducted air pollution management in China [43,44,45]. The results of this study are consistent with this reality in that the value of fine particulate matter improvement was USD 21.01 per household, demonstrating the criticality of the issue. These results suggest the possibility of excessive expenditure in case budgets are invested for each single environmental issue. A reasonable cost policy strategy accounting for relative priorities and importance under given budget constraints is necessary. In addition, it is believed that strategic policy goals and detailed implementation indicators for fine particulate matter in terms of the environment, need to be supplemented for the SDGs.
Despite such academic significance and implications, surveys were conducted to collect data for this study in the winter, a season where the fine particulate matter concentration is high. This cannot rule out the possibility that respondents of the survey considered the fine particulate matter problem to be a more important factor. Therefore, follow-up studies reflecting seasonality are necessary. In addition, as this study was conducted only locally, limited to cases in South Korea; research should be continuously conducted through the derivation and level-setting of various environmental problem attributes reflecting the regional characteristics and status of each country.
Author Contributions
H.-j.K. and Y.L. contributed to the design and development of this research. H.-j.K. constructed CE survey questionnaire and estimated the CE model. Y.L. provided environmental policy guidelines to build CE scenarios for the model and supervised this research. The bulk of the manuscript was written by H.-j.K. and Y.L. All authors have read and agreed to the published version of the manuscript.
Funding
This research was funded by a National Research Foundation of Korea Grant funded by the Korean Government (NRF-2019S1A5C2A03082527). This work was supported by the Sun Moon University Research Grant of 2014.
Institutional Review Board Statement
Not applicable.
Informed Consent Statement
Not applicable.
Data Availability Statement
Not applicable.
Acknowledgments
The authors thank the Global Sustainable Development Economic Institute (GSEI) and Sunmoon University for providing generous in-kind support to continue this research. In addition, the construction comments from six anonymous reviewers greatly helped improve this paper.
Conflicts of Interest
The authors declare no conflict of interest.
References
- Stocker, T. (Ed.) The Physical Science Basis. Working Group I contribution to the Fifth assessment report of the Intergovernmental Panel on Climate Change. In Climate Change; Cambridge University Press: Cambridge, UK, 2013; p. 2014. [Google Scholar]
- Rim, C. The Direction of the Korean Disaster Insurance Law Mechanism for Adaptation to Climate Change. KIJ 2016, 107, 1–50. [Google Scholar] [CrossRef]
- Lee, Y.; Yoon, T.; Woo, J. Text Big Data Analysis on Environmental Problems and Civil Education Focused on Water Quality and Algae. Assoc. Glob. Stud. Edu. 2020, 12, 3–28. [Google Scholar] [CrossRef]
- Jin, D.Y.; Kang, S.W.; Choi, H.S.; Han, K.J.; Kim, D.Y. A Study on the Utilization of Text Mining for Climate Environmental Issues Analysis. J. Clim. Environ. Policy Res. 2018, 2018, 1–152. [Google Scholar]
- Youn, J.-S.; Ban, Y.-U.; Baek, J.-I. Setting Priorities for Urban Planning Strategies in Integrated Response to Climate Change through Expert Survey. In Korean Urban Management Association Collection of Theses for Academic Presentation Competition; Korean Urban Management Association: Seoul, Korea, 2014; pp. 381–391. [Google Scholar]
- Park, J.; Park, J.; Chae, Y. Attributable Mortality Risk Comparison of National Warning System Criteria: Focusing on Heat-Wave and Particulate Matter. Jepa 2020, 28, 147–179. [Google Scholar] [CrossRef]
- Ministry of the Environment. Establishment of Standard Manual for Crisis Management of Highly Concentrations of Fine Particulate Matter; Ministry of the Environment: Sejong, Korea, 2019; Volume 15, press release.
- Ahn, S.-e.; Kim, J.; Cho, Y.; Eum, Y.; Kwak, S.; Bae, H.-J. Assessment of Human Health Effects of Air-Pollution Using Cohort DB and Estimation of Associated Economic Costs in Korea (Ⅲ); Project Report; Korea Environment Institute: Sejong, Korea, 2017; pp. 1–130. [Google Scholar] [CrossRef]
- Oh, H.K.; Lee, H.C. Estimating the Economic Value of Dams against Climate Change Risk—A Case Study on Paldang Lake. Crisisonomy 2016, 12, 69–84. [Google Scholar]
- Lee, S.; Sin, H.; Kim, D. Economic Valuation of Statistical Life in Life Loss of Heat Waves Attributed to the Climate Change. Korean J. Health Econ. Policy 2016, 22, 51–78. [Google Scholar]
- Cho, Y.; Jin, S.; Choi, H.; Ryu, M.; Yoo, S. Estimation of the Aesthetic and Environmental Costs of Algal Bloom. Jepa 2016, 24, 227–246. [Google Scholar] [CrossRef]
- Cho, E.; Cho, Y. Estimating the Economic Value of Ultrafine Particles Information: A Contingent Valuation Method. arXiv 2021, arXiv:2107.03034. [Google Scholar]
- Jin, Y.; Andersson, H.; Zhang, S. Do Preferences to Reduce Health Risks Related to Air Pollution Depend on Illness Type? Evidence from a Choice Experiment in Beijing, China. J. Environ. Econ. Manag. 2020, 103, 102355. [Google Scholar] [CrossRef]
- Kim, J.H.; Kim, H.J.; Yoo, S.H. Public Value of Enforcing the PM2. 5 Concentration Reduction Policy in South Korean Urban Areas. Sustainability 2018, 10, 1144. [Google Scholar] [CrossRef] [Green Version]
- Ofori, R.O.; Rouleau, M.D. Willingness to Pay for Invasive Seaweed Management: Understanding How High and Low Income Households Differ in Ghana. Ocean Coast. Manag. 2020, 192, 105224. [Google Scholar] [CrossRef]
- Taylor, T.; Longo, A. Valuing Algal Bloom in the Black Sea Coast of Bulgaria: A Choice Experiments Approach. J. Environ. Manag. 2010, 91, 1963–1971. [Google Scholar] [CrossRef] [PubMed]
- Yoo, S.H.; Kwak, S.J.; Lee, J.S. Using a Choice Experiment to Measure the Environmental Costs of Air Pollution Impacts in Seoul. J. Environ. Manag. 2008, 86, 308–318. [Google Scholar] [CrossRef] [PubMed]
- Zhang, L.; Fukuda, H.; Liu, Z. Households’ Willingness to Pay for Green Roof for Mitigating Heat Island Effects in Beijing (China). Build. Environ. 2019, 150, 13–20. [Google Scholar] [CrossRef]
- Weisbrod, B.A. Collective-Consumption Services of Individual-Consumption Goods. Q. J. Econ. 1964, 78, 471–477. [Google Scholar] [CrossRef]
- Krutilla, J.V. Conservation Reconsidered. Am. Econ. Rev. 1967, 57, 777–786. [Google Scholar]
- Koo, J.-C. Preferences of Urban Dwellers on Attributes of Urban Forest in South Korea Using Choice Experiment. Ph.D. Thesis, Graduate School of Seoul National University, Seoul, Korea, 2013. [Google Scholar]
- Adamowicz, W.; Louviere, J.; Williams, M. Combining Revealed and Stated Preference Methods for Valuing Environmental Amenities. J. Environ. Econ. Manag. 1994, 26, 271–292. [Google Scholar] [CrossRef]
- Nthambi, M.; Markova-Nenova, N.; Wätzold, F. Quantifying Loss of Benefits from Poor Governance of Climate Change Adaptation Projects: A Discrete Choice Experiment with Farmers in Kenya. Ecol. Econ. 2021, 179, 106831. [Google Scholar] [CrossRef]
- Rolfe, J.; Scarborough, H.; Blackwell, B.; Blackley, S.; Walker, C. Estimating Economic Values for Beach and Foreshore Assets and Preservation against Future Climate Change Impacts in Victoria, Australia. Australas. J. Environ. Manag. 2021, 28, 169–187. [Google Scholar] [CrossRef]
- Hynes, S.; Chen, W.; Vondolia, K.; Armstrong, C.; O’Connor, E. Valuing the Ecosystem Service Benefits from Kelp Forest Restoration: A Choice Experiment from Norway. Ecol. Econ. 2021, 179, 106833. [Google Scholar] [CrossRef]
- Srisawasdi, W.; Tsusaka, T.W.; Winijkul, E.; Sasaki, N. Valuation of Local Demand for Improved Air Quality: The Case of the Mae Moh Coal Mine Site in Thailand. Atmosphere 2021, 12, 1132. [Google Scholar] [CrossRef]
- Van Khuc, Q.; Nong, D.; Phu, T.V. Willingness-to-Pay for Reducing Air Pollution in the World’s Most Dynamic Cities: Evidence from Hanoi, Vietnam; OSF Prepints pume6, Center for Open Science; 2020; Available online: https://www.researchgate.net/publication/346900604_Willingness-to-pay_for_reducing_air_pollution_in_the_world’_most_dynamic_cities_Evidence_from_Hanoi_Vietnam (accessed on 8 January 2022). [CrossRef]
- Guo, D.; Wang, A.; Zhang, A.T. Pollution Exposure and Willingness to Pay for Clean Air in Urban China. J. Environ. Manag. 2020, 261, 110174. [Google Scholar] [CrossRef] [PubMed]
- World Health Organization. Air Quality Guidelines: Global Update 2005: Particulate Matter, Ozone, Nitrogen Dioxide, and Sulfur Dioxide; World Health Organization: Geneva, Switzerland, 2006.
- National Institute of Environmental Research. National Water Quality Evaluation Report. 2020. Available online: https://nier.go.kr/NIER/kor/cm/nier-cm-1101.do?menuNo=19200 (accessed on 20 November 2021).
- Water Environment Information System. Annual Report on Algae (Algal Bloom) Occurrences and Responses. 2020. Available online: http://water.nier.go.kr/mobile/board/2/1497/?pMENU_NO=180 (accessed on 15 August 2021).
- Lee, S.; Kim, S.; Yoo, H.; Joe, W. Analysis of Heat-Related Illness Surveillance in 2019. Public Health Wkly. Rep. 2020, 13, 2199–2215. [Google Scholar]
- Open Weather Data Portal. Heat Waves—Dataset. Available online: https://data.kma.go.kr/data/weatherIssue/slthtList.do?pgmNo=690 (accessed on 20 November 2021).
- Health Insurance Review & Assessment Service. Heat Starts in Earnest in August—Watch Out for Heat-Related Illnesses! [Press Release]. Available online: http://www.hira.or.kr/bbsDummy.do?pgmid=HIRAA020041000100&rdScnBltNo=4&brdBltNo=10385 (accessed on 27 July 2021).
- Eom, Y.S.; Oh, H. Health Risks from Particulate Matters (PM10) and Averting Behavior: Evidence from the Reduction of Outdoor Leisure Activities. Korean J. Econ. Stud. 2019, 67, 39–70. [Google Scholar]
- Oh, H.K.; Lee, H.C.; Cha, J.Y. Estimating the Value of Water Quality Improvement Using the Contingent Valuation Method: A Case Study on Bloom Forming Algae. J. Environ. Policy Admin. 2015, 23, 115–135. [Google Scholar] [CrossRef]
- Lee, H.-C. Valuing the Gyung-an Stream Space Using a Choice Experiment. J. Tour. Sci. 2015, 39, 47–60. [Google Scholar] [CrossRef]
- Hanley, N.; Wright, R.E.; Adamowicz, V. Using Choice Experiments to Value the Environment. Environ. Resour. Econ. 1998, 11, 413–428. [Google Scholar] [CrossRef]
- Hensher, D.A.; Rose, J.M.; Rose, J.M.; Greene, W.H. Applied Choice Analysis: A Primer; Cambridge University Press: Cambridge, UK, 2005. [Google Scholar]
- Hanemann, W.M. Discrete/Continuous Models of Consumer Demand. Econometrica 1984, 52, 541–561. [Google Scholar] [CrossRef]
- McFadden, D. The Measurement of Urban Travel Demand. J. Public Econ. 1974, 3, 303–328. [Google Scholar] [CrossRef]
- Greene, W.H. Econometric Analysis; Prentice Hall International. Inc.: New York, NY, USA, 2000. [Google Scholar]
- Zeng, X.; Zhu, Y.; Chen, C.; Tong, Y.; Li, Y.; Huang, G.; Wang, X. A production-emission nexus based stochastic-fuzzy model for identification of urban industry-environment policy under uncertainty. J. Clean. Prod. 2017, 154, 61–82. [Google Scholar] [CrossRef]
- Chen, C.; Zeng, X.; Huang, G.; Yu, L.; Li, Y. Robust planning of energy and environment systems through introducing traffic sector with cost minimization and emissions abatement under multiple uncertainties. Appl. Sci. 2019, 9, 928. [Google Scholar] [CrossRef] [Green Version]
- Gao, G.; Zeng, X.; An, C.; Yu, L. A sustainable industry-environment model for the identification of urban environmental risk to confront air pollution in Beijing, China. Sustainability 2018, 10, 962. [Google Scholar] [CrossRef] [Green Version]
Publisher’s Note: MDPI stays neutral with regard to jurisdictional claims in published maps and institutional affiliations. |
© 2022 by the authors. Licensee MDPI, Basel, Switzerland. This article is an open access article distributed under the terms and conditions of the Creative Commons Attribution (CC BY) license (https://creativecommons.org/licenses/by/4.0/).