
Radon in Indoor Air: Towards Continuous Monitoring


 ,
,  and
and 
Abstract
:1. Introduction
2. Materials and Methods
2.1. Sampling Sites
2.2. Radon Monitors and Sampling
2.3. Data Analysis
3. Results and Discussion
4. Conclusions
Author Contributions
Funding
Institutional Review Board Statement
Informed Consent Statement
Data Availability Statement
Acknowledgments
Conflicts of Interest
References
- Feng, T.; Lu, X. Natural radioactivity, radon exhalation rate and radiation dose of fly ash used as building materials in Xiangyang, China. Indoor Built Environ. 2016, 25, 626–634. [Google Scholar] [CrossRef]
- WHO. WHO Handbook on Indoor Radon: A Public Health Perspective; World Health Organization: Geneva, Switzerland, 2009. [Google Scholar]
- Lacchia, A.R.; Schuitema, G.; Banerjee, A. “Following the Science”: In Search of Evidence-Based Policy for Indoor Air Pollution from Radon in Ireland. Sustainability 2020, 12, 9197. [Google Scholar] [CrossRef]
- Yang, S.; Goyette Pernot, J.; Hager Jörin, C.; Niculita-Hirzel, H.; Perret, V.; Licina, D. Radon Investigation in 650 Energy Efficient Dwellings in Western Switzerland: Impact of Energy Renovation and Building Characteristics. Atmosphere 2019, 10, 777. [Google Scholar] [CrossRef] [Green Version]
- Baltrėnas, P.; Grubliauskas, R.; Danila, V. Seasonal Variation of Indoor Radon Concentration Levels in Different Premises of a University Building. Sustainability 2020, 12, 6174. [Google Scholar] [CrossRef]
- Chen, J.; Harley, N.H. A review of indoor and outdoor radon equilibrium factors—Part I: 222Rn. Health Phys. 2018, 115, 490–499. [Google Scholar] [CrossRef]
- Kellenbenz, K.R.; Shakya, K.M. Spatial and temporal variations in indoor radon concentrations in Pennsylvania, USA from 1988 to 2018. J. Environ. Radioact. 2021, 233, 106594. [Google Scholar] [CrossRef]
- ICRP. The 2007 Recommendations of the International Commission on Radiological Protection. ICRP publication 103. Ann. ICRP 2007, 37, 1–332. [Google Scholar] [CrossRef]
- Branco, P.T.B.S.; Alvim-Ferraz, M.C.M.; Martins, F.G.; Sousa, S.I.V. The microenvironmental modelling approach to assess children’s exposure to air pollution—A review. Environ. Res. 2014, 135, 317–332. [Google Scholar] [CrossRef] [Green Version]
- Branco, P.T.B.S.; Alvim-Ferraz, M.C.M.; Martins, F.G.; Sousa, S.I.V. Quantifying indoor air quality determinants in urban and rural nursery and primary schools. Environ. Res. 2019, 176, 108534. [Google Scholar] [CrossRef]
- Spycher, B.D.; Lupatsch, J.E.; Zwahlen, M.; Röösli, M.; Niggli, F.; Grotzer, M.A.; Rischewski, J.; Egger, M.; Kuehni, C.E.; Group, S.P.O. Background ionizing radiation and the risk of childhood cancer: A census-based nationwide cohort study. Environ. Health Perspect. 2015, 123, 622–628. [Google Scholar] [CrossRef] [Green Version]
- Gordon, K.; Terry, P.D.; Liu, X.; Harris, T.; Vowell, D.; Yard, B.; Chen, J. Radon in Schools: A Brief Review of State Laws and Regulations in the United States. Int. J. Environ. Res. Public Health 2018, 15, 2149. [Google Scholar] [CrossRef] [PubMed] [Green Version]
- Ivanova, K.; Stojanovska, Z.; Djunakova, D.; Djounova, J. Analysis of the spatial distribution of the indoor radon concentration in school’s buildings in Plovdiv province, Bulgaria. Build. Environ. 2021, 204, 108122. [Google Scholar] [CrossRef]
- Bochicchio, F.; Žunić, Z.S.; Carpentieri, C.; Antignani, S.; Venoso, G.; Carelli, V.; Cordedda, C.; Veselinović, N.; Tollefsen, T.; Bossew, P. Radon in indoor air of primary schools: A systematic survey to evaluate factors affecting radon concentration levels and their variability. Indoor Air 2014, 24, 315–326. [Google Scholar] [CrossRef] [PubMed]
- Baloch, R.M.; Maesano, C.N.; Christoffersen, J.; Banerjee, S.; Gabriel, M.; Csobod, É.; de Oliveira Fernandes, E.; Annesi-Maesano, I.; Csobod, É.; Szuppinger, P.; et al. Indoor air pollution, physical and comfort parameters related to schoolchildren’s health: Data from the European SINPHONIE study. Sci. Total Environ. 2020, 739, 139870. [Google Scholar] [CrossRef] [PubMed]
- Kim, C.; Choi, D.; Lee, Y.G.; Kim, K. Diagnosis of indoor air contaminants in a daycare center using a long-term monitoring. Build. Environ. 2021, 204, 108124. [Google Scholar] [CrossRef]
- Sá, J.; Branco, P.; Alvim-Ferraz, M.; Martins, F.; Sousa, S. Evaluation of Low-Cost Mitigation Measures Implemented to Improve Air Quality in Nursery and Primary Schools. Int. J. Environ. Res. Public Health 2017, 14, 585. [Google Scholar] [CrossRef] [Green Version]
- Elísio, S.; Peralta, L. Development of a low-cost monitor for radon detection in air. Nucl. Instrum. Methods Phys. Res. Sect. A Accel. Spectrometers Detect. Assoc. Equip. 2020, 969, 164033. [Google Scholar] [CrossRef]
- USEPA. Passive Samplers for Investigations of Air Quality: Method Description, Implementation, and Comparison to Alternative Sampling Methods. 2014. Available online: http://nepis.epa.gov/Adobe/PDF/P100MK4Z.pdf (accessed on 14 December 2021).
- Martin-Martin, A.; Gutiérrez-Villanueva, J.; Munoz, J.; Garcia-Talavera, M.; Adamiec, G.; Iniguez, M. Radon measurements with a PIN photodiode. Appl. Radiat. Isot. 2006, 64, 1287–1290. [Google Scholar] [CrossRef]
- Di Carlo, C.; Lepore, L.; Gugliermetti, L.; Remetti, R. An inexpensive and continuous radon progeny detector for indoor air-quality monitoring. In WIT Transactions on Ecology and the Environment; Passerini, G., Borrego, C., Longhurst, J., Lopes, M., Barnes, J., Eds.; WIT Press: Aveiro, Portugal, 2019; pp. 325–333. [Google Scholar]
- Schieweck, A.; Uhde, E.; Salthammer, T.; Salthammer, L.C.; Morawska, L.; Mazaheri, M.; Kumar, P. Smart homes and the control of indoor air quality. Renew. Sustain. Energy Rev. 2018, 94, 705–718. [Google Scholar] [CrossRef]
- Sistema de Mobilidade e Transporte—Relatório de Caracterização e Diagnóstico. Revisão do Plano Diretor Municipal do Porto. Câmara Municipal do Porto. DMU. DMPU. DMPOT. February 2019. Porto, Portugal. pp. 48–49. 2019. Available online: https://pdm.cm-porto.pt/documents/63/71_PDMP_ECD_Sist_Mob_Transp.pdf (accessed on 5 January 2022).
- Portaria n.º 138-G/2021. Saúde e Ambiente e ação Climática. Diário da República—1.ª série, Nº126. 2021. Available online: https://dre.tretas.org/dre/4575131/portaria-138-G-2021-de-1-de-julho (accessed on 5 January 2022).
- Branco, P.T.B.S.; Nunes, R.A.O.; Alvim-Ferraz, M.C.M.; Martins, F.G.; Sousa, S.I.V. Children’s Exposure to Radon in Nursery and Primary Schools. Int. J. Environ. Res. Public Health 2016, 13, 386. [Google Scholar] [CrossRef] [Green Version]
- Airthings. Airthings Wave Radon—Simple and Smart Radon Detector. 2020. Available online: https://www.airthings.com/wave-radon (accessed on 19 October 2021).
- Radon FTLab. Radon FTLab RadonEye (BLE): SMART Radon Detector for Home Owner. 2020. Available online: http://radonftlab.com/radon-sensor-product/radon-detector/rd200/ (accessed on 19 October 2021).
- Radon FTLab. Radon FTLab, RadonEye Plus2 (BLE & Wi-Fi): “New” SMART Radon Detector for Home Owner. 2020. Available online: http://radonftlab.com/radon-sensor-product/radon-detector/new-rd200p-radon-detector/ (accessed on 19 October 2021).
- Plch, J. Radim Monitor: Radim 5B Instruction Manual. Prague, Czech Republic. 2012. Available online: https://manualzz.com/doc/12055980/ji-%C3%AD-plch-m.-eng.----smm (accessed on 5 January 2022).
- Studnička, F.; Štěpán, J.; Šlégr, J. Low-Cost Radon Detector with Low-Voltage Air-Ionization Chamber. Sensors 2019, 19, 3721. [Google Scholar] [CrossRef] [PubMed] [Green Version]
- Bayrak, A.; Barlas, E.; Emirhan, E.; Kutlu, Ç.; Ozben, C.S. A complete low cost radon detection system. Appl. Radiat. Isot. 2013, 78, 1–9. [Google Scholar] [CrossRef] [PubMed]
- Alvarellos, A.; Gestal, M.; Dorado, J.; Rabuñal, J.R. Developing a Secure Low-Cost Radon Monitoring System. Sensors 2020, 20, 752. [Google Scholar] [CrossRef] [PubMed] [Green Version]
- Sousa, S.I.; Branco, P.T.; Nunes, R.A.; Alvim-Ferraz, M.C.; Martins, F.G. Radon Levels in Nurseries and Primary Schools in Braganca District-Preliminary Assessment. J. Toxicol. Environ. Health A 2015, 78, 805–813. [Google Scholar] [CrossRef]
- Azara, A.; Dettori, M.; Castiglia, P.; Piana, A.; Durando, P.; Parodi, V.; Salis, G.; Saderi, L.; Sotgiu, G. Indoor Radon Exposure in Italian Schools. Int. J. Environ. Res. Public Health 2018, 15, 749. [Google Scholar] [CrossRef] [Green Version]
- Lopes, S.I.; Silva, J.; Antão, A.; Curado, A. Short-term characterization of the indoor air radon concentration in a XII century monastery converted into a school building. Energy Procedia 2018, 153, 303–308. [Google Scholar] [CrossRef]
- WHO. WHO Guidelines for Indoor Air Quality: Selected Pollutants; European Series; World Health Organization, WHO Regional office in Europe: Copenhagen, Denmark, 2010. [Google Scholar]
- USEPA. Radon in Schools. United States Environmental Protection Agency. 2021. Available online: https://www.epa.gov/radon/radon-schools (accessed on 5 January 2022).
- Martin, K.; Ryan, R.; Delaney, T.; Kaminsky, D.A.; Neary, S.J.; Witt, E.E.; Lambert-Fliszar, F.; Remy, K.; Sanford, S.; Grenoble, K.; et al. Radon From the Ground into Our Schools: Parent and Guardian Awareness of Radon. SAGE Open 2020, 10, 2158244020914545. [Google Scholar] [CrossRef] [Green Version]
- Dovjak, M.; Virant, B.; Krainer, A.; Zavrl, M.Š.; Vaupotič, J. Determination of optimal ventilation rates in educational environment in terms of radon dosimetry. Int. J. Hyg. Environ. Health 2021, 234, 113742. [Google Scholar] [CrossRef]
- Chojer, H.; Branco, P.T.B.S.; Martins, F.G.; Alvim-Ferraz, M.C.M.; Sousa, S.I.V. Development of low-cost indoor air quality monitoring devices: Recent advancements. Sci. Total Environ. 2020, 727, 138385. [Google Scholar] [CrossRef]
- Baldelli, A. Evaluation of a low-cost multi-channel monitor for indoor air quality through a novel, low-cost, and reproducible platform. Meas. Sens. 2021, 17, 100059. [Google Scholar] [CrossRef]
- Dwaikat, N.; Safarini, G.; El-hasan, M.; Iida, T. CR-39 detector compared with Kodalpha film type (LR115) in terms of radon concentration. Nucl. Instrum. Methods Phys. Res. Sect. A Accel. Spectrometers Detect. Assoc. Equip. 2007, 574, 289–291. [Google Scholar] [CrossRef]
- Burghele, B.D.; Botoș, M.; Beldean-Galea, S.; Cucoș, A.; Catalina, T.; Dicu, T.; Dobrei, G.; Florică, Ș.; Istrate, A.; Lupulescu, A.; et al. Comprehensive survey on radon mitigation and indoor air quality in energy efficient buildings from Romania. Sci. Total Environ. 2021, 751, 141858. [Google Scholar] [CrossRef] [PubMed]


| Building | Year of Construction | Room ID | Occupants’ Age Group | Floor | Area (m2) | Average Number of Occupants | Occupant Density (#/m2) | Occupancy Period |
|---|---|---|---|---|---|---|---|---|
| A | 1960s decade (renovations in 1999) | A_I | Infants | GF | 40 | 16 | 0.40 | 8:00–18:30 |
| A_P | Pre-schoolers | GF | 65 | 20 | 0.31 | 9:00–18:00 | ||
| B | 1960s decade (renovations in 2006–2007) | B_P | Pre-schoolers | GF | 40 | 18 | 0.45 | 9:00–18:00 |
| B_S1 | Primary school children | 1st | 40 | 11 | 0.28 | 9:00–17:15 | ||
| B_S2 | Primary school children | 2nd | 40 | 18 | 0.45 | 9:00–17:15 |
| Device/Reference Instrument | Price (€) | Sensor Type | Measurement Range (Bq/m3) | Minimum Time Resolution | Accuracy * | Internal Memory |
|---|---|---|---|---|---|---|
| Airthings Wave [26] | 189 | Passive diffusion chamber (using open photodiodes as semiconductor detectors) | 0–20,000 | 1 h | <5–10% at 200 Bq/m3 [a] | 1.5 years |
| RadonEye (RD200) [27] | ~200 | Impulse-counting ionization chamber | 7~3700 | 1 h | <±10% | 1 year |
| RadonEye +2 (RD200 P2) [28] | ~400 | Impulse-counting ionization chamber | 7~9435 | 1 h | ±10% | 1 year |
| Radim 5B [29] | 3783 | PIPS detector | 0–50,000 | 1 h | 5–20% [b] | 7 years |
| Room ID | Date of Measurements | Sampling Days |
|---|---|---|
| A_P | 6–8 April 2021 | 2 |
| A_I | 8–12 April 2021 | 4 |
| B_S2 | 19–23 March 2021 | 4 |
| B_P | 23–25 March 2021 | 2 |
| B_S1 | 13–15 April 2021 | 2 |
| Entire Period | Occupancy Period | ||||||||
|---|---|---|---|---|---|---|---|---|---|
| Room ID | Radim 5B | Wave | RD200 | RD200P2 | Radim 5B | Wave | RE | RD200P2 | |
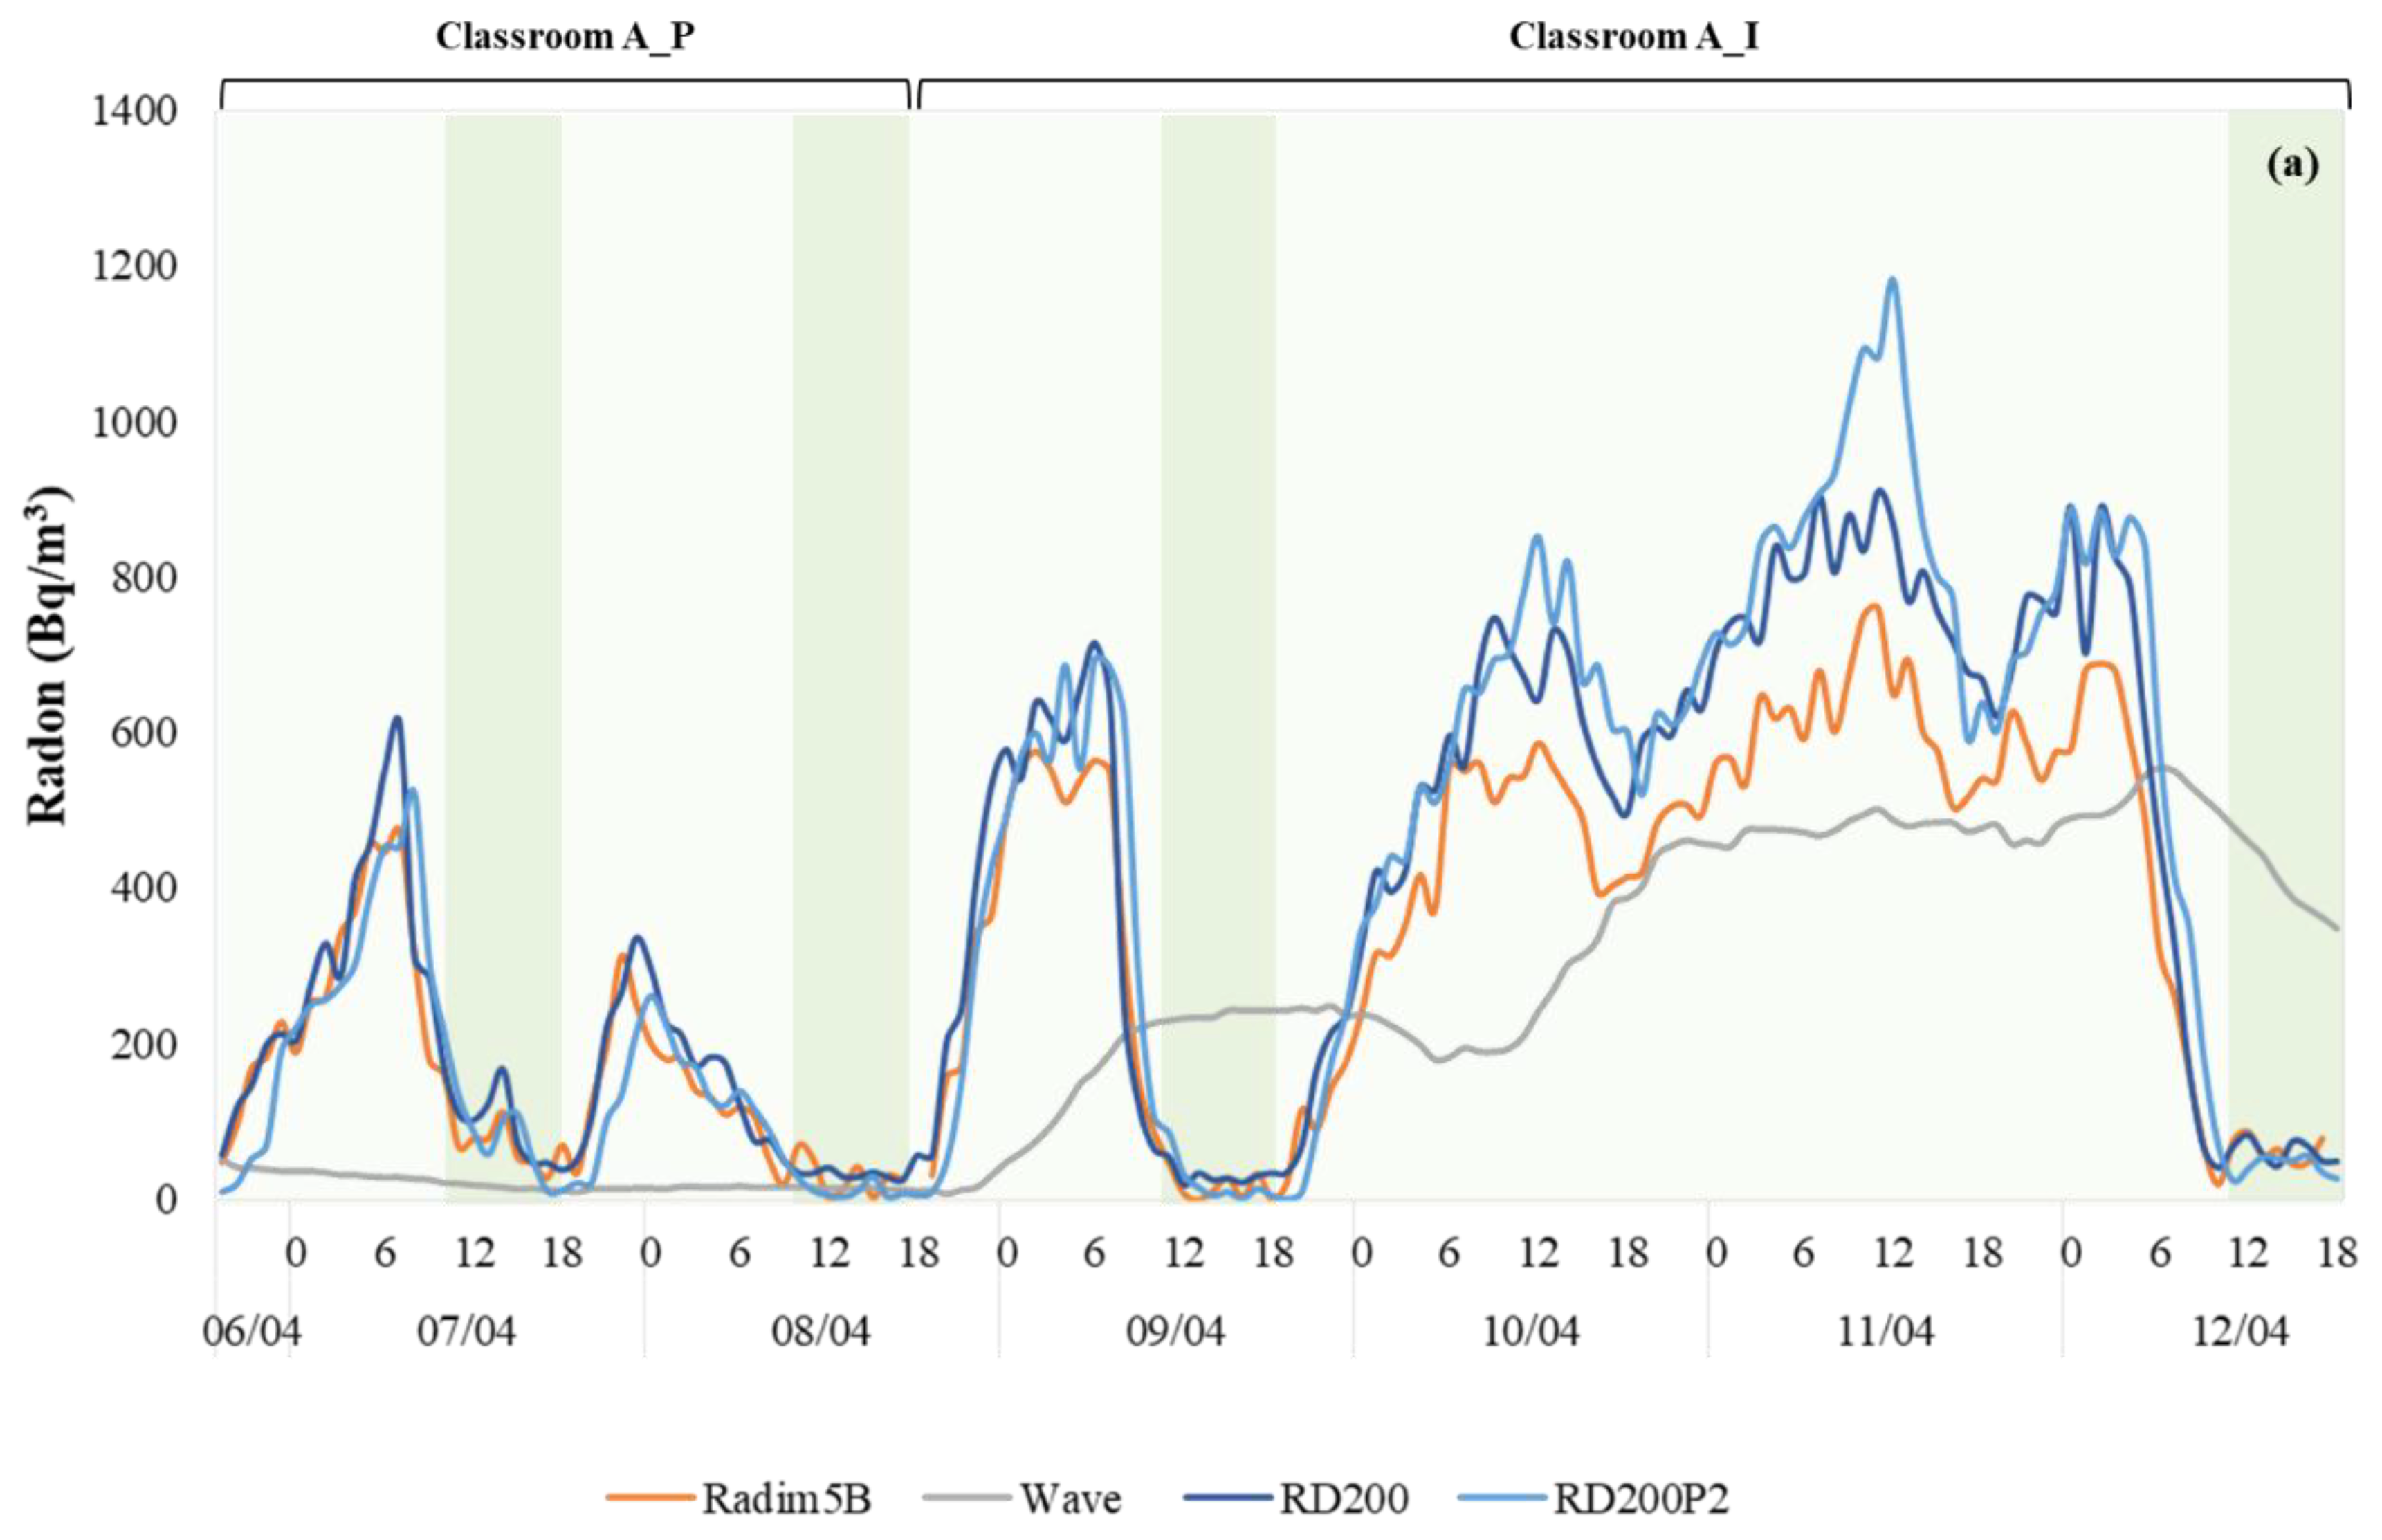
| A_P | min | 2.8 | 10.0 | 25.0 | 2.0 | 2.8 | 12.0 | 25.0 | 2.0 |
| max | 473.1 | 52.0 | 611.0 | 522.0 | 180.2 | 26.0 | 286.0 | 307.0 | |
| mean | 152.9 | 21.5 | 171.2 | 137.4 | 59.3 | 16.5 | 79.3 | 67.2 | |
| med | 121.1 | 16.0 | 135.0 | 105.5 | 49.3 | 15.5 | 47.0 | 39.5 | |
| A_I | min | 0.0 | 8.0 | 19.0 | 0.0 | 0.0 | 220.0 | 19.0 | 0.0 |
| max | 757.5 | 554.0 | 910.0 | 1181.0 | 149.2 | 515.0 | 119.0 | 276.0 | |
| mean | 391.5 | 333.1 | 489.4 | 517.9 | 48.0 | 330.3 | 51.7 | 57.7 | |
| med | 492.8 | 374.0 | 596.0 | 601.0 | 47.9 | 243.0 | 49.0 | 39.0 | |
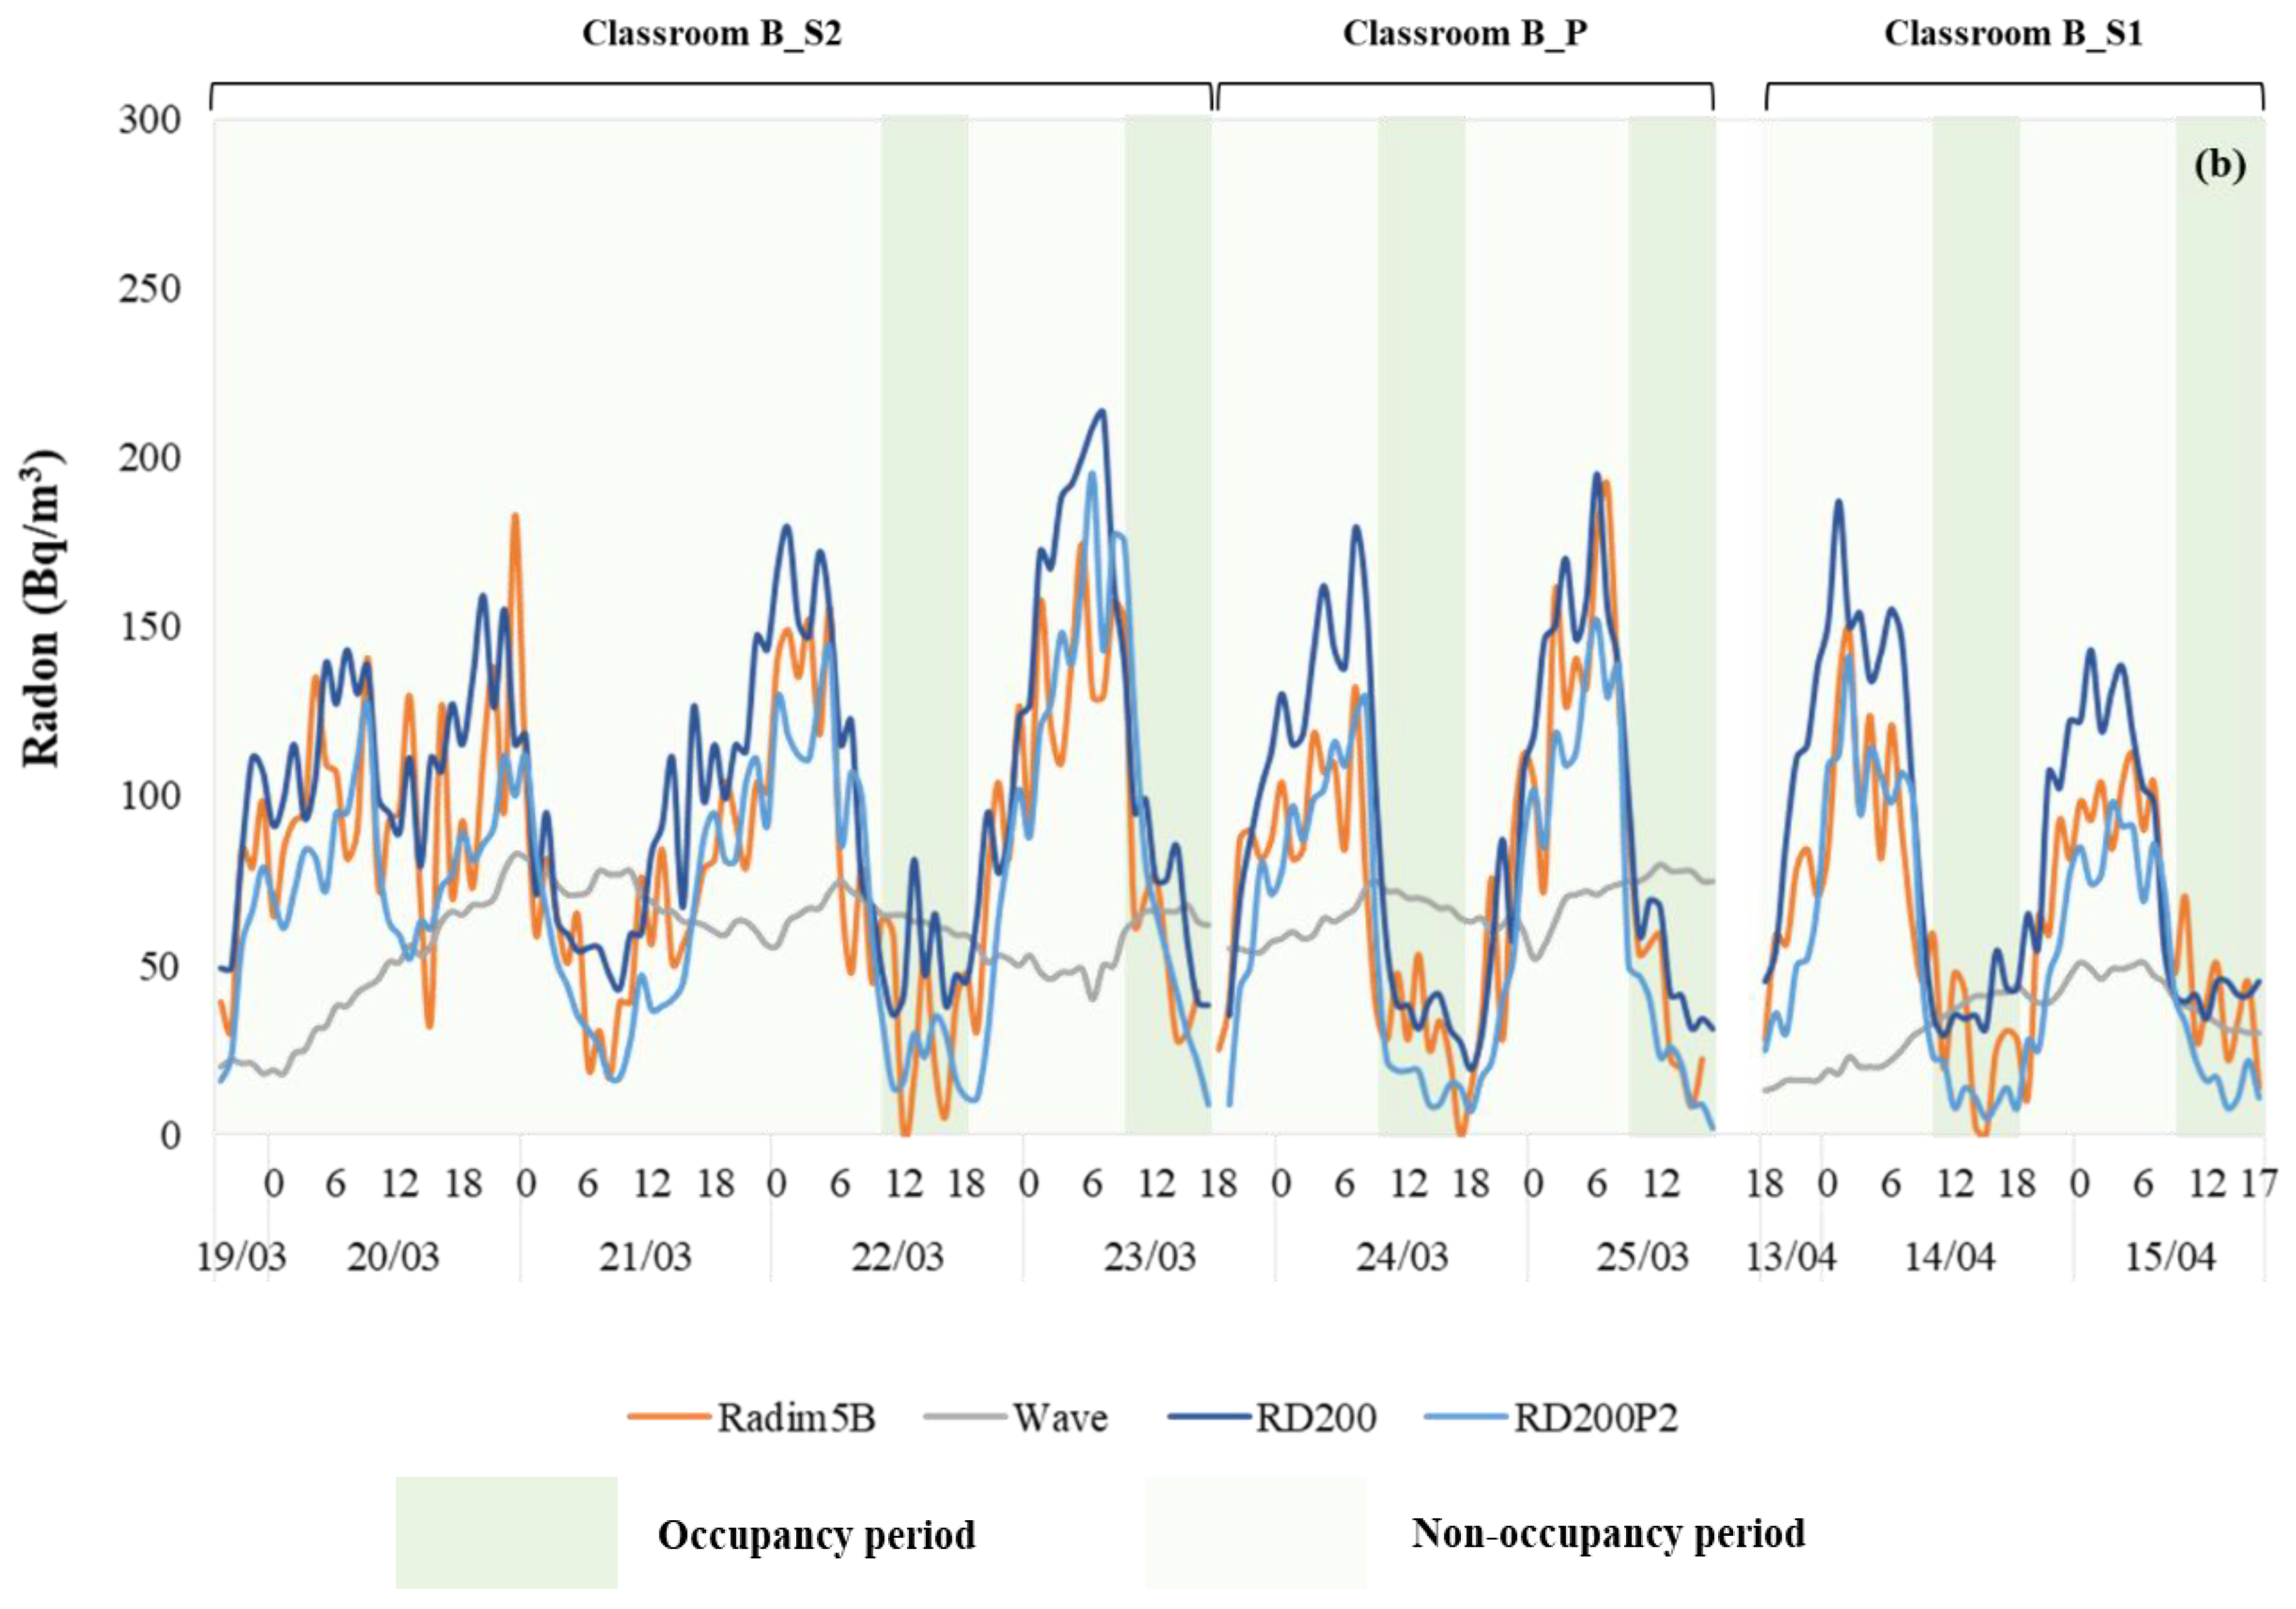
| B_S2 | min | 0.0 | 18.0 | 35.0 | 11.0 | 0.0 | 59.0 | 35.0 | 14.0 |
| max | 183.0 | 83.0 | 213.0 | 195.0 | 152.1 | 68.0 | 139.0 | 175.0 | |
| mean | 83.9 | 57.4 | 104.5 | 75.7 | 48.2 | 64.0 | 66.6 | 49.9 | |
| med | 80.3 | 63.0 | 99.0 | 75.0 | 45.1 | 65.0 | 65.0 | 33.0 | |
| B_P | min | 0.0 | 52.0 | 19.0 | 7.0 | 0.0 | 64.0 | 27.0 | 9.0 |
| max | 191.5 | 80.0 | 195.0 | 152.0 | 92.9 | 80.0 | 99.0 | 57.0 | |
| mean | 75.8 | 66.5 | 92.7 | 63.3 | 35.9 | 73.1 | 49.4 | 24.0 | |
| med | 78.8 | 67.0 | 92.5 | 51.0 | 28.2 | 75.0 | 41.0 | 19.0 | |
| B_S1 | min | 0.0 | 13.0 | 29.0 | 5.0 | 0.0 | 30.0 | 29.0 | 5.0 |
| max | 149.2 | 51.0 | 187.0 | 141.0 | 70.4 | 42.0 | 63.0 | 44.0 | |
| mean | 65.3 | 33.8 | 85.9 | 53.3 | 34.7 | 35.9 | 40.6 | 18.4 | |
| med | 62.0 | 36.0 | 76.0 | 45.5 | 36.6 | 36.0 | 41.0 | 15.0 | |
| Room ID | Device | R2 | RMSE | ||
|---|---|---|---|---|---|
| Entire Period | Occupancy Period | Entire Period | Occupancy Period | ||
| A_P | Wave | 0.173 | 0.679 | 177 | 62.5 |
| RD200 | 0.878 | 0.832 | 52.6 | 36.9 | |
| RD200P2 | 0.726 | 0.795 | 71.6 | 43.9 | |
| A_I | Wave | 0.0877 | 0.0625 | 244 | 301 |
| RD200 | 0.961 | 0.771 | 127 | 20.1 | |
| RD200P2 | 0.924 | 0.559 | 176 | 46.7 | |
| B_S2 | Wave | 0.0277 | 0.0133 | 34.9 | 25.5 |
| RD200 | 0.614 | 0.446 | 24.5 | 26.1 | |
| RD200P2 | 0.631 | 0.623 | 23.2 | 18.7 | |
| B_P | Wave | 0.0305 | 0.0928 | 53.2 | 42.6 |
| RD200 | 0.746 | 0.482 | 34.5 | 21.6 | |
| RD200P2 | 0.778 | 0.391 | 27.6 | 20.8 | |
| B_S1 | Wave | 0.0102 | 0.0455 | 49.6 | 19.5 |
| RD200 | 0.717 | 0.0196 | 32.1 | 19.7 | |
| RD200P2 | 0.770 | 0.330 | 21.8 | 22.1 | |
Publisher’s Note: MDPI stays neutral with regard to jurisdictional claims in published maps and institutional affiliations. |
© 2022 by the authors. Licensee MDPI, Basel, Switzerland. This article is an open access article distributed under the terms and conditions of the Creative Commons Attribution (CC BY) license (https://creativecommons.org/licenses/by/4.0/).
Share and Cite
Sá, J.P.; Branco, P.T.B.S.; Alvim-Ferraz, M.C.M.; Martins, F.G.; Sousa, S.I.V. Radon in Indoor Air: Towards Continuous Monitoring. Sustainability 2022, 14, 1529. https://doi.org/10.3390/su14031529
Sá JP, Branco PTBS, Alvim-Ferraz MCM, Martins FG, Sousa SIV. Radon in Indoor Air: Towards Continuous Monitoring. Sustainability. 2022; 14(3):1529. https://doi.org/10.3390/su14031529
Chicago/Turabian StyleSá, Juliana P., Pedro T. B. S. Branco, Maria C. M. Alvim-Ferraz, Fernando G. Martins, and Sofia I. V. Sousa. 2022. "Radon in Indoor Air: Towards Continuous Monitoring" Sustainability 14, no. 3: 1529. https://doi.org/10.3390/su14031529
APA StyleSá, J. P., Branco, P. T. B. S., Alvim-Ferraz, M. C. M., Martins, F. G., & Sousa, S. I. V. (2022). Radon in Indoor Air: Towards Continuous Monitoring. Sustainability, 14(3), 1529. https://doi.org/10.3390/su14031529