
The Trajectories, Trends, and Opportunities for Assessing Urban Ecosystem Services: A Systematic Review of Geospatial Methods

 ,
,  ,
,  and
and 
Abstract
:1. Introduction
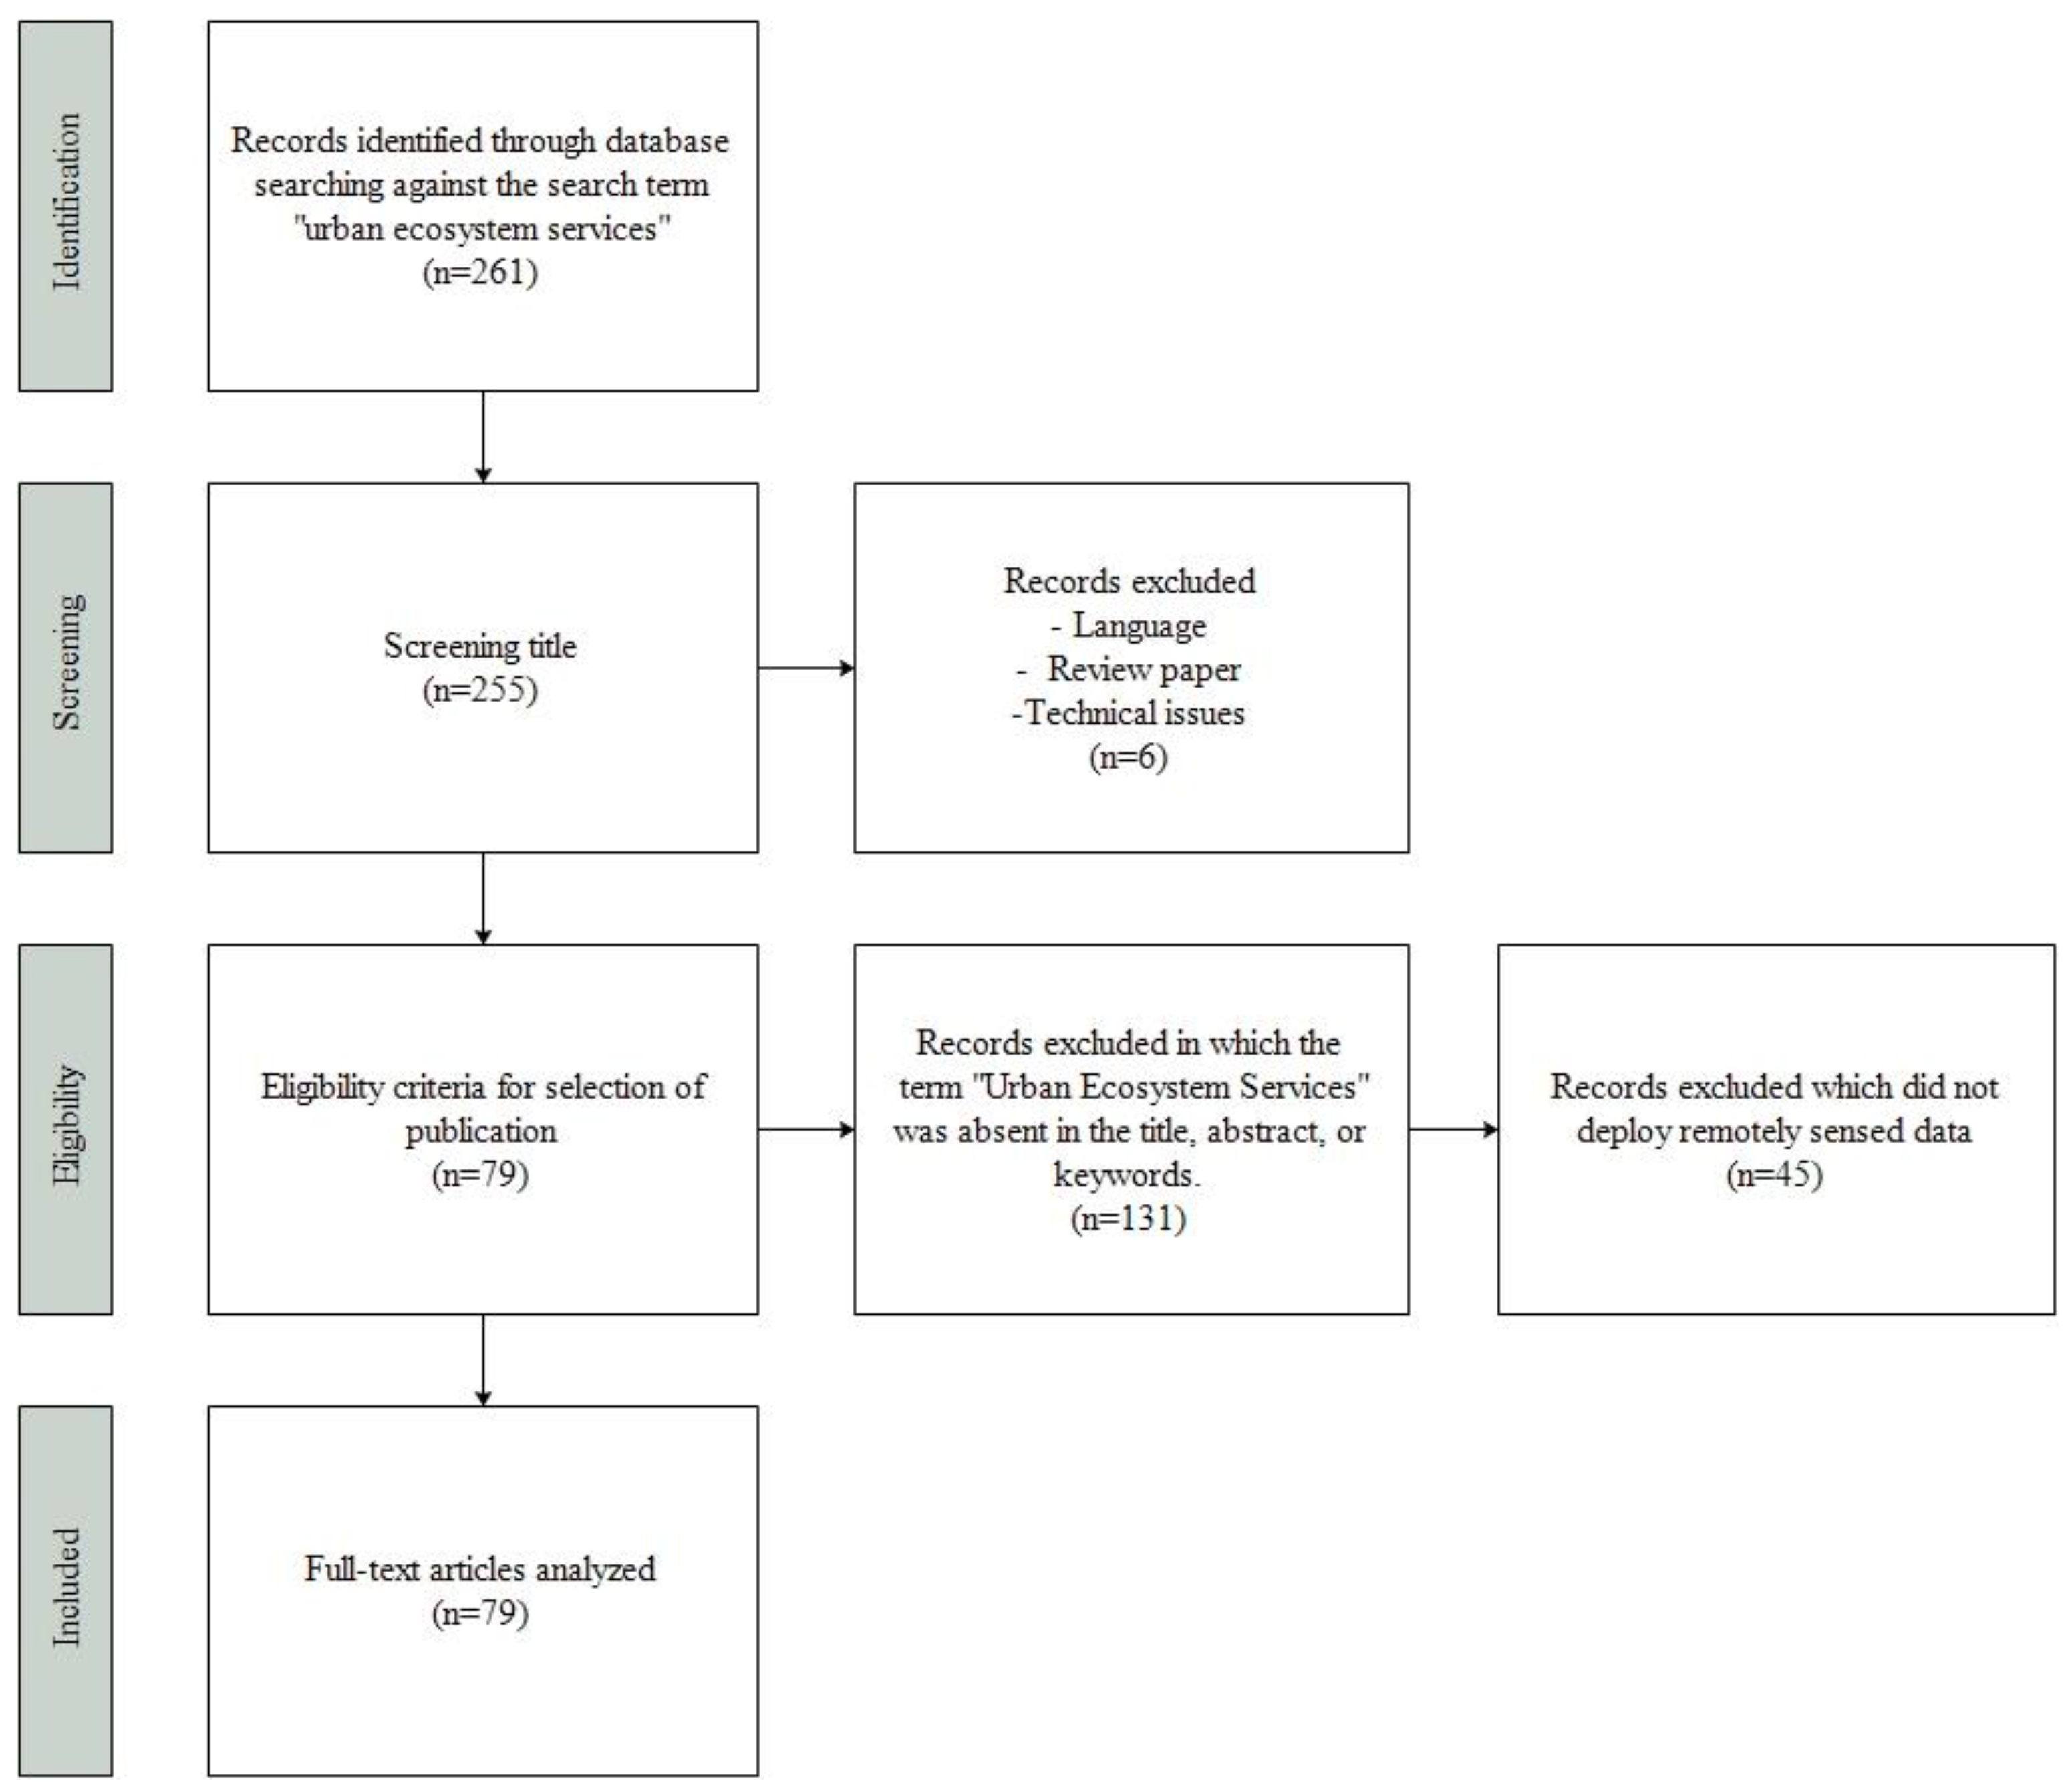
2. Methodology
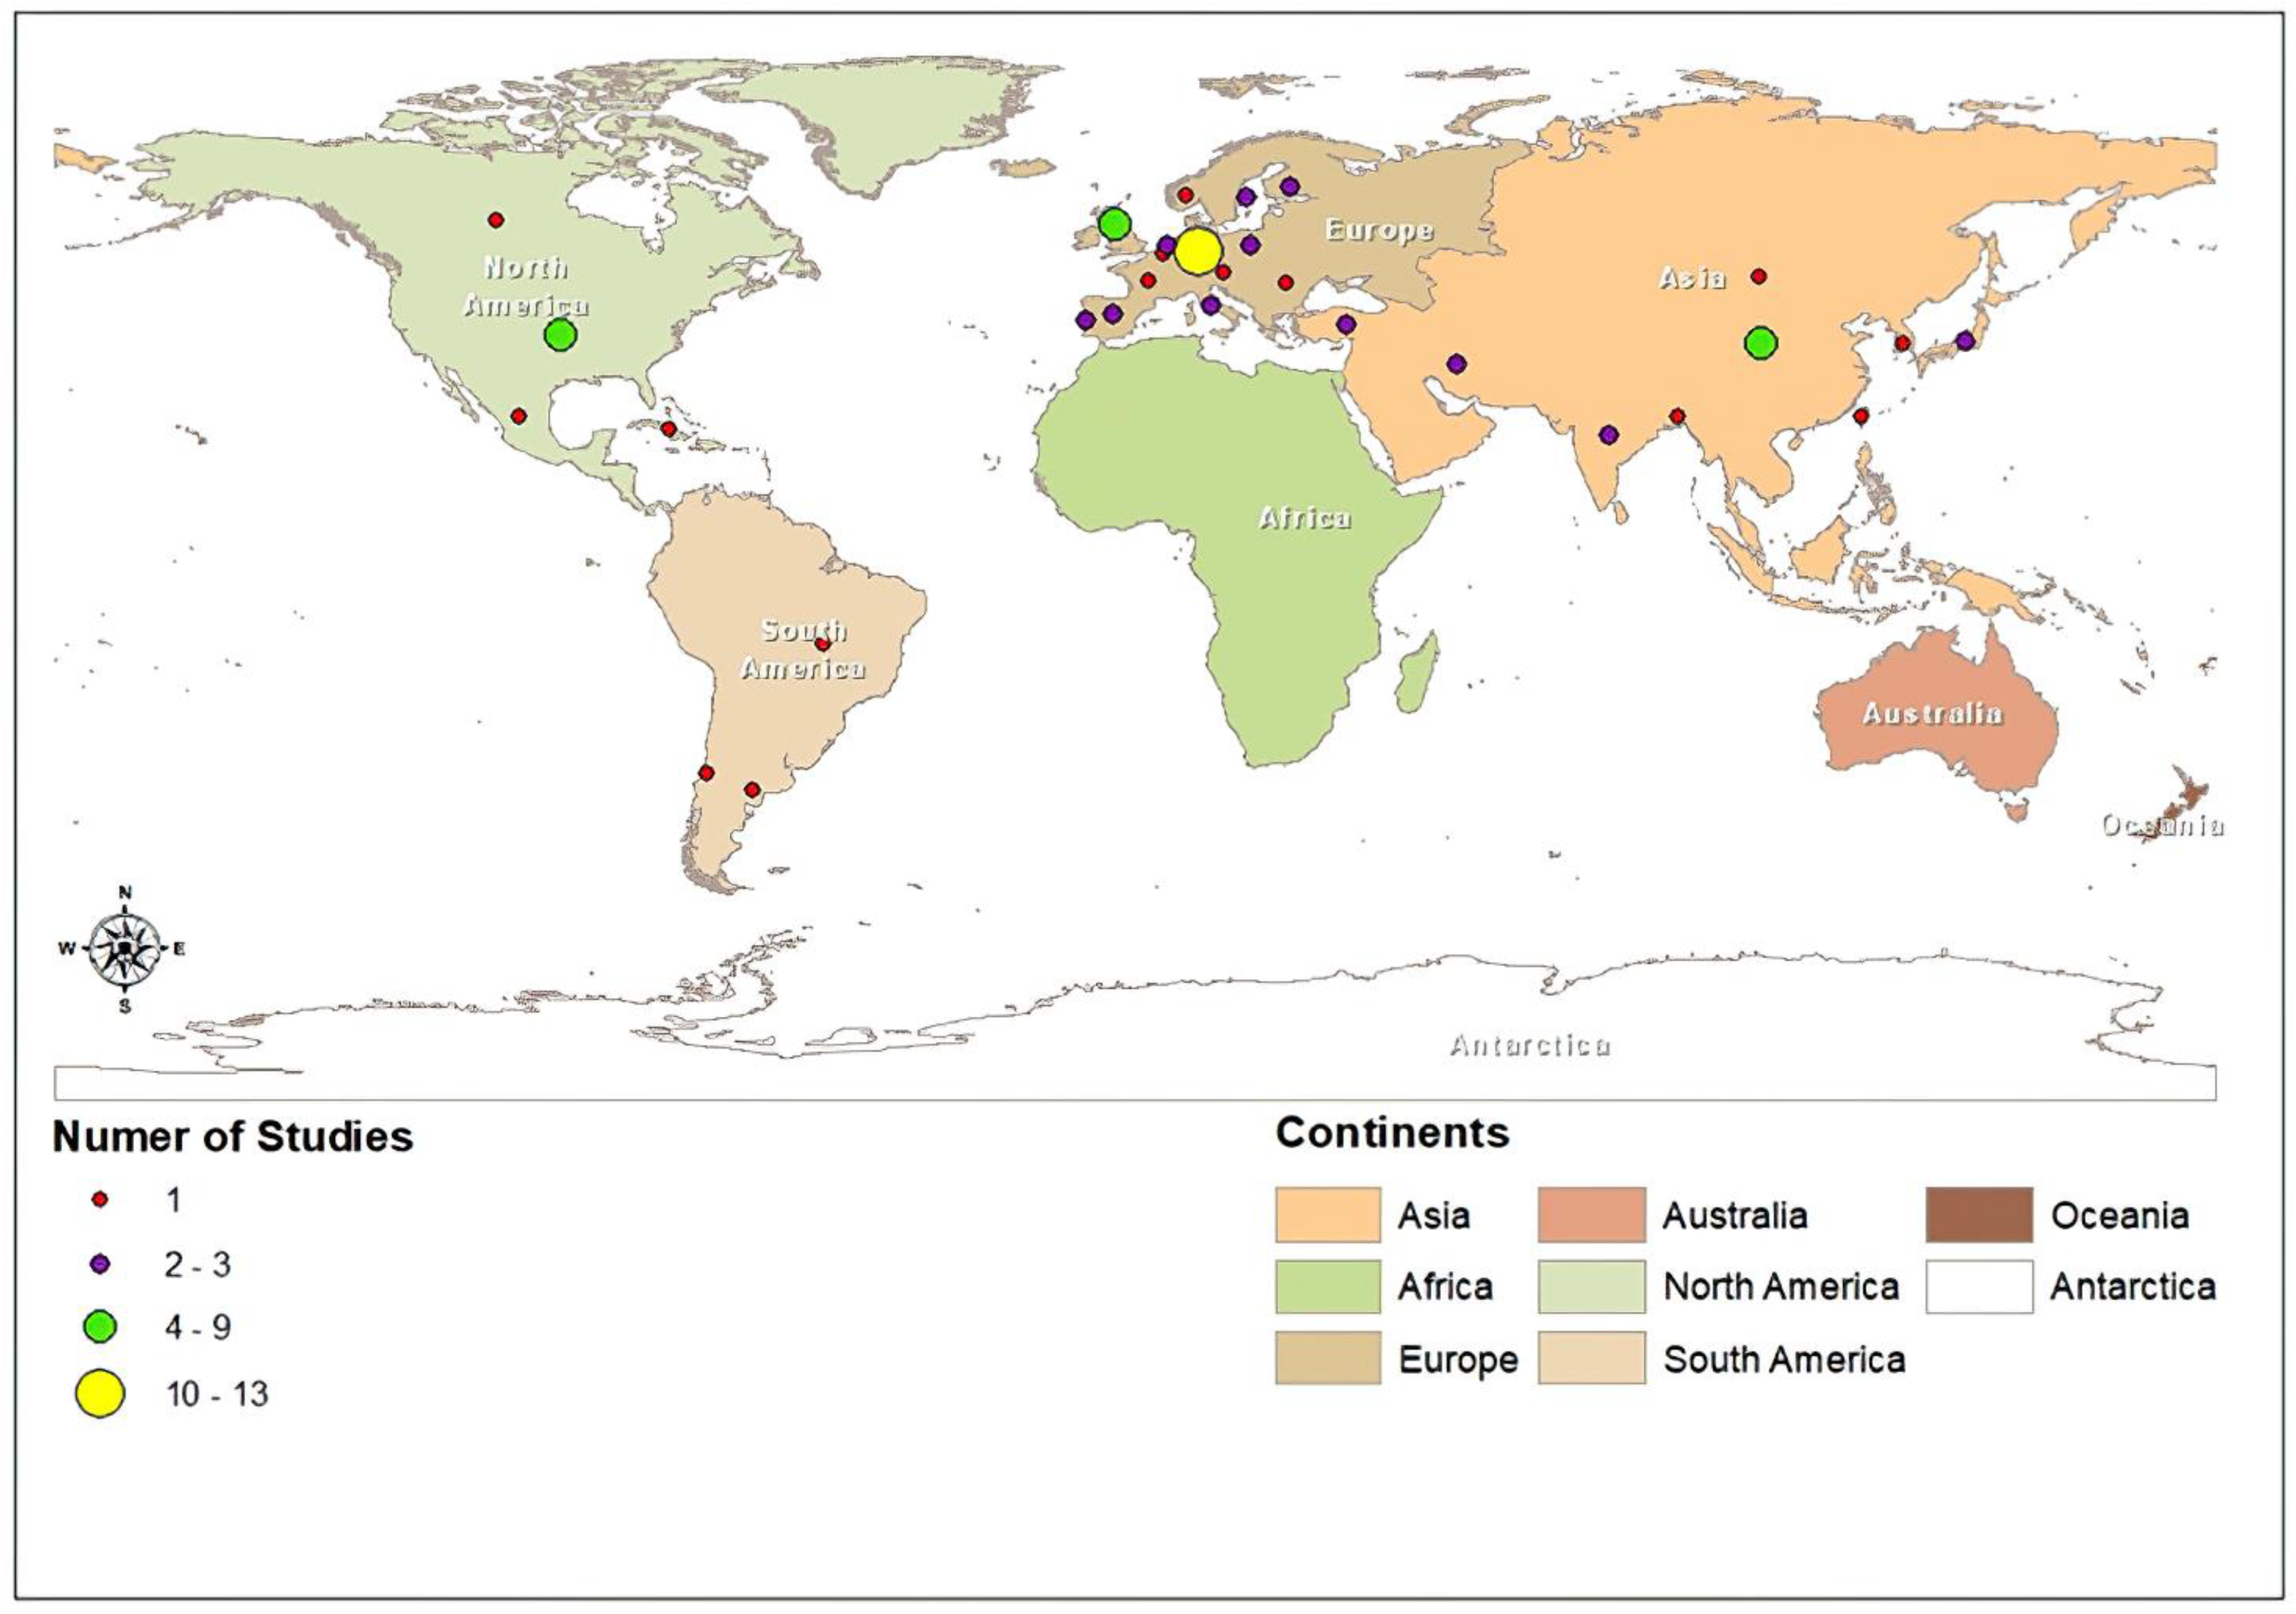
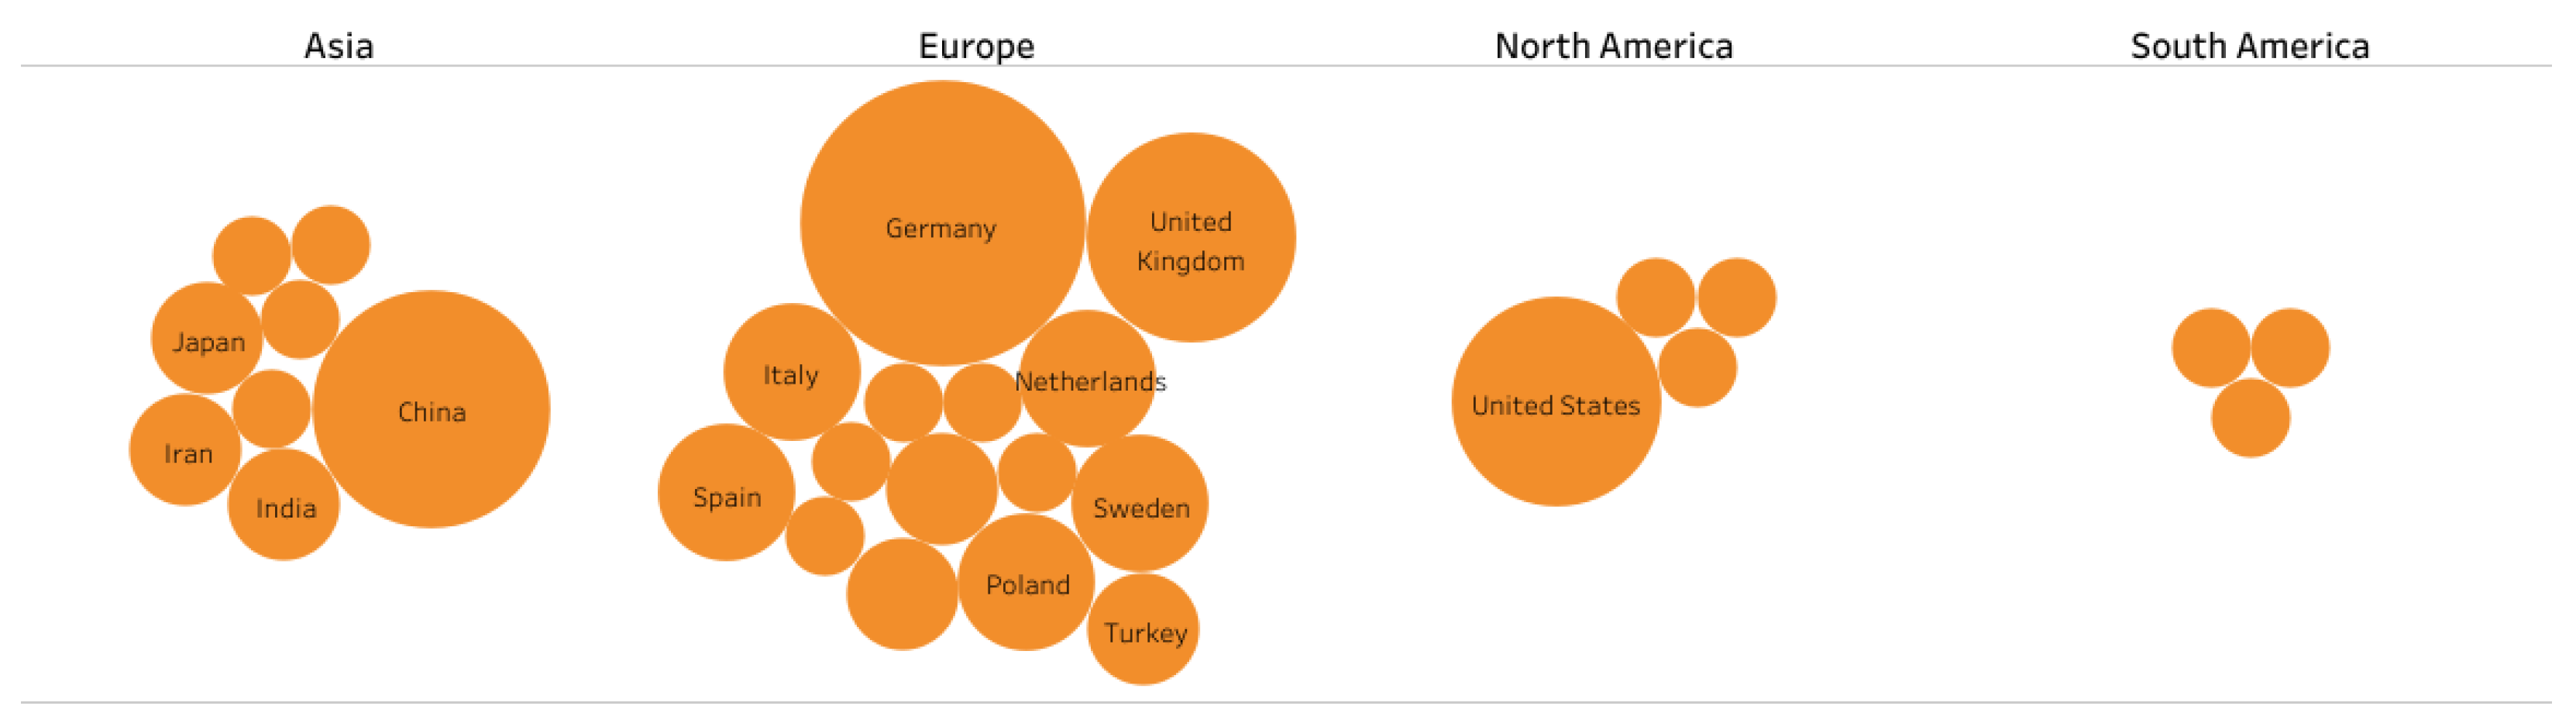
3. Results
3.1. The RS and UES Research
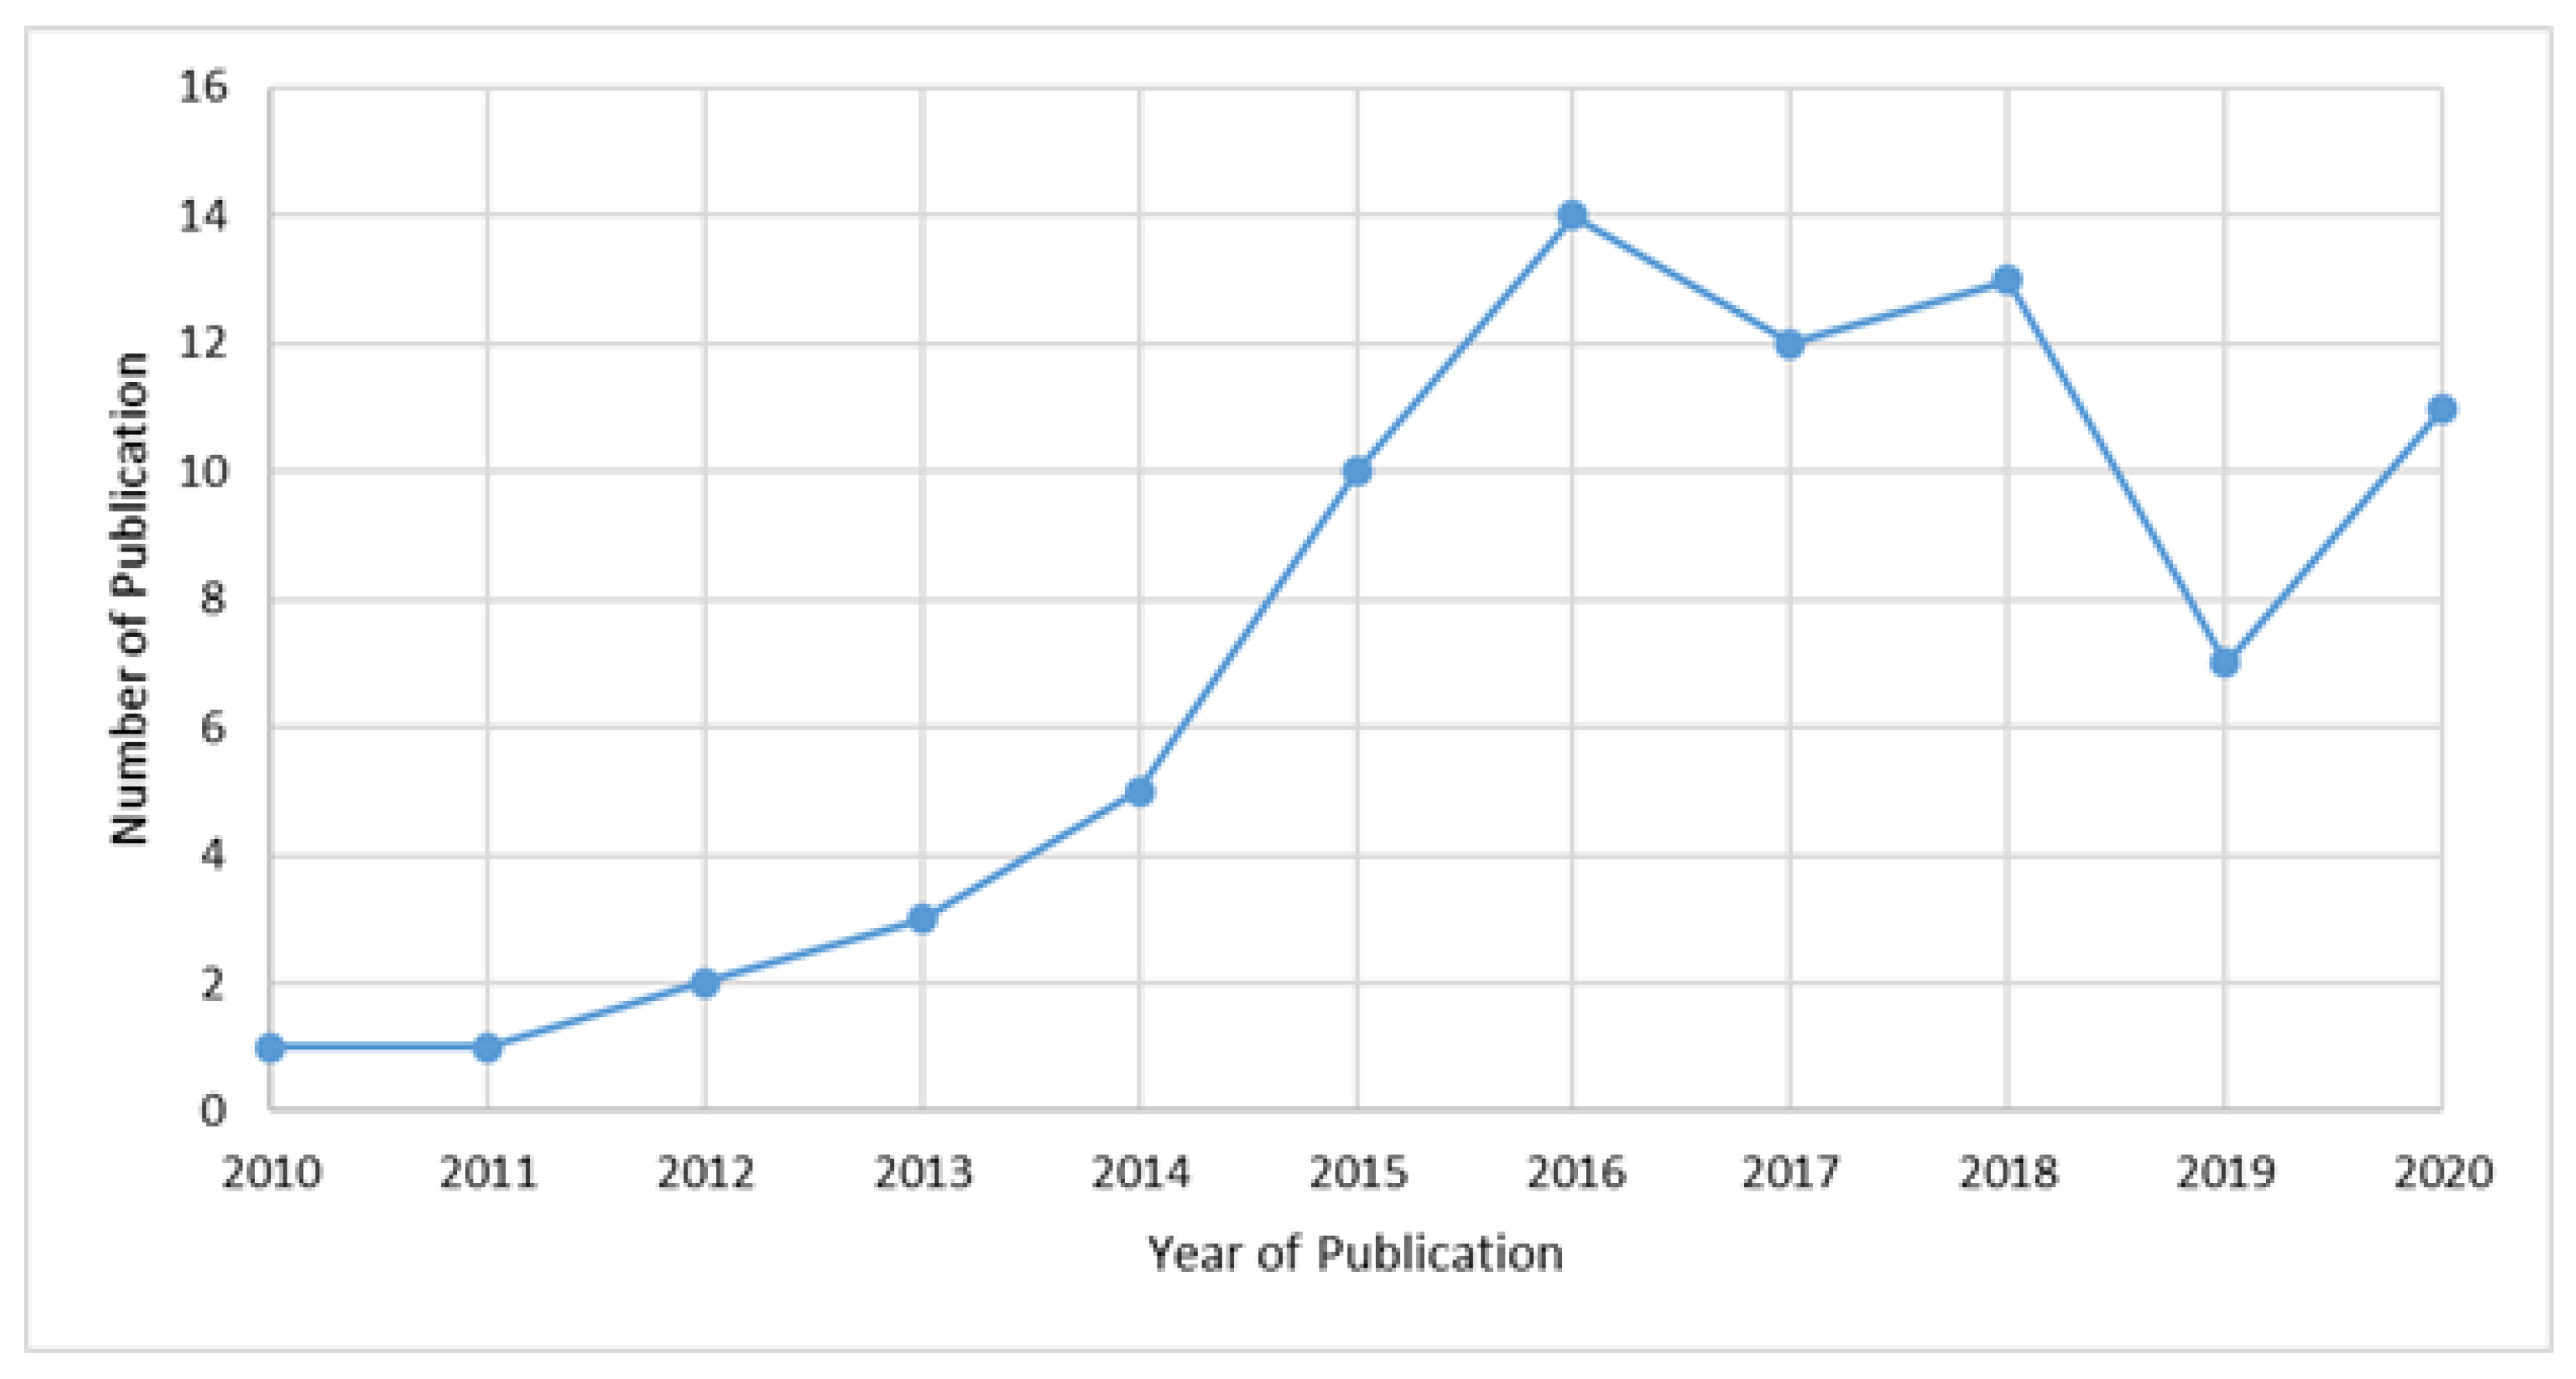
3.2. Temporal Fluctuations in Tendencies
3.3. Remote Sensing Data Sources and UES
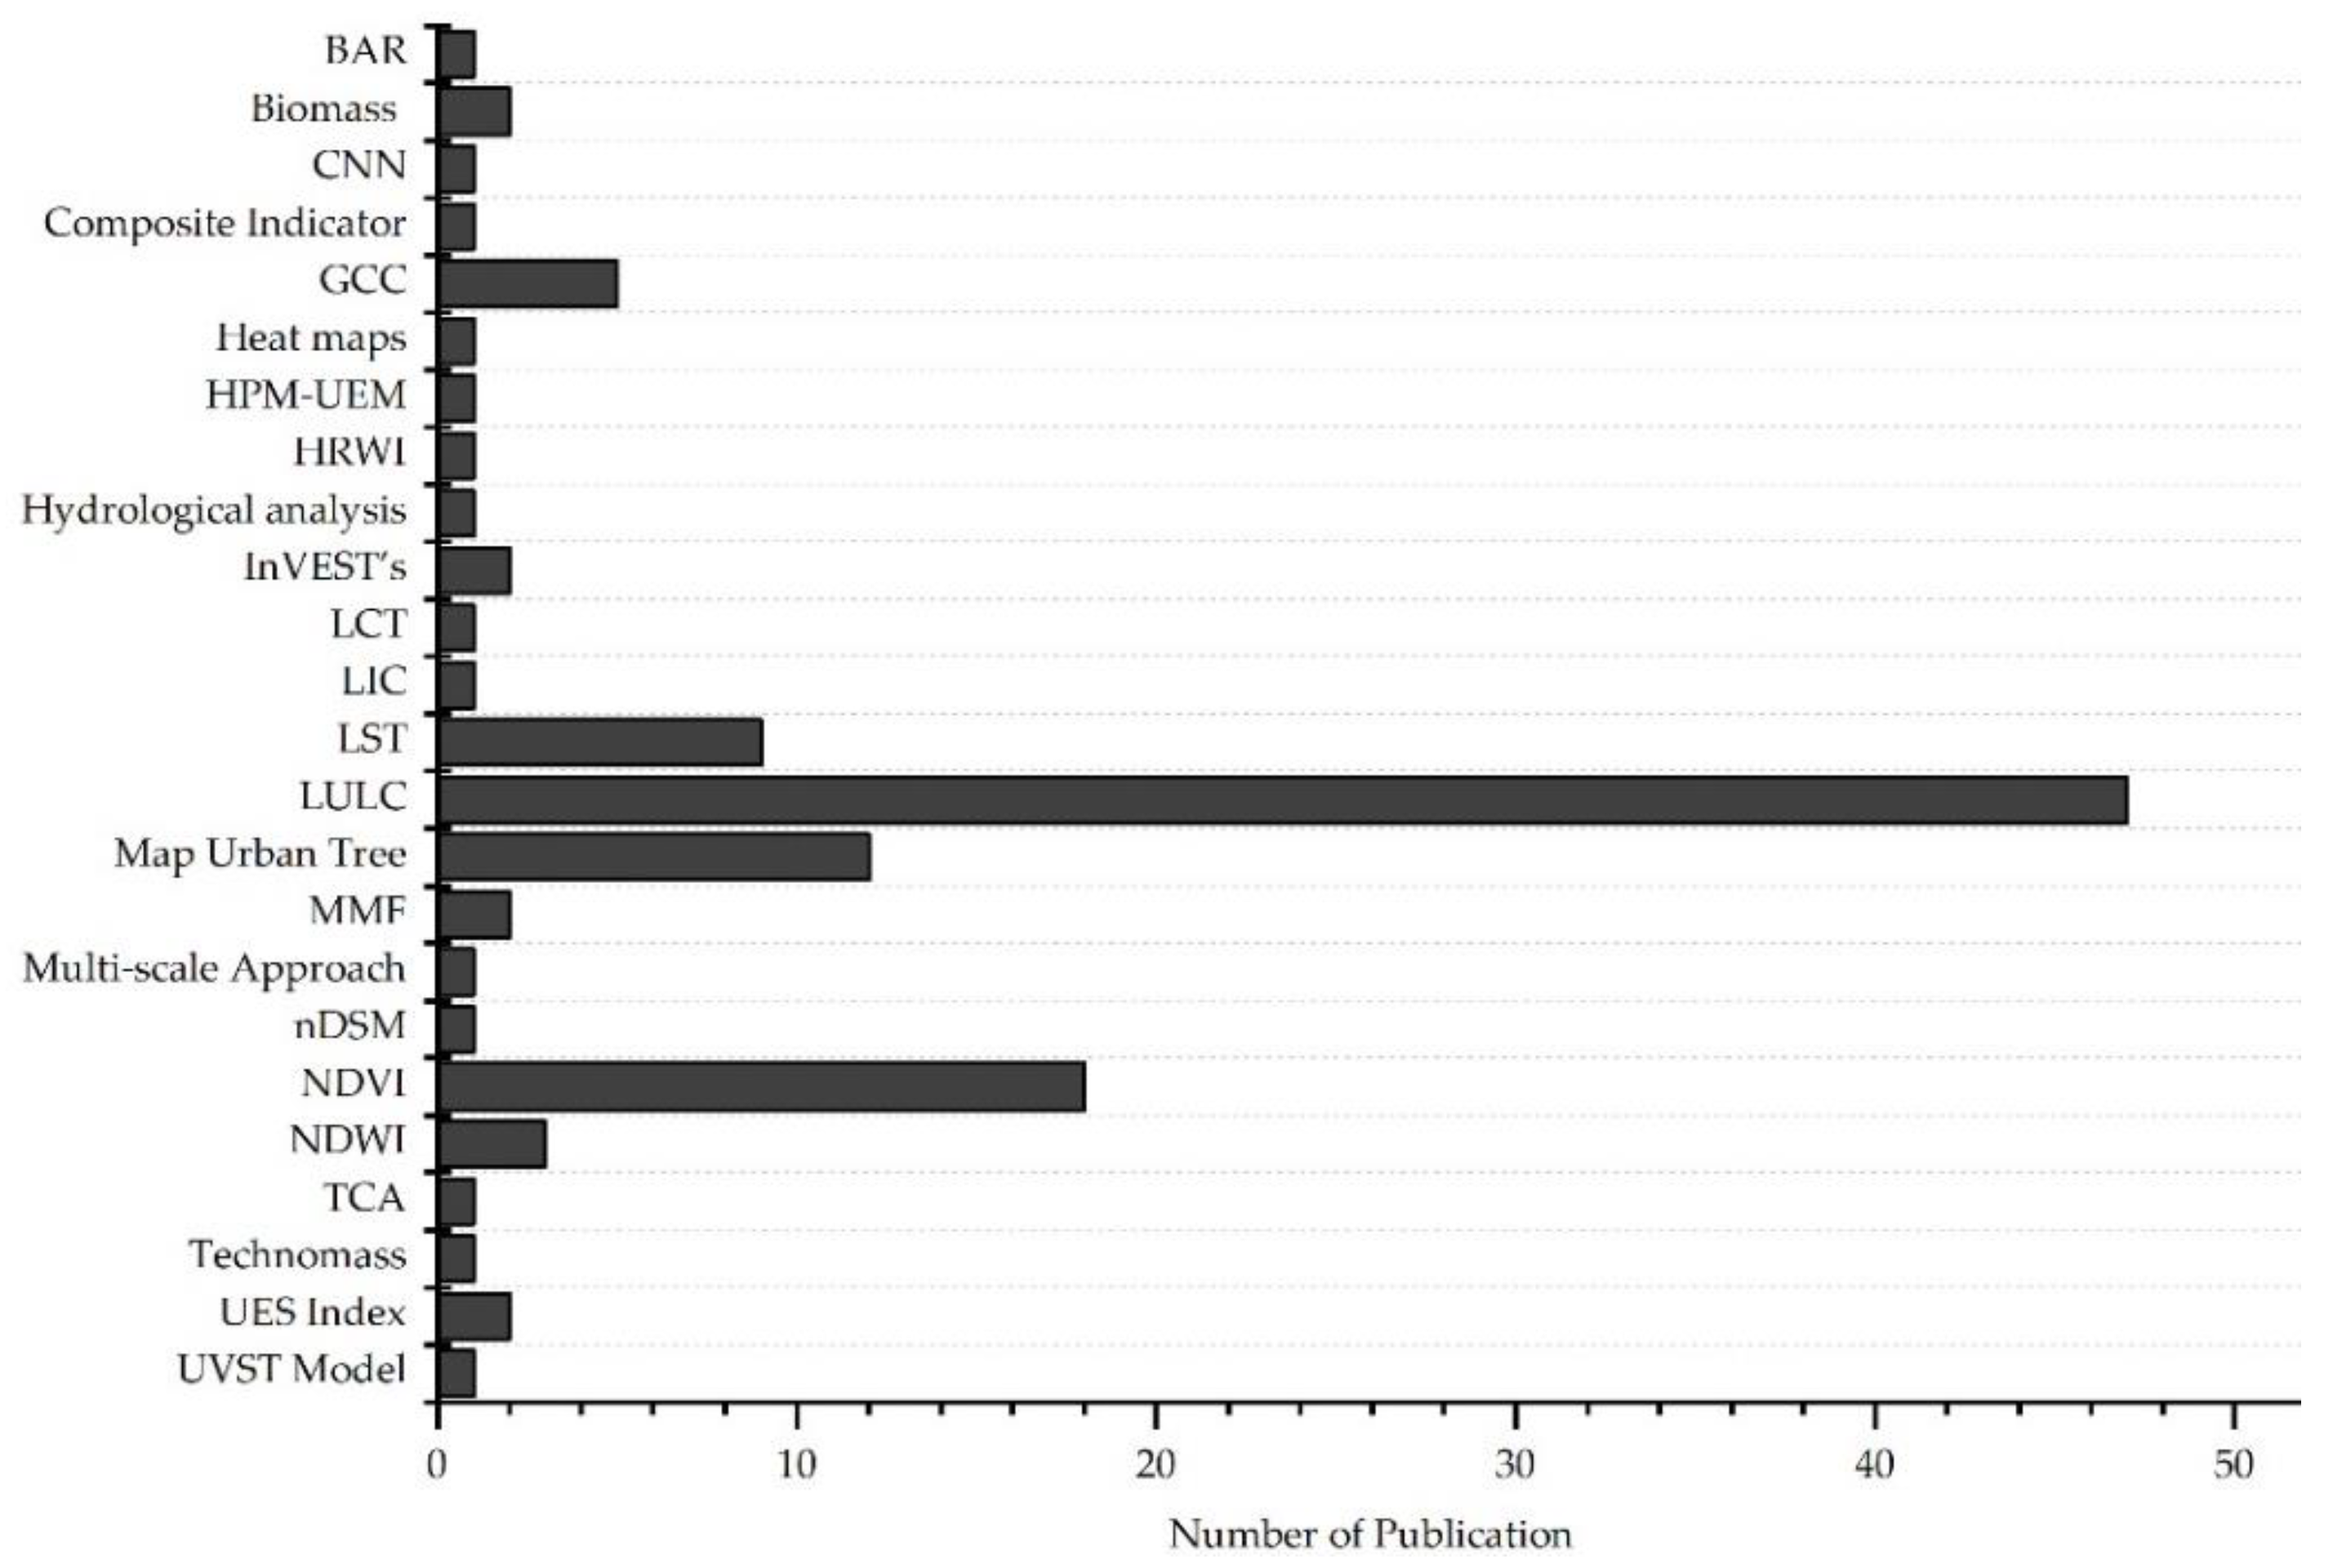
3.4. Methodological Frameworks and RS
4. Discussion
5. Conclusions
Author Contributions
Funding
Institutional Review Board Statement
Informed Consent Statement
Data Availability Statement
Conflicts of Interest
Appendix A

| Sr. No. | Title | Journal | Year | Vol | Page(s) | Issue | DOI |
|---|---|---|---|---|---|---|---|
| 1 | Scale-Crossing Brokers and Network Governance of Urban Ecosystem Services: The Case of Stockholm | Ecology and Society | 2010 | 15 | 25 | 4 | |
| 2 | Emergy-based evaluation of peri-urban ecosystem services | Ecological Complexity | 2011 | 8 | 38–50 | 1 | 10.1016/j.ecocom.2010.12.002 |
| 3 | The urban environmental indicator “Biotope Area Ratio”—An enhanced approach to assess and manage the urban ecosystem services using high resolution remote-sensing | Ecological Indicators | 2012 | 13 | 93–103 | 1 | 10.1016/j.ecolind.2011.05.016 |
| 4 | Urban ecosystem services: tree diversity and stability of tropospheric ozone removal | Ecol Appl | 2012 | 22 | 349–360 | 1 | 10.1890/11-0561.1 |
| 5 | A social-ecological assessment of vacant lots in New York City | Landscape and Urban Planning | 2013 | 120 | 218–233 | 10.1016/j.landurbplan.2013.05.003 | |
| 6 | Urban ecosystem services assessment along a rural-urban gradient: A cross-analysis of European cities | Ecological Indicators | 2013 | 29 | 179–190 | 10.1016/j.ecolind.2012.12.022 | |
| 7 | Urban vegetation classification: Benefits of multitemporal RapidEye satellite data | Remote Sensing of Environment | 2013 | 136 | 66–75 | 10.1016/j.rse.2013.05.001 | |
| 8 | Contribution of Ecosystem Services to Air Quality and Climate Change Mitigation Policies: The Case of Urban Forests in Barcelona, Spain | Ambio | 2014 | 43 | 466–479 | 4 | 10.1007/s13280-014-0507-x |
| 9 | Measuring urban ecosystem functions through ‘Technomass’—A novel indicator to assess urban metabolism | Ecological Indicators | 2014 | 42 | 10–19 | 10.1016/j.ecolind.2014.02.035 | |
| 10 | Mapping the diversity of regulating ecosystem services in European cities | Global Environmental Change | 2014 | 26 | 119–129 | 10.1016/j.gloenvcha.2014.04.008 | |
| 11 | Urban vegetation structure types as a methodological approach for identifying ecosystem services—Application to the analysis of micro-climatic effects | Ecological Indicators | 2014 | 42 | 58–72 | 10.1016/j.ecolind.2014.02.036 | |
| 12 | Development of a concept for non-monetary assessment of urban ecosystem services at the site level | Ambio | 2014 | 43 | 454–465 | 4 | 10.1007/s13280-014-0502–2 |
| 13 | Quantification and monetary valuation of urban ecosystem services in Munich, Germany | Zeitschrift Fur Wirtschaftsgeographie | 2015 | 59 | 188–200 | 3 | |
| 14 | REVIEW: Quantifying urban ecosystem services based on high-resolution data of urban green space: an assessment for Rotterdam, the Netherlands | Journal of Applied Ecology | 2015 | 52 | 1020–1032 | 4 | 10.1111/1365-2664.12469 |
| 15 | The role of urban green infrastructure in mitigating land surface temperature in Bobo-Dioulasso, Burkina Faso | Environment, Development and Sustainability | 2015 | 18 | 373–392 | 2 | 10.1007/s10668-015-9653-y |
| 16 | Socio-ecological dynamics and inequality in Bogotá, Colombia’s public urban forests and their ecosystem services | Urban Forestry & Urban Greening | 2015 | 14 | 1040–1053 | 4 | 10.1016/j.ufug.2015.09.011 |
| 17 | Intensity and spatial pattern of urban land changes in the megacities of Southeast Asia | Land Use Policy | 2015 | 48 | 213–222 | 10.1016/j.landusepol.2015.05.017 | |
| 18 | Understanding spatial patterns in the production of multiple urban ecosystem services | Ecosystem Services | 2015 | 16 | 33–46 | 10.1016/j.ecoser.2015.08.007 | |
| 19 | Contrasting values of cultural ecosystem services in urban areas: The case of park Montjuïc in Barcelona | Ecosystem Services | 2015 | 12 | 178–186 | 10.1016/j.ecoser.2014.11.016 | |
| 20 | A comparison of the economic benefits of urban green spaces estimated with NDVI and with high-resolution land cover data | Landscape and Urban Planning | 2015 | 133 | 105–117 | 10.1016/j.landurbplan.2014.09.013 | |
| 21 | Land sparing is crucial for urban ecosystem services | Frontiers in Ecology and the Environment | 2015 | 13 | 387–393 | 7 | 10.1890/140286 |
| 22 | High-Resolution Mapping of Urban Surface Water Using ZY-3 Multi-Spectral Imagery | Remote Sensing | 2015 | 7 | 12,336–12,355 | 9 | 10.3390/rs70912336 |
| 23 | A framework towards a composite indicator for urban ecosystem services | Ecological Indicators | 2016 | 60 | 38–44 | 10.1016/j.ecolind.2015.05.035 | |
| 24 | Appraisal of social-ecological innovation as an adaptive response by stakeholders to local conditions: Mapping stakeholder involvement in horticulture orientated green space management | Urban Forestry & Urban Greening | 2016 | 18 | 86–94 | 10.1016/j.ufug.2016.05.010 | |
| 25 | Estimating stormwater runoff for community gardens in New York City | Urban Ecosystems | 2016 | 20 | 129–139 | 1 | 10.1007/s11252-016-0575-8 |
| 26 | The impact of land use/land cover scale on modelling urban ecosystem services | Landscape Ecology | 2016 | 31 | 1509–1522 | 7 | 10.1007/s10980-015-0337-7 |
| 27 | Exploring local consequences of two land-use alternatives for the supply of urban ecosystem services in Stockholm year 2050 | Ecological Indicators | 2016 | 70 | 615–629 | 10.1016/j.ecolind.2016.02.062 | |
| 28 | The value of urban ecosystem services in New York City: A spatially explicit multicriteria analysis of landscape scale valuation scenarios | Environmental Science & Policy | 2016 | 62 | 57–68 | 10.1016/j.envsci.2016.04.012 | |
| 29 | Carbon sequestration through urban ecosystem services: A case study from Finland | Sci Total Environ | 2016 | 563–564 | 623–632 | 10.1016/j.scitotenv.2016.03.168 | |
| 30 | Mapping transition potential with stakeholder- and policy-driven scenarios in Rotterdam City | Ecological Indicators | 2016 | 70 | 630–643 | 10.1016/j.ecolind.2016.02.028 | |
| 31 | Balancing demand and supply of multiple urban ecosystem services on different spatial scales | Ecosystem Services | 2016 | 22 | 18–31 | 10.1016/j.ecoser.2016.09.008 | |
| 32 | Sustainable drainage system site assessment method using urban ecosystem services | Urban Ecosystems | 2016 | 20 | 293–307 | 2 | 10.1007/s11252-016-0593-6 |
| 33 | Green Roof Cost-Benefit Analysis: Special Emphasis on Scenic Benefits | Journal of Benefit-Cost Analysis | 2016 | 7 | 488–522 | 3 | 10.1017/bca.2016.18 |
| 34 | Deriving and Evaluating City-Wide Vegetation Heights from a TanDEM-X DEM | Remote Sensing | 2016 | 8 | 940 | 11 | 10.3390/rs8110940 |
| 35 | Modeling above-ground carbon storage: a remote sensing approach to derive individual tree species information in urban settings | Urban Ecosystems | 2016 | 20 | 97–111 | 1 | 10.1007/s11252-016-0585-6 |
| 36 | Spatially explicit urban green indicators for characterizing vegetation cover and public green space proximity: a case study on Brussels, Belgium | International Journal of Digital Earth | 2016 | 10 | 798–813 | 8 | 10.1080/17538947.2016.1252434 |
| 37 | Analysing scale, quality and diversity of green infrastructure and the provision of Urban Ecosystem Services: A case from Mexico City | Ecosystem Services | 2017 | 23 | 127–137 | 10.1016/j.ecoser.2016.12.004 | |
| 38 | Improving models of urban greenspace: from vegetation surface cover to volumetric survey, using waveform laser scanning | Methods in Ecology and Evolution | 2017 | 8 | 1443–1452 | 11 | 10.1111/2041-210x.12794 |
| 39 | Projecting the CO2 and Climatic Change Effects on the Net Primary Productivity of the Urban Ecosystems in Phoenix, AZ in the 21st Century under Multiple RCP (Representative Concentration Pathway) Scenarios | Sustainability | 2017 | 9 | 1366 | 8 | 10.3390/su9081366 |
| 40 | Capturing the value of green space in urban parks in a sustainable urban planning and design context: pros and cons of hedonic pricing | Ecology and Society | 2017 | 22 | 13 | 2 | 10.5751/es-09365-220221 |
| 41 | Assessing mismatches in ecosystem services proficiency across the urban fabric of Porto (Portugal): The influence of structural and socioeconomic variables | Ecosystem Services | 2017 | 23 | 82–93 | 10.1016/j.ecoser.2016.11.015 | |
| 42 | A GIS-based mapping methodology of urban green roof ecosystem services applied to a Central European city | Urban Forestry & Urban Greening | 2017 | 22 | 54–63 | 10.1016/j.ufug.2017.01.001 | |
| 43 | Mapping and Monitoring Urban Ecosystem Services Using Multitemporal High-Resolution Satellite Data | IEEE Journal of Selected Topics in Applied Earth Observations and Remote Sensing | 2017 | 10 | 669–680 | 2 | 10.1109/jstars.2016.2586582 |
| 44 | The potential of green infrastructure application in urban runoff control for land use planning: A preliminary evaluation from a southern Italy case study | Ecosystem Services | 2017 | 26 | 345–354 | 10.1016/j.ecoser.2017.04.015 | |
| 45 | Analysing urban green space accessibility and quality: A GIS-based model as spatial decision support for urban ecosystem services in Brussels | Ecosystem Services | 2017 | 28 | 328–340 | 10.1016/j.ecoser.2017.10.016 | |
| 46 | Temporal Changes in Ecosystem Services in European Cities in the Continental Biogeographical Region in the Period from 1990–2012 | Sustainability | 2017 | 9 | 665 | 4 | 10.3390/su9040665 |
| 47 | Ecological landscape regulation approaches in Xilingol, Inner Mongolia: an urban ecosystem services perspective | International Journal of Sustainable Development and World Ecology | 2017 | 24 | 401–407 | 5 | 10.1080/13504509.2016.1273263 |
| 48 | Urban ecosystem services—assessment of potential at the different spatial scale: an example of poznan | Ekonomia I Srodowisko-Economics and Environment | 2017 | 1 | 207–225 | 60 | |
| 49 | A Needs-Driven, Multi-Objective Approach to Allocate Urban Ecosystem Services from 10,000 Trees | Sustainability | 2018 | 10 | 15 | 12 | 10.3390/su10124488 |
| 50 | A Differentiated Spatial Assessment of Urban Ecosystem Services Based on Land Use Data in Halle, Germany | Land | 2018 | 7 | 101 | 3 | 10.3390/land7030101 |
| 51 | Extraction of Urban Water Bodies from High-Resolution Remote-Sensing Imagery Using Deep Learning | Water | 2018 | 10 | 585 | 5 | 10.3390/w10050585 |
| 52 | Assessing ecosystem services of bornova’s green infrastructure, izmir (turkey) | Fresenius Environmental Bulletin | 2018 | 27 | 3530–3541 | 5A | |
| 53 | Exploring temporal dynamics of urban ecosystem services in Latin America: The case of Bogota (Colombia) and Santiago (Chile) | Ecological Indicators | 2018 | 85 | 1068–1080 | 10.1016/j.ecolind.2017.11.062 | |
| 54 | Assessing how green space types affect ecosystem services delivery in Porto, Portugal | Landscape and Urban Planning | 2018 | 170 | 195–208 | 10.1016/j.landurbplan.2017.10.007 | |
| 55 | Mapping and Quantifying Variations in Ecosystem Services of Urban Green Spaces: A Test Case of Carbon Sequestration at the District Scale for Seoul, Korea (1975–2015) | International Review for Spatial Planning and Sustainable Development | 2018 | 6 | 110–120 | 3 | 10.14246/irspsd.6.3_110 |
| 56 | Visual structure of landscapes seen from built environment | Urban Forestry & Urban Greening | 2018 | 32 | 71–80 | 10.1016/j.ufug.2018.03.020 | |
| 57 | Within-Class and Neighborhood Effects on the Relationship between Composite Urban Classes and Surface Temperature | Sustainability | 2018 | 10 | 645 | 3 | 10.3390/su10030645 |
| 58 | Study of the Spatiotemporal Variation Characteristics of Forest Landscape Patterns in Shanghai from 2004 to 2014 Based on Multisource Remote Sensing Data | Sustainability | 2018 | 10 | 4397 | 12 | 10.3390/su10124397 |
| 59 | Assessing Mismatches in the Provision of Urban Ecosystem Services to Support Spatial Planning: A Case Study on Recreation and Food Supply in Havana, Cuba | Sustainability | 2018 | 10 | 2165 | 7 | 10.3390/su10072165 |
| 60 | Mapping the Changes in Urban Greenness Based on Localized Spatial Association Analysis under Temporal Context Using MODIS Data | ISPRS International Journal of Geo-Information | 2018 | 7 | 407 | 10 | 10.3390/ijgi7100407 |
| 61 | Significance of Urban Green and Blue Spaces: Identifying and Valuing Provisioning Ecosystem Services in Dhaka City | European Journal of Sustainable Development | 2018 | 7 | 435–448 | 1 | 10.14207/ejsd.2018.v7n1p435 |
| 62 | Analyzing temporal changes in urban forest structure and the effect on air quality improvement | Sustainable Cities and Society | 2019 | 48 | 101548 | 10.1016/j.scs.2019.101548 | |
| 63 | Under one canopy? Assessing the distributional environmental justice implications of street tree benefits in Barcelona | Environmental Science & Policy | 2019 | 102 | 54–64 | 10.1016/j.envsci.2019.08.016 | |
| 64 | Dynamics of Urbanization and its impact on Urban Ecosystem Services (UESs): A study of a medium size town of West Bengal, Eastern India | Journal of Urban Management | 2019 | 8 | 420–434 | 3 | 10.1016/j.jum.2019.03.002 |
| 65 | Urban ecosystem conditions and ecosystem services—a comparison between large urban zones and city cores in the EU | Journal of Environmental Planning and Management | 2019 | 63 | 798–817 | 5 | 10.1080/09640568.2019.1613966 |
| 66 | Multitemporal Geospatial Evaluation of Urban Agriculture and (Non)-Sustainable Food Self-Provisioning in Milan, Italy | Sustainability | 2019 | 11 | 1846 | 7 | 10.3390/su11071846 |
| 67 | Mapping the social values for ecosystem services in urban green spaces: Integrating a visitor-employed photography method into SolVES | Urban Forestry & Urban Greening | 2019 | 38 | 105–113 | 10.1016/j.ufug.2018.11.012 | |
| 68 | Tree Cover for the Year 2010 of the Metropolitan Region of São Paulo, Brazil | Data | 2019 | 4 | 145 | 4 | 10.3390/data4040145 |
| 69 | Identifying urban vegetation stress factors based on open access remote sensing imagery and field observations | Ecological Informatics | 2020 | 55 | 101,032 | 10.1016/j.ecoinf.2019.101032 | |
| 70 | Evaluating the contribution of urban ecosystem services in regulating thermal comfort | Spatial Information Research | 2020 | 12 | 10.1007/s41324-020-00336-8 | ||
| 71 | A Multidimensional Assessment Model Using RE-3DSG Sensors on Net ES and GVR for Sustainable and Smart Cities | Sensors (Basel) | 2020 | 20 | 16 | 5 | 10.3390/s20051259 |
| 72 | Investigating the Patterns and Dynamics of Urban Green Space in China’s 70 Major Cities Using Satellite Remote Sensing | Remote Sensing | 2020 | 12 | 1929 | 12 | 10.3390/rs12121929 |
| 73 | Children’s green walk to school: An evaluation of welfare-related disparities in the visibility of greenery among children | Environmental Science & Policy | 2020 | 110 | 10–13 | 10.1016/j.envsci.2020.05.009 | |
| 74 | A multi-criteria spatial approach for mapping urban ecosystem services demand | Ecological Indicators | 2020 | 112 | 106,119 | 10.1016/j.ecolind.2020.106119 | |
| 75 | Towards nationally harmonized mapping and quantification of ecosystem services | Sci Total Environ | 2020 | 703 | 134,973 | 10.1016/j.scitotenv.2019.134973 | |
| 76 | Ecosystem services mapping for green infrastructure planning-The case of Tehran | Sci Total Environ | 2020 | 703 | 135,466 | 10.1016/j.scitotenv.2019.135466 | |
| 77 | Environmental justice and outdoor recreation opportunities: A spatially explicit assessment in Oslo metropolitan area, Norway | Environmental Science & Policy | 2020 | 108 | 133–143 | 10.1016/j.envsci.2020.03.014 | |
| 78 | Mapping trade-offs and synergies among peri-urban ecosystem services to address spatial policy | Environmental Science & Policy | 2020 | 112 | 79–90 | 10.1016/j.envsci.2020.06.002 | |
| 79 | Spatiotemporal dynamics of urban ecosystem services in Turkey: The case of Bornova, Izmir | Urban Forestry & Urban Greening | 2020 | 49 | 126,631 | 10.1016/j.ufug.2020.126631 |
References
- Costanza, R. Embodied energy and economic valuation. Science 1980, 210, 1219–1224. [Google Scholar] [CrossRef] [PubMed]
- Costanza, R.; d’Arge, R.; De Groot, R.; Farber, S.; Grasso, M.; Hannon, B.; Limburg, K.; Naeem, S.; O’neill, R.V.; Paruelo, J. The value of the world’s ecosystem services and natural capital. Nature 1997, 387, 253–260. [Google Scholar] [CrossRef]
- De Groot, R.S.; Alkemade, R.; Braat, L.; Hein, L.; Willemen, L. Challenges in integrating the concept of ecosystem services and values in landscape planning, management and decision making. Ecol. Complex. 2010, 7, 260–272. [Google Scholar] [CrossRef]
- Atif, S.; Saqib, Z.; Ali, A.; Zaman, M.; Akhtar, N.; Fatima, H.; Atif, M.; Farooqi, S. Identification of key-trends and evaluation of contemporary research regarding urban ecosystem services: A path towards socio-ecological sustainability of urban areas. Appl. Ecol. Environ. Res. 2018, 16, 3545–3581. [Google Scholar] [CrossRef]
- Schreyer, J.; Lakes, T. Remote sensing-based approaches for modeling 3D vegetation information in urban areas. In Proceedings of the 2014 14th International Conference on Computational Science and Its Applications, Guimaraes, Portugal, 30 June–3 July 2014; pp. 116–120. [Google Scholar]
- Langemeyer, J.; Baró, F.; Roebeling, P.; Gómez-Baggethun, E. Contrasting values of cultural ecosystem services in urban areas: The case of park Montjuïc in Barcelona. Ecosyst. Serv. 2015, 12, 178–186. [Google Scholar]
- Ahern, J.; Cilliers, S.; Niemelä, J. The concept of ecosystem services in adaptive urban planning and design: A framework for supporting innovation. Landsc. Urban Plan. 2014, 125, 254–259. [Google Scholar] [CrossRef] [Green Version]
- Bokhari, S.A.; Saqib, Z.; Ali, A.; Mahmud, A.; Akhtar, N.; Kanwal, A.; ul Haq, M.Z. The impacts of land use/land cover changes on the supply-demand budget of urban ecosystem services. Arab. J. Geosci. 2021, 14, 1402. [Google Scholar] [CrossRef]
- Peptenatu, D.; Pintilii, R.; Draghici, C.; Stoian, D. Environmental pollution in functionally restructured urban areas: Case Study—The City of Bucharest. J. Environ. Health Sci. Eng. 2010, 7, 87–96. [Google Scholar]
- Uttara, S.; Bhuvandas, N.; Aggarwal, V. Impacts of urbanization on environment. Int. J. Res. Eng. Appl. Sci. 2012, 2, 1637–1645. [Google Scholar]
- Ahmad, M.; Jiang, P.; Majeed, A.; Umar, M.; Khan, Z.; Muhammad, S. The dynamic impact of natural resources, technological innovations and economic growth on ecological footprint: An advanced panel data estimation. Resour. Policy 2020, 69, 101817. [Google Scholar] [CrossRef]
- Nath, P.K.; Behera, B. A critical review of impact of and adaptation to climate change in developed and developing economies. Environ. Dev. Sustain. 2011, 13, 141–162. [Google Scholar] [CrossRef]
- Akhtar, N.; Saqib, Z.; Khan, M.I.; Martin, M.A.; Atif, S.B.; Zaman, M.H. A bibliometric analysis of contemporary research regarding industrial symbiosis: A path towards urban environmental resilience. Appl. Ecol. Environ. Res. 2018, 17, 1159–1221. [Google Scholar] [CrossRef]
- Atif, S.; Saqib, Z.; Ali, A.; Zaman, M. The impacts of socio-economic factors on the perception of residents about urban vegetation: A comparative study of planned versus semi-planned cities of Islamabad and Rawalpindi, Pakistan. Appl. Ecol. Environ. Res. 2018, 16, 4265–4287. [Google Scholar] [CrossRef]
- Amir, S.; Saqib, Z.; Khan, M.I.; Khan, M.A.; Bokhari, S.A.; Zaman-ul-Haq, M.; Majid, A. Farmers’ perceptions and adaptation practices to climate change in rain-fed area: A case study from district Chakwal, Pakistan. Pak. J. Agric. Sci. 2020, 57, 465–475. [Google Scholar]
- Zaman, H.M.; Saqib, Z.; Atif, B.S.; Akhtar, N.; Amir, S. The Dynamics of Urbanizations and Concomitant Land Use Land Cover Transformations in Planned and Quasi-Planned Urban Settlements of Pakistan. Geogr. Environ. Sustain. 2020, 13, 4. [Google Scholar] [CrossRef]
- Alavipanah, S.; Haase, D.; Lakes, T.; Qureshi, S. Integrating the third dimension into the concept of urban ecosystem services: A review. Ecol. Indic. 2017, 72, 374–398. [Google Scholar] [CrossRef]
- Thapa, R.B. Monitoring landscape change in Kathmandu metropolitan region using multi-temporal satellite imagery. In Proceedings of the Earth Observing Missions and Sensors: Development, Implementation, and Characterization II, Tokyo, Japan, 30 October–1 November 2012; p. 85281P. [Google Scholar]
- Luederitz, C.; Brink, E.; Gralla, F.; Hermelingmeier, V.; Meyer, M.; Niven, L.; Panzer, L.; Partelow, S.; Rau, A.-L.; Sasaki, R. A review of urban ecosystem services: Six key challenges for future research. Ecosyst. Serv. 2015, 14, 98–112. [Google Scholar] [CrossRef] [Green Version]
- Paul, C.K.; Mascarenhas, A.C. Remote sensing in development. Science 1981, 214, 139–145. [Google Scholar] [CrossRef]
- Pettorelli, N.; Laurance, W.F.; O’Brien, T.G.; Wegmann, M.; Nagendra, H.; Turner, W. Satellite remote sensing for applied ecologists: Opportunities and challenges. J. Appl. Ecol. 2014, 51, 839–848. [Google Scholar] [CrossRef]
- Kwok, R. Ecology’s remote-sensing revolution. Nature 2018, 556, 137–138. [Google Scholar] [CrossRef]
- Kremer, P.; Hamstead, Z.A.; McPhearson, T. The value of urban ecosystem services in New York City: A spatially explicit multicriteria analysis of landscape scale valuation scenarios. Environ. Sci. Policy 2016, 62, 57–68. [Google Scholar] [CrossRef]
- Wang, J.; Zhou, W.; Qian, Y.; Li, W.; Han, L. Quantifying and characterizing the dynamics of urban greenspace at the patch level: A new approach using object-based image analysis. Remote Sens. Environ. 2018, 204, 94–108. [Google Scholar] [CrossRef]
- Wang, Y.; Li, X.; Zhang, Q.; Li, J.; Zhou, X. Projections of future land use changes: Multiple scenarios-based impacts analysis on ecosystem services for Wuhan city, China. Ecol. Indic. 2018, 94, 430–445. [Google Scholar] [CrossRef]
- Greene, C.S.; Millward, A.A. Getting closure: The role of urban forest canopy density in moderating summer surface temperatures in a large city. Urban Ecosyst. 2017, 20, 141–156. [Google Scholar] [CrossRef]
- Estoque, R.C.; Murayama, Y.; Myint, S.W. Effects of landscape composition and pattern on land surface temperature: An urban heat island study in the megacities of Southeast Asia. Sci. Total Environ. 2017, 577, 349–359. [Google Scholar] [CrossRef]
- Chang, J.; Qu, Z.; Xu, R.; Pan, K.; Xu, B.; Min, Y.; Ren, Y.; Yang, G.; Ge, Y. Assessing the ecosystem services provided by urban green spaces along urban center-edge gradients. Sci. Rep. 2017, 7, 11226. [Google Scholar] [CrossRef] [Green Version]
- Zhao, C.; Sander, H.A. Assessing the sensitivity of urban ecosystem service maps to input spatial data resolution and method choice. Landsc. Urban Plan. 2018, 175, 11–22. [Google Scholar] [CrossRef]
- Tyukavina, A.; Hansen, M.C.; Potapov, P.V.; Stehman, S.V.; Smith-Rodriguez, K.; Okpa, C.; Aguilar, R. Types and rates of forest disturbance in Brazilian Legal Amazon, 2000–2013. Sci. Adv. 2017, 3, e1601047. [Google Scholar] [CrossRef] [Green Version]
- Wang, X.; Zhang, F.; Ding, J. Evaluation of water quality based on a machine learning algorithm and water quality index for the Ebinur Lake Watershed, China. Sci. Rep. 2017, 7, 12858. [Google Scholar] [CrossRef] [Green Version]
- Vafaei, S.; Soosani, J.; Adeli, K.; Fadaei, H.; Naghavi, H.; Pham, T.D.; Bui, D.T. Improving accuracy estimation of Forest Aboveground Biomass based on incorporation of ALOS-2 PALSAR-2 and Sentinel-2A imagery and machine learning: A case study of the Hyrcanian forest area (Iran). Remote Sens. 2018, 10, 172. [Google Scholar] [CrossRef] [Green Version]
- Elmqvist, T.; Setälä, H.; Handel, S.; Van Der Ploeg, S.; Aronson, J.; Blignaut, J.N.; Gomez-Baggethun, E.; Nowak, D.; Kronenberg, J.; De Groot, R. Benefits of restoring ecosystem services in urban areas. Curr. Opin. Environ. Sustain. 2015, 14, 101–108. [Google Scholar] [CrossRef] [Green Version]
- Bibri, S.E.; Krogstie, J. Smart sustainable cities of the future: An extensive interdisciplinary literature review. Sustain. Cities Soc. 2017, 31, 183–212. [Google Scholar] [CrossRef]
- Nobre, G.C.; Tavares, E. Scientific literature analysis on big data and internet of things applications on circular economy: A bibliometric study. Scientometrics 2017, 111, 463–492. [Google Scholar] [CrossRef]
- Türkeli, S.; Kemp, R.; Huang, B.; Bleischwitz, R.; McDowall, W. Circular economy scientific knowledge in the European Union and China: A bibliometric, network and survey analysis (2006–2016). J. Clean. Prod. 2018, 197, 1244–1261. [Google Scholar] [CrossRef]
- Goyal, S.; Chauhan, S.; Mishra, P. Circular economy research: A bibliometric analysis (2000–2019) and future research insights. J. Clean. Prod. 2021, 287, 125011. [Google Scholar] [CrossRef]
- Booth, A.; Sutton, A.; Papaioannou, D. Systematic Approaches to a Successful Literature Review, 2nd ed.; SAGE Publications: Thousand Oaks, CA, USA, 2016. [Google Scholar]
- McDonnell, M.J.; MacGregor-Fors, I. The ecological future of cities. Science 2016, 352, 936–938. [Google Scholar] [CrossRef]
- Wu, J. Urban ecology and sustainability: The state-of-the-science and future directions. Landsc. Urban Plan. 2014, 125, 209–221. [Google Scholar] [CrossRef]
- Schetke, S.; Qureshi, S.; Lautenbach, S.; Kabisch, N. What determines the use of urban green spaces in highly urbanized areas?—Examples from two fast growing Asian cities. Urban For. Urban Green. 2016, 16, 150–159. [Google Scholar] [CrossRef]
- Świąder, M.; Szewrański, S.; Kazak, J.K.; Van Hoof, J.; Lin, D.; Wackernagel, M.; Alves, A. Application of ecological footprint accounting as a part of an integrated assessment of environmental carrying capacity: A case study of the footprint of food of a large city. Resources 2018, 7, 52. [Google Scholar] [CrossRef] [Green Version]
- de Araujo Barbosa, C.C.; Atkinson, P.M.; Dearing, J.A. Remote sensing of ecosystem services: A systematic review. Ecol. Indic. 2015, 52, 430–443. [Google Scholar] [CrossRef]
- Masnavi, M.R.; Dabiri, M. The Potential of Urban Ecosystem Services Valuation as a Tool for Planning More Sustainable Cities. MANZAR Sci. J. Landsc. 2018, 9, 24–35. [Google Scholar]
- Haase, D.; Frantzeskaki, N.; Elmqvist, T. Ecosystem services in urban landscapes: Practical applications and governance implications. Ambio 2014, 43, 407–412. [Google Scholar] [CrossRef] [PubMed]
- Fink, H.S. Human-nature for climate action: Nature-based solutions for urban sustainability. Sustainability 2016, 8, 254. [Google Scholar] [CrossRef] [Green Version]
- Neefjes, K. Environments and Livelihoods: Strategies for Sustainability; Oxfam: Boston, MA, USA, 2000. [Google Scholar]
- Larondelle, N.; Haase, D.; Kabisch, N. Mapping the diversity of regulating ecosystem services in European cities. Glob. Environ. Chang. 2014, 26, 119–129. [Google Scholar] [CrossRef]
- Tavares, P.A.; Beltrão, N.; Guimarães, U.S.; Teodoro, A.; Gonçalves, P. Urban ecosystem services quantification through remote sensing approach: A systematic review. Environments 2019, 6, 51. [Google Scholar] [CrossRef] [Green Version]
- Poursanidis, D.; Chrysoulakis, N. Remote Sensing, natural hazards and the contribution of ESA Sentinels missions. Remote Sens. Appl. Soc. Environ. 2017, 6, 25–38. [Google Scholar] [CrossRef]
- Li, J.; Roy, D.P. A global analysis of Sentinel-2A, Sentinel-2B and Landsat-8 data revisit intervals and implications for terrestrial monitoring. Remote Sens. 2017, 9, 902. [Google Scholar] [CrossRef] [Green Version]
- Huang, S.-L.; Chen, Y.-H.; Kuo, F.-Y.; Wang, S.-H. Emergy-based evaluation of peri-urban ecosystem services. Ecol. Complex. 2011, 8, 38–50. [Google Scholar] [CrossRef]
- Calderón-Contreras, R.; Quiroz-Rosas, L.E. Analysing scale, quality and diversity of green infrastructure and the provision of Urban Ecosystem Services: A case from Mexico City. Ecosyst. Serv. 2017, 23, 127–137. [Google Scholar] [CrossRef]
- Sylla, M.; Hagemann, N.; Szewrański, S. Mapping trade-offs and synergies among peri-urban ecosystem services to address spatial policy. Environ. Sci. Policy 2020, 112, 79–90. [Google Scholar] [CrossRef]
- Ramyar, R.; Saeedi, S.; Bryant, M.; Davatgar, A.; Hedjri, G.M. Ecosystem services mapping for green infrastructure planning—The case of Tehran. Sci. Total Environ. 2020, 703, 135466. [Google Scholar] [CrossRef] [PubMed]
- Li, F.; Guo, S.; Li, D.; Li, X.; Li, J.; Xie, S. A multi-criteria spatial approach for mapping urban ecosystem services demand. Ecol. Indic. 2020, 112, 106119. [Google Scholar] [CrossRef]
- Coskun-Hepcan, C.; Hepcan, S. Assessing ecosystem services of Bornova’s green infrastructure, Izmir (Turkey). Fresenius Environ. Bull. 2018, 27, 3530–3541. [Google Scholar]
- Jia, J.; Wu, X. A Multidimensional Assessment Model Using RE–3DSG Sensors on Net ES and GVR for Sustainable and Smart Cities. Sensors 2020, 20, 1259. [Google Scholar] [CrossRef] [PubMed] [Green Version]
- Tigges, J.; Lakes, T.; Hostert, P. Urban vegetation classification: Benefits of multitemporal RapidEye satellite data. Remote Sens. Environ. 2013, 136, 66–75. [Google Scholar] [CrossRef]
- Haas, J.; Ban, Y. Mapping and monitoring urban ecosystem services using multitemporal high-resolution satellite data. IEEE J. Sel. Top. Appl. Earth Obs. Remote Sens. 2016, 10, 669–680. [Google Scholar] [CrossRef]
- Lakes, T.; Kim, H.-O. The urban environmental indicator “Biotope Area Ratio”—An enhanced approach to assess and manage the urban ecosystem services using high resolution remote-sensing. Ecol. Indic. 2012, 13, 93–103. [Google Scholar] [CrossRef]
- Li, W.; Saphores, J.-D.M.; Gillespie, T.W. A comparison of the economic benefits of urban green spaces estimated with NDVI and with high-resolution land cover data. Landsc. Urban Plan. 2015, 133, 105–117. [Google Scholar] [CrossRef]
- Van de Voorde, T. Spatially explicit urban green indicators for characterizing vegetation cover and public green space proximity: A case study on Brussels, Belgium. Int. J. Digit. Earth 2017, 10, 798–813. [Google Scholar] [CrossRef]
- Kuittinen, M.; Moinel, C.; Adalgeirsdottir, K. Carbon sequestration through urban ecosystem services: A case study from Finland. Sci. Total Environ. 2016, 563, 623–632. [Google Scholar] [CrossRef]
- Larondelle, N.; Lauf, S. Balancing demand and supply of multiple urban ecosystem services on different spatial scales. Ecosyst. Serv. 2016, 22, 18–31. [Google Scholar] [CrossRef]
- Zinia, N.J.; McShane, P. Significance of urban green and blue spaces: Identifying and valuing provisioning ecosystem services in Dhaka City. Eur. J. Sustain. Dev. 2018, 7, 435. [Google Scholar] [CrossRef]
- Das, M.; Das, A. Dynamics of Urbanization and its impact on Urban Ecosystem Services (UESs): A study of a medium size town of West Bengal, Eastern India. J. Urban Manag. 2019, 8, 420–434. [Google Scholar] [CrossRef]
- Sha, Z.; Ali, Y.; Wang, Y.; Chen, J.; Tan, X.; Li, R. Mapping the changes in urban greenness based on localized spatial association analysis under temporal context using MODIS data. ISPRS Int. J. Geo-Inf. 2018, 7, 407. [Google Scholar] [CrossRef] [Green Version]
- Chen, Y.; Fan, R.; Yang, X.; Wang, J.; Latif, A. Extraction of urban water bodies from high-resolution remote-sensing imagery using deep learning. Water 2018, 10, 585. [Google Scholar] [CrossRef] [Green Version]
- Li, Y.; Xue, C.; Shao, H.; Shi, G.; Jiang, N. Study of the spatiotemporal variation characteristics of forest landscape patterns in Shanghai from 2004 to 2014 based on multisource remote sensing data. Sustainability 2018, 10, 4397. [Google Scholar] [CrossRef] [Green Version]
- Burkhard, B.; Kroll, F.; Nedkov, S.; Müller, F. Mapping ecosystem service supply, demand and budgets. Ecol. Indic. 2012, 21, 17–29. [Google Scholar] [CrossRef]
- Tavares, P.A.; Beltrão, N.E.S.; Guimarães, U.S.; Teodoro, A.C. Integration of sentinel-1 and sentinel-2 for classification and LULC mapping in the urban area of Belém, eastern Brazilian Amazon. Sensors 2019, 19, 1140. [Google Scholar] [CrossRef] [Green Version]
- Whyte, A.; Ferentinos, K.P.; Petropoulos, G.P. A new synergistic approach for monitoring wetlands using Sentinels-1 and 2 data with object-based machine learning algorithms. Environ. Model. Softw. 2018, 104, 40–54. [Google Scholar] [CrossRef] [Green Version]

Publisher’s Note: MDPI stays neutral with regard to jurisdictional claims in published maps and institutional affiliations. |
© 2022 by the authors. Licensee MDPI, Basel, Switzerland. This article is an open access article distributed under the terms and conditions of the Creative Commons Attribution (CC BY) license (https://creativecommons.org/licenses/by/4.0/).
Share and Cite
Zaman-ul-Haq, M.; Saqib, Z.; Kanwal, A.; Naseer, S.; Shafiq, M.; Akhtar, N.; Bokhari, S.A.; Irshad, A.; Hamam, H. The Trajectories, Trends, and Opportunities for Assessing Urban Ecosystem Services: A Systematic Review of Geospatial Methods. Sustainability 2022, 14, 1471. https://doi.org/10.3390/su14031471
Zaman-ul-Haq M, Saqib Z, Kanwal A, Naseer S, Shafiq M, Akhtar N, Bokhari SA, Irshad A, Hamam H. The Trajectories, Trends, and Opportunities for Assessing Urban Ecosystem Services: A Systematic Review of Geospatial Methods. Sustainability. 2022; 14(3):1471. https://doi.org/10.3390/su14031471
Chicago/Turabian StyleZaman-ul-Haq, Muhammad, Zafeer Saqib, Ambrina Kanwal, Salman Naseer, Muhammad Shafiq, Nadia Akhtar, Syed Atif Bokhari, Azeem Irshad, and Habib Hamam. 2022. "The Trajectories, Trends, and Opportunities for Assessing Urban Ecosystem Services: A Systematic Review of Geospatial Methods" Sustainability 14, no. 3: 1471. https://doi.org/10.3390/su14031471
APA StyleZaman-ul-Haq, M., Saqib, Z., Kanwal, A., Naseer, S., Shafiq, M., Akhtar, N., Bokhari, S. A., Irshad, A., & Hamam, H. (2022). The Trajectories, Trends, and Opportunities for Assessing Urban Ecosystem Services: A Systematic Review of Geospatial Methods. Sustainability, 14(3), 1471. https://doi.org/10.3390/su14031471