Article

Quantitative Study on the Life-Cycle Carbon Emissions of a Nearly Zero Energy Building in the Severe Cold Zones of China

1
School of Municipal and Environmental Engineering, Jilin University of Architecture and Technology, Changchun 130114, China
2
Jianke EET Co., Ltd., Beijing 100013, China
3
Changchun Institute of Technology, School of Energy and Power Engineering, Changchun 130012, China
4
Key Laboratory of Cold Region Urban and Rural Human Settlement Environment Science and Technology, Ministry of Industry and Information Technology, Harbin Institute of Technology, School of Architecture, Harbin 150090, China
*
Authors to whom correspondence should be addressed.
Sustainability 2022, 14(3), 1448; https://doi.org/10.3390/su14031448
Submission received: 19 December 2021 / Revised: 20 January 2022 / Accepted: 21 January 2022 / Published: 27 January 2022

Abstract

:
This work aimed to quantitatively study the carbon emissions and carbon reduction potential of a nearly Zero Energy Building in a severe cold zone of China from the perspective of its life cycle. The methods were based on China’s “Standard for building carbon emission calculation” (GB/T51366-2019), which include the production, transportation, operation, and demolition stages. For the nearly Zero Energy Building, the total carbon emissions over its whole life were 789.43 kg CO2/m2, an 86.20% reduction compared to the 5719.68 kg CO2/m2 for a 65% energy-saving building. The carbon emission percentages of the production stage and operation stage for the building materials are 75.62% and 20.40%, respectively. To enhance the carbon reduction potential, a sensitivity analysis was conducted to explore the impact of the use of a wood structural system, recycled concrete replacement, and photovoltaic power generation. The use of a wood structure system can achieve zero or negative carbon emissions in the production stage. The sensitivity of the carbon emissions of the nearly zero energy building (nZEB) to the increment of photovoltaic power generation is much higher than that of the recycled concrete replacement rate, providing a basis for further exploration of the development of nZEBs into zero carbon buildings.

1. Introduction

Energy consumption in buildings is one of the three major sources of energy consumption today. Building energy-saving is especially important for the sustainable development of society as well as environmental protection. The global carbon emissions from building operations amounted to 9.7 Gt of CO2 in 2018, accounting for 28% of the total global carbon emissions. If the total carbon emissions from the construction industry are taken into account, this would account for 39% of the total global carbon emissions [1]. In China, the carbon emissions from building operations amounted to 2.1 billion tons, while the total carbon emissions from construction amounted to 3.9 billion tons, which accounted for 21.4% and 39.8% of the total carbon emissions for the entire country in 2018, respectively [2,3]. The building sector is attracting more attention due to its energy consumption and carbon emissions [4].
To significantly improve energy-saving in buildings, the European Union (EU) stipulates that all new buildings must be nearly Zero Energy Buildings (nZEBs) by 31 December 2020 [5]. Furthermore, according to the International Energy Agency (IEA), the targets of Zero Energy Buildings (ZEBs) should be achieved by 2030 [6]. The development of nZEBs in Germany mainly relies on the technology system of ”Passive House” [7]. In 2013, relevant regulations were proposed for the “energy-saving method”. From January 2019, all new buildings owned or used by the German government should reach the nZEB level. As of January 2021, all new buildings in Germany have reached the level of nZEBs [8]. Influenced by the EU, Switzerland established the Minergie Association back in 1998 and formulated the first nZEB standard “Mi-nergie”. The emergence of the Minergie-A ZEB Certification Standard in 2011 is of great importance for promoting the development of nZEBs/ZEBs in Switzerland. In 2018, Switzerland issued the energy development plan “Swiss Energy Strategy 2050” and certified the community demonstration of ZEBs [9,10].
The research report “ZEBs: a critical look at the definition” published by the US National Renewable Energy Laboratory in 2006 defines nZEB. In 2009, the United States built a nearly zero energy residential community, Z-Home [11]. Apple’s new headquarters office building was built in 2018 and it is the largest ZEB in the world. Japan proposed a ZEB in the true sense, in 2008, at a meeting of the Cabinet of Japanese Economic Countermeasures, when a plan for the development of ZEBs was formally presented [12]. In 2009, the “ZEB Development and Realization Research Society” of the Ministry of Economy and Industry of Japan was established to popularize and promote ZEBs, and in 2012 it clearly indicated the ZEB technological path to be achieved before 2030 [13]. South Korea’s “ZEB” is defined as requiring that the building “... maximize the thermal insulation performance of the building envelope to minimize energy demand, and then use renewable energy for energy supply, so as to achieve energy self-sufficiency” [14]. In 2013, the Ministry of Industry and Resources of Korea issued a new version of the “Building energy consumption level certification standard”, which issued standards for ZEB certification [15,16].
From the above, it can be seen that developed countries have formulated medium and long-term development goals and policies for buildings to move towards lower energy consumption. Furthermore, they have established technical standards and systems appropriate for their characteristics and promoted buildings to move towards lower energy consumption. This is becoming a trend in the development of global energy-saving in buildings. Germany is part of the EU system, which classifies buildings by primary energy consumption values. The certification of residential nZEBs in the United States and ZEBs in South Korea and Japan determine the grade of buildings based on the relative energy-saving rate [17]. Marszal et al. reviewed the methods for defining and calculating the energy consumption of nZEBs in different zones with the aim of promoting the development of consistent and standardized methods in this field [18]. Overall, the technological path of all countries adopts the strategy of gradual development, i.e., gradual reduction of energy consumption of low-rise buildings, whereby nearly zero energy is achieved first, and then zero energy.
China has become the world’s largest energy producer and consumer [19]. Since 1980, work on energy-saving in buildings has undergone more than 30 years of development and has achieved notable results in reducing the energy consumption needed for heating residential buildings and reduced the energy consumption of public buildings in severe cold and cold zones.
In order to further promote energy-saving in buildings in China and to move towards nZEBs, demonstration projects such as Qinhuangdao ZaiShuiYiFang (Hebei Province), XiShu Garden in Harbin (Heilongjiang Province), and “CABR nearly zero energy demonstration building” of the Academy of Building Research were constructed under the promotion of government departments and have achieved very good energy-saving effects and have had a great social impact since 2011. Since 2017, the state and local governments have introduced policies to encourage the pilot construction of ultra-low energy consumption buildings and nZEBs. The Xu Wei research team of the China Academy of Building Research collects demonstration projects of ultra-low energy consumption buildings in China. Among them, 64 representative demonstration projects built from 2012 to 2019 were analyzed in terms of their technology and economy. They refined the common key technical points of the design, construction, and operation stages of the demonstration projects, thus laying the foundation for the next steps in standards formulation [20]. After almost ten years of research and exploration relying on foreign experience, and combined with existing Chinese engineering practice, control indicators and technical paths that are suitable for Chinese national conditions and suitable for different climate zones have gradually become clear [21]. In 2019, the “Technical standard for nearly zero energy buildings” was officially proclaimed in the form of national standards for determining the requirements of energy-saving indicators. The construction of nZEBs has taken an important step in reducing the environmental impact of buildings.
Compared to ordinary energy-saving buildings, being an nZEB means that the annual operating energy consumption is close to zero by improving the performance of the envelope to reduce cooling and heating demands, improve system efficiency, and use renewable energy systems [22,23,24]. For nZEBs, although energy consumption during operation is substantially reduced, the proportion of embodied energy of the building components in the total energy of the whole life cycle is significantly increased compared to ordinary energy-saving buildings [25]. If we blindly and vigorously develop renewable energy production or improve system efficiency, instead of first reducing energy demands as much as possible, this will cause an increase in energy in other stages outside of the operation stage.
Verbeeck and Hens confirmed that the embodied energy in nZEBs is higher than the operating energy, but the total energy consumption is lower than that in ordinary energy-saving buildings [26]. The results of the case study show that even if the ratio of winter heating demands between ordinary energy-saving buildings and nZEBs is 10:1, the ratio of the total energy consumption (embodied energy + operating energy) for 70 years is only 2:1. In 2007, Citherlet and Defaux compared three different energy-saving standards for the same residential building in Switzerland [27]. They confirmed that the final energy of nZEBs will be substantially reduced, but the proportion of the environmental impact over the whole life cycle has changed significantly in the operation stage and other stages. The Swiss energy certification system MINERGIE also limits the maximum embodied energy to 50 kWh/m2 per year, which indicates that the embodied energy cannot be neglected.
In 2016, Kristjansdottir et al. noted that carbon emissions associated with the material production stage can reach 60–75% of the total life cycle of nZEBs in Norway [28]. However, it should be emphasized that the reduction of the overall building impact is significant, which means that the impact of operating energy and embodied energy should be considered together, and a comprehensive environmental impact evaluation cannot be achieved with regard to the operating energy of the building only [29,30].
The concept of a nZEB is increasingly being replaced by the concept of a zero-carbon building. According to EN 15978: 2011, the Norwegian Zero Emission Building Research Center provides the definition of a zero-carbon building, in which the equilibrium is measured by the greenhouse gas emissions [31,32]. Moreover, the research perspective of nZEBs is assessed by the “input“ energy of the building outside the “operating stage”, while the research perspective of zero carbon buildings is assessed by the “output” carbon emissions from the building into the environment at all stages of the “whole life cycle”. In particular, with a view to carbon neutrality, it is necessary for the building evaluation system to go beyond an energy consumption evaluation and move towards an environmental evaluation. Therefore, the time span of the building assessment is extended to the whole life cycle in order to verify the energy in the operation stage and the embodied energy in the production and transportation stages of the building materials.
There is still a lot of room for development of nZEBs into zero carbon buildings. Scholars such as L. Georges pointed out that zero carbon emissions in operation are easy to achieve, but overall zero carbon emissions including operating energy and embodied energy are difficult to achieve [33]. The use of environmentally friendly materials can substantially reduce the embodied carbon emissions [34]. Zero carbon emissions across the whole life cycle can be achieved by reducing the embodied energy emissions and increasing photovoltaic production [35].

2. Research Contents

At present, mature research on carbon emissions is mainly based on two types. One classification of national carbon emission sources is based on the “IPCC National Greenhouse Gas Guidelines”, which is more comprehensive and extensive [36]. The second carbon emission accounting system is mainly based on the enterprise’s products and projects, mainly including the International Organization for Standardization (ISO) “greenhouse gas verification standard“. However, the carbon emission factor provided by the first algorithm deviates from the actual carbon emission calculation factor of each country. The second type of carbon accounting that places special emphasis on the product has some limitations in regional carbon emissions accounting.
Paleari et al. conducted an environmental analysis of buildings based on the life cycle assessment (LCA) theory and ISO 14040:2006, ISO 14044:2006, EN 15643-2:2011, and EN 1597:2011 [37]. This reference conducts a statistical study of 70 references related to carbon emissions worldwide [38]. Although researchers have done a lot of basic work on carbon emissions, the LCA method and geographical differences lead to incompatibilities in estimating carbon emissions, and urgent action is needed to clarify the confusion in carbon emissions assessment studies.
The Ministry of Housing and Urban–Rural Development, referring to foreign advanced technical standards, summarizes the results of carbon emissions research related to construction and building materials in China. In 2019, China’s “Standard for building carbon emission calculation” (GB/T51366-2019) was proclaimed and implemented. This standard is more suitable for the calculation of a building’s carbon emissions according to the national conditions of China [39]. As this standard was soon published, there is no available literature to inquire about the practice of calculating specific carbon emissions according to this standard. The use of this carbon emission standard for the quantitative analysis of carbon emissions of current ordinary energy-saving buildings and nZEBs in China is still missing.
To solve this problem, we take an office building in Changchun city, Jilin province, which is located in a severe cold zone, as our research object. This building achieves the goal of a nZEB through the national “Technical standards for nearly zero energy buildings” certification. We explore the carbon emission characteristics at each stage within a “building carbon emission calculation standard” system, which not only analyzes the carbon saving potential compared to ordinary energy-saving buildings, but also seeks to use low-carbon building materials or increase the use of renewable energy to achieve the goal of life-cycle carbon reduction and provides the technical basis for the further development of nZEBs into zero carbon buildings.

3. Research Methods

3.1. Life Cycle Assessment and Carbon Emission Calculation Standards
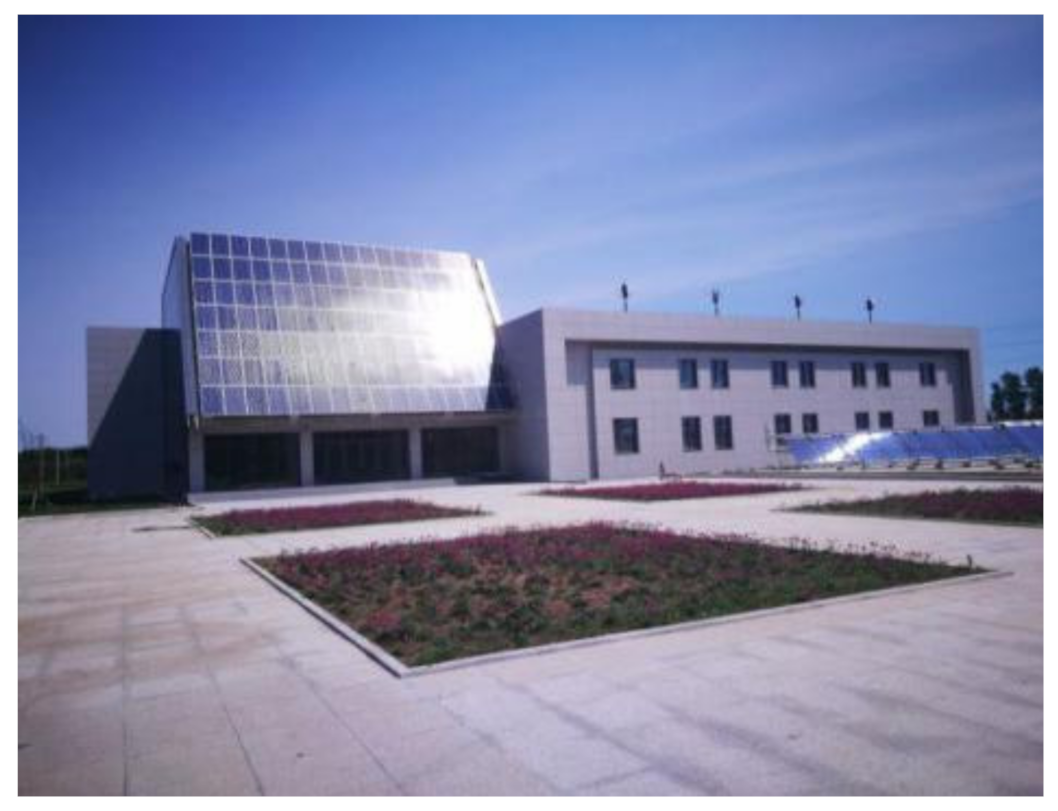
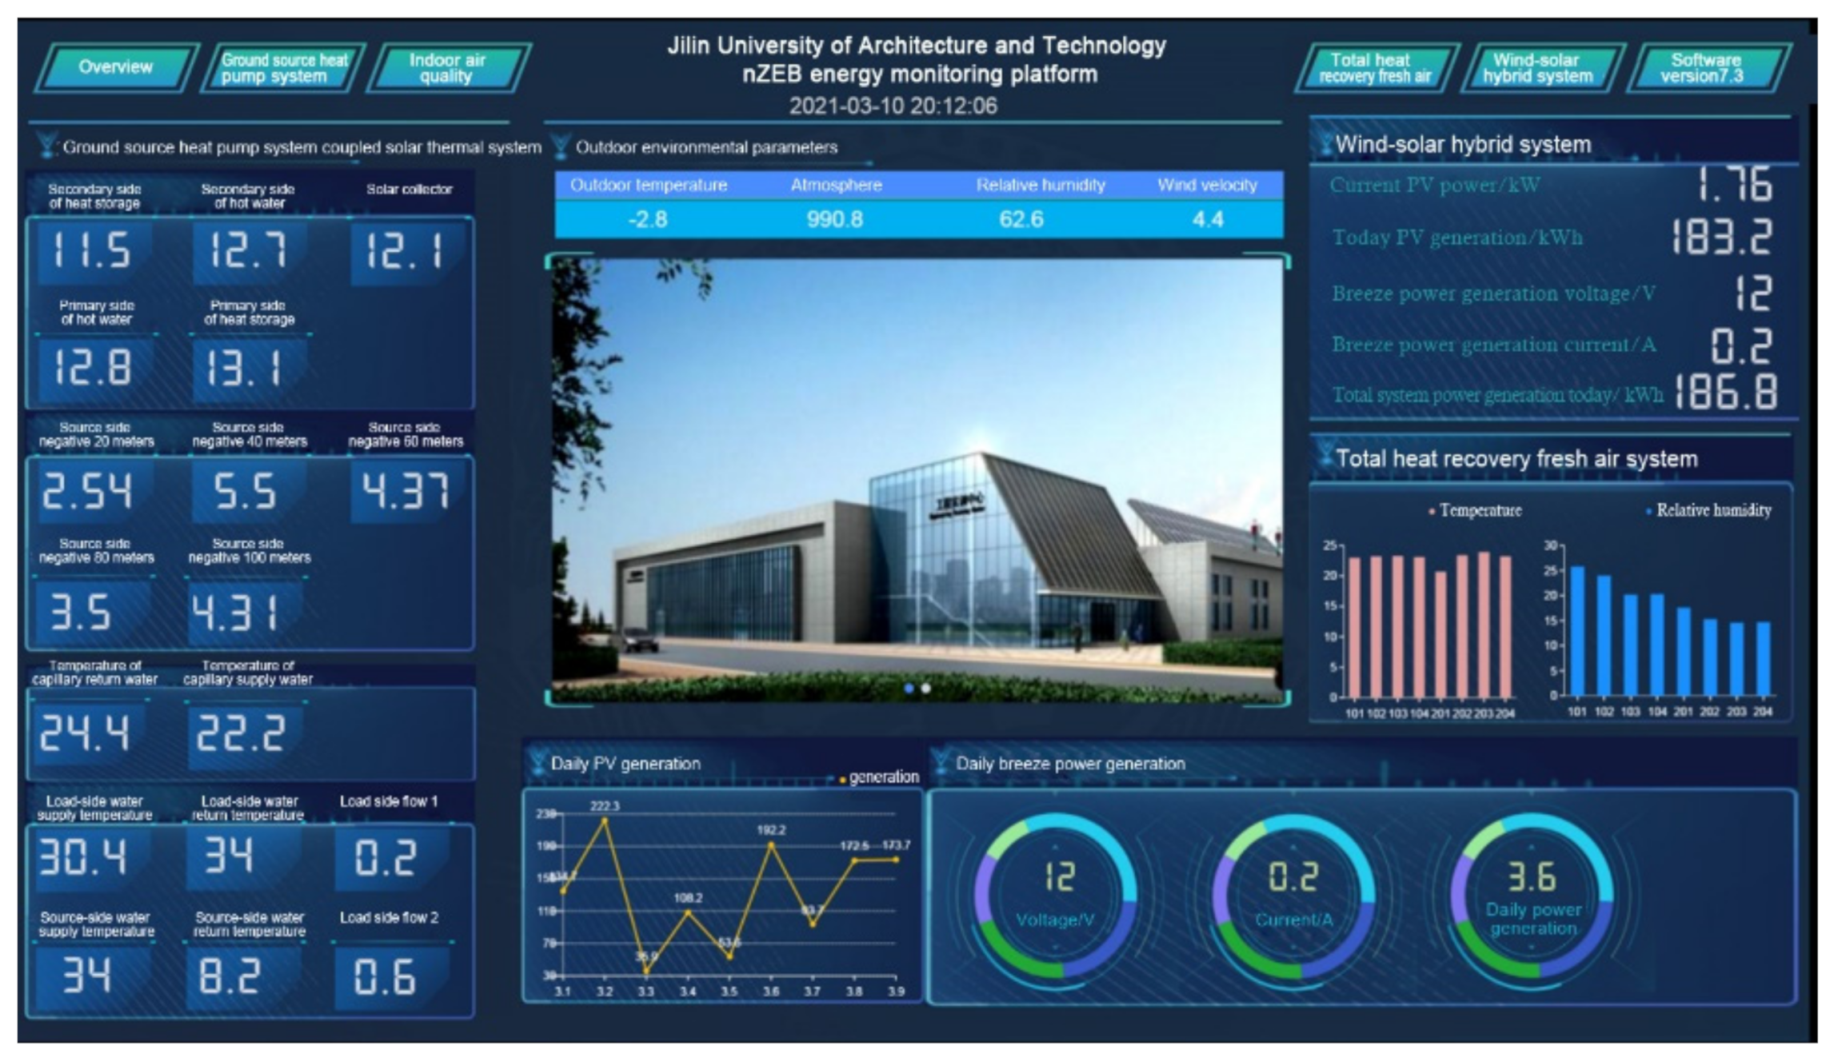
The LCA theory is usually used to evaluate the resource consumption and environmental impact of a product during its life cycle. Since it was proposed in 1990, it has been recognized as an important tool for evaluating the environmental impact of products. The building, as a product, is constantly flowing in and out of energy and materials. This process will be followed throughout the life cycle of the building, and there are different levels of environmental impacts at different stages. The whole life cycle of a building includes not only the traditional process from construction to operation, but also the extraction and production of building materials. After the operation of the building, there are additional stages, such as the demolition and cleaning of the building and the recovery and reuse of resources. The whole process is said to be from “cradle” to “grave” [40,41].
At present, the assessment of carbon emissions in construction in China is mainly based on the life cycle assessment of ISO standards. Through a qualitative evaluation of buildings and the experimental calculations of representative buildings, we progressively explore a common methodological standard for calculating the carbon emissions from buildings [42]. The Ministry of Housing and Urban–Rural Development summarized the research results on carbon emissions related to construction and building materials in China and drew on foreign normative standards and achievements to promulgate the “Standard for building carbon emission calculation” (GB/T 51366-2019). The whole life cycle is divided into three stages: the production and transportation of building materials, construction and demolition, and the operation of buildings. The calculation method for carbon emissions in the different stages is also given [39].

3.2. Case Study

The object of the study is a nZEB located in a severe cold zone. The exterior of the building is shown in Figure 1.
The building functions as two offices, two classrooms, and four laboratories. The geometric characteristics of the building are shown in Table 1.
The building adopts a high-performance envelope, thermal bridges, and air tightness treatment to reduce the cooling and heating requirements, and the specific parameters are shown in Table 2.
At the same time, solar, wind, and geothermal energy are used to form a multi-energy complementary system to meet the load demand, as shown in Table 3.
In this study, a nZEB in good operational condition and its energy consumption are based on field measurements. The measurement data were derived from the energy monitoring platform provided at the time of project construction (Figure 2). According to the requirements of the “Technical standard for nearly zero energy buildings” (GB/T 51350-2019) [43], key parameters of the indoor environment and energy consumption of the building classification are monitored and recorded.
The energy monitoring platform was based on the WCCV10-7.3 software (Changchun, China; the software version used is 7.3) system developed by the school–enterprise cooperation. The platform mainly completes the monitoring and recording of the following data: (I) All kinds of energy classification items are calculated; (II) Monitoring of indoor environmental parameters; (III) Monitoring of outdoor environmental parameters; and (IV) Energy consumption of renewable energy system is measured separately. The collection of energy consumption data in this study was from October 2019 to September 2020, covering the heating season (October 2019–April 2020) and the cooling season (July–August 2020). In 2020, it obtained the certificate based on the “Evaluation standard for nearly zero energy buildings” (T/CABEE JH-2019004) [44]. The requirements for energy efficiency were met, as shown in Table 4.
To further analyze the carbon emissions more comprehensively over the whole life cycle, we compared the nZEB with an 65% energy-saving building (the 65% energy-saving building is explained in Appendix A).
The carbon emissions of the two types of buildings are calculated based on a life cycle evaluation [39] and the carbon emission characteristics of the two buildings at various stages are compared. The specific calculations are shown in Table 5.

4. Carbon Emission Calculation Results and Analysis

4.1. Carbon Emissions in the Production and Transportation Stages of Construction Materials

4.1.1. Building Materials Production Stage

The calculation equation of the carbon emissions during the production of building materials is shown in Equation (1).
C s c = i = 1 n M i F i  
In Equation (1), C s c is the carbon emission in the production stage of building materials (kg CO2); M i is the consumption of main building materials ( i ); F i is the carbon emission factor of the i type building material (kg CO2/unit number of building materials).
The data collection of building material consumption for the nZEB and 65% energy-saving building in this study was based on Table 5 (above), and the main building material carbon emission factors were obtained from references [39,45].
The results of the main carbon emission factors, building materials consumption, sub-items, and total carbon emissions are shown in Table 6.

4.1.2. Building Materials Transportation Stage

The carbon emission basis for the transportation stage of the construction materials is shown in Table 7.
The calculation of the carbon emissions in the transportation stage of the building materials is shown in Equation (2).
C y s = i = 1 n M i D i T i
In the equation, C y s is the carbon discharge over the transportation of construction materials (kg CO2); D i is the average transportation distance (km) of the building materials; The carbon emission factor [kg CO2/(t·km)] for the transport distance per unit weight when T i is the transport mode of the i type building materials.
According to the standard, the default transportation distance of concrete is 40 km and the default transportation distance of the other building materials is 500 km. In this study, a medium-sized (8 t load capacity) diesel vehicle was selected for transport and the carbon emission factor was 0.179 kg CO2/(t·km) for the calculation. The carbon emissions of the transportation of various building materials are calculated according to the consumption of the building materials, and the calculated results are shown in Table 8.
Based on the above calculations, the carbon emissions from the production and transportation of the construction materials are 622.07 kg/m2 and 624.02 kg/m2 for the 65% energy-saving building and the nZEB, respectively. The carbon emission of the nZEB is increasing slightly, but the difference is not significant.

4.2. Carbon Emissions in the Operation Stage

The carbon emissions in the operation stage mainly refer to the energy emissions from the process of building use, which covers the heating, refrigeration, outdoor air, domestic hot water, lighting, renewable energy, carbon sink of buildings, etc. The carbon emissions in the operation stage of the building should be determined according to the different energy consumption types of each system and the carbon emission factors of the different energy consumption types, and the total carbon emissions per unit of building area are calculated via Equations (3) and (4).
C M = i = 1 n ( E i E F i ) C p y A
E i = i = 1 n ( E i , j E R i , j )
where C M is the total carbon emissions during the operation stage (kg CO2/m2); E i is the annual energy consumption of the i type (unit/a); E F i is the carbon emission factor of the i type; E i , j is the energy consumption of the i type of system j (unit/a); E R i , j is the energy consumption of the i type provided by the renewable energy system j (unit/a); i is the energy consumption type; j is the type of energy system; C p is the annual carbon reduction of the green space carbon sink (kg CO2/a); y is the design life cycle of the building (a), taken as 50 years; and A is the building area (m2).
The nZEB used the actual data from the 2019–2020 energy monitoring platform, and the 65% energy-saving building was simulated using eQUEST software (San Francisco, USA; the software version used is 3.6.5), as shown in Table 9.
According to the carbon emission factor values in Reference [39], the different energy consumptions are converted into the carbon emissions of the buildings and the carbon emissions at all stages of the whole life cycle are summarized. The results are shown in Table 10.

4.3. Carbon Emissions during Construction and Demolition

The carbon emissions during the construction stage should include the carbon emissions resulting from the completion of each part of the sub-construction and the implementation of various measures. The key is to determine the consumption of electricity, gasoline, diesel, gas, and other energy sources during the construction stage. The carbon emissions during the demolition stage are mainly the energy consumption from the process of dismantling the buildings by equipment on site.
However, judging from the recent literature, since data on these two stages are not easy to obtain and considering the whole life cycle, the carbon emissions during the construction and demolition stages account for a relatively small proportion overall [46,47]. Given the difficulty of obtaining data and the small proportion, they are generally ignored or estimated. This case adopts the estimation equation of the building construction stage given in the literature [48] and shown in Equation (5).
C J Z = X + 1.99
where C J Z is the carbon emission per unit of building area in the construction stage (kg CO2/m2); X is the number of floors of the building. According to Equation (5), the carbon emission in the construction stage is 3.99 kg CO2/m2 after substituting the number of floors, X = 2 . In the absence of relevant data for the demolition stage, it can be assumed that 10% of the construction stage is 0.40 kg CO2/m2 according to the relevant literature. For both types of buildings, the carbon emission is 4.39 kg CO2/m2.

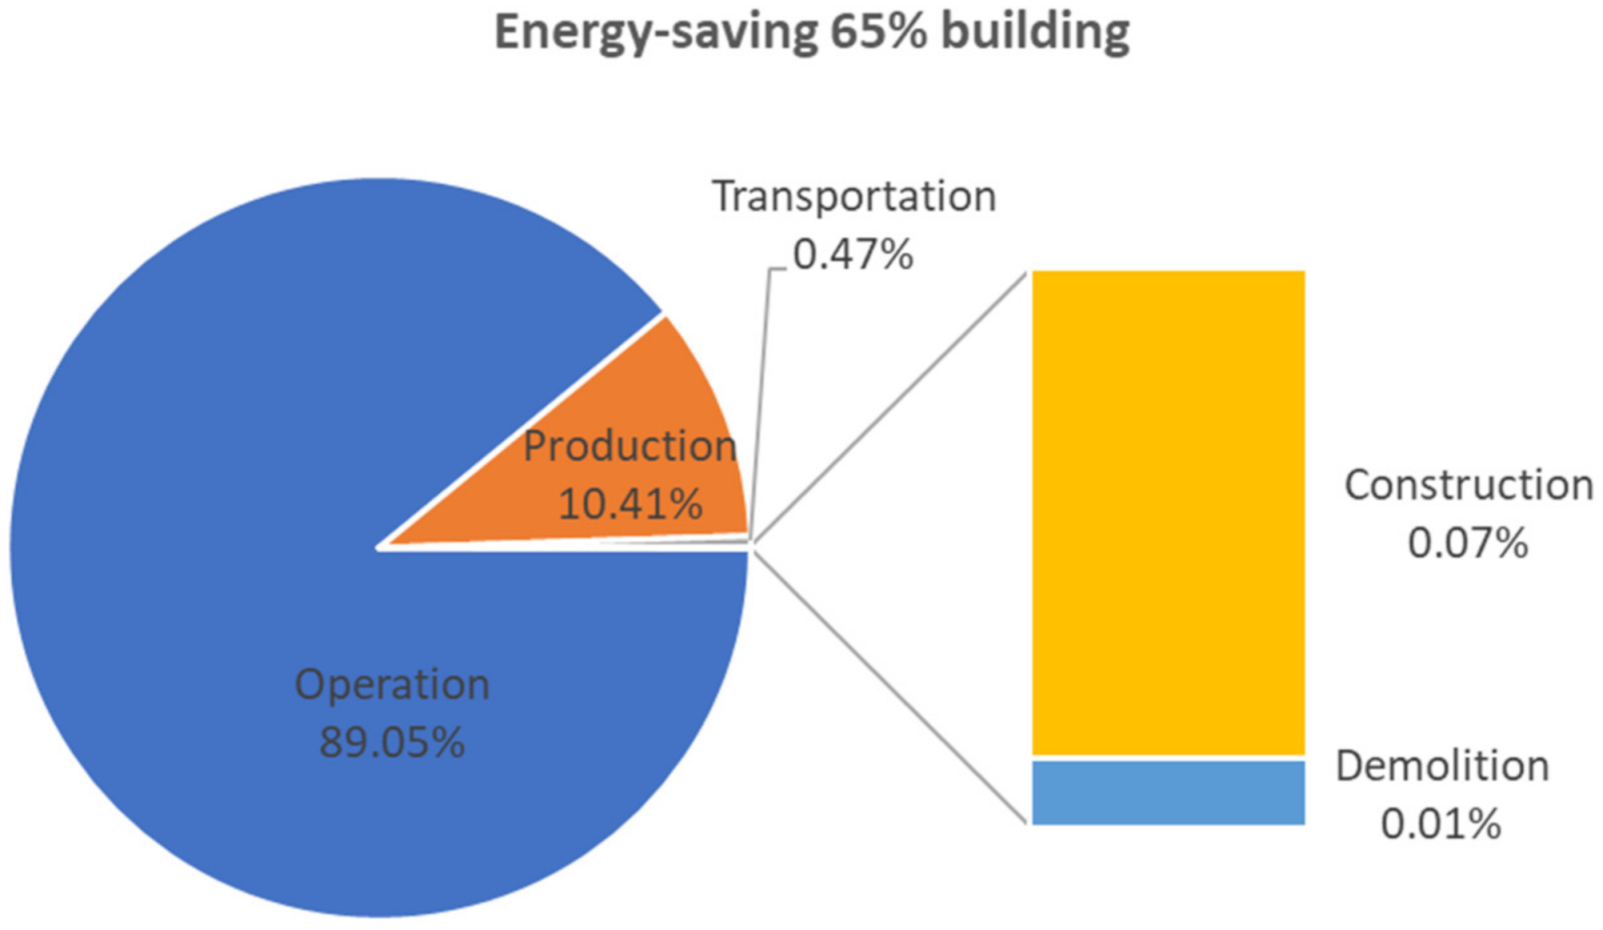
4.4. Total Carbon Emissions in the Whole Life Cycle

The total carbon emissions and their proportion in the whole life cycle are shown in Table 11.
As seen in Table 11, the carbon emissions of the nZEB are greatly reduced compared with 65% energy-saving buildings. The carbon emissions for the whole life cycle are 789.43 kg/m2, compared with the 65% energy-saving building’s, which are 5719.68 kg/m2—a reduction of 86.20%. It can be seen from Table 11 that, over the whole life cycle, the nZEB has a very obvious carbon reduction advantage in the operation stage.
As seen in Figure 3, for the 65% energy-saving building, the largest proportion of carbon emissions in the whole life cycle is in the operation stage, which accounts for 89.05%, followed by the production stage, which accounts for 10.41%.
As seen in Figure 4, for the nZEB, the largest proportion of carbon emissions in the whole life cycle is not in the operation stage, but in the building material production stage, which accounts for 75.62%, followed by the operation stage, which accounts for 20.40%.

5. Carbon Reduction Potential Analysis

According to the analysis of the carbon emissions data in Section 4.4, to achieve further carbon reduction over the whole life cycle of a nZEB, the focus should be on the production stage. The production stage of the building materials is mainly reflected in the energy of the material itself, i.e., the embodied energy. The priority of using low-carbon materials and replacing materials has become the trend in carbon reduction. The role of material replacement in energy-saving in buildings and carbon reduction is reviewed in article [49].
Reddy shows that the use of material substitution technology can reduce the embodied energy of buildings by about 50% [50]. Thormark describes how the choice of materials affects the embodied energy of one of Sweden’s most energy-saving housing projects. The studied object is the Swedish scheme within the CEPHEUS project in the European Thermie programme [51]. Initially, the embodied energy accounted for 40% of the total energy needed for a 50-year life cycle. Embodied energy can be reduced by about 17% by replacing the material. Habert and Roussel evaluated a sustainable concrete mixture, which is designed to replace clinker in cement with mineral additives in order to reduce the environmental cost of materials needed for a certain volume of concrete. Improving the concrete replacement levels can reduce 15% of carbon dioxide emissions [52]. Research by Buchanan and Levine shows that wooden buildings consume less process energy than other materials, such as steel and concrete, resulting in lower carbon emissions [53].
The latest research collected and collated the embodied energy and carbon emissions of various building materials, including 47 studies on concrete material, 26 studies on steel material, 32 studies on brick material, 22 studies on geotechnical material, and 17 studies on wood material [54]. As the most studied material, concrete can be mixed with other materials. Following the summary, the general situation and scope of the embodied energy and embodied carbon emissions of different materials are reported at the material level, which is a valuable reference to scholars in different countries to conduct further research.
In order to further reduce the carbon emissions of nZEBs, the following will explore specific measures to reduce carbon by giving priority to the use of low-carbon materials and local renewable energy.

5.1. Analysis of the Influencing Parameters

5.1.1. Adopt a Timber Structure

Compared to traditional concrete and other high-energy-consumption building materials, timber is an environmentally friendly building material that can achieve a negative overall carbon footprint. Given that CO2 can be aggregated and fixed during the growth of trees, its carbon emission factor is negative. Therefore, promoting the use of timber is also an important means of reducing carbon emissions. In order to further explore the carbon reduction potential of this nZEB, a timber structure system is assumed to be used for the carbon emission analysis. The carbon emissions of different tree species at the production stage are different, and, in this study, two types of wood—northeastern fir and northeastern larch—were selected for analysis. Considering that the geographical characteristics are in close proximity to the northeastern species [55,56], the carbon emissions during the production stage were −32.25 kg CO2/m3 and −374.41 kg CO2/m3. The calculation results are shown in Table 12.
With the adoption of a timber structure, the carbon emissions in the building material production stage are −56.23 and 168.78 kg CO2/m2, and the carbon emissions in this stage can achieve zero or negative values. Assuming the same carbon emissions for the other stages for previous nZEBs, the total carbon emissions are 136.22 and 361.23 kg CO2/m2, which are 82.74% and 54.24% lower than the previous 789.43 kg/m2.

5.1.2. Adopt Low-Carbon Building Materials

Concrete accounts for the largest proportion of building materials’ carbon emissions, so we should choose low-carbon materials such as recycled concrete as a replacement. Recycled concrete is distinguished by the mechanical, fire-resistant, and seismic properties of its components, which are basically equivalent to those of ordinary concrete. However, through the integrated use of waste concrete, we can minimize energy consumption and reduce greenhouse gas emissions. The authors of [57] studied the life-cycle carbon emission of recycled concrete. The carbon emission factor of recycled concrete used in this paper is 314.2 kg CO2/m3, which is compared with the carbon emission factor of 320 kg CO2/m3 of ordinary concrete that is used in the nZEB in Table 6.

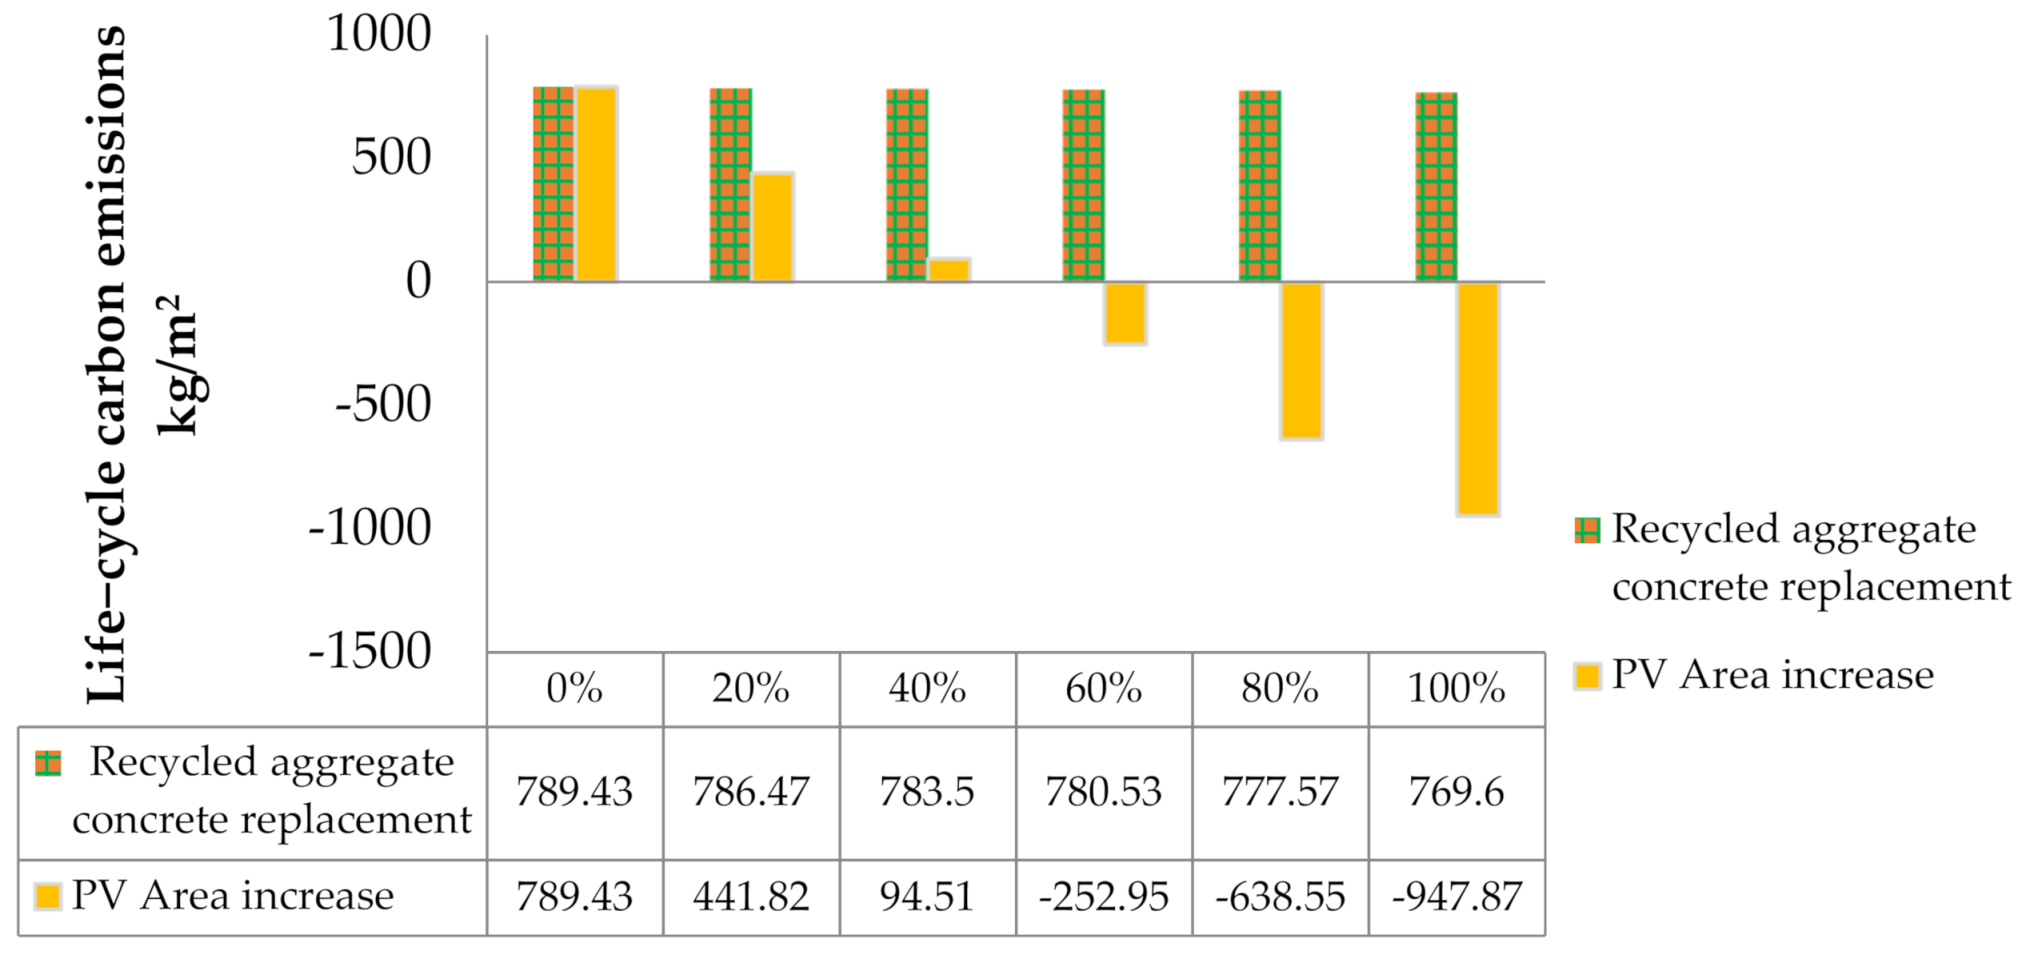
5.1.3. Increase the Area of Photovoltaic Panels

For nZEBs, the application of photovoltaic power generation is an important way to achieve zero emissions in their operation stage, especially for the whole life cycle. Although an increase in photovoltaic panels will lead to an increase in the production of building materials, it has a more important impact on reducing the carbon emissions in the operation stage. One way to do this is through a carbon sink that is brought by renewable energy production in the operation stage, the other is the calculation of the carbon emissions over the whole life cycle of the operation stage, which is calculated based on a building life of 50 years.
The number of PVs in this project has been sufficient to supply energy only to theoretically study the impact of PV increases on carbon emissions.

5.2. Sensitivity Analysis

Sensitivity analysis studies help us to understand the impact of various design parameters on carbon emissions throughout the whole life cycle of a building and determine which parameters are the key factors affecting carbon emissions. For the nZEB studied in this paper, the whole life carbon emissions of the building were selected as the output parameter, and the recycled concrete replacement rate and photovoltaic panel power increment were selected as the input parameters for the sensitivity analysis.
A sensitivity analysis is an uncertainty analysis technique, analyzing the relevant factors from a quantitative perspective and considering the degree of impact on relevant key indicators when changes occur. The evaluation index is the sensitivity coefficient, which is calculated by the Equation (6).
S i = Δ L / L n Δ P i / P i , n
where: S i is the sensitivity coefficient; Δ P i is the change of input parameter, Δ P i = P i P i , n ; P i is the value of the input parameter; P i , n is the base value for each input parameter i ; Δ L = L i L n ; L n is the reference value of the output parameter. The sensitivity coefficient represents the percentage of the “relative change in result” relative to the “relative change in a given input parameter”. If the value of a parameter is 0.5, it means that when its value increases by 10% the final result increases by 5% [58]. The higher the absolute value of the sensitivity coefficient, the greater the impact of the input parameters on carbon emissions and, therefore, the more important the parameter.

5.3. Analysis of Results

The recycled concrete replacement rate and PV panel power generation increment are all considered in 20% step changes—that is, the input parameter changes from 0% to 20%, then 40%, 60%, 80%, and 100% based on the existing parameter benchmark values. The carbon emission accounting is re-performed according to Equations (1)–(5), and the calculation results are shown in Figure 5.
According to the above carbon emission accounting results, it can be seen that, with an increase in the amount of change, carbon emissions have all decreased to varying degrees, and the substitution of recycled concrete in the building materials and the increase in PV area have all had an impact on the whole life cycle carbon emissions of nZEBs. From the example data in Figure 5, it can be seen that the increase in PV panels will significantly reduce the carbon emissions, and when the PV panels are increased by 60% or more, the whole life cycle carbon emissions will have reached zero or negative values.
However, the results show that although parameter changes will reduce carbon emissions, the degree of impact is different. The impact of the change in each parameter is evaluated, and the sensitivity analysis is performed according to Equation (6). The results of the analysis are shown in Table 13.
The sensitivity coefficients in Table 13 are negative, which means that the carbon emissions decrease with increasing values of the design parameters. However, the influence of various design parameters is different. The sensitivity coefficient of the photovoltaic power increase is nearly 80 times the sensitivity coefficient of the recycled concrete replacement rate; that is, the sensitivity of the photovoltaic power increase to carbon emission reduction is relatively higher.
For achieving zero carbon emissions over the whole life cycle, through blindly adding photovoltaic panels or other embodied energy-saving devices—although the energy consumption during the operation stage is apparently offset—the embodied energy of the equipment and building materials will also increase accordingly. However, from a whole life cycle perspective, it is particularly difficult to know whether to reduce carbon emissions or not. Quantifying the carbon emission results of the different types of structures based on the comparison of carbon emissions of different building types can provide a reference for designers.

6. Conclusions

1. From the perspective of the whole life cycle evaluation theory, based on the “Standard for building carbon emission calculation” (GB/T 51366-2019), we calculated the carbon emissions of a nZEB built in a severe cold zone and certified it at each stage and analyzed the carbon emission characteristics of each stage. From high to low, the building materials production stage accounted for 75.62%, the operation stage accounted for 20.40%, the building materials transportation stage accounted for 3.43%, and the construction and demolition stage accounted for 0.56%; these proportions are very different from those of a 65% energy-saving building.
2. We conducted a horizontal comparative analysis of the carbon emissions of a nZEB and a building of the same size implementing the current local energy-saving standard of 65%. The life cycle carbon emissions of a nearly zero energy building are 789.43 kg/m2. Compared with the 5719.68 kg/m2 of a 65% energy-saving building, the carbon emissions were reduced by 86.20%. It can be seen that the outstanding advantage of nZEBs in terms of carbon reduction is also the only way for buildings to achieve zero carbon.
3. The largest proportion of carbon emissions in 65% energy-saving buildings was in the operation stage, accounting for 89.05%, and its carbon emissions were 5093.22 kg/m2; if 65% energy-saving buildings want to reduce carbon emissions; the most effective way is to reduce the carbon emissions in the operation stage. The nZEB in this study has reduced the carbon emissions in the operation stage to 161.02 kg/m2, a decrease of 96.84%, through measures such as high-performance envelope structures, high-efficiency equipment, and the use of renewable energy, and the carbon reduction advantage in the operation stage is particularly obvious.
4. Considering the whole 50-year life cycle of the building, the total carbon emissions of the nZEB are 789.43 kg/m2, which is still far from zero. The carbon reduction potential of nZEBs should be placed first in the production stage of the building materials, followed by the operation stage. The nZEB is further analyzed for its carbon reduction potential by adopting timber structures and recycled concrete and increasing the photovoltaic power pathways, and the impact of these different parameters is quantified using sensitivity analysis methods to provide a reference for designers.
5. Through the study and analysis of the carbon emissions of nZEBs in severe cold zones, we can understand the current situation of carbon emissions in the production and transportation of building materials, construction and demolition, and operation stages under the current standard in China. Although the research perspective is different, it is consistent with the goals of the carbon neutral strategy. Our research also provides a case study for the next step of promoting zero carbon buildings in different climate zones. To realize the transition from nZEBs into zero carbon buildings, a stronger strategic focus on low-carbon structural systems, low-carbon building materials, and renewable energy use than currently exists is required.

Author Contributions

Conceptualization, Y.W. and J.T.; methodology, Y.W.; software, Q.H.; validation, X.Y.; formal analysis, X.Y.; data curation, Y.W. and Q.H.; writing—original draft preparation, Q.H.; writing—review and editing, Y.W.; supervision, J.D. and X.Y. All authors have read and agreed to the published version of the manuscript.

Funding

This research was funded by Major special scientific research project of Jilin University of Architecture and Technology, grant number [2019]003; R&D Program of MoHURD, grant number K20210466; Science and Technology Research of the Education Department of Jilin Province, grant number JJKH20211371KJ.

Institutional Review Board Statement

Not applicable.

Informed Consent Statement

Not applicable.

Data Availability Statement

Not applicable.

Conflicts of Interest

The authors declare no conflict of interest.

Appendix A

According to China’s staged building energy-saving policy, the energy consumption level of local general design from 1980 to 1981 is the benchmark. The first stage (1986–1995) saves 30 percent of the energy consumption benchmark. The second stage (1996–2004) saves 30 percent more energy on the basis of meeting the requirements of the first stage, which is equivalent to 50 percent of the total energy consumption benchmark (30 percent + 70 percent × 30 per cent ≈ 50 percent). Since 2005, the energy consumption level of the third stage should be saved by 30% on the basis of the second stage, which is equivalent to 65% of the total energy consumption benchmark (50% + 50% × 30% = 65%). 65% Energy-saving buildings are to meet the requirements of the third stage of the energy consumption level, which referred to as a 65% energy-saving building.

References

  1. IEA. Global Status Report for Buildings and Construction; IEA: Paris, France, 2019.
  2. THUBERC. 2020 Annual Report on China Building Energy Efficiency; China Architecture & Building Press: Beijing, China, 2020. [Google Scholar]
  3. Yang, X.Y.; Zhang, S.; Wang, K. Quantitative study of life cycle carbon emissions from 7 timber buildings in China. Int. J. Life Cycle Assess. 2021, 26, 1721–1734. [Google Scholar] [CrossRef]
  4. Intergovernmental Panel for Climate Change (IPCC). Summary for Policymakers, Climate Change; IPCC WG1 Fourth Assessment Report; Cambridge University Press: Cambridge, UK, 2007. [Google Scholar]
  5. Erhorn., H.; Erhornkluttig, H. The path towards 2020: Nearly zero-energy buildings. Rehva J. 2012, 49, 12–15. [Google Scholar]
  6. IEA. Global Status Report for Buildings and Construction; IEA: Paris, France, 2013.
  7. Qiu, L.U. German passive and ultra-low-energy building technology system. Eco-City Green Build. 2015, 1, 29–36. [Google Scholar]
  8. German Government. German Energy Saving Act 2009 (EnEG 2009); German Government: Berlin, Germany, 2009.
  9. MINERGIE®: The Swiss Standard for Comfort, Efficiency and Value Preservation [R]. 2017. Available online: https://www.minergie.ch/media/20170906_flyer_minergie_allgemein_en_rgb.pdf (accessed on 6 September 2017).
  10. Bao, L.; He, Y. Low Energy Consumption for the Future Building: Analysis on “MINERGIE”—Swiss Sustainable Building standard. Eco-City Green Build. 2010, 4, 50–53. [Google Scholar]
  11. zHome: Setting a National Net Zero Energy and Green Building Precedent[R]. Available online: https://www.builtgreen.net/docs/librariesprovider2/resources/zhome-white-paper.pdf (accessed on 19 November 2021).
  12. Li, H.; Zhang, S. Japan Zero Energy Building Development Status. Build. Sci. 2017, 33, 142–148. [Google Scholar]
  13. Kamimura, T. KI Building Renewal towards ZEB: Outline of 50% Energy Savings and Lighting Plan (Trend of net Zero Energy Building and Energy Saving by Lighting). J. Illum. Eng. Inst. Jpn. 2014, 98, 265–268. [Google Scholar] [CrossRef] [Green Version]
  14. Lee, M.-J. Planning and Implementation of Korea’s first Zero Energy Housing Complex. Rev. Archit. Build. Sci. 2014, 58, 47–53. [Google Scholar]
  15. Li, Y.; Zhang, S.; Xu, W. Study of Zero Energy Building Development in Korea. Build. Sci. 2016, 32, 171–177. [Google Scholar] [CrossRef]
  16. Kim, Y.; Yu, K.H. Study on the Certification Policy of Zero-Energy Buildings in Korea. Sustainability 2020, 12, 5172. [Google Scholar] [CrossRef]
  17. Zhang, S.; Wang, K.; Lv, Y.J.; Xu, W. Research and Practice of Nearly Zero Energy Building Evaluation. Build. Sci. 2020, 17, 61–67. [Google Scholar]
  18. Marszal, A.J.; Heiselberg, P.; Bourrelle, J.S.; Musall, E.; Voss, K.; Sartori, I.; Napolitano, A. Zero energy building-a review of definitions and calculation methodologies. Energy Build. 2011, 43, 971–979. [Google Scholar] [CrossRef]
  19. The State Council Information Office of the People’s Republic of China. Energy in China’s New Era; The People’s Daily 12-22(010): Beijing, China, 2020.
  20. Zhang, S.; Lv, Y.J.; Xu, W. Research on the Energy Criteria and Technology Path of 64 Ultra-low Energy Building Best Practices. Build. Sci. 2020, 36, 7–13. [Google Scholar]
  21. Xu, W.; Yang, X.Y.; Zhang, S.C. Key Issues and Solutions for the Development of Near-Zero Energy Buildings in China. Build. Sci. 2020, 34, 165–173. [Google Scholar]
  22. Sartori, I.; Hestnes, A.G. Energy use in the life cycle of conventional and low-energy buildings: A review article. Energy Build. 2007, 39, 249–257. [Google Scholar] [CrossRef]
  23. Ramesh, T.; Prakash, R.; Shukla, K.K. Life cycle energy analysis of buildings: An overview. Energy Build. 2010, 42, 1592–1600. [Google Scholar] [CrossRef]
  24. Blengini, G.A.; Di Carlo, T. The changing role of life cycle phases, subsystems and materials in the LCA of low energy buildings. Energy Build. 2010, 42, 869–880. [Google Scholar] [CrossRef]
  25. D’Agostino, D.; Mazzarella, L. Data on energy consumption and Nearly zero energy buildings (NZEBs) in Europe. Data Brief 2018, 21, 2470–2474. [Google Scholar] [CrossRef] [PubMed]
  26. Verbeeck, G.; Hens, H. Life cycle inventory of buildings: A contribution analysis. Build. Environ. 2010, 45, 964–967. [Google Scholar] [CrossRef]
  27. Citherlet, S.; Defaux, T. Energy and environmental comparison of three variants of a family house during its whole life span. Build. Environ. 2007, 42, 591–598. [Google Scholar] [CrossRef]
  28. Kristjansdottir, T.F.; Good, C.S.; Inman, M.R.; Schlanbusch, R.D.; Andresen, I. Embodied greenhouse gas emissions from PV systems in Norwegian residential Zero Emission Pilot Buildings. Sol. Energy 2016, 133, 155–171. [Google Scholar] [CrossRef]
  29. De Wolf, C.; Pomponi, F.; Moncaster, A. Measuring embodied carbon dioxide equivalent of buildings: A review and critique of current industry practice. Energy Build. 2017, 140, 68–80. [Google Scholar] [CrossRef]
  30. Cabeza, L.F.; Barreneche, C.; Miro, L. Affordable construction towards sustainable buildings: Review on embodied energy in building material´s Ferna. Curr. Opin. Environ. Sustain. 2013, 5, 229–238. [Google Scholar] [CrossRef]
  31. Kristjansdottir, T.F.; Heeren, N.; Andresen, I.; Brattebø, H. Comparative emission analysis of low-energy and zero-emission buildings. Build. Res. Inf. 2017, 46, 367–382. [Google Scholar] [CrossRef]
  32. European Committee for Standardization. EN 15978; Sustainability of Construction Works—Assessment of Environmental Performance of Buildings—Calculation Method. European Committee for Standardization: Brussels, Belgium, 2011.
  33. Georges, L.; Haase, M.; Wiberg Houlihan, A.A.M.; Kristjansdottir, T.F.; Risholt, B. Life cycle emissions analysis of two nZEB concepts, Build. Res. Inf. 2015, 43, 82–93. [Google Scholar]
  34. Cao, X.D.; Dai, X.L.; Liu, J.J. Building energy-consumption status worldwide and the state-of-the-art technologies for zero-energy buildings during the past decade. Energy Build. 2016, 128, 198–213. [Google Scholar] [CrossRef]
  35. Wiberg, A.H.; Hofmeister, T.B.; Kristjansdottir, T.; Time, B. Life cycle GHG Emissions from a wooden load-bearing alterntive for a ZEB office concept. In Expanding Boundaries: Systems Tinking in the Built Enviroment; Ulster University: Belfast, UK, 2016; pp. 454–458. [Google Scholar]
  36. Lim, B.; Boileau, P.; Bonduki, Y.; Van Amstel, A.R.; Janssen, L.H.; Olivier, J.G.; Kroeze, C. Improving the quality of national greenhouse gas inventories. Environ. Sci. Policy 1999, 2, 335–346. [Google Scholar] [CrossRef]
  37. Paleari, M.; Lavagna, M.; Campioli, A. The assessment of the relevance of building components and life phases for the environmental profile of nearly zero-energy buildings: Life cycle assessment of a multifamily building in Italy. Int. J. Life Cycle Assess. 2016, 21, 1667–1690. [Google Scholar] [CrossRef]
  38. Cabeza, L.F.; Chàfer, M. Technological options and strategies towards zero energy buildings contributing to climate change mitigation: A systematic review. Energy Build. 2020, 219, 110009. [Google Scholar] [CrossRef]
  39. MoHURD. GB/T 51366-2019; Calculation Standard for Building Carbon Emissions. China Architecture & Building Press: Beijing, China, 2019.
  40. Marique, A.-F.; Rossi, B. Cradle-to-grave life-cycle assessment within the built environment: Comparison between the refurbishment and the complete reconstruction of an office building in Belgium. J. Environ. Manag. 2018, 224, 396–405. [Google Scholar] [CrossRef] [Green Version]
  41. Lin, Y.; Yang, W.; Hao, X.L.; Yu, C.X. Building integrated renewable energy. Energy Explor. Exploit. 2021, 39, 603–607. [Google Scholar] [CrossRef]
  42. International Energy Agency. Solar Heating & Cooling Program IEA/SHC 2000 Overview: Solar Combi Systems; IEA: Paris, France, 2000.
  43. MoHURD. GB/T 51350-2019; Technical Standard for Nearly Zero Energy Buildings. China Architecture & Building Press: Beijing, China, 2019.
  44. CECA. T/CABEE 003-2019; Evaluation Standard for Nearly Zero Energy Buildings. China Architecture & Building Press: Beijing, China, 2019.
  45. Zhao, Y.Q.; Hou, X.Y.; Tang, S.S.; Deng, J.Y.; Yang, X. Economic Analysis and Carbon Emissions of Near-Zero Energy Buildings Based on Lifetime. Build. Energy Effic. 2020, 48, 126–130. [Google Scholar]
  46. Ding, G.K.C. Life cycle energy assessment of Australian secondary schools. Build. Res. Inf. 2007, 35, 487–500. [Google Scholar] [CrossRef]
  47. Suh, S.W.; Tomar, S.; Leighton, M.; Kneifel, J. Environmental performance of green building code and certification systems. Environ. Sci. Technol. 2014, 48, 2551–2560. [Google Scholar] [CrossRef] [Green Version]
  48. Sadineni, S.B.; France, T.M.; Boehm, R.F. Economic feasibility of energy efficiency measures in residential buildings. Renew. Energy 2011, 36, 2925–2931. [Google Scholar] [CrossRef]
  49. Cabeza, L.F.; Barreneche, C.; Miró, L.; Morera, J.M.; Bartolí, E.; Fernandez, A.I. Low carbon and low embodied energy materials in buildings: A review. Renew. Sustain. Energy Rev. 2013, 23, 536–542. [Google Scholar] [CrossRef]
  50. Reddy, B.V.V. Sustainable materials for low carbon buildings. Int. J. Low-Carbon Technol. 2009, 4, 175–181. [Google Scholar] [CrossRef] [Green Version]
  51. Thormark, C. The effect of material choice on the total energy need and recycling potential of a building. Build. Environ. 2006, 41, 1019–1026. [Google Scholar] [CrossRef]
  52. Habert, G.; Roussel, N. Study of two concrete mix-design strategies to reach carbon mitigation objectives. Cem. Concr. Compos. 2009, 31, 397–402. [Google Scholar] [CrossRef]
  53. Buchanan, A.H.; Levine, S.B. Wood-based building materials and atmospheric carbon emissions. Environ. Sci. Policy 1999, 2, 427–437. [Google Scholar] [CrossRef]
  54. Cabeza, L.F.; Boquera, L.; Chàfer, M.; Vérez, D. Embodied energy and embodied carbon of structural building materials: Worldwide progress and barriers through literature map analysis. Energy Build. 2021, 231, 1146–1158. [Google Scholar] [CrossRef]
  55. Gong, X.; Nie, Z.; Wang, Z.; Cui, S.; Gao, F.; Zuo, T. Life cycle energy consumption and carbon dioxide emission of residential building designs in Beijing: A comparative study. J. Ind. Ecol. 2012, 16, 576–587. [Google Scholar] [CrossRef]
  56. Teng, J.Y.; Wu, X.G.; Qin, Y.W.; Hou, T.M.; Zhang, L.M. Assessing incremental cost-efficiency of eco-footprint saving measures for school buildings: The case of the Inner Mongolia region in China. Eng. Econ. 2016, 61, 244–261. [Google Scholar] [CrossRef]
  57. Zhou, X.; Yan, J.W.; Zhu, J.W.; Cai, P.P. Survey of energy consumption and energy conservation measures for colleges and universities in Guangdong province. Energy Build. 2013, 66, 112–118. [Google Scholar] [CrossRef]
  58. Wu, P.; Xia, B.; Zhao, X. The importance of use and end of-life phases to the life cycle greenhouse gas (GHG) emissions of concrete—A review. Renew. Sustain. Energy Rev. 2014, 37, 360–369. [Google Scholar] [CrossRef] [Green Version]
Figure 1. Building exterior view.
Sustainability 14 01448 g001
Figure 2. Interface diagram of energy monitoring platform.
Sustainability 14 01448 g002
Figure 3. Proportions of life-cycle carbon emissions at different stages of the 65% energy-saving building.
Sustainability 14 01448 g003
Figure 4. Proportions of life-cycle carbon emissions at different stages of the nZEB.
Sustainability 14 01448 g004
Figure 5. Calculated results of carbon emissions under different parameter changes.
Sustainability 14 01448 g005
Table 1. The main geometric characteristics of the study object.
DescriptionNumerical Values
Total floors2
Total construction area (m2)1180
Heating volume (m3)3150
External wall area (m2)592
Roof area (m2)425
Window and exterior door area (m2)92.4
Table 2. Envelope performance parameters of the research object.
Building EnvelopesStructural ParametersValue
W/m2K
External wall190 mm block + 140 mm Expanded Polystyrene (EPS) insulation board + 80 mm rock wool + 50 mm thermal insulation mortar + 12 mm inorganic resin decoration panel0.1
Ground40 mm fine aggregate concrete + 80 mm concrete cushion + Insulation of extruded board with 50 mm thickness in 2000 mm wide range around external wall + 80 mm gravel filled with cement mortar0.1
Roof300 mm Expanded Polystyrene (EPS) insulation board + 200 mm reinforced concrete roof panel0.1
WindowThe frame is a combination of imported solid wood and thermal insulation materialsThree-glass two-cavity double low-E argon-filled hollow glass0.8
Table 3. Research object renewable energy system.
Renewable Energy SystemsEquipment and SpecificationsQuantitiesNominal Parameter
PV power generation systemPolycrystalline silicon photovoltaic panels/LN240(30)-3-250112 pieces28 kW
Solar Thermal SystemHeat pipe solar collector/Z-QB/20-5848 groups158.4 m2
Breeze power generation systemBreeze force generator set/CXF-600 Wdn1504 sets2.4 kW
Ground Source Heat Pump SystemCapacity with cooling 62.5 kW and heating 46.5 kW1 set62.5 kW/46.5 kW
Table 4. Energy efficiency index of research objects.
ProjectNumerical
Number
Standard RequirementsWhether to Meet the Requirements
Comprehensive building energy efficiency rate (%)163.70≥60%Satisfy
Renewable Energy Utilization Rate (%)135.01≥10%Satisfy
Ontology of Architecture Energy Conservation rate (%)82.85≥10%Satisfy
Ventilation rate N500.60≤1.0Satisfy
Table 5. Calculation basis of carbon emission in each stage.
Building TypeDesign StandardsData AcquisitionCalculation Basis
65% Energy-saving building“Design Standard for Energy Efficiency of Public Buildings (Energy-Saving 65%)”
(DB22/JT 149-2016)
The 65% energy-saving building was simulated using eQUEST software (San Francisco, USA; the software version used is 3.6.5), and data collection was extracted from the building information model (BIM) available in the projectStandard for building carbon emission calculation
(GB/T 51366-2019)
nZEB“Technical Standard for Nearly zero Energy Buildings“(GB/T51350-2019)Invoices paid by builders, quantities of construction operations and consumed materials in construction site reports, and design drawings obtained, and energy consumption data collected by energy monitoring platforms
Table 6. Carbon emissions in the production stage of building materials for two types of buildings.
Building TypesBuilding MaterialsCarbon Emission FactorsConsumption of Building MaterialsSub-Items Carbon Emissions
kg CO2/m2
Subtotal of Carbon Emissions
kg CO2/m2
65% Energy-saving buildingConcrete320 kg CO2/m31258 m3341.15595.33
Reinforcement2617 kg CO2/t109 t241.74
Polystyrene4.487 kg CO2/kg1325 kg5.04
Low-E glass1071 kg CO2/t0.38 t0.34
Alloy window Frame253.7 kg CO2/m232.8 m27.06
nZEBConcrete320 kg CO2/m31258 m3341.15596.98
Reinforcement2617 kg CO2/t109 t241.74
Polystyrene4.487 kg CO2/kg2484 kg9.45
Low-E glass1071 kg CO2/t0.56 t0.51
Wood window frame147 kg CO2/m232.8 m24.09
PV photovoltaic panels2 kg CO2/kW28 kW0.05
Table 7. Construction material transportation stage calculation basis.
Transport StageSub-ItemsBasis
The transportation of building materials from the place of production to the site of constructionMining and processing of energy consumed during the transportation of building materialsCalculation
Production of transportation vehiclesThe influence of incomplete basic data is small and can be ignored
Construction of infrastructure such as transportation roads
Table 8. Carbon emissions in the transportation stage of building materials.
Building TypesBuilding MaterialsTransport Weight
t
Transportation Distance
km
Sub-Items Carbon Emissions
kg CO2/m2
Subtotal of Carbon Emissions
kg CO2/m2
65% Energy-saving buildingConcrete30194018.3226.74
reinforcement1095008.27
Polystyrene1.335000.10
Low-E glass0.385000.03
alloy window Frame0.265000.02
nZEBConcrete30194018.3227.04
reinforcement1095008.27
Polystyrene2.485000.19
Low-E glass0.565000.04
wood window frame0.985000.07
PV photovoltaic panels1.965000.15
Table 9. The energy use intensity of the two types of buildings in operation (kWh/m2a).
Building TypeHeatingRefrigerationOutdoor AirLightingPV PowerEnergy Consumption
65% Energy-saving building45.0616.1521.7111.590.0094.51
nZEB16.089.284.566.3431.714.56
Table 10. Carbon emissions of the two types of buildings in operation.
Building TypeEnergy Consumption Convert to Carbon Emissions
kg CO2/m2a
Green Space Carbon Sin
kg CO2/m2a
Annual Carbon Emissions
kg CO2/m2a
Whole Life Cycle Carbon Emissions
kg CO2/m2
65% Energy-saving building103.641.78101.865093.22
nZEB5.001.783.22161.02
Table 11. Total life-cycle carbon emissions of the two buildings.
Various StagesEnergy-Saving 65% BuildingnZEB
Carbon Missions
kg CO2/m2
ProportionCarbon Missions
kg CO2/m2
Proportion
Building materials production595.3310.41%596.9875.62%
Building materials transportation26.740.47%27.043.43%
Operation5093.2289.05%161.0220.40%
Construction3.990.07%3.990.51%
Demolition 0.40.01%0.40.05%
Total5719.68100.00%789.43100.00%
Table 12. Carbon emissions in the production stage of building materials.
Building TypesBuilding MaterialsCarbon Emission Factors
kg CO2/m2
Quantity of WorkCarbon Emissions
kg CO2/m2
Subtotal of Carbon Emissions
kg CO2/m2
Timber
building
Northeast fir
Northeast larch
−374.41 kg CO2/m3
−32.25 kg CO2/m3
776 m3−246.22
−21.21
Northeast fir timber structure
−56.23
Northeast larch timber structure
168.78
Concrete320 kg CO2/m3436 m3118.24
Reinforcement2617 kg CO2/t26 t57.66
Polystyrene4.487 kg CO2/kg2484 kg9.45
Low-E glass1071 kg CO2/t0.56 t0.51
wood window frame147 kg CO2/m232.8 m24.09
PV panels2 t/kW28 kW0.05
Table 13. Sensitivity analysis and calculation results.
Sensitive Parameters P i Δ P i Δ P i / P i , n L i Δ L Δ L / L n Sensitivity   Factor   S i Average   Value   of   S i
PV power
increments
33.65.60.2441.82−347.61−0.319−1.595−1.603
39.211.20.494.51−694.92−0.638−1.594
44.816.80.6−252.95−1042.38−0.956−1.594
50.422.40.8−638.55−1427.98−1.31−1.638
56281−947.87−1737.3−1.594−1.594
Recycled concrete replacement rate0.20.20.2786.47−2.96−0.004−0.019−0.020
0.40.40.4783.50−5.93−0.008−0.019
0.60.60.6780.53−8.9−0.011−0.019
0.80.80.8777.57−11.86−0.015−0.019
111769.60−19.83−0.025−0.025
Publisher’s Note: MDPI stays neutral with regard to jurisdictional claims in published maps and institutional affiliations.

