Article

Energy Potential and Sustainability of Straw Resources in Three Regions of Ghana

1
Institute of Agricultural Resources and Regional Planning, Chinese Academy of Agricultural Sciences, Beijing 100081, China
2
Agriculture Information Institute, Chinese Academy of Agricultural Sciences, Beijing 100081, China
3
Institute of Agricultural Economics and Development, Chinese Academy of Agricultural Sciences, Beijing 100081, China
*
Author to whom correspondence should be addressed.
Sustainability 2022, 14(3), 1434; https://doi.org/10.3390/su14031434
Submission received: 11 December 2021 / Revised: 21 January 2022 / Accepted: 24 January 2022 / Published: 26 January 2022

Abstract

:
Anthropogenic global warming and the depletion of nonrenewable resources necessitate a transition towards bioenergy to accelerate sustainable development and carbon neutrality. This study quantified the availability and energy potential of crop (cereals, legumes, roots and tubers) straws based on data from the Northern, North East and Savannah regions in Ghana. The annual technical straw potential was 2,967,933 tonnes, whilst the crop straws with the highest technical potential were yam (935,927 tonnes), groundnut (485,236 tonnes), maize (438,926 tonnes) and soybean (374,564 tonnes). The technical energy potential of all the crop straws was 42,256 TJ, although the energy potential of yam, groundnut, maize and soybean was 13,922 TJ, 7611 TJ, 5704 TJ and 5409 TJ, respectively. There was a linear correlation between the straw produced and the energy potential per region. The Northern region (28,153 TJ) recorded the highest energy potential followed by the Savannah (8330 TJ) and North East (5773 TJ) regions. To serve as context, the research placed an emphasis on the sustainability of crop straws for bioenergy and added a brief analysis of the life cycle assessment (LCA) of bioenergy scenarios to explore the environmental sustainability of crop straw-based power generation. This study will serve as a reference in understanding LCA inference on practicable research of crop straw-based, power plant expansion in Ghana and Sub-Saharan Africa (SSA).

1. Introduction

Energy, the “lifeblood” of humanity, is essential for survival [1] and advancing socioeconomic development [2]. However, meeting the growing energy demand is a major challenge in the 21st century [3]. In as much as fossil fuels are the main source of energy, their incessant consumption is not sustainable [4]. The global energy demand is expected to increase by 41% in 2050. [5] Thus, sustainable energy needs to be the centre of attention [6]. The 17 Sustainable Development Goals (SDGs) encourage all countries to be involved in ending poverty while safeguarding the world. Consequently, the world is progressively devising more sustainable forms of renewable energy to accomplish “affordable and clean energy” (SDG 7). It is in this development that the United Nations approved SDG 7 as its goal for August 2021 [7]. Renewable energy can contribute to 2.6% of energy demand yearly [8]. Similarly, renewable energy augments electricity generation to improve energy security.
In Sub-Saharan Africa (SSA), millions of people face inadequate and intermittent power supply, while about 789 million people have no electricity. Innumerable health facilities in SSA do not have access to dependable electricity. This development can have a detrimental impact on the global recovery and intensify human calamity [7]. Environmental policies have led to the implementation of exceptional policy instruments to mitigate climate change, planning and implementation of renewable energy [9].
Bioenergy is a form of renewable energy derived from biomass resources for electricity, heating and transportation purposes [10]. The largest share of biomass is from agriculture, hence bioenergy is associated with agriculture [11]. However, agriculture contributes about 21% of the global greenhouse gas (GHG) emissions [12]. Globally, biomass from agricultural and industrial activities increases yearly by 5% to 10% [13]. Countries across the globe have enacted policies and legislative instruments to advance the comprehensive utilization of biomass to attain energy security [8] and are practicing the comprehensive utilization of straw resources for sustainable bioenergy production [14,15].
Various developed and industrialised countries have made significate efforts in the bioenergy sector. The bioenergy shares for Brazil, Finland, Sweden and Denmark exceed 20%, while those of Austria, Croatia and Estonia range from 15% to 20%. The bioenergy sector in Finland is characterised by a high solid biomass of 63 GJ/capita. The United States has the highest share of liquid biofuel utilization that accounts for 5 GJ/capita [16].The European Union’s (EU) policy aims to reduce GHG emissions [17], and the renewable energy from biomass resources is ranked fourth [18]. In 2015, estimations of the theoretical energy potential of cereals and oilseed crop straw resources for the EU-27 was 1,055,556 GWh [19].
Africa experiences several energy crises, particularly due to population and economic growth [20]. Biomass (crop residues, charcoal, firewood and manure) is the leading source of energy for households in Africa but is associated with inefficiencies [21]. In 2010, the African Union Commission (AUC) and the United Nations Economic Commission for Africa (UNECA) enacted the Africa Bioenergy Policy to promote energy security and rural development. This was to guide African countries towards the development of a sustainable bioenergy in the region. Some African countries, such as South Africa, Kenya, Morocco, Egypt and Ethiopia have taken the initiative to implement modern renewable energy technologies. Other countries, such as Djibouti, Rwanda and Swaziland, have set policies on modern renewable energy. The utilization of renewable energy in Africa can minimise power crises, generate electricity and advance socioeconomic development, particularly in rural areas. Modern renewable technologies, such as bioenergy, can elevate transformation and reduce environmental pollution [20].
Ghana seeks to achieve the SDG by 2030 that can be accomplished through the advancement of biomass energy [22]. The energy sector in Ghana is constrained with difficulties in providing adequate electricity supply and with a high consumption of wood fuels for cooking in households [11]. The high rate of wood fuel consumption in Ghana causes a deforestation rate of 3% per year [23]. By 2030, the government of Ghana aims to generate 10% renewable energy into the national energy mix, but there is a dawdling development in Ghana’s renewable energy sector [24]. Ghana’s renewable energy policy is confronted with poor implementation. The main factor to its poor implementation is that it is considered unattractive [25]. There are many obstructions to effective renewable energy implementation in Ghana, such as economic, policy related, social, technical and environmental [26]. Ghana is faced with insufficient access to current forms of energy, poor knowledge and ambiguity of project catastrophes joined with the inadequate involvement of stakeholders [27]. According to Bensah et al. [28], inadequate financial support in the renewable energy sector, absence of less expensive renewable energy systems and problematic certification procedures all obstruct the effective implementation of Ghana’s renewable energy system. The decentralization of bioenergy projects can be of immense benefit towards accomplishing energy security since the implementation of bioenergy projects are set to meet local energy demands [29] to support the cooking, lighting and transport sectors at the local level [30].
Ghana is an agrarian economy, and the Northern, North East and Savannah regions are leading areas that contribute to the national food basket. These regions are famous for the production of food crops (cereals, legumes, roots and tubers). However, there is inadequate information on the comprehensive utilization of the straw resources, particularly for bioenergy from straw resources, which are preeminent energy source [31]. The majority of farmers in the regions are smallholder farmers who reside in remote areas and face energy security challenges. The overreliance on traditional biomass (wood fuel and charcoal) for cooking and fossil fuels increases GHG emissions in addition to the deprived and erratic electricity supply. The implementation of modern bioenergy technologies from straw resources in these areas is scarce, and this promotes the high production and marketing of traditional biomass to other parts of the country, which depletes forest biodiversity. There is no detailed evaluation of the energy potential of biomass resources across the three regions. A district-level study on straw resources across the three regions necessitates the need to understand the quantity and energy potential of straw resources at the local levels where these farmers dwell.
Although there is some literature on crop residues and their energy potential estimation in Ghana, less emphasis has been on the district-specific energy potential of straw resources in three regions of Ghana. Earlier research on the energy potential of food and cash crop residues in Ghana was estimated as 75.20 TJ [32]. Kemausuor et al. [11] assessed how biomass resources including crop residues can meet Ghana’s energy demand without specific emphasis on the three regions of Ghana. According to Nelson et al. [33], crop residues have the potential to generate 623.84 PJ per year; however, the estimation was based on national data. In addition, although Azasi et al. [34] examined the contribution of crop residues to bioenergy across the administrative regions of Ghana, the authors did not conduct district-level research. The research by Präger et al. [35] investigated the electricity conversion potential of biomass residues only in the Sunyani municipality, while Cudjoe et al. [36] assessed the biogas and electricity generation of food waste in the Greater Accra and Ashanti regions of Ghana. There is a gap in the assessment of the energy potential of straw resources at the district levels as well as an absence of modern decentralised bioenergy projects in the three regions. It is crucial to advance scientific research on the comprehensive and sustainable approaches to tackle challenges of biomass technologies [37]. Knowing the biomass potential enhances the development of renewable energy policies and legislative instruments. Similarly, it plays a pivotal role in renewable energy production to curtail environmental problems [38].
This study provides one of the first evaluation of straws and their energy potential across the three regions. The objectives of this study are to: (1) assess the availability of crop straws (cereals, legumes, roots and tubers) in the Northern, North East and Savannah regions; (2) calculate the energy potential of the crop straws, (3) discuss the sustainability context and life cycle assessment of bioenergy and (4) make recommendations to improve straw utilization in Ghana.

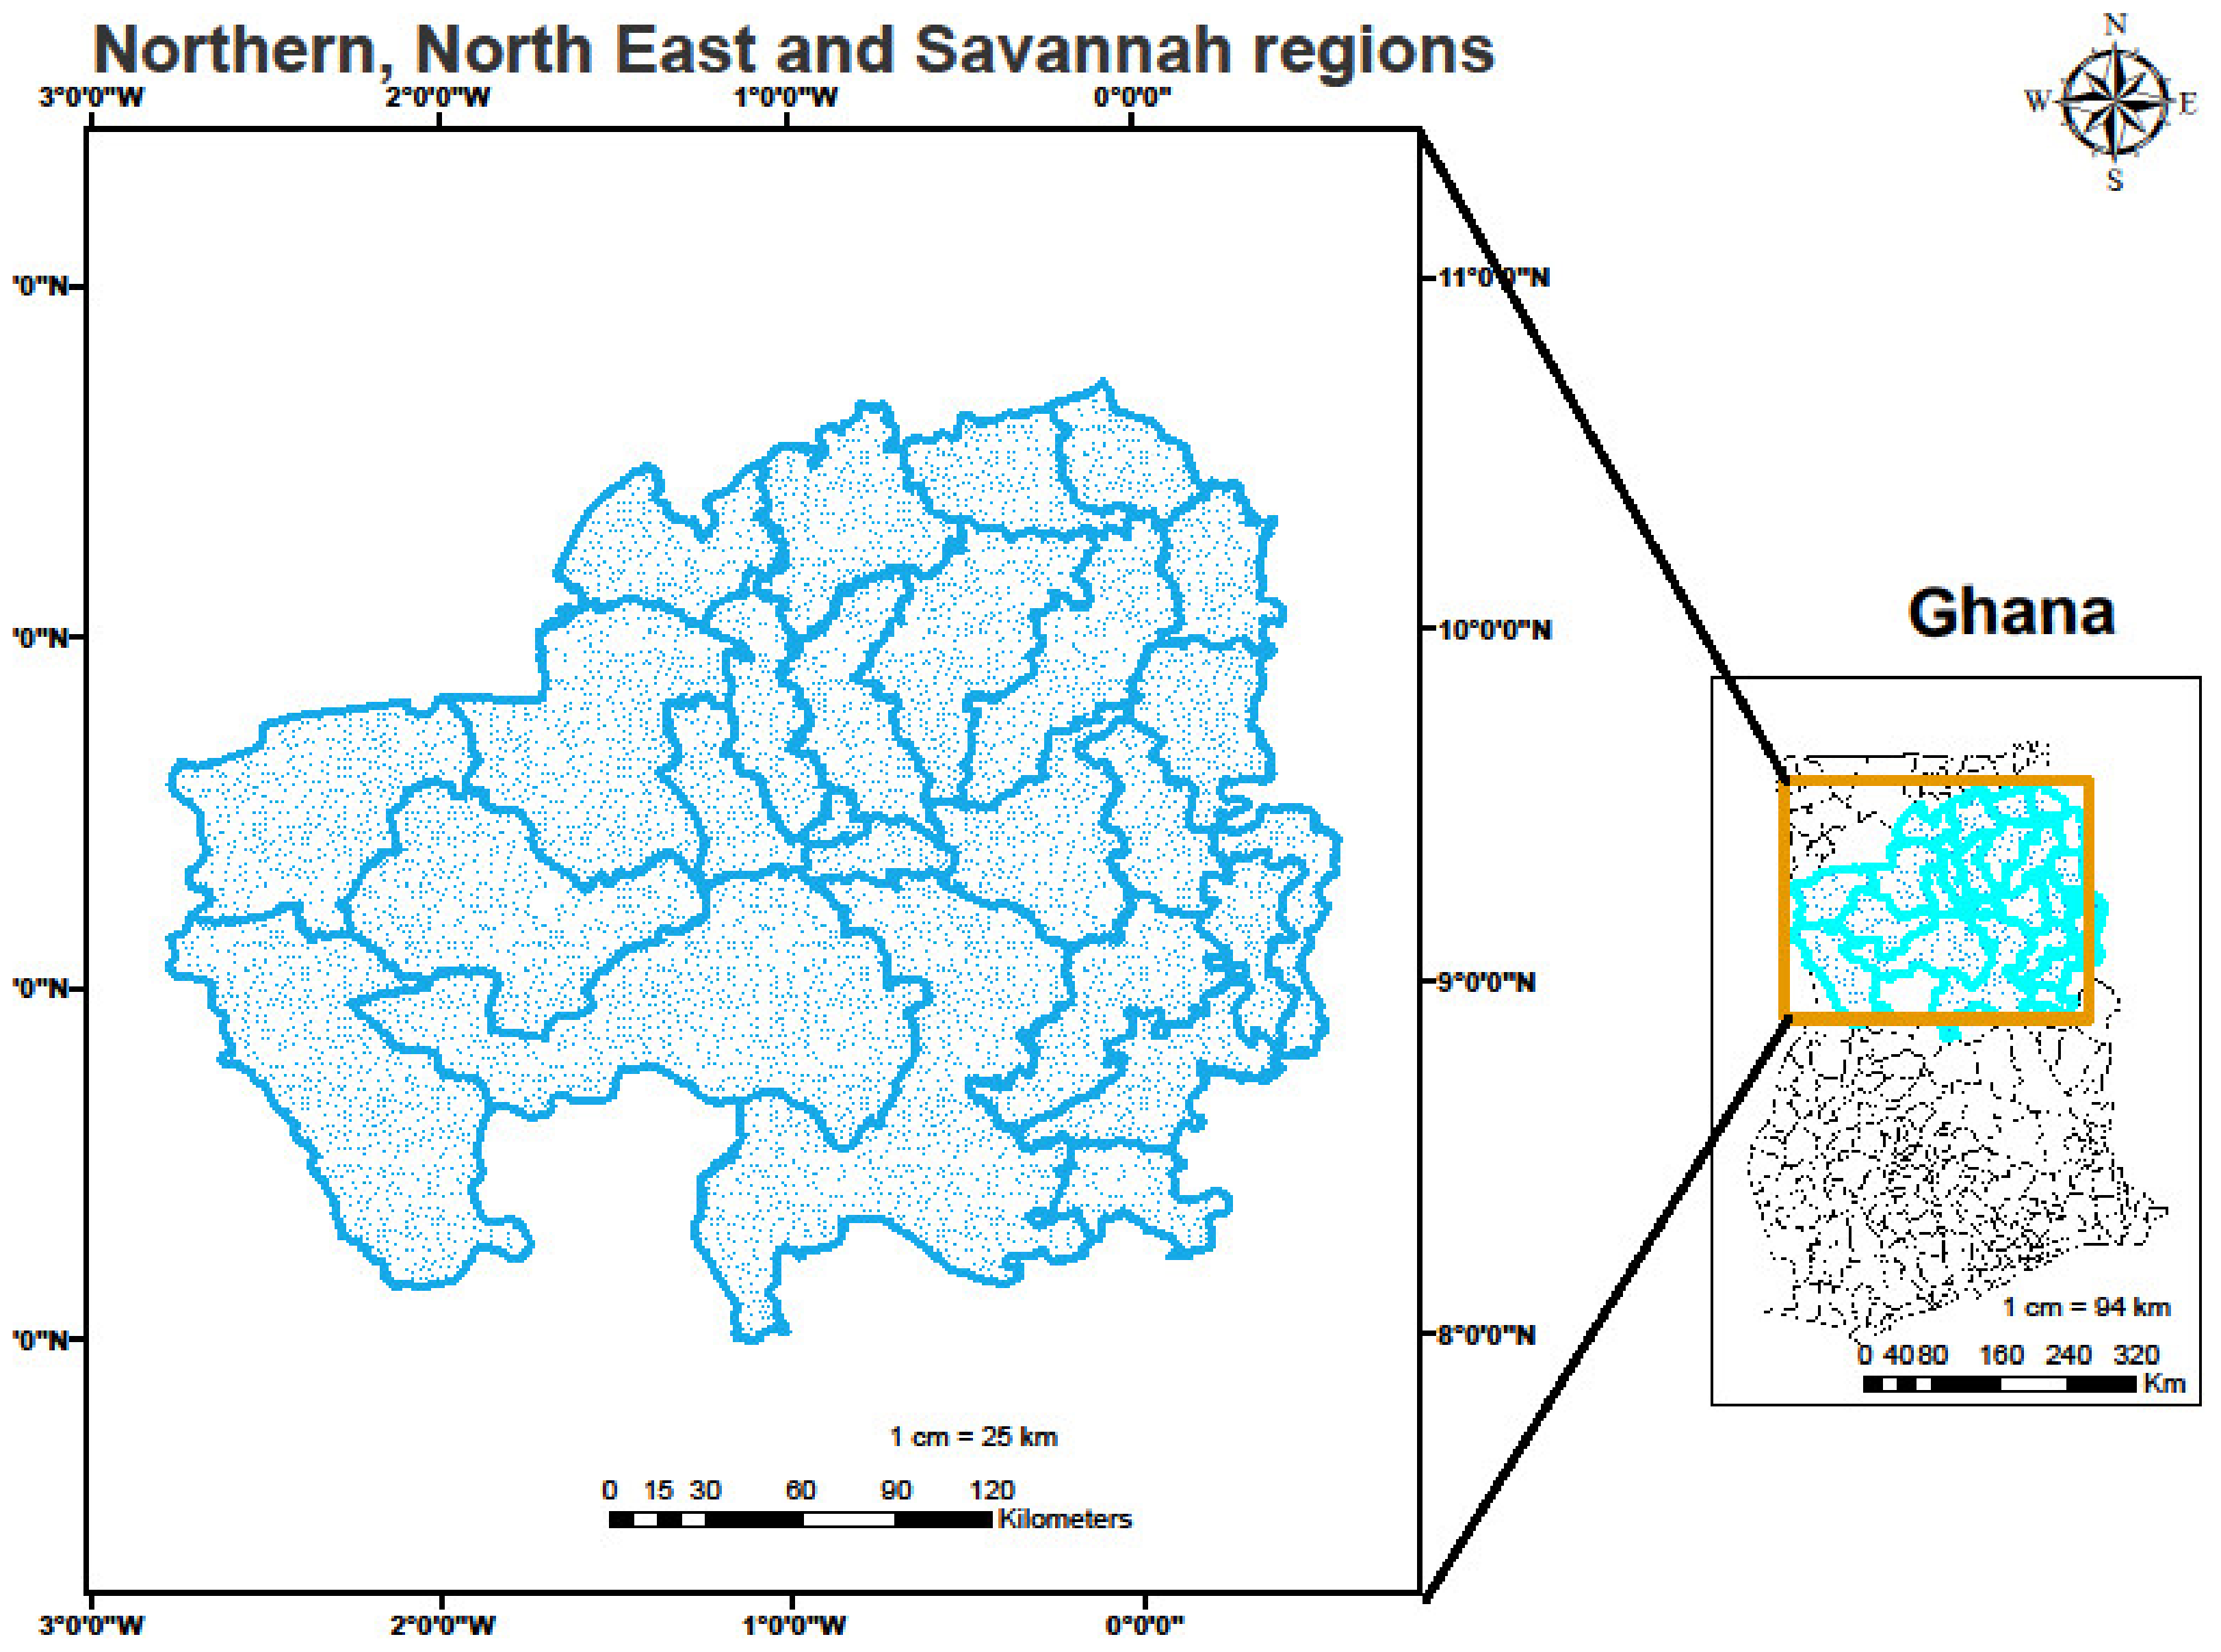
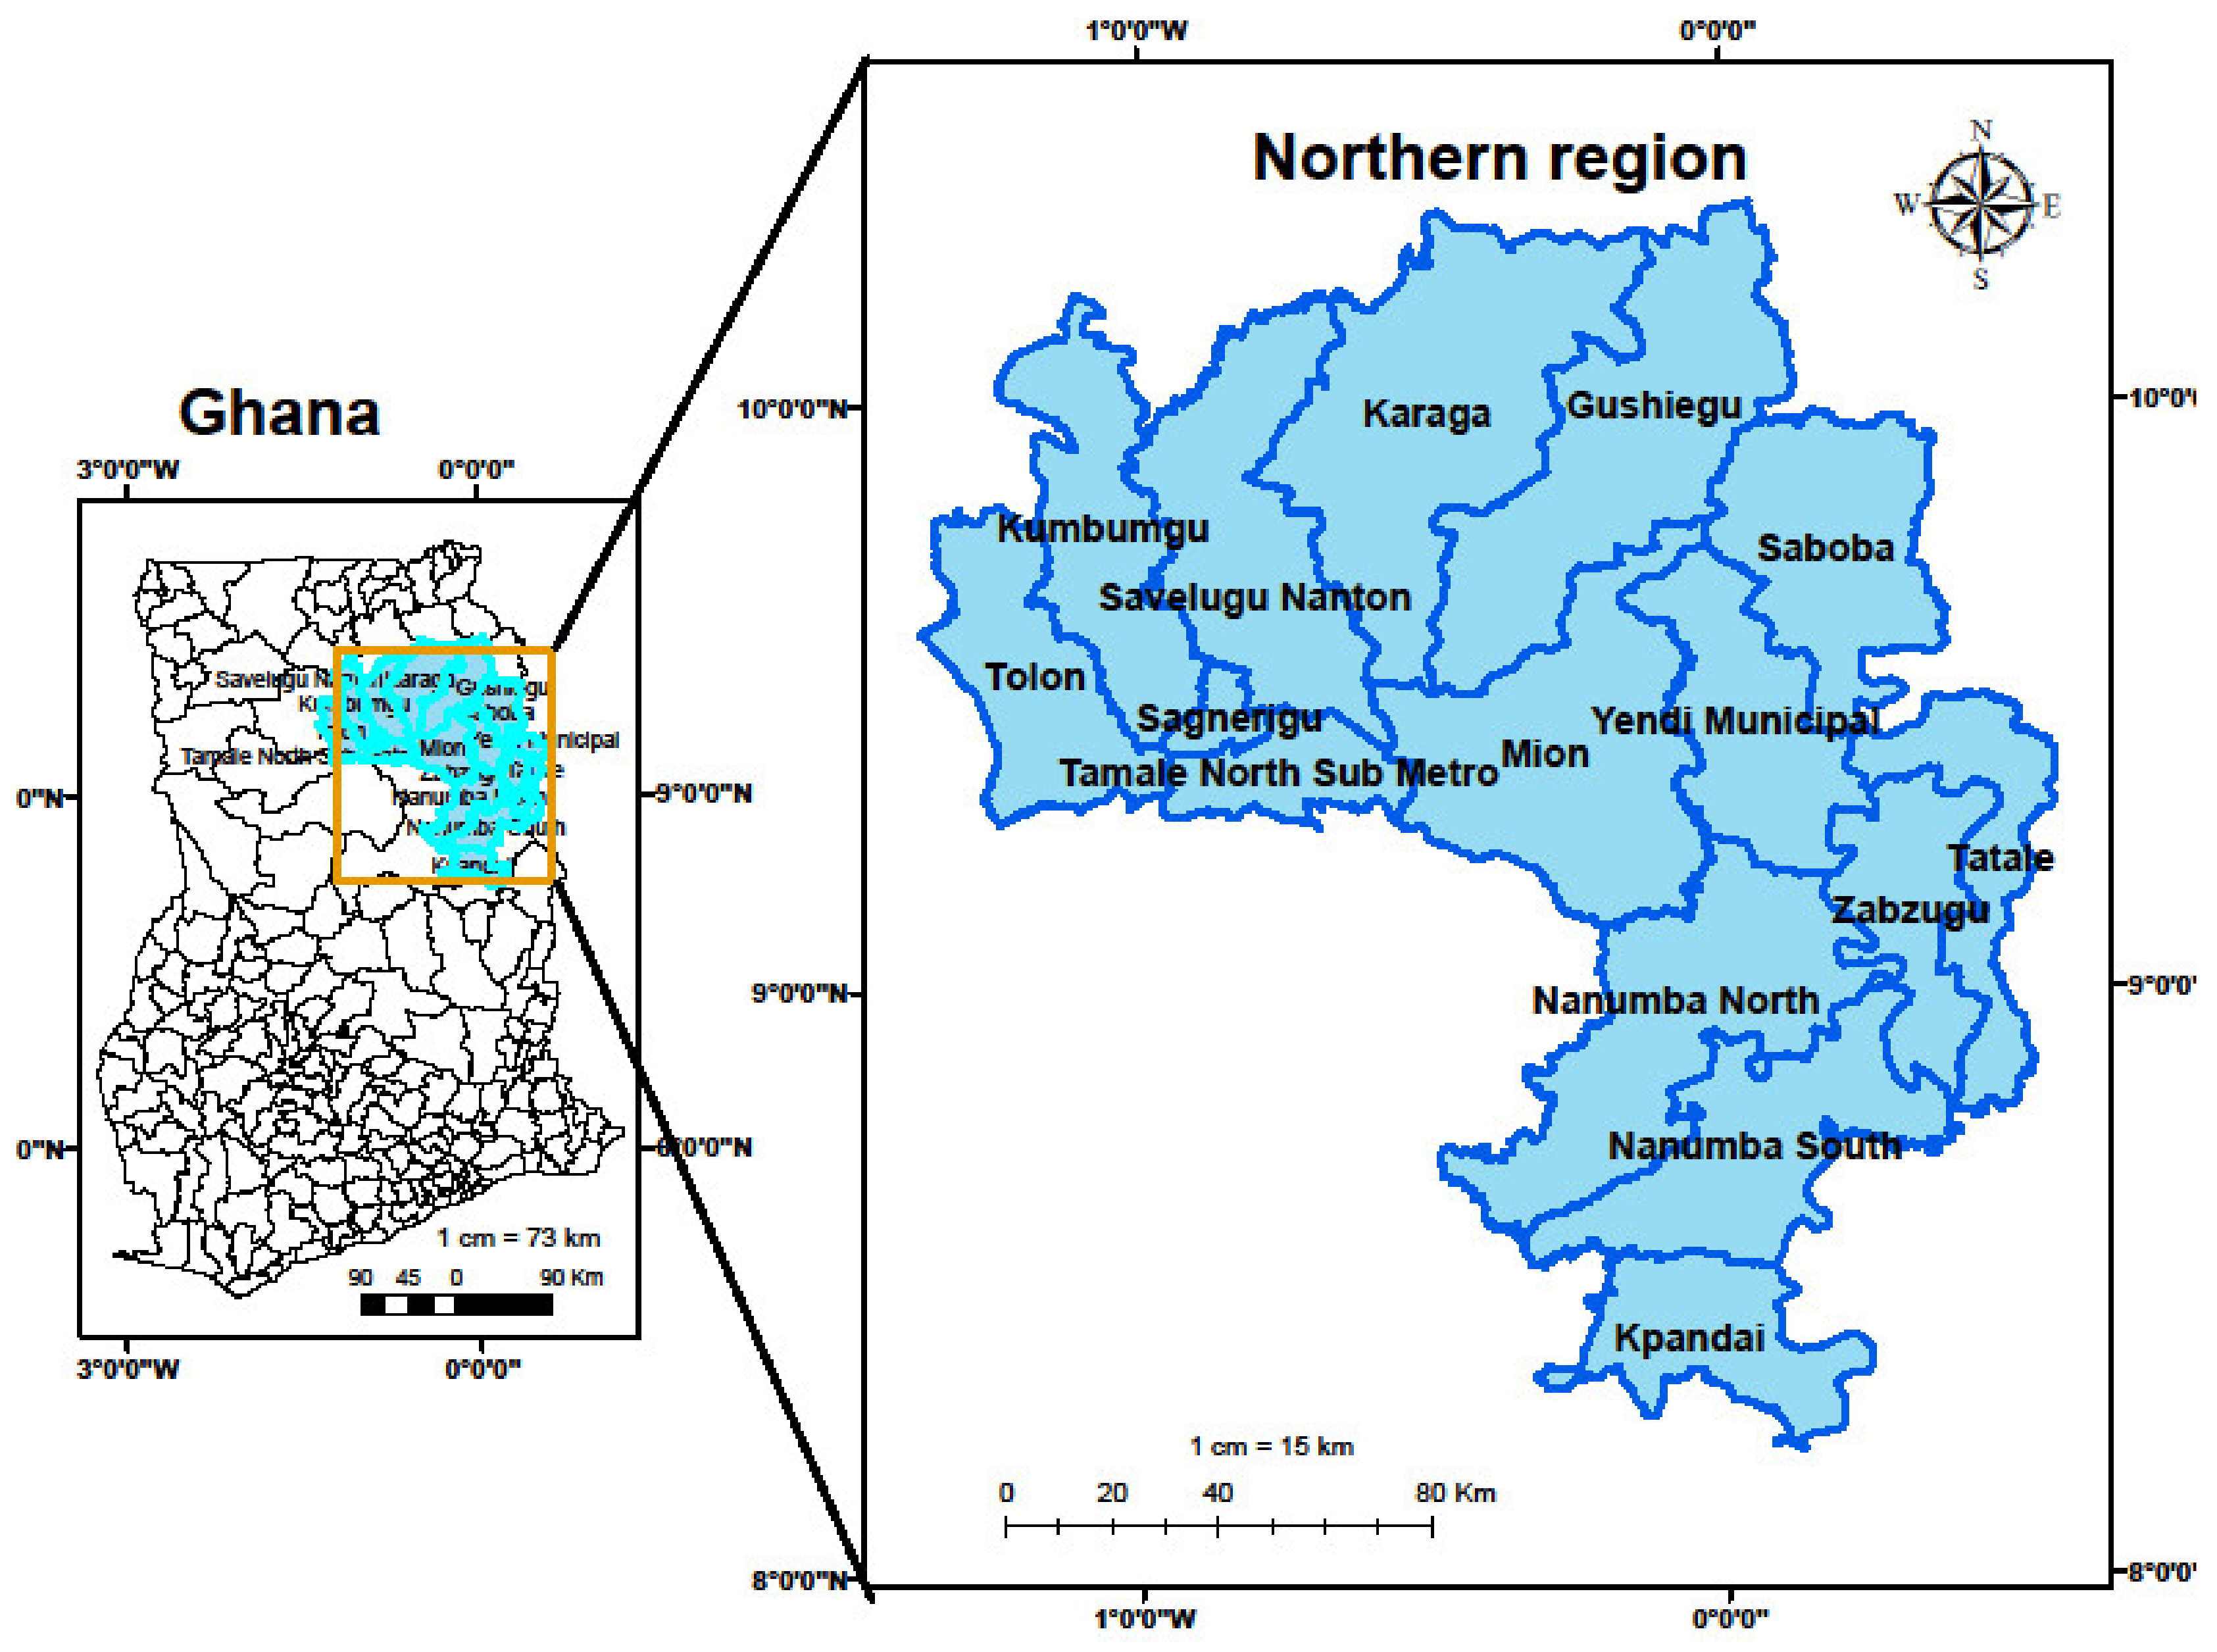
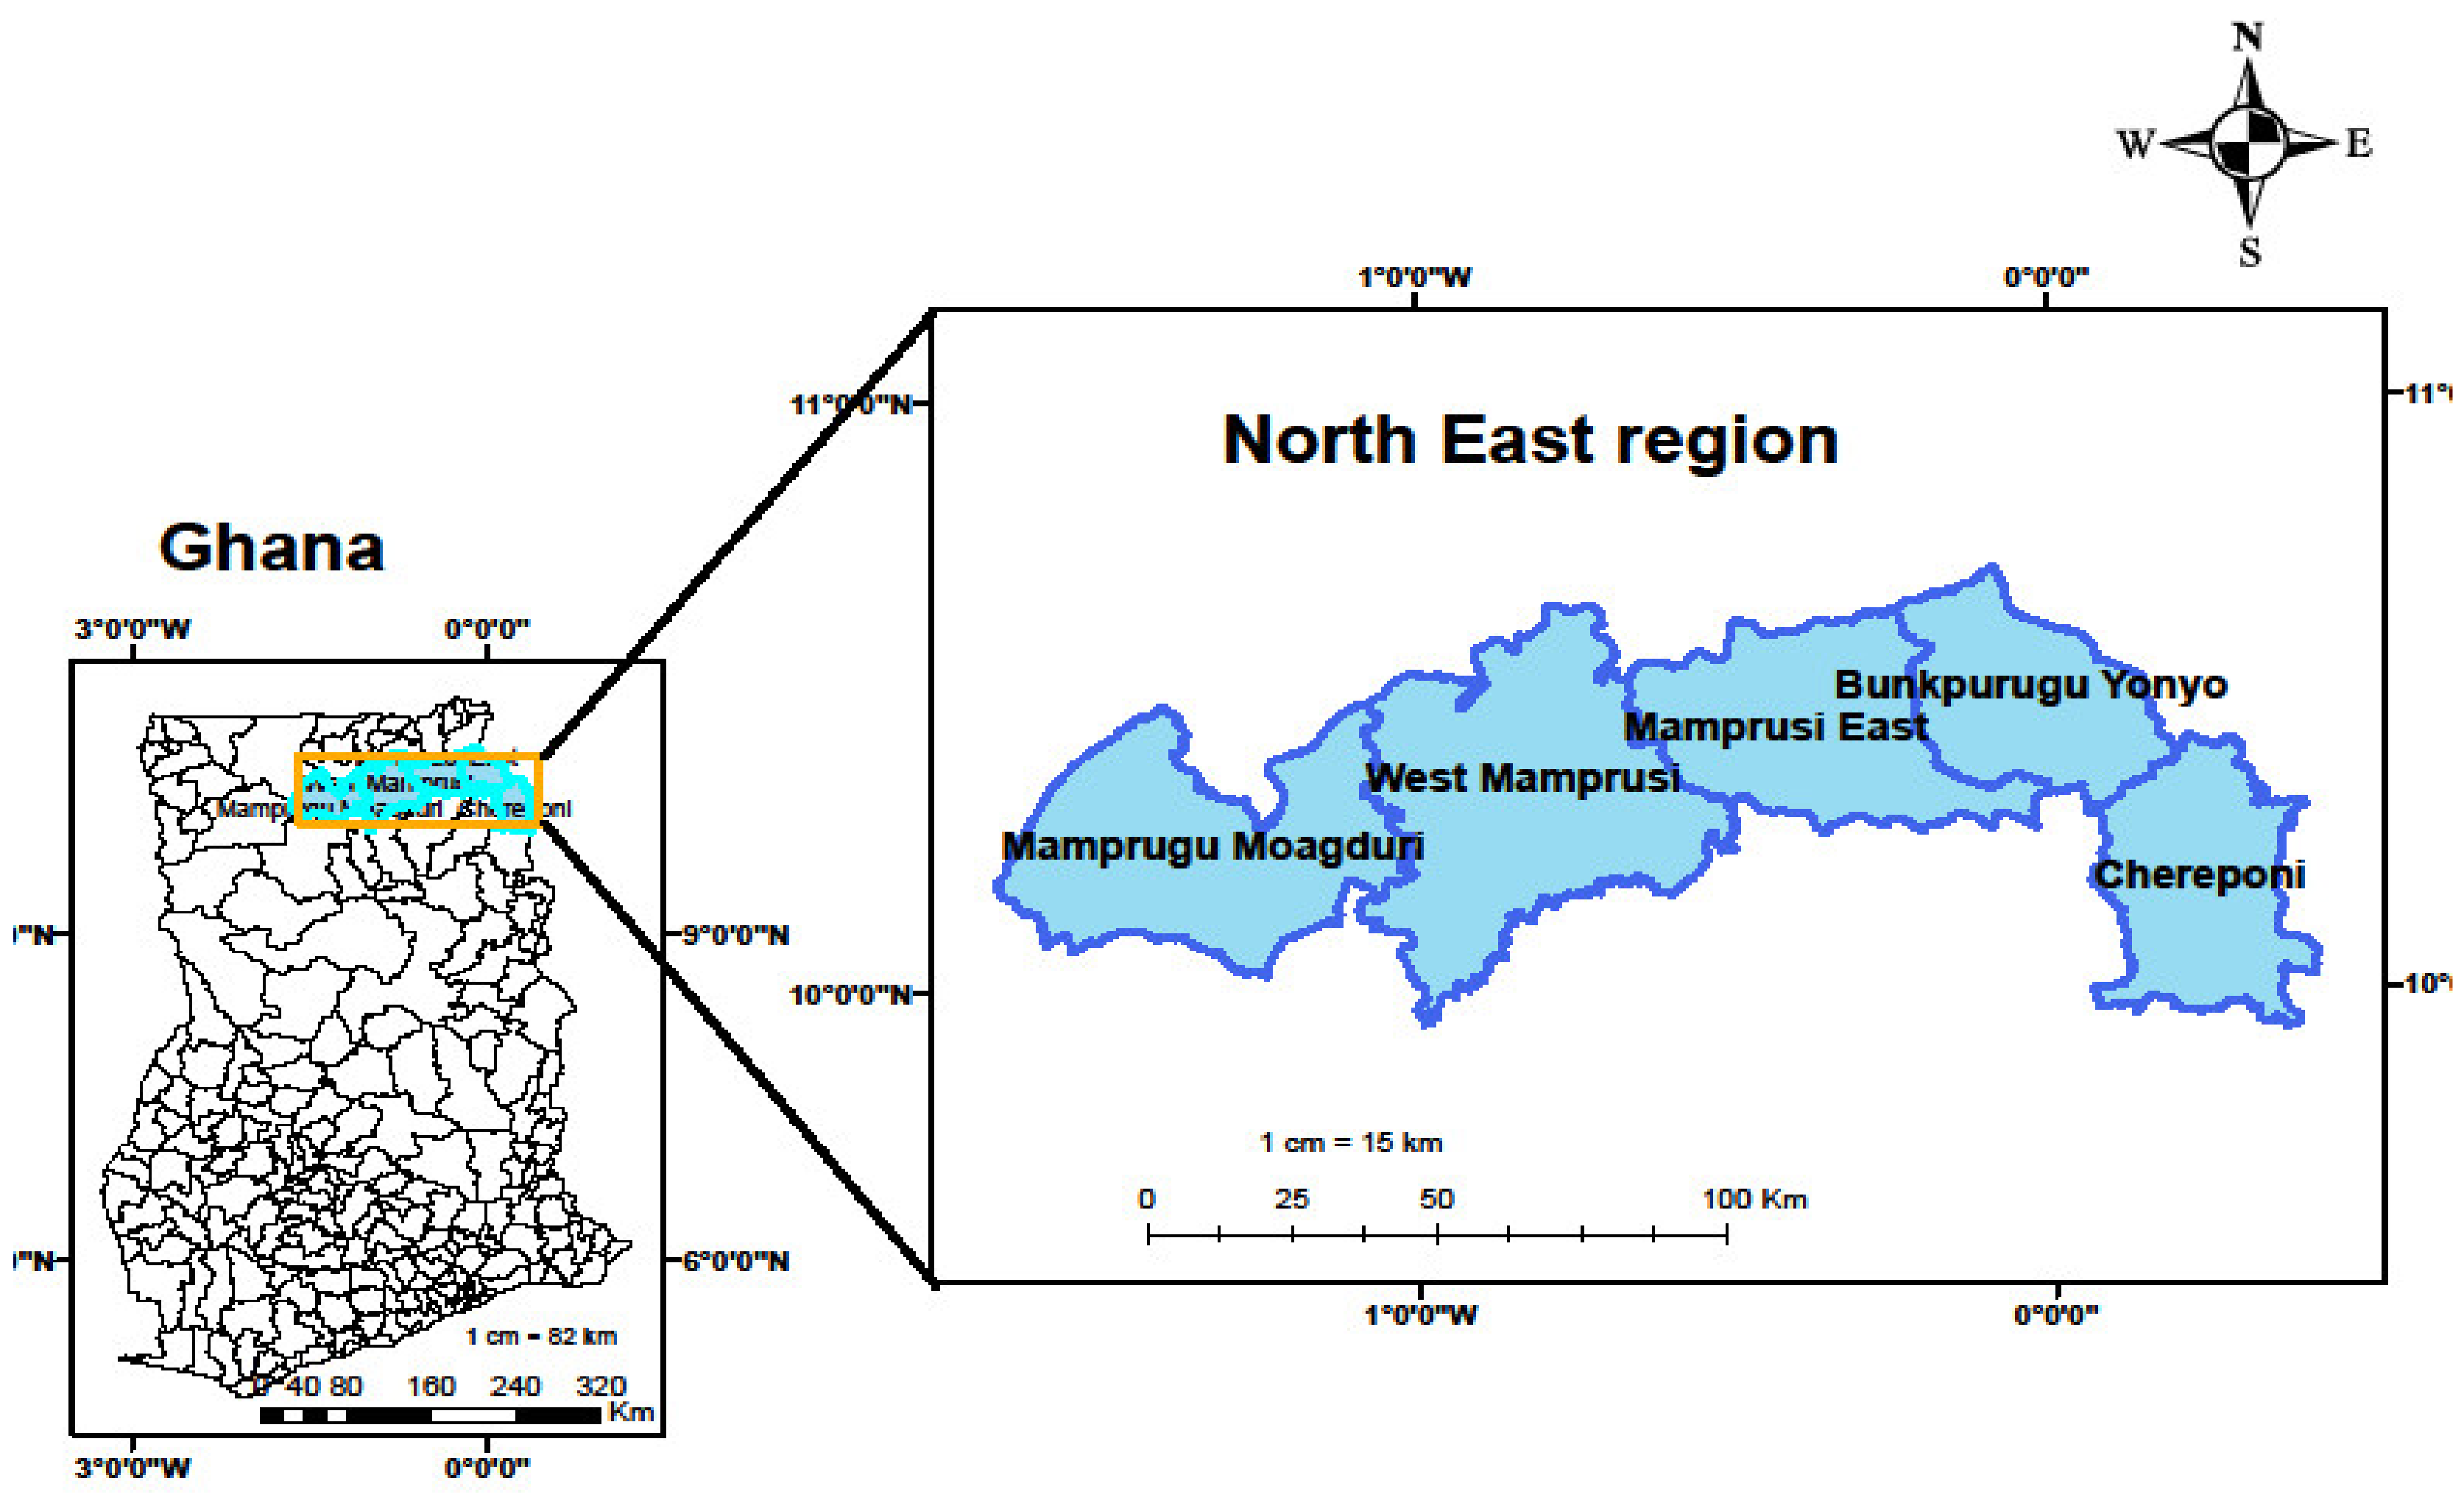
2. Description of the Northern, North East and Savannah Regions of Ghana

The Northern region of Ghana was previously part of the ten administrative regions until the government of Ghana created six new regions to bring the number of current administrative regions to 16. The Northern region is the largest in Ghana that covers an area of about 70,383 square kilometres (km2). Based on the 2010 population census, the region has a population of 2,479,461. It comprises 16 Metropolitan, Municipal and District Assemblies (MMDAs). One of the 16 regions of Ghana is the North East, and it is part of the six newly created regions formed out of the Northern region in 2019 based on the Constitutional Instrument (C.I.). The region covers a land size of 9072 km
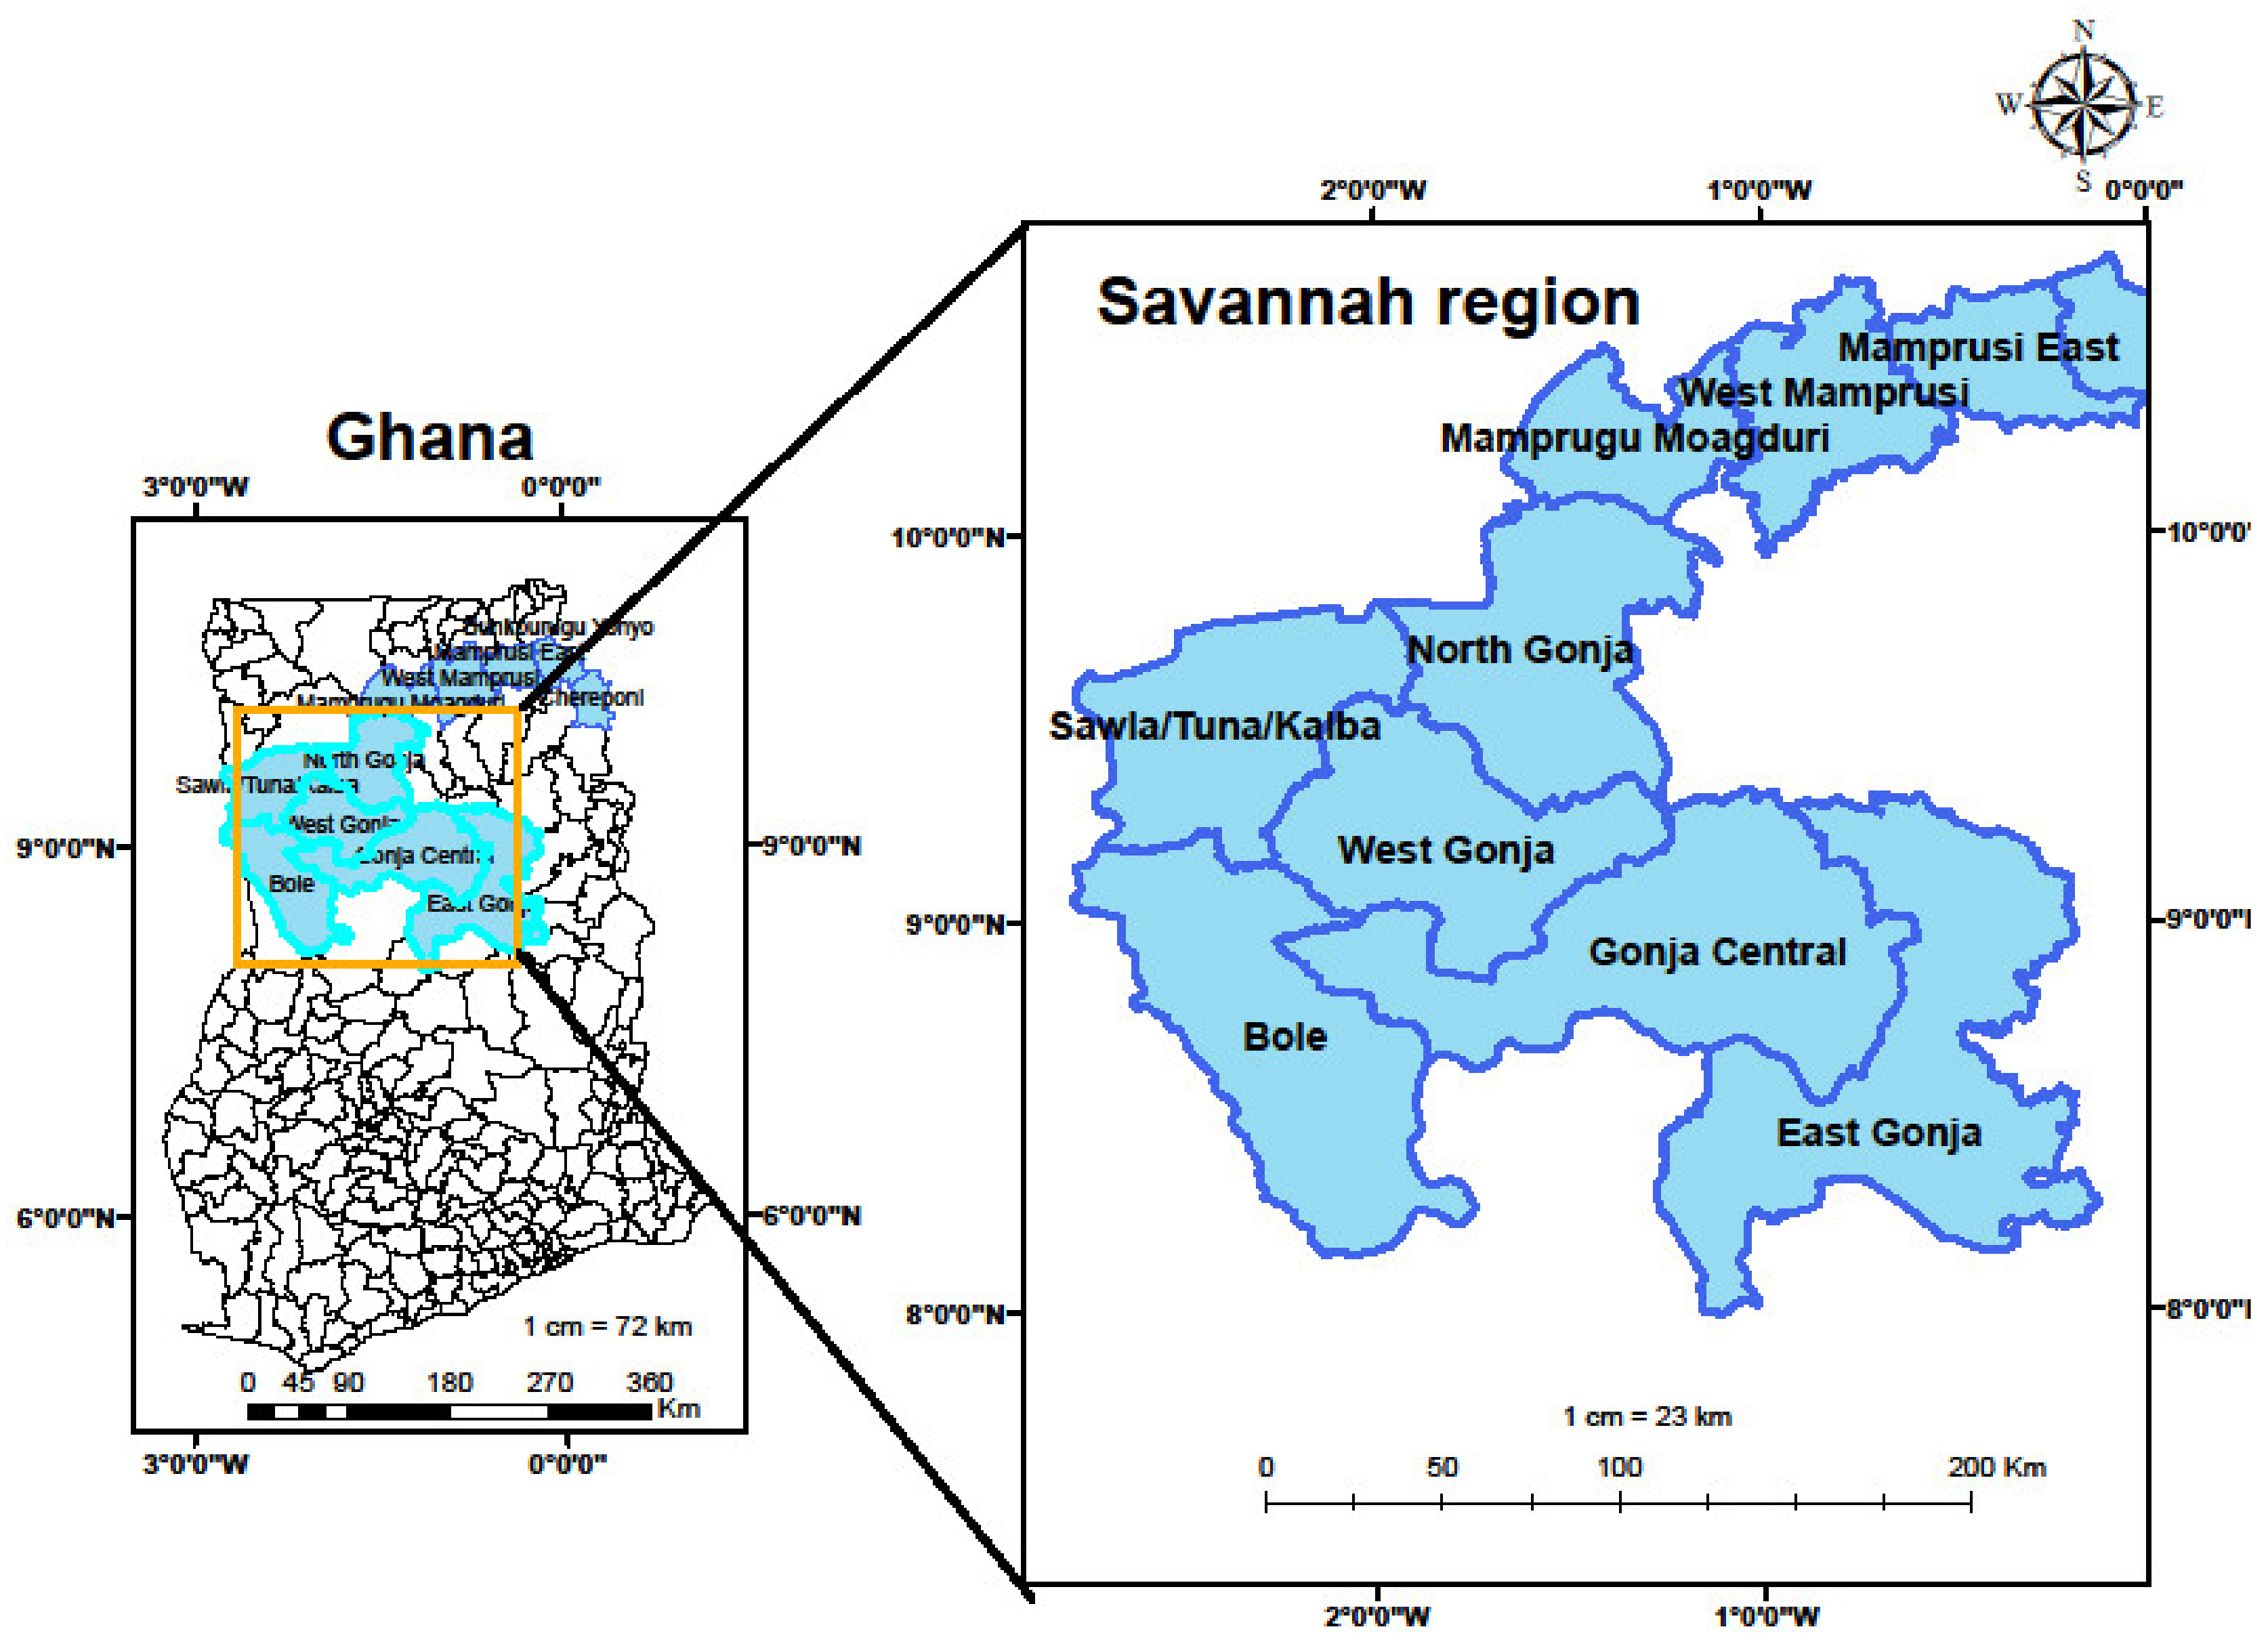
2 with a population of about 440,558 and includes six MMDAs. In addition, the Savannah region is also one of the newly created regions out of the Northern region. It has a population of 581,368 and comprises seven MMDAs. All these three regions constitute 29 MMDAs [39]. The regions (Figure 1) are located at a latitude of 9°29′59.99″ N and a longitude of −1°00′0.00″ W [40]. The majority of the economically active people (72%) in these localities engage in agriculture [41], which is characterised by subsistence and rainfed farming [42]. The government institutions that provide technical agricultural support to farmers in the regions are the Ministry of Food and Agriculture (MoFA) and the Savannah Agricultural Research Institute (SARI) [43]. Nonetheless, other nongovernmental organizations work in these regions to support farmers as well.
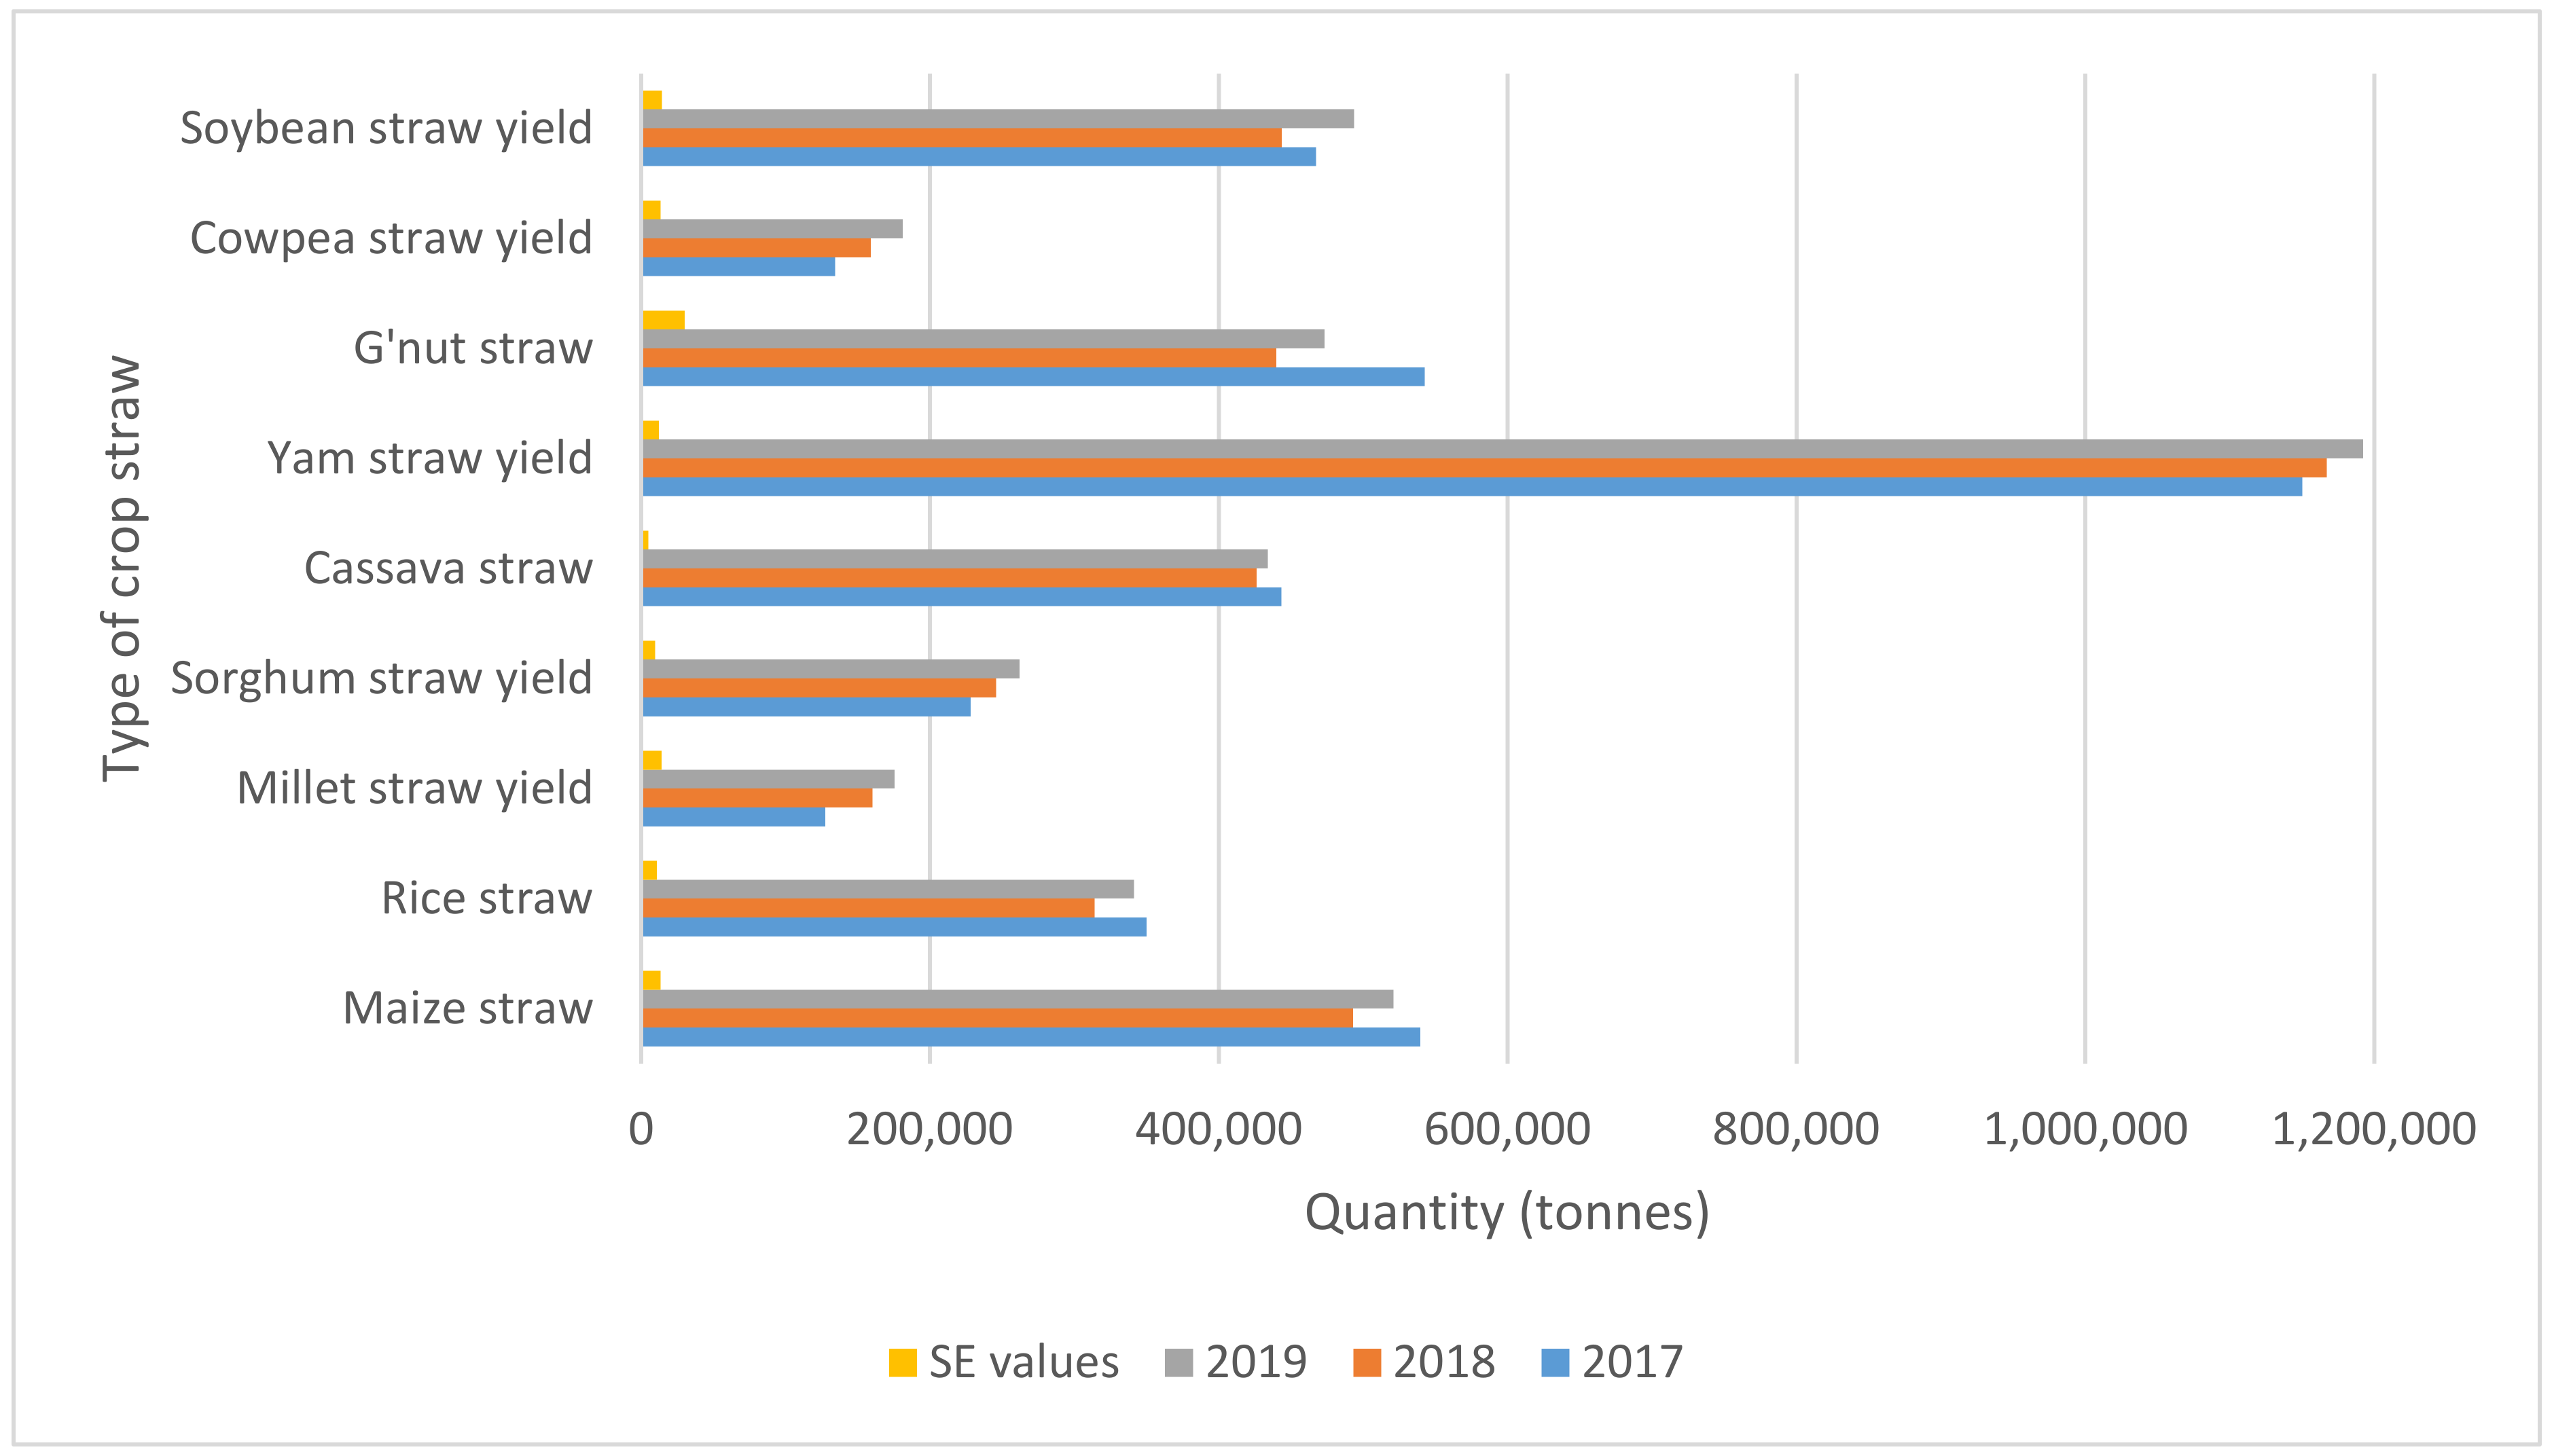
Food and livestock production are the main source of income for the majority of the population. while a few engage in off-farm activities [
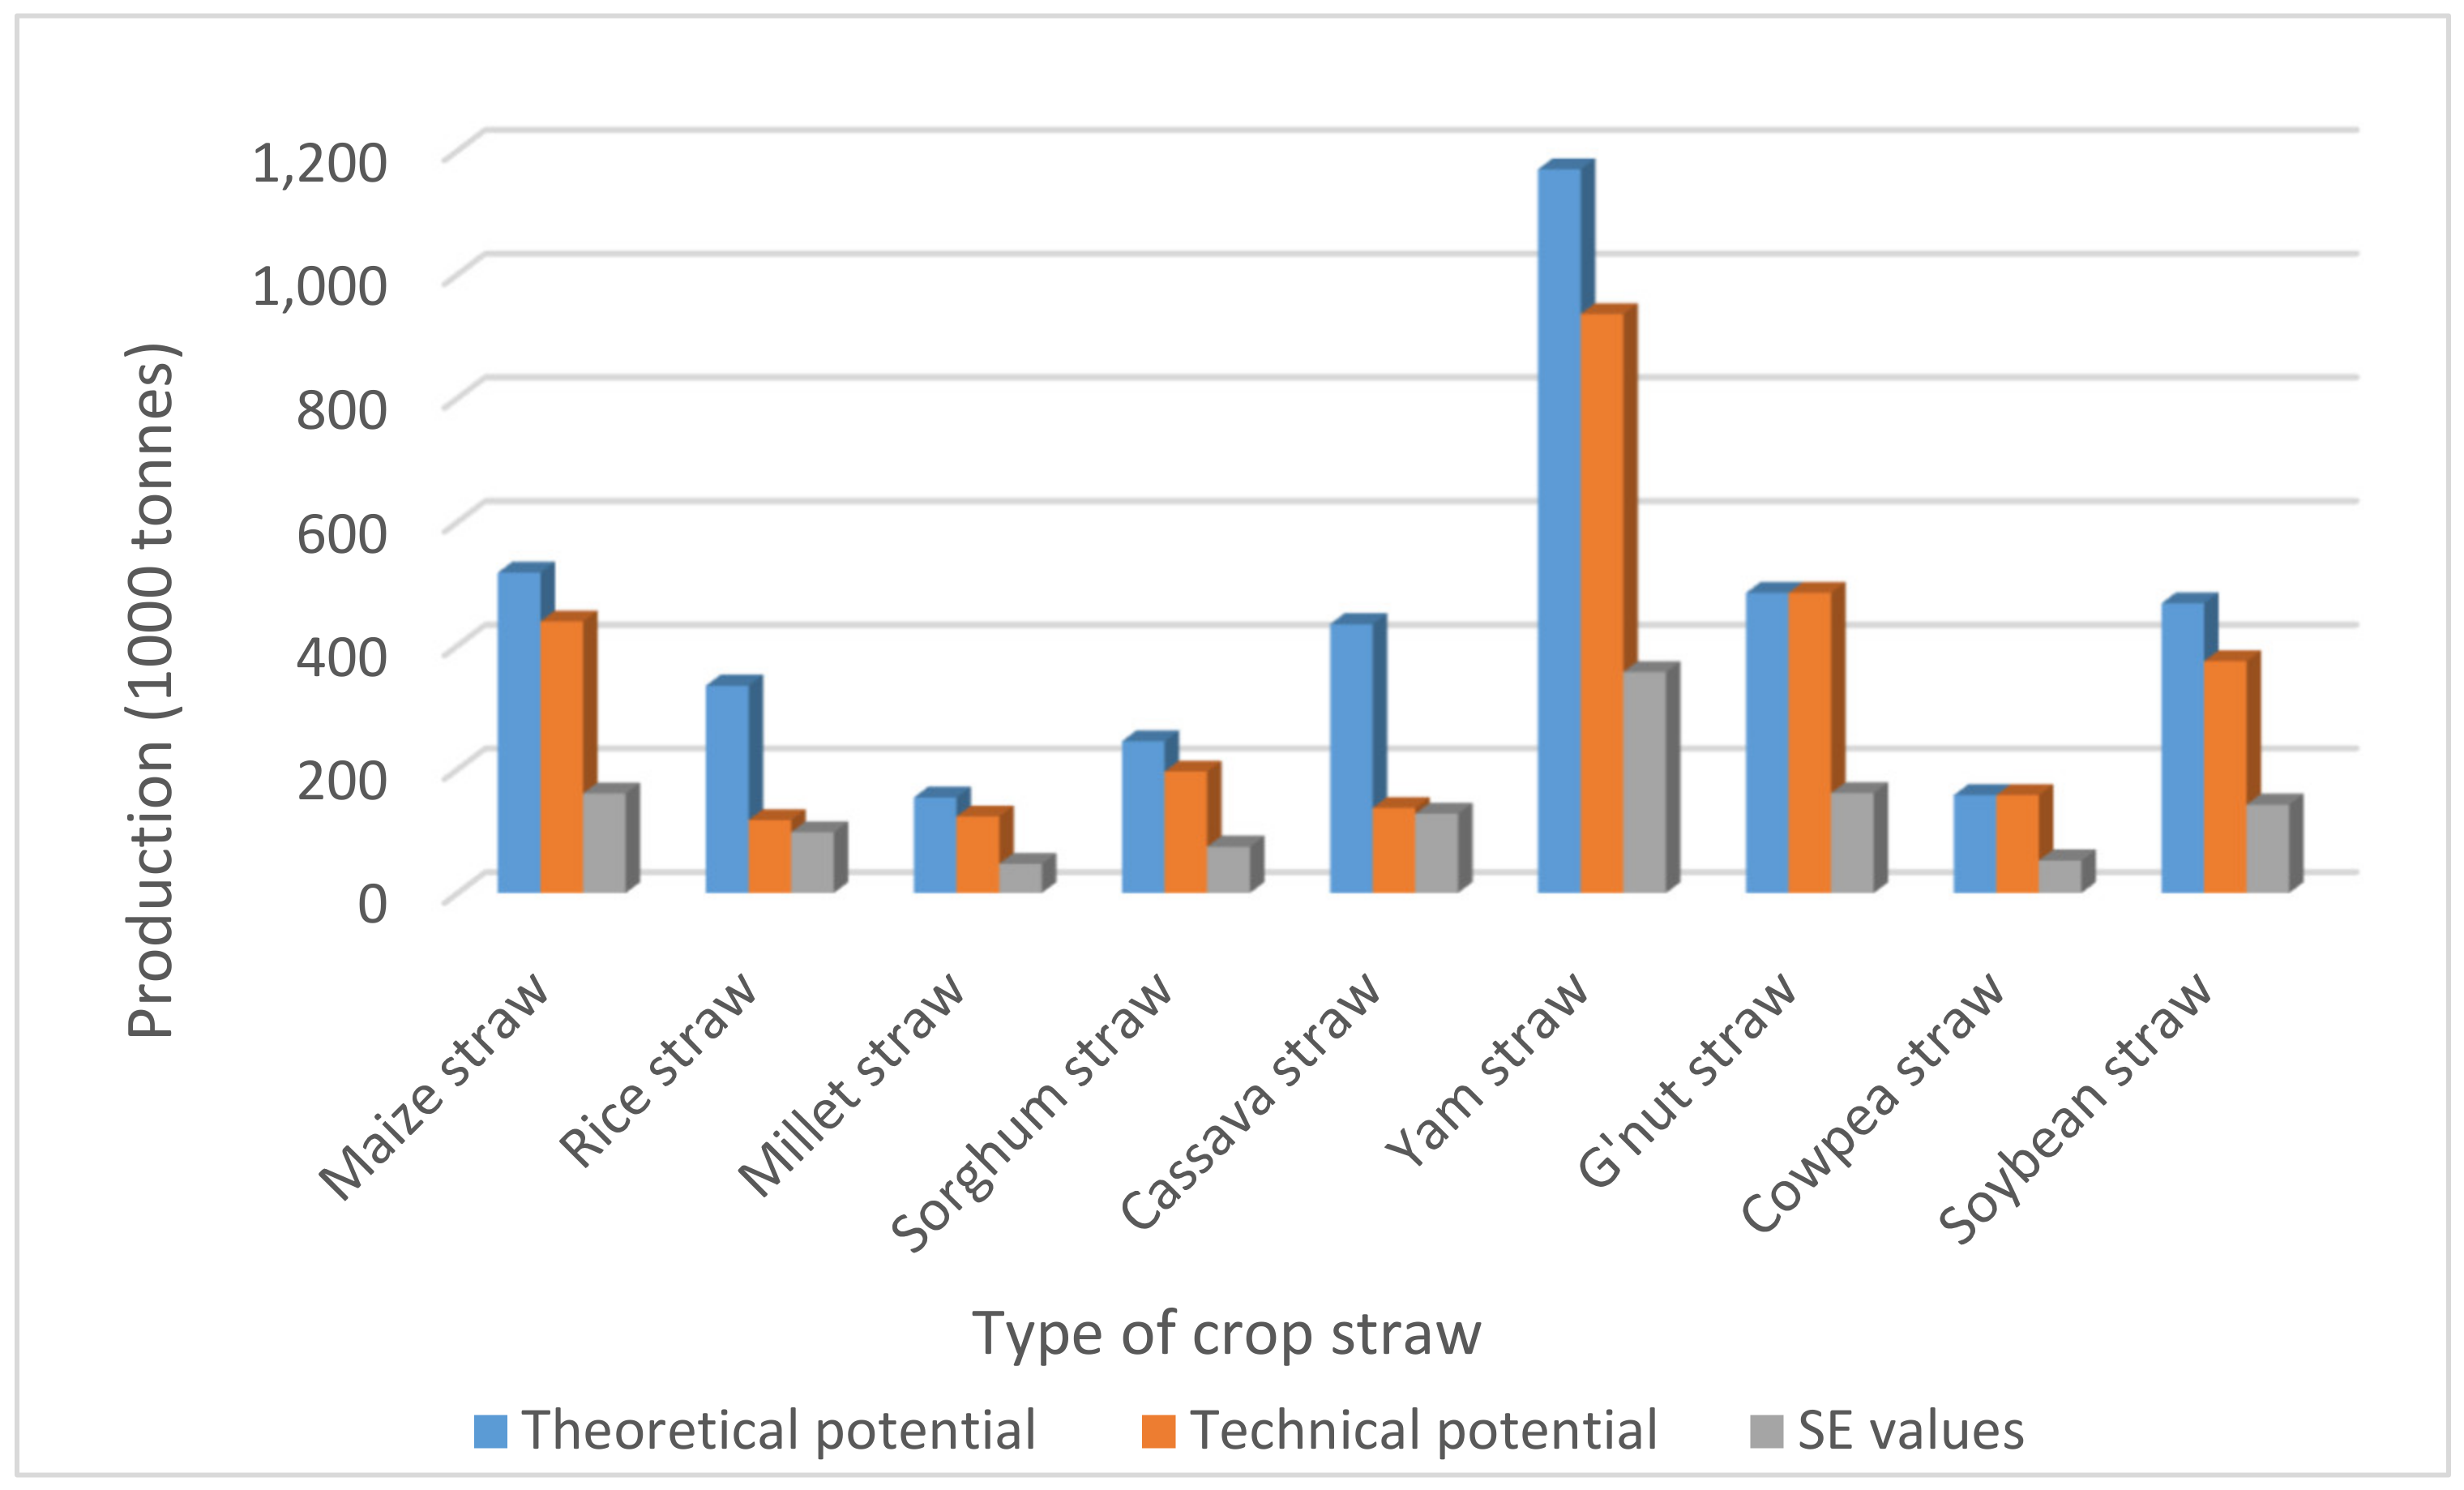
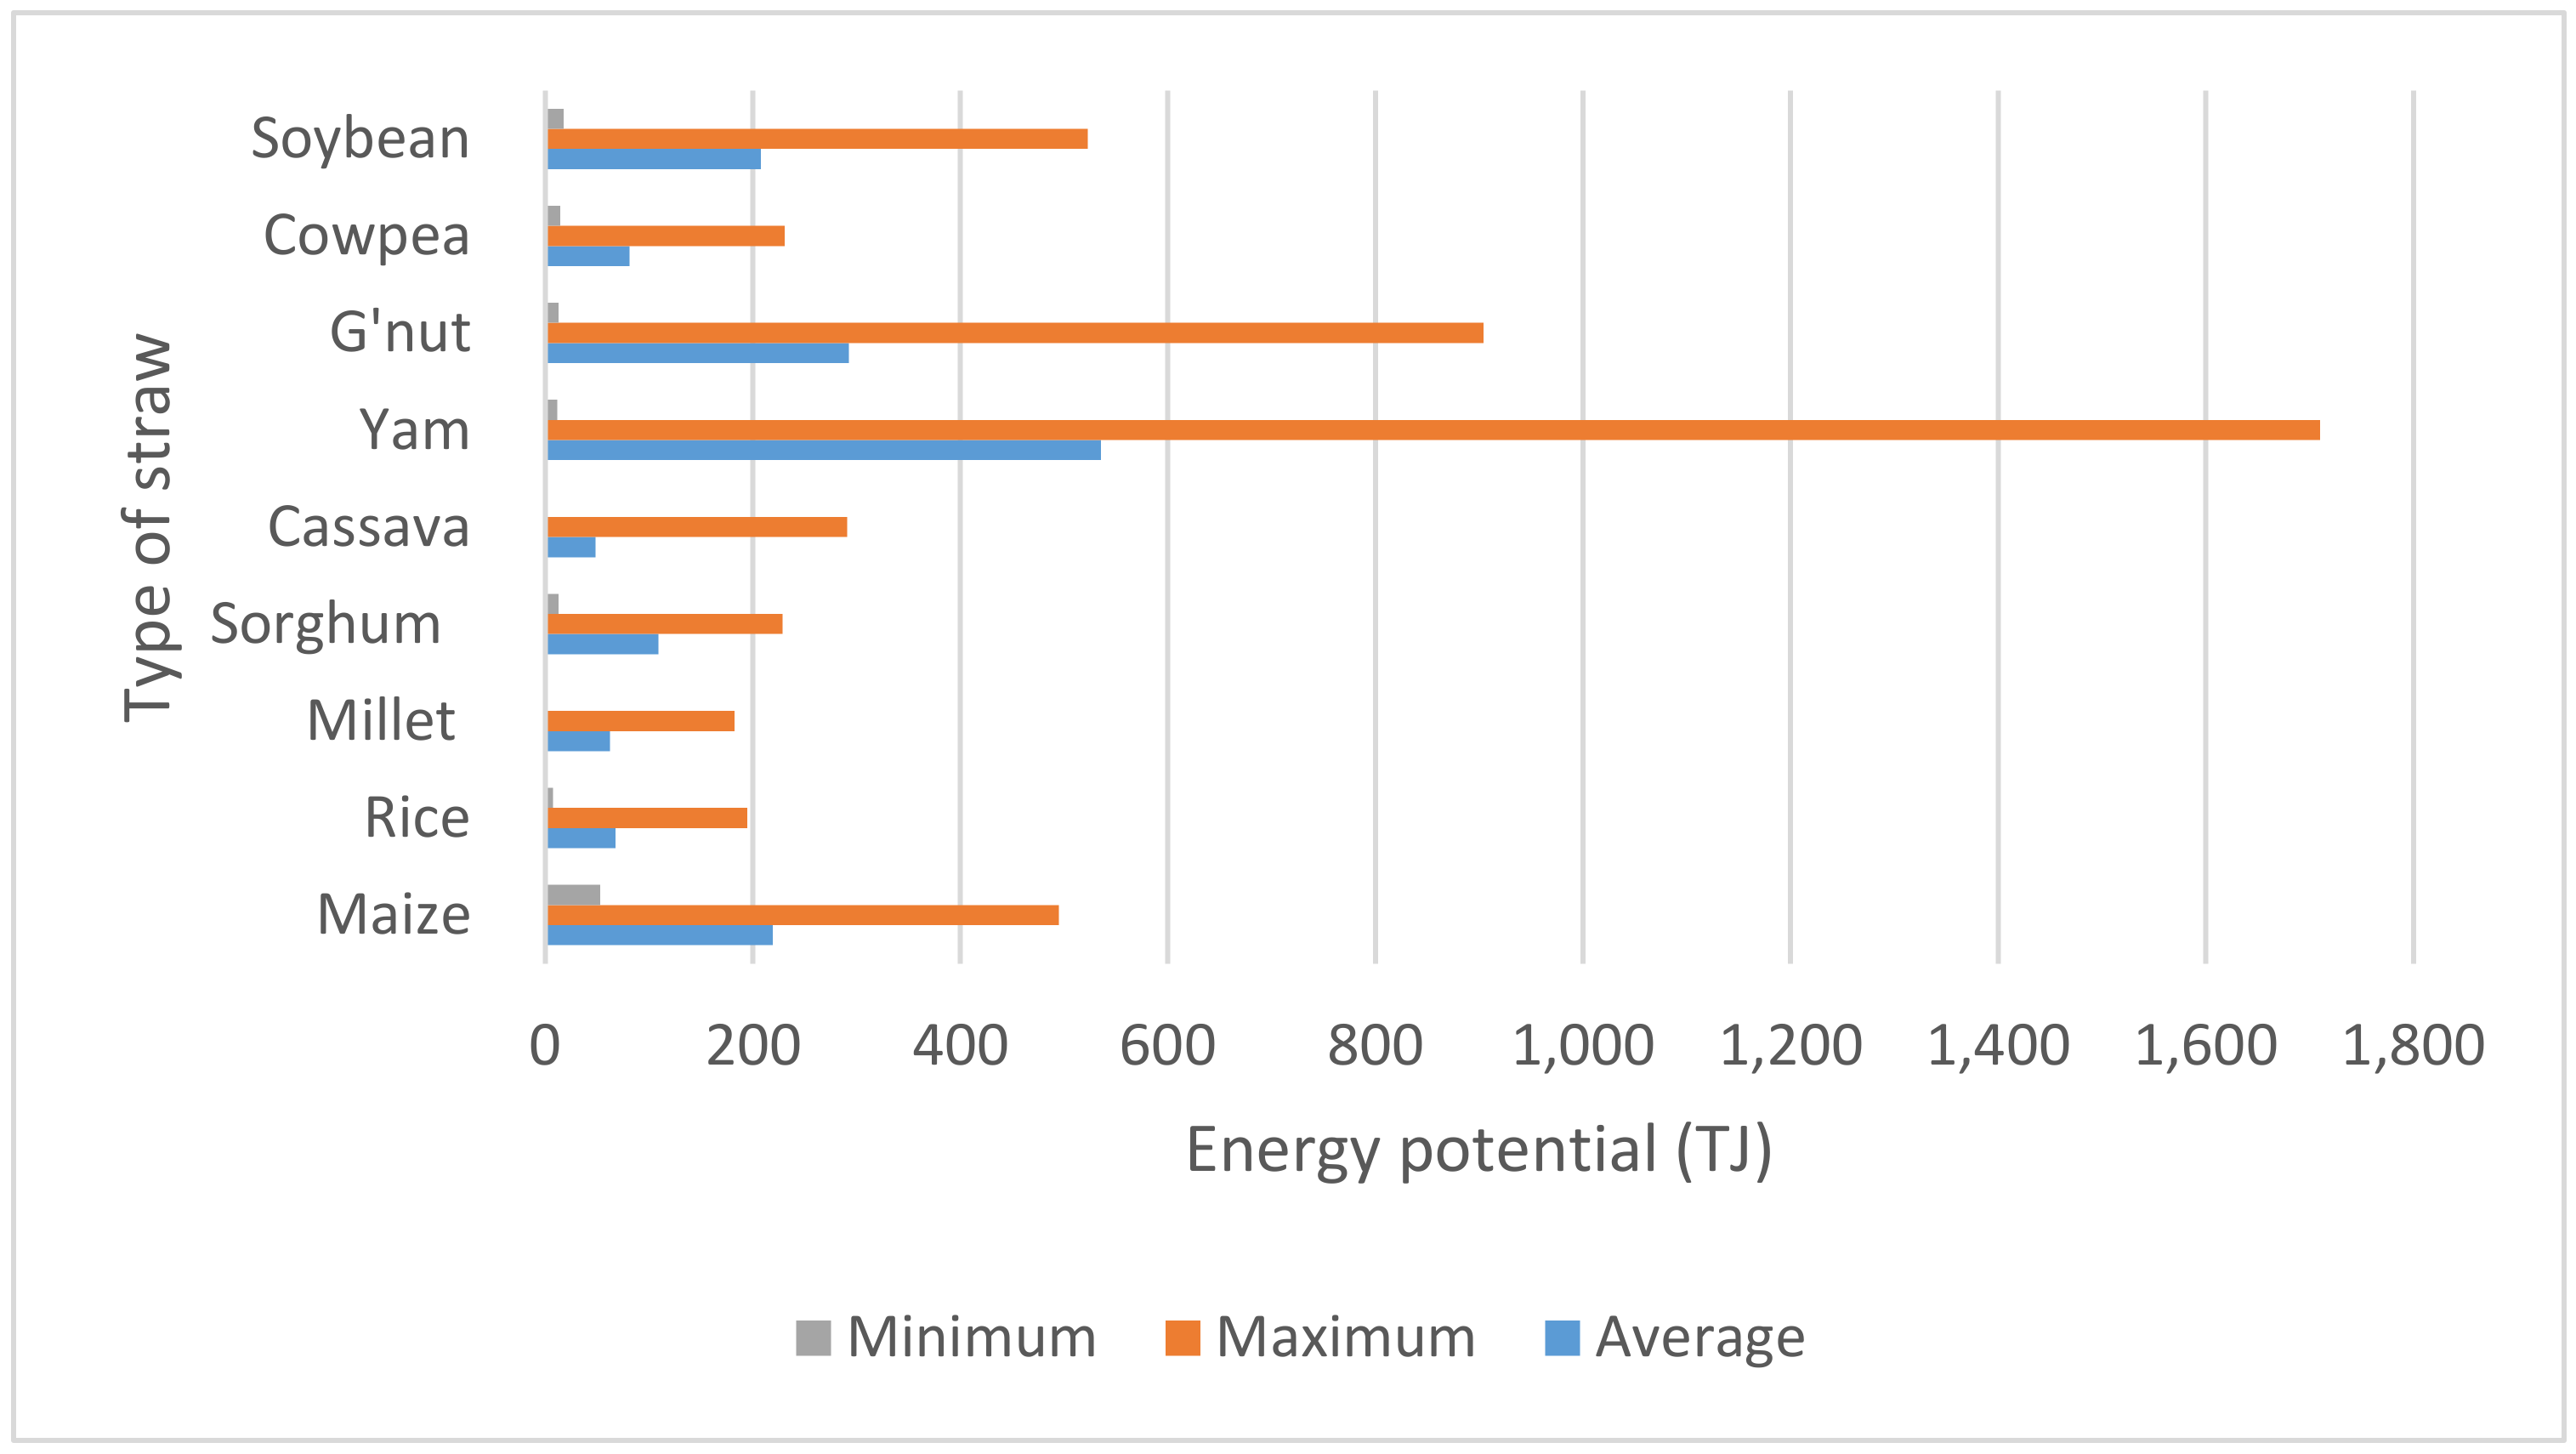
44]. These areas are among the topmost regions in Ghana that produce large quantities of food crops. Some of the major cereals and legumes produced are maize, rice, millet, sorghum, groundnut, cowpea and soybean. In addition, they produce tubers, such as yam and cassava, in high quantities [40,45]. The endless adoption of agricultural practices, such as irrigation, the application of fertilizers and other good agronomic practices, can be the solution to increased food productivity and security among farm households [42]. Farmers produce food crops mainly for consumption and marketing. About 47% of the food crops produced are consumed [44]. However, the area happens to be one of the driest and suffers from droughts and bushfires, which have adverse effects on people and nature [46,47]. Continuous bush burning leads to the destruction of the crop straw biomass on open fields. Although there is an abundant availability of crop straw resources in the area [48], it is characterised by a high rate of open field burning [49] that causes environmental pollution and other losses. The burning of straw resources is a common practice, particularly in the dry season, which is practiced by farmers and hunters [50].
Ghana is faced with an inadequate supply and access to energy. The Northern Electricity Department (NED) looks after the electricity distribution to the regions. NED is a subsidiary of the Volta River Authority (VRA), which is state-owned. The electricity supply in the area, just like any part of the country, has experienced many challenges, such as power shortages. Similarly, the percentage of wood fuel and charcoal represents 66% of the entire energy consumed in Ghana [51], where the three regions are inclusive, particularly in the rural areas. The production of charcoal in the regions is progressively increasing. This is either consumed in the area or transported to other parts of the country. The price of a maxi bag of charcoal experiences yearly price increases, for instance, the cost increased from GHS 14.11 in 2011 to GHS 32.33 in 2017 [52]. The challenges of energy affect all individuals; however, women and children are mostly affected in terms of its collection and utilization, particularly for wood fuel. The continuous use of wood fuel has negative health effects on women, girls and babies. Although the renewable energy sector aims to improve the efficient use of biomass to sustain the overexploitation of wood fuel [51], the high demand and utilization of wood fuel and charcoal is a challenge.

3. Materials and Methods

The methodology applied in this study was based on the crop production data from the Ministry of Food and Agriculture (MoFA) in Ghana. This study followed the steps of the (1) selection of the major crops cultivated in the three regions from 2017 to 2019, (2) calculation of the straw resource potential (theoretical and technical), (3) estimation of the energy potential of the technical straw resources and (4) discussed the sustainability and the life cycle assessment (LCA) of straw resources for bioenergy.

3.1. Crop Selection

The major crops grown in these areas are maize, rice, millet, sorghum, groundnut, cowpea, soybean, cassava and yam [53]. This study focused on the 9 major food crops produced in the region from 2017 to 2019. The data were obtained from the Statistics, Research and Information Directorate (SRID) of the Ministry of Food and Agriculture (MoFA), Ghana [53,54,55]. The study focused on 29 MMDAs in the three regions to access the yearly variation in straw yield and establish the trend in straw production. The use of this data provides a better scope of the location of the food crop straws produced both at the local and regional levels. Estimating the straw quantity and its energy potential in rural areas has important environmental implications [56].

3.2. Estimation of Total Straw Resources Generated

An accurate and consistent calculation of straw resources is a requirement for their utilization [57]. All the residues produced by the 9 major crops are considered as straws in this study. The theoretical straw potential was considered as the primary straws produced. The theoretical potential considered all straw resources that were readily available, collected and reused [11]. The analysis was based on the crop production data from 2017 to 2019 [53,54,55] and the straw to grain ratio (SG) or residue to product ratio (RPR) from Kemausour et al. [11] as shown in Equation (1). The SG or RPR values differ due to the variety of crop, climatic conditions, type of soil, fertilizer applications and harvesting time [58]. The environment, crop yield and the type of harvesting method also influence SG [59]. The SG values used in this research are applicable to Ghana and have been widely used in earlier published research conducted in Ghana. The type of straws estimated were based stalks, husks, shells, pods, cobs and peels that varied from the different types of crops.
W S j = i = 1 9 ( W P i , j S G i , j )
  • WS (j) = Straw production of the jth state from 9th number of crops in tonnes
  • WP (i, j) = Yield of the ith crop and the jth state in MT
  • SG (i, j) = Straw to grain ratio/residue to product ratio of the ith crop straw and the jth state

3.3. Estimation of Technical Straw Resources Generated

Due to different factors, such as environmental, social and economic, not all the available straw resources can be accessible for collection. The proportion of the theoretical straw production that can be recovered is known as the technical straw potential [11]. This portion of the theoretical straw can be used to generate energy [60]. Under the sustainability approach, some amount of straw resources can be retained for soil conservation, and the remaining can be used as feedstock for energy generation [61]. This study estimated the technical straw resources produced based on the theoretical straw yield ( W S ) and the straw recoverable fraction from [11] as shown in Equation (2).
T S j = i = 1 9 ( W S i , j S R F i , j )
  • TS (j) = Technical straw potential of the jth state from 9th number of crop straws in tonnes
  • Ws (i, j) = Yield of the ith crop straw and the jth state in tonnes
  • SRF (i, j) = Straw/residue recoverable fraction of the ith crop straw and the jth state

3.4. Estimation of Energy Potential of Straw Resources

The theoretical energy potential is the highest quantity of resources available based on limited biophysical factors. It is the energy content in the raw unprocessed straw resources and, as a primary energy, is expressed in Joules. This primary energy can further be converted into secondary energy in different forms, such as electricity and gaseous or liquid fuels [52]. To estimate the primary energy potential (Equation (3)) of straw resources, we used the technical straw potential based on Equation (2), moisture content (MC) and the lower heating values (LHV). The MC and LHV values of the crop straws were obtained from earlier published literatures [32,35,62,63,64,65,66]. It is important to note that straw biomass can play a significant role in bioenergy generation [67] hence the need to estimate its energy potential.
E P j = i = 1 9 ( T S i , j 1 M c i L H V r i )
  • EP (j) = Energy potential of the jth state from 9th number of crop straws in terajoules (TJ)
  • TS (i, j) = Technical straw yield of the ith crop straw and the jth state in tonnes
  • M c i = Moisture content of the ith crop straw
  • LHVri = Lower heating value of the ith crop straw in MJ/kg

4. Results

4.1. Theoretical Straw Yield

The average annual theoretical crop straws produced for all three regions from 2017 to 2019 was 3,968,931 tonnes, whereas the annual production for each year was 3,983,313 tonnes in 2017, 3,849,396 tonnes (2018) and 4,074,085 tonnes in 2019. During the three years, the crop straw production was higher for yam straws, while millet straws had the least yield. The straw production follows this trend yam straws > maize straws > groundnut straws > soybean straws > cassava straws > rice straws > sorghum straws > cowpea straws > millet straws as shown in Figure 2.
The straws produced are categorised into cereals, legumes, roots and tubers. The proportion of root and tuber crop straws was higher than the other categories of straws. The average annual yield of root and tuber straws was 1,604,503 tonnes (40%), followed by cereals straws with 32% (1,252,797 tonnes) and 28% for legume straws (1,111,631 tonnes). For the district-specific results, some districts were combined due to the nature of the data used. For instance, in the Northern region (Figure 3), the results for the Savelugu and Nanton districts were merged since the data received for 2017 and 2018 were in that form, and it would have been difficult to know how much each district produced. In the North East region (Figure 4), the Bunkpurugu Nyankpanduri and Yunyoo-Nasuan districts were put together as Bunkpurugu–Yunyoo, and in the Savannah region (Figure 5), East Gonja and North East Gonja were also combined.
In all three regions, the Nanumba North district in the Northern region had the highest straw yield of 300,495 tonnes (7.6%) followed by Nanumba South (6.6%) also in the Northern region, East Gonja and North East Gonja (6.4%) and West Gonja (6.2%) (Savannah region). The district with the fifth highest straw yield was the Savelugu and Nanton (6.1%), likewise located in the Northern region. However, the districts with the least quantity of straws were Sagnerigu (0.8%) in the Northern region and North Gonja (0.9%) in the Savannah region as shown in Table 1.
The average annual (2017 to 2019) straw yield for all the districts shows that in the Northern region (Table 2), the districts with the highest theoretical straw yield for maize was the Tolon district (44,989 tonnes) representing 8.7% followed by Savelugu and Nanton (8.0%), West Gonja (5.8%) and Nanumba North (5.5%). However, Kpandai had the lowest maize straw yield of 4809 tonnes (0.9%). The districts with the highest theoretical rice straw yield were Savelugu and Nanton (36,920 tonnes) representing 11.0%, Tolon (9.9%), Tamale Metro (8.7%) and Mion (7.7%). The quantities of millet straw produced in the Zabzugu district (11.2%) were the highest, whereas the districts with the least millet straw yields were Kpandai (0.2%) and Sagnerigu (0.1%). Subsequently, Nanumba South district had the highest sorghum straw yield of 19,785 tonnes (8.1%), with Mion (15,798 tonnes) and Kpandai (14,369 tonnes) recording the fourth and fifth highest production.
Comparing the quantities of root and tuber crop straws generated, cassava straw was higher in three of the districts, namely Nanumba South (53,658 tonnes), Nanumba North (48,348 tonnes), Kpandai (33,533 tonnes), whereas Sagnerigu (612 tonnes) was among the least producers. Similarly for yam straws, the order of production was Nanumba North (143,715 tonnes—12.3%) > Kpandai (43,653 tonnes—12.3%) > Nanumba South (10.6%) > Zabzugu (8.8%), although that of Sagnerigu was a lower rate of 1456 tonnes (0.1%). The legume straw production for groundnut straw was highly produced in the Tatale Sanguli district with 57,244 tonnes (11.8%) followed by Savelugu and Nanton (50,139 tonnes) and Yendi (30,298 tonnes). The lowest annual groundnut straw yields were in the Sagnerigu district accounting for 1808 tonnes (0.4%) and Tamale Metro, which had 822 tonnes (0.2%). The cowpea straw yield was high in Savelugu and Nanton with an annual production of 17,228 tonnes (10.9%), Yendi (8.5%), Tolon (7.0%), while Kumbungu was one of the lowest cowpea straw producing districts. Additionally, the soybean straw yield was high in Yendi with 45,261 tonnes (9.8%), Mion (45,035 tonnes), Nanumba North (36,015 tonnes) and Savelugu and Nanton (33,616 tonnes), whereas Zabzugu had a low yield of 3038 tonnes (0.7%) (Supplementary Materials).
Taking all the regions into consideration, in the North East regions (Table 3), West Mamprusi recorded a high maize straw yield of 27,835 tonnes and a rice straw yield of 26,137 tonnes representing 5.4% and 7.8%, respectively. The least quantity of maize and rice straws were in the Bunkpurugu–Yunyoo district with values of 7345 tonnes (1.4%) and 1430 tonnes (0.4%), respectively. The quantities of millet straw produced in East Mamprusi (10.8%) was the second highest followed by Sawla–Tuna–Kalba (8.1%), West Mamprusi (7.7%) and Bunkpurugu–Yunyoo (6.9%). For Sorghum straw, West Mamprusi (18,710 tonnes) had the second highest potential. The Chereponi district was among the least producers of cassava straw (1341 tonnes). Mamprugu Moagduri’s annual yam straw yield was the least at 982 tonnes (0.08%). Furthermore, the annual production of legume straws precisely for groundnut straws was high in the West Mamprusi (41,363 tonnes) and Mamprugu Moagduri (30,443 tonnes) districts. Bunkpurugu–Yunyoo (9.2%) and Mamprugu Moagduri (6.9%) were among the top five cowpea producers in the three regions. For soybean straws, Bunkpurugu–Yunyoo (26,982 tonnes) also had a high yield; however, Mamprugu Moagduri had the least soybean potential of 1557 tonnes (0.3%).
Although the Savannah region (Table 4) generated maize and rice straws, the quantities produced in the districts were not among the top five producers. The Bole district in the Savannah region had the lowest rice straw yield of 2623 tonnes (0.8%); however, Sawla–Tuna–Kalba (17,887 tonnes) was the district with the third highest sorghum potential. East Gonja and North East Gonja (1371 tonnes) and North Gonja (1108 tonnes) had the least sorghum straw potential. Comparing the quantities of root and tuber crop straws generated, cassava straw was higher in the West Gonja district (100,544 tonnes) representing 23.1% as well as East Gonja and North East Gonja (30,674 tonnes). Additionally, the potential of yam straws in East Gonja and North East Gonja was 137,361 tonnes (11.7%) with North Gonja generating the least cowpea straw production.

4.2. Technical Straw Yield

The recoverable fraction (technical straw) of the theoretical straw, which can be used for energy generation shows that 2,967,933 tonnes of the cereals, legumes, root and tuber straws can be used for energy generation. Figure 6 shows the comparison between the annual technical and theoretical straws produced from 2017 to 2019. From the figure the straws with the highest annual technical yield were yam 935,927 tonnes (31.5%), groundnut 485,236 tonnes (16. 3%), maize 438,926 tonnes (14.8%) and soybean 374,564 (12.6%). Sorghum, cowpea, cassava and millet each had their straw technical yields below 10%.
Table 5 shows the annual productivity of technical straws that were produced in the Northern region. Six of the districts with the highest technical straw yields were in the Northern region, namely Nanumba North (220,104 tonnes), Savelugu and Nanton (193,309 tonnes), Nanumba South (186,581 tonnes), Yendi (175,763 tonnes), Kpandai (175,234 tonnes) and Zabzugu (154,642 tonnes). Sagnerigu was one of the districts with the least technical straw yield of 25,206 tonnes. Overall, the Northern region produced the highest technical straw yield of 1,970,049 tonnes.
The annual production of technical straws in the North East shown in Table 6 reveals that the top four producers of straw in the North East region are West Mamprusi, East Mamprusi, Bunkpurugu–Yunyoo and Mamprugu Moagduri. Comparing the technical straw potential for all the regions, the North East had the least potential of 403,551 tonnes.
Table 7 shows the technical straw yield produced in each district in the Savannah region. East Gonja and North East Gonja (185,288 tonnes) were among the districts with the highest technical straw potential. However, one of the districts with the least technical straw yield was North Gonja (28,421 tonnes). In general, the leading straw producing districts were East Gonja and North East Gonja, West Gonja, Sawla–Tuna–Kalba and Bole. The technical straw potential in the Savannah region was the second highest (594,332 tonnes).

4.3. Energy Potential of Crop Straws

Based on the technical energy potential of straws for the three regions, the annual energy potential was estimated as 42,256 TJ. Yam straw had the highest energy potential of 13,922 TJ, followed by groundnut straw 7611 TJ, maize straw (5704 TJ), soybean straw (5409 TJ), sorghum straw (2836 TJ), cowpea straw (2119 TJ), rice straw (1767 TJ), millet straw (1630 TJ) and cassava straw (1258 TJ). The maximum, minimum and average straw energy potential that was produced for each crop straw is shown in Figure 7. For each district, yam straw produced a maximum energy potential of 1710 TJ, an average potential of 535 TJ and a minimum potential of 12 TJ. Groundnut straw had a maximum, an average and a minimum energy potential of 904 TJ, 293 TJ and 13 TJ, respectively; the soybean straw energy potential was 523 TJ, 208 TJ and 18 TJ for a maximum, an average and a minimum energy potential, respectively. Maize straw had the potential to produce 495 TJ, 219 TJ and 53 TJ for a maximum, an average and a minimum energy potential, respectively. Although maize straw was the third straw with the highest energy potential, its minimum energy potential was higher than that of yam, groundnut and soybean straws.
Table 8 shows the annual energy potential of the straws produced in the Northern region. The Northern region had the highest energy potential of 28,153 TJ. The districts in the region with the topmost energy potential were Nanumba North with an energy potential of 3127 TJ (11.1%), Savelugu and Nanton had 2795 TJ (9.9%), Nanumba South had 2628 TJ (9.3%), Kpandai had 2529 TJ (9.0%), Yendi had 2514 TJ (8.93%) and Tatale Sanguli had 2494 TJ (8.86%).
Table 9 shows the technical energy potential of straw resources from 2017 to 2019 in the North East region. The region recorded the lowest annual straw energy potential of 5773 TJ, whereas West Mamprusi with an energy potential of 1932 TJ (33.5%) and East Mamprusi with 1099 TJ (19%) were the districts in the region with high energy potential, although these values are far below that of the Northern and Savannah regions.
The technical energy potential of straw resources for the Savannah region is shown in Table 10. The Savannah region had the second highest energy potential of 8330 TJ, and the districts in the region with the highest straw energy potential were East Gonja and North East Gonja with an energy potential of 2672 TJ (32.1%) and West Gonja representing 2059 TJ (24.7%), and Sawla–Tuna–Kalba had 1155 TJ (13.9%).

5. Discussion

5.1. Theoretical and Technical Straw Yields

The annual theoretical crop straws yield produced for all the three regions from 2017 to 2019 was 3,968,931 tonnes. Yam straw had the highest theoretical yield followed by maize straws, groundnut straws, soybean straws, cassava straws, rice straws, sorghum straws, cowpea straws and millet straws. Root and tuber straws had the highest annual straw potential of 1,604,503 tonnes (40%), followed by cereal straws, which had 1,252,797 tonnes (32%) and legume straws with 1,111,631 tonnes (28%). The results confirm that roots and tubers are the crops with the highest straw potential, although cereal straws were the second topmost straw generated. Earlier research [48] revealed when the authors compared cereal and legume straw potential that higher quantities of cereal straws were produced in Ghana than legume straws. The districts with the topmost theoretical straw (all crop straws) yields were Nanumba North, Nanumba South, East Gonja and North East Gonja, West Gonja, Savelugu and Nanton. Sagnerigu and North Gonja had the least theoretical straw potential.
Although there were differences in the different crop straw yields from different districts, it is crucial to know that variation in straw quantities and its characteristics depends the type of crop, production practices, farming practices and the climatic conditions of the locality [68,69]. The districts with a high theoretical straw potential can be considered for future research or surveys related to straw biomass. The availability of the different types of straws in the regions agrees with findings of Mohammed et al. [70], who reiterated that there are potential crop straws in Ghana that have a possibility of providing bioenergy for the country. One fourth of the crop straws produced can be recovered, and half of the crop straws can be sustainably retrieved, and the other half is economically collectable [71]. Retaining an amount of straw resources for soil conservation and other purposes creates the possibility of using the technical potential as raw materials for energy generation [61].
The annual technical straw yield for all the straws from 2017 to 2019 was 2,967,933 tonnes. The crop straws with the highest technical yield were yam, groundnut, maize and soybean. This shows that future research or development of straws for other purposes in the three regions should pay particular attention to these straws, which have high technical potential. The large quantities of yam, maize and groundnut straws produced in the three regions agree with Kemausour et al. [11], where these three straws where among the top five crop straws produced in their research. However, although the theoretical straw yield was high (3,968,931 tonnes), its annual technical yield (2,967,933 tonnes) was lower, and this could be due to the demand of straws for soil amendment, animal feed and other traditional uses. In comparison with other straws, the difference between the annual theoretical and technical cassava straw potential was extremely high. This could be due to the high demand of cassava peels as animal feed, particularly for goats and sheep in the area. Additionally, since the technical potential of straw is also affected by the biomass moisture content [59], this can decrease the technical potential of cassava straws.
The high technical straw potential in the Northern region (Nanumba North, Savelugu and Nanton, Nanumba South, Yendi, Kpandai and Zabzugu) and the Savannah region (East Gonja and North East Gonja) makes these areas lucrative for biomass projects. The findings of Azasi et al. [34] confirmed the abundance of straw resources, particularly cereal and legume straws in the Northern region. This demonstrates that the Northern region has the potential for comprehensive straw utilization for bioenergy and other purposes. In addition, the Savannah region can be examined for future biomass research and bioenergy projects. The annual theoretical straw yield potential directly correlates with the technical straw yield potential. Exploiting and using biomass resources in a sustainable way are one of the concepts towards sustainable technologies [72]. The role of crop straws for the sustainable development of Ghana cannot be ignored; hence, government and nongovernmental organizations need to collaborate to promote the efficient use of these resources. By 2030, the global bioenergy demand is expected to double [71], and Ghana can play a crucial role in developing its bioenergy sector and be the centre of bioenergy projects in West Africa and on the continent at large.

5.2. Energy Potential of Straw Resources

The total annual energy potential for all the straws was 42,256 TJ. The straws with the highest energy potential were yam straws, groundnut straws, maize straws and soybean straws. While the energy potential of sorghum, cowpea, rice, millet and cassava straws had the least energy potential.
Although the energy potential of maize straw was the third highest, its minimum straw energy potential of 58 TJ was higher than all the crop straws minimum energy potential. Soybean was the fourth straw with the highest energy potential, but its maximum straw potential of 523 TJ per district was higher than that of maize (495 TJ). These findings guide the possibility of straws to generate bioenergy, particularly for yam, groundnut, maize and soybean straws. In Ghana, although other biomass resources can be used to generate energy, crop straws are essential feedstock as far as energy potential is concerned [11]. According to Elemike et al. [73], crop straws from sorghum, rice, corn and groundnut have good energy potential that can generate bioethanol. Crop straws provide valuable environmental impacts that ensure the continuation of the agroecosystem [74] and are essential carbon sequestration resources [75] that can mitigate climate change and advance socioeconomic development.
Comparing the three regions, the Northern region had the highest straw energy potential of 28,153 TJ, followed by the Savannah (8330 TJ) and the North East (2672 TJ) regions. The high energy potential of crop straws in the Northern region partly agrees with the findings of Azasi et al. [34]; the authors compared briquette production from straws in all the regions of Ghana and confirmed that the Northern region produced the highest quantities of straw briquettes than all the other regions. The upmost potential of straws produced in the Northern region directly correlated in their energy potential. The linear correlation between the quantities of straw produced and the energy potential agrees with the findings of Gutiérrez et al. [76] who indicated a linear dependency between the straw produced and energy generated. There is the possibility that one important source of energy in the future will be from annual and perennial crop straws according to Gheewala et al. [77].
The energy potential of crop straws is the foundation to generate other forms of bioenergy (solid, liquid or gas) [78]. This can be supplemented with animal, forest and municipal solid wastes that are readily available in the districts. In Ghana, over half of the livestock produced in the country is from the three regions with cattle, sheep, goats and poultry dominating the livestock sector. Consequently, these areas have the ability to produce large amounts of animal waste. Similarly, the regions boast of forest reserves that have abundant solid wastes. Briquettes, bioethanol, biogas, biomethane and bioelectricity are potential bioenergy options in the regions [34]. The Northern region that is the leading producer of straws with the highest energy potential can be the central location to establish energy plants. One of the major holdups for energy generation of straws is transportation [30], consequently, bioenergy projects can be at the district levels. The districts with high technical straw yields and energy potential can be the hub of bioenergy generation. In the Northern region, Nanumba North, Savelugu and Nanton and Nanumba South can be considered as the central districts for bioenergy projects. East Gonja and North East Gonja together with West Gonja (in the Savannah region) are proposed as central bioenergy production districts, while West Mamprusi and East Mamprusi (in the North East region) can be explored.
However, this research proposes a further assessment and evaluation for better decision making. This necessitates government intervention in prioritizing the comprehensive management of straw and other biomass resources for energy generation. Although the Energy Commission of Ghana seeks to promote bioenergy, there has not been tremendous improvement over the years despite the fact that global energy consumption is expected to increase by 2040 [79]. The 2030 Framework for Climate and Energy and the 21st UN Conference on Climate Change and the Paris Climate Agreement indicate that renewable energy sources are an essential approach to attain energy security [80]. In this regard, Ghana needs both government and industrial efforts to promote the sustainable exploitation of biomass [81].

6. Sustainability of Crop Straws for Bioenergy

The fundamental role of bioenergy in advancing sustainable development cannot be ignored [82]. In the context of research, sustainability is providing bioenergy for the current generation without jeopardizing the bioenergy needs of the future generation [83]. Crop straws are important feedstock for biofuel production, and the sustainable harvesting of these biomass resources is critical [82]. The carbon neutrality concept of crop straws is the conversion of atmospheric carbon dioxide (CO2) by plants into biomass that is preserved as biogenic carbon. During the decay and decomposition of plants, biogenic carbons are released into the atmosphere in the form of CO2. When the amount of carbon released by plants equals the amount released during decomposition, then it neutralises the atmospheric carbon. The combustion of biomass resources, such as crop straws, also neutralises the CO2 in the atmosphere [71].
The sustainable approach in using crop straws for bioenergy involves the election or combination of conducive processes [84]. For instance, blending biofuels with fossil fuels is a climate change mitigation strategy [85]. A number of researchers reaffirmed the sustainability of biomass resources in reducing the carbon footprint. According to Shafie et al. [86], in comparing power generation from coal or natural gas and rice straws, the use of rice straws for power generation is more environmentally friendly. Biofuels from biomass resources, such as crop straws, for bioelectricity, biomethane and bioethanol has the potential to minimise GHG emissions [87]. According to Sanscartier et al. [88], generating electricity from corn straw pellets can reduce GHG emissions by 40% and 80% when equated with coal and natural gas. Electricity from biomass resources is more energy efficient [89] and environmentally friendly than conventional fuels. However, an adequate assessment, planning and an evaluation of the environmental impact of biomass resources for bioenergy is critical to advance sustainability [90].
The sustainability of a country’s bioenergy sector depends on the demand, availability of biomass resources and technology in the region. Sustainable energy is essential in the future supply of energy and can promote the supply of renewable resources, such as crop straws, that are locally available, easily accessible and help to reduce the carbon footprint. Similarly, innovative support, capacity building and policy and legislative instruments are obligatory in advancing sustainable bioenergy [82].

7. Generating Low-Carbon Heat from Biomass: Life Cycle Assessment of Bioenergy Scenarios

Anthropogenic global warming and environmental pollution as a result of world economic growth, large emissions of GHGs from agriculture and pastoralism constitutes one of the main global environmental crises. In 1987, the Bruntland Commission, in its endeavour to address the problem of conflicts between economic advancement and environmental integrity, defined the concept of sustainable development as “development, which actualises the needs of the present without undermining the capability of future generations to meet their own needs” [91]. This has set the framework for the inclusiveness of environmental policies and sustainable development agendas, which comprise bioenergy. The sustainability of biomass enforces the utilization of biomass resources without deteriorating the environment or having detrimental socioeconomic impacts [92].
The life cycle assessment (LCA) is an important tool to explore environmental sustainability [93]. The most recent theory in LCA is “life cycle management” (LCM), which represents holistic and ecofriendly (green) strategies during the life cycle of a product, system or service. To this end, LCA, known as “Ecobalance”, is an evolving aggregate instrument and system for the prompt advancement in ecoefficiency and sustainable development. This relies on the long-term global commitment to “cleaner technology” [94]. It implies the key to guarantee that the resolutions at one phase do not induce adversarial impacts at other stages. The LCA comprises four stages: The first stage is the goal and scope definition that delineates the goal and scope of the research, system boundary and functional unit. The second phase is life cycle inventory (LCI), modelled product’s life cycle through assessment of all inputs and outputs of the product. In the third phase, namely the life cycle inventory analysis (LCIA), the environmental adequacy of all the inputs and outputs of a product are considered. The fourth stage is the interpretation stage that is concluded with prospective measures to lessen the ecological impact [95]. The assessment of the environmental dimension of crop straw-based energy production is imperative for technology investment. The development of different renewable energy resources constitutes cost-effective, consistent, safe and sustainable solutions for their extreme accessibility. In particular, biomass remains the major contributor with 9% (~51 EJ) of the world’s total energy supply, with approximately 55% devoted to heating and cooking in developing countries [96].
The United Nations (UN) has conscripted crop straw-based energy production as a key dimension to address environmental setbacks [97]. The progress and utilization of new technologies are subject to validation by policy makers. Therefore, determining the wide variety of factors associated with the approval or refusal of exploiting technologies transforming crop straws into biofuels is essential if operative legislation and utilization of technology are to arise. The LCA then remains the practical tool to evidence all the effects of the new technologies as well as to demonstrate the full impacts on the complete value chain (biomass to biofuel). Bioenergy systems will play a key role in Ghana to achieve climate change, emission reduction and renewable energy contribution targets. The worries that a bio-based economy may compromise the sustainability of the transition, can be handled through the implementation and enactment of life cycle-based instruments, notably LCA, to assess environmental impacts, economic indexes by means of life cycle costing (LCC) and social indexes through the lifecycle built on the social life cycle assessment (SLCA) [98]. Nevertheless, combining LCA, LCC and SLCA will result in adequate and efficient tools for the sustainable analysis of products [99].

8. Recommendations

The study demonstrates the enormous quantities of straw resources and their energy potential in the three regions. However, there is a need for sustainable interventions to advance the compressive utilization of straw resources for bioenergy generation. Subsequently, the study advances the following recommendations:
  • Conduct further evaluations to authenticate the potential of sustainable biomass resources in the three regions.
  • Future development of biomass in the three regions should give precedence to yam, groundnut, maize and soybean straws.
  • Sustainably manage biomass as a carbon-neutral strategy and decentralise bioenergy projects.
  • Establish flexible bioenergy and system integration in the Northern region to serve as a central location that connects the Savannah and North East regions for social and economic development.
  • It is necessary to consider the districts with substantial straw and energy potential for future second-generation bioconversion projects to accelerate the development trajectory to other industries.
  • Heighten government and nongovernmental organizations cooperation to improve straw utilization.
  • Examine briquettes, bioethanol, biogas, biomethane and bioelectricity as potential bioenergy options in the regions.
  • Augment capacity building, policy and legislative instruments on straw utilization to revamp sustainable bioenergy systems in Ghana.

9. Conclusions

This study provides an environmental sustainability perspective on the utilization of biomass-based residues for bioenergy production using data from the Northern, North East and Savannah regions in Ghana. The technical energy potential of all the crop straws across the regions was 42,256 TJ. The Northern region (28,153 TJ) recorded the highest energy potential followed by the Savannah (8330 TJ) and the North East (5773 TJ) regions.
The primary energy of straw resources can be converted into briquettes, bioethanol, biogas, biomethane and electricity. Nonetheless, the development of the bioenergy sector in the regions must supplement crop straws with livestock, forest and municipal biomass that are readily available.
In Ghana, the bioenergy sector depends on the demand, availability of biomass resources and technology. Ghana, like other agrarian economies, must shift towards renewable energy utilization to substitute the depletion of fossil fuel sources. Bioenergy generation from various renewable energy resources, notably crop residues, is one of the sustainable approaches for waste management, particularly in developing countries. A crop straw power plant not only promotes the sustainable management of biomass but also reduces anthropogenic greenhouse gas emissions that can cause several environmental problems.
Thus, environmental sustainability is a condition of balance, resilience and interdependency, which enables actualizing the needs of human society without compromising biological diversity or outreaching the capacity of its load-bearing ecosystems to replenish the utilities required to satisfy those needs. The key feature is to define and address a common holistic strategy to manage locally or conjointly shared universal environmental risks and to foster resilience across states to advance inclusive and sustainable development. The evaluation of bioenergy systems using a cradle-to-grave LCA offers an improvement to capitalise on the bioenergy system as a guideline support instrument for policymakers and end users. The study recommends the need for Ghana to revamp the bioenergy sector to advance sustainable development.

Supplementary Materials

The following supporting information can be downloaded at: https://www.mdpi.com/article/10.3390/su14031434/s1, Table S1: Production for major crops in the Northern region—2017. Table S2: Production for major crops in the Northern region—2018. Table S3: Production for major crops in the Northern region—2019. Table S4: Production for major crops in the North East region—2019. Table S5: Production for major crops in the Savannah region—2019.

Author Contributions

P.A.S. Conceptualization, Data curation, Methodology, Formal analysis, Writing—original draft; Y.W. Supervision, Validation, Writing—review and editing; H.W. Validation, Formal analysis; K.A.W.N. Formal analysis, Writing—review and editing; C.G. Validation, Writing—review & editing; Y.B. Conceptualization, Supervision, Funding acquisition. All authors have read and agreed to the published version of the manuscript.

Funding

The National Science Foundation of China (41771569) provided financial support for this research.

Institutional Review Board Statement

Not applicable.

Informed Consent Statement

Not applicable.

Data Availability Statement

Not applicable.

Acknowledgments

We are grateful to the Statistics, Research and Information Directorate (SRID) of the Ministry of Food and Agriculture (MoFA), particularly Kofi Darko and all the staff at the districts, regional and national level who compiled the data for this research. We also express our gratitude to the anonymous reviewers for their useful suggestions and comments.

Conflicts of Interest

The authors declare no conflict of interest.

References

  1. Atuguba, R.A.; Tuokuu, F.X.D. Ghana’s renewable energy agenda: Legislative drafting in search of policy paralysis. Energy Res. Soc. Sci. 2020, 64, 101453. [Google Scholar] [CrossRef]
  2. Pachauri, S.; Brew-Hammond, A.; Barnes, D.F.; Bouille, D.H.; Gitonga, S.; Modi, V.; Prasad, G.; Rath, A.; Zerrifi, H. Energy Access for Development; Cambridge University Press: Cambridge, UK, 2012. [Google Scholar]
  3. Chand, V. Conservation of energy resources for sustainable development: A big issue and challenge for future. In Environmental Concerns and Sustainable Development, 1st ed.; Shukla, V., Kumar, N., Eds.; Springer: Singapore, 2020; pp. 293–315. [Google Scholar]
  4. Hossen, M.M.; Rahman, A.S.; Kabir, A.S.; Hasan, M.F.; Ahmed, S. Systematic assessment of the availability and utilization potential of biomass in Bangladesh. Renew. Sustain. Energy Rev. 2017, 67, 94–105. [Google Scholar] [CrossRef]
  5. EIA. Energy Information Administration. International Energy Outlook. World Total Primary Energy Consumption by Region. 2017. Available online: https://www.eia.gov/outlooks/ieo/pdf/ieotab_1.pdf (accessed on 20 May 2021).
  6. Bhattacharyya, S.C. Energy Economics: Concepts, Issues, Markets and Governance; Springer: Cham, Switzerland, 2011; p. 538. [Google Scholar]
  7. United Nations. Sustainable Development Goals. 2021. Available online: https://www.un.org/sustainabledevelopment/ (accessed on 8 August 2021).
  8. IEA. International Energy Agency (IEA). World Energy Outlook. 2016. Available online: https://www.iea.org/publications/freepublications/publication/WorldEnergyOutlook2016ExecutiveSummaryEnglish.pdf (accessed on 16 January 2021).
  9. Owusu, P.A.; Sarkodie, S.A. A review of renewable energy sources, sustainability issues and climate change mitigation. Cogent Eng. 2016, 3, 1167990. [Google Scholar] [CrossRef]
  10. Smolinski, S.; Cox, S. Policies to Enable Bioenergy Deployment Key Considerations and Good Practices; National Renewable Energy Laboratory: Golden, CO, USA, 2016. Available online: https://www.nrel.gov/docs/fy16osti/66322.pdf (accessed on 18 August 2021).
  11. Kemausuor, F.; Kamp, A.; Thomsen, S.T.; Bensah, E.C.; Østergård, H. Assessment of biomass residue availability and bioenergy yields in Ghana. Resour. Conserv. Recycl. 2014, 86, 28–37. [Google Scholar] [CrossRef]
  12. FAOSTAT. Food and Agriculture Organization of the United Nations. 2016. Available online: http://www.fao.org/faostat/en/#data/QC (accessed on 11 June 2021).
  13. Wang, B.; Dong, F.; Chen, M.; Zhu, J.; Tan, J.; Fu, X.; Wang, Y.; Chen, S. Advances in Recycling and Utilization of Agricultural Wastes in China: Based on Environmental Risk, Crucial Pathways, Influencing Factors, Policy Mechanism. Procedia Environ. Sci. 2016, 31, 12–17. [Google Scholar] [CrossRef] [Green Version]
  14. Kretschmer, B.; Allen, B.; Hart, K. Mobilising Cereal Straw in the EU to Feed Advanced Biofuel Production; Institute for European Environmental Policy: Brussels, Belgium, 2012; pp. 1–6. [Google Scholar]
  15. REN21. Renewables 2011 Global Status Report, REN21 (Renewable Energy Policy Network for the 21st Century); Secretariat: Paris, France, 2011; p. 115. [Google Scholar]
  16. International Energy Agency. IEA Bioenergy Countries’ Report–Update 2018. Bioenergy Policies and Status of Implementation. 2018. Available online: https://www.ieabioenergy.com/wp-content/uploads/2018/10/IEA-Bioenergy-Countries-Report-Update-2018-Bioenergy-policies-and-status-of-implementation.pdf (accessed on 18 August 2021).
  17. European Commission. An Energy Policy for Europe, COM (2007) 1 Final; European Commission: Brussels, Belgium, 2007; p. 27. [Google Scholar]
  18. AEBIOM. European Biomass Association, Statistical Report—European Bioenergy Outlook; AEBIOM: Brussels, Belgium, 2016. [Google Scholar]
  19. Hamelin, L.; Borzęcka, M.; Kozak, M.; Pudełko, R. A spatial approach to bioeconomy: Quantifying the residual biomass potential in the EU-27. Renew. Sustain. Energy Rev. 2019, 100, 127–142. [Google Scholar] [CrossRef]
  20. IRENA. Africa 2030: Roadmap for a Renewable Energy Future. Available online: https://www.irena.org/-/media/Files/IRENA/Agency/Publication/2015/IRENA_Africa_2030_REmap_2015_low-res.pdf (accessed on 18 August 2021).
  21. AUC-ECA. African Union Commission (AUC) and Economic Commission for Africa (ECA). Africa Bioenergy Policy Framework and Guidelines. Towards Harmonizing Sustainable Bioenergy Development in Africa. 2013. Available online: https://au.int/sites/default/files/documents/32183-doc-africa_bioenergy_policy-e.pdf (accessed on 16 August 2021).
  22. UNCG and CSO Platform. The Sustainable Development Goals (SDGs) in Ghana. 2017. Available online: https://www.undp.org/content/dam/unct/ghana/docs/SDGs/UNCT-GH-SDGs-in-Ghana-Avocacy-Messages-2017.pdf (accessed on 20 April 2021).
  23. Forestry Commission. Ghana’s National Forest Reference Level. 2017. Available online: https://redd.unfccc.int/files/ghana_national_reference__level_01.01_2017_for_unfccc-yaw_kwakye.pdf (accessed on 5 July 2021).
  24. Energy Commission of Ghana. Energy Supply and Demand Outlook for Ghana. 2017. Available online: http://www.energycom.gov.gh/planning/datacenter/energy-outlook-for-ghana?download=76:energy-outlook-forghana-2018 (accessed on 30 August 2021).
  25. Adobea Oduro, M.; Gyamfi, S.; Sarkodie, S.A.; Kemausuor, F. Evaluating the Success of Renewable Energy and Energy Efficiency Policies in Ghana: Matching the Policy Objectives against Policy Instruments and Outcomes. In Renewable Energy—Resources, Challenges and Applications; IntechOpen: London, UK, 2020. [Google Scholar]
  26. Gyamfi, S.; Modjinou, M.; Djordjevic, S. Improving electricity supply security in Ghana: The potential of renewable energy. Renew. Sustain. Energy Rev. 2015, 43, 1035–1045. [Google Scholar] [CrossRef] [Green Version]
  27. Kemausuor, F.; Obeng, G.Y.; Brew-Hammond, A.; Duker, A. A review of trends, policies and plans for increasing energy access in Ghana. Renew. Sustain. Energy Rev. 2011, 15, 5143–5154. [Google Scholar] [CrossRef]
  28. Bensah, E.; Kemausuor, F.; Antwi, E.; Ahiekpor, J. China-Ghana South-South Cooperation on Renewable Energy Technology Transfer: Identification of Barriers to Renewable Energy Technology Transfer to Ghana; United Nations Development Programme: Accra, Ghana, 2015. [Google Scholar]
  29. Hiloidhari, M.; Das, D.; Baruah, D.C. Bioenergy potential from crop residue biomass in India. Renew. Sustain. Energy Rev. 2014, 32, 504–512. [Google Scholar] [CrossRef]
  30. Thomsen, S.T. Bioenergy in Ghana—Biogas and Ethanol from Agricultural Residues. Ph.D. Thesis, DTU Chemical Engineering, Lyngby, Denmark, 2014. [Google Scholar]
  31. Thrän, D.; Seidenberger, T.; Zeddies, J.; Offermann, R. Global biomass potentials—Resources, drivers and scenario results. J. Energy Sust. Dev. 2010, 14, 200–205. [Google Scholar] [CrossRef]
  32. Duku, M.H.; Gu, S.; Hagan, E.B. A comprehensive review of biomass resources and biofuels potential in Ghana. Renew. Sust. Energy Rev. 2011, 15, 404–415. [Google Scholar] [CrossRef]
  33. Nelson, N.; Darkwa, J.; Calautit, J.; Worall, M.; Mokaya, R.; Adjei, E.; Kemausuor, F.; Ahiekpor, J. Potential of Bioenergy in Rural Ghana. Sustainability 2021, 13, 381. [Google Scholar] [CrossRef]
  34. Azasi, V.D.; Offei, F.; Kemausuor, F.; Akpalu, L. Bioenergy from crop residues: A regional analysis for heat and electricity applications in Ghana. Biomass Bioenergy 2020, 140, 105640. [Google Scholar] [CrossRef]
  35. Präger, F.; Paczkowski, S.; Sailer, G.; Derkyi, N.S.; Pelz, S. Biomass sources for a sustainable energy supply in Ghana–A case study for Sunyani. Renew. Sust. Energy Rev. 2019, 107, 413–424. [Google Scholar] [CrossRef]
  36. Cudjoe, D.; Nketiah, E.; Obuobi, B.; Adu-Gyamfi, G.; Adjei, M.; Zhu, B. Forecasting the potential and economic feasibility of power generation using biogas from food waste in Ghana: Evidence from Accra and Kumasi. Energy 2021, 226, 120342. [Google Scholar] [CrossRef]
  37. Achinas, S.; Euverink, G.J.W. Theoretical analysis of biogas potential prediction from agricultural waste. Resour.-Effic. Technol. 2016, 2, 143–147. [Google Scholar] [CrossRef] [Green Version]
  38. Avcıoğlu, A.O.; Dayıoğlu, M.A.; Türker, U. Assessment of the energy potential of agricultural biomass residues in Turkey. Renew. Energy 2019, 138, 610–619. [Google Scholar] [CrossRef]
  39. Government of Ghana. Ghana Regions and Districts. A Resource Base for All Local Assemblies in Ghana. 2019. Available online: http://www.ghanadistricts.com (accessed on 12 April 2020).
  40. MoFA. Agriculture in Ghana-Facts and Figures. Statistics, Research and Information Directorate (SRID); Ministry of Food and Agriculture (MoFA): Accra, Ghana, 2015. [Google Scholar]
  41. PHC. Population and Housing Census. The 2010 Population and Housing Census (PHC) Reports: Analysis of District Data and Implications for Planning; Ghana Statistical Service: Accra, Ghana, 2010. [Google Scholar]
  42. Bawa, A. Agriculture and Food Security in Northern Ghana. Asian J. Agric. Ext. Econ. Sociol. 2019, 31, 1–7. [Google Scholar] [CrossRef]
  43. SARI. Savannah Agricultural Research Institute. 2017. Available online: http://sari.csir.org.gh/about-us/brief-overview/ (accessed on 25 March 2021).
  44. Wiredu, A.N.; Gyasi, K.O.; Abdoulaye, T.; Sanogo, D.; Langyintuo, A. Characterization of Maize Producing Households in the Northern Region of Ghana; CSRI/SARI—IITA publication, DTMA CIMMYT Country Report—Ghana; CIMMYT: Veracruz, Mexico, 2010. [Google Scholar]
  45. MoFA. Agriculture in Ghana-Facts and Figures. Statistics, Research and Information Directorate (SRID); Ministry of Food and Agriculture (MoFA): Accra, Ghana, 2017. [Google Scholar]
  46. Dazé, A. Climate Change Vulnerability and Adaptive Capacity in Northern Ghana (CVCA Report). 2013. Available online: http://careclimatechange.org/wp-content/uploads/2014/08/CVCA_Ghana.pdf (accessed on 10 September 2021).
  47. Akudugu, M.A.; Alhassan, A.R. The climate change menace, food security, livelihoods and social safety in Northern Ghana. Int. J. Sust. Dev. World Policy 2012, 1, 80–95. [Google Scholar]
  48. Seglah, P.A.; Wang, Y.; Wang, H.; Bi, Y. Estimation and efficient utilization of straw resources in Ghana. Sustainability 2019, 11, 4172. [Google Scholar] [CrossRef] [Green Version]
  49. Kombiok, J.M.; Buah, S.S.J.; Sogbedji, J.M. Enhancing soil fertility for cereal crop production through biological practices and the integration of organic and In-organic fertilizers in northern Savanna zone of Ghana. In Soil Fertility; Issaka, R.N., Ed.; Intech: Rijeka, Croatia, 2012; pp. 3–32. [Google Scholar]
  50. Seglah, P.A.; Wang, Y.; Wang, H.; Bi, Y.; Zhou, K.; Wang, Y.; Wang, H.; Feng, X. Crop straw utilization and field burning in Northern region of Ghana. J. Clean. Prod. 2020, 261, 121191. [Google Scholar] [CrossRef]
  51. Ministry of Energy. National Energy Policy. 2010. Available online: https://www.greengrowthknowledge.org/sites/default/files/downloads/policy-database/GHANA%29%20National%20Energy%20Policy.pdf (accessed on 6 June 2021).
  52. Biomass Energy Europe. Harmonization of Biomass Resource Assessments, Volume 1: Best Practices and Methods Handbook; BEE: Freiburg, Germany, 2010. [Google Scholar]
  53. SRID-MoFA. Production of Major Crops in the Northern Region. Statistics, Research and Information Directorate (SRID); Ministry of Food and Agriculture: Accra, Ghana, 2018. [Google Scholar]
  54. SRID-MoFA. Production of Major Crops in the Northern Region. Statistics, Research and Information Directorate (SRID); Ministry of Food and Agriculture: Accra, Ghana, 2019. [Google Scholar]
  55. SRID-MoFA. Production of Major Crops in the Northern, North East and Savannah Regions. Statistics, Research and Information Directorate (SRID); Ministry of Food and Agriculture: Accra, Ghana, 2020. [Google Scholar]
  56. Malico, I.; Carrajola, J.; Gomes, C.P.; Lima, J.C. Biomass residues for energy production and habitat preservation. Case study in a montado area in Southwestern Europe. J. Clean. Prod. 2015, 112, 3676–3683. [Google Scholar] [CrossRef] [Green Version]
  57. Lypchuk, V.; Syrotiuk, K. Estimation of energy potential of agricultural enterprise biomass. In E3S Web of Conferences; EDP Sciences: Les Ulis, France, 2017; Volume 14, p. 2017. [Google Scholar]
  58. Prasertsan, S.; Sajjakulnukit, B. Biomass and biogas energy in Thailand: Potential, opportunity and barriers. Renew. Energy 2006, 31, 599–610. [Google Scholar] [CrossRef]
  59. Morato, T.; Vaezi, M.; Kumar, A. Assessment of energy production potential from agricultural residues in Bolivia. Renew. Sustain. Energy Rev. 2019, 102, 14–23. [Google Scholar] [CrossRef]
  60. Gonzalez-Salazar, M.A.; Morini, M.; Pinelli, M.; Spina, P.R.; Venturini, M.; Finkenrath, M.; Poganietz, W.-R. Methodology for estimating biomass energy potential and its application to Colombia. Appl. Energy 2014, 136, 781–796. [Google Scholar] [CrossRef] [Green Version]
  61. Molina-Guerrero, C.E.; Sanchez, A.; Vázquez-Núñez, E. Energy potential of agricultural residues generated in Mexico and their use for butanol and electricity production under a biorefinery configuration. Environ. Sci. Pollut. Res. 2020, 27, 28607–28622. [Google Scholar] [CrossRef]
  62. Koopmans, A.; Koppejan, J. Agricultural and forest residues-generation, utilization and availability. Reg. Consult. Mod. Appl. Biomass Energy 1997, 6, 10. [Google Scholar]
  63. Santos, R.M.; Bispo, D.F.; Granja, H.S.; Sussuchi, E.M.; Ramos, A.L.D.; Freitas, L.S. Pyrolysis of the Caupi Bean Pod (Vigna unguiculata): Characterization of biomass and bio-oil. J. Braz. Chem. Soc. 2020, 31, 1125–1136. [Google Scholar] [CrossRef]
  64. NREL. Assessment of Biomass Resources in Liberia; Technical report NREL/TP-6A2–44808; NREL: Golden, CO, USA, 2009. [Google Scholar]
  65. Okello, C.; Pindozzi, S.; Faugno, S.; Boccia, L. Bioenergy potential of agricultural and forest residues in Uganda. Biomass Bioenergy 2013, 56, 515–525. [Google Scholar] [CrossRef]
  66. Jekayinfa, S.O.; Scholz, V. Potential availability of energetically usable crop residues in Nigeria. Energy Sources Part A Recovery Util. Environ. Eff. 2009, 31, 687–697. [Google Scholar] [CrossRef]
  67. Liu, T.; McConkey, B.; Huffman, T.; Smith, S.; MacGregor, B.; Yemshanov, D.; Kulshreshtha, S. Potential and impacts of renewable energy production from agricultural biomass in Canada. Appl. Energy 2014, 130, 222–229. [Google Scholar] [CrossRef]
  68. Milhau, A.; Fallot, A. Assessing the potentials of agricultural residues for energy: What the CDM experience of India tells us about their availability. Energy Policy 2013, 58, 391–402. [Google Scholar] [CrossRef]
  69. Riva, G.; Foppapedretti, E.; Caralis, C. Handbook on Renewable Energy Sources-Biomass. ENER SUPPLY, 2014, p. 157. Available online: http://www.ener-supply.eu/downloads/ENER_handbook_en.pdf (accessed on 15 July 2021).
  70. Mohammed, Y.S.; Mokhtar, A.S.; Bashir, N.; Saidur, R. An overview of agricultural biomass for decentralized rural energy in Ghana. Renew. Sustain. Energy Rev. 2013, 20, 15–25. [Google Scholar] [CrossRef]
  71. IRENA. Global Bioenergy. Supply and Demand Projections; A Working Paper for RE Map 2030; IRENA: Abu Dhabi, UAE, 2014. [Google Scholar]
  72. Reneta Nafu, Y.; Foba-Tendo, J.; Njeugna, E.; Oliver, G.; Cooke, K.O. Extraction and Characterization of Fibres from the Stalk and Spikelets of Empty Fruit Bunch. J. Appl. Chem. 2015, 2015, 750818. [Google Scholar] [CrossRef] [Green Version]
  73. Elemike, E.E.; Oseghale, O.C.; Okoye, A.C. Utilization of cellulosic cassava waste for bio-ethanol production. J. Environ. Chem. Eng. 2015, 3, 2797–2800. [Google Scholar] [CrossRef]
  74. Smil, V. Crop Residues: Agriculture’s Largest Harvest: Crop residues incorporate more than half of the world’s agricultural phytomass. Bio. Sci. 1999, 49, 299–308. [Google Scholar]
  75. Metzger, R.A.; Benford, G.; Hoffert, M.I. To bury or to burn: Optimum use of crop residues to reduce atmospheric CO2. Clim. Chang. 2002, 54, 369–374. [Google Scholar] [CrossRef]
  76. Gutiérrez, A.S.; Eras, J.J.C.; Hens, L.; Vandecasteele, C. The energy potential of agriculture, agroindustrial, livestock, and slaughterhouse biomass wastes through direct combustion and anaerobic digestion. The case of Colombia. J. Clean. Prod. 2020, 269, 122317. [Google Scholar] [CrossRef]
  77. Gheewala, S.H.; Silalertruksa, T.; Pongpat, P.; Bonnet, S. Biofuel production from sugarcane in Thailand. In Sugarcane Biofuels, 1st ed.; Khan, M.T., Khan, I.A., Eds.; Springer: Cham, Switzerland, 2019; pp. 157–174. [Google Scholar]
  78. Ibrahim, H.A. Pretreatment of straw for bioethanol production. Energy Procedia 2012, 14, 542–551. [Google Scholar] [CrossRef] [Green Version]
  79. IEO (International Energy Outlook). With Projections to 2040; U.S. Energy Information Administration Office of Energy Analysis, Department of Energy: Washington, DC, USA, 2016; p. 290. [Google Scholar]
  80. European Commission. The Road from Paris: Assessing the Implications of the Paris Agreement and Accompanying the Proposal for a Council Decision on the Signing, on Behalf of the EU, of the Paris Agreement Adopted under the UN Framework Convention on Climate Change; European Commission: Brussels, Belgium, 2016. [Google Scholar]
  81. International Energy Agency (IEA). IEA Bioenergy Annual Report; IEA: Paris, France, 2009. [Google Scholar]
  82. Joly, C.; Verdade, L.M. Bioenergy & Sustainability: Bridging the Gaps; SCOPE: Paris, France, 2015. [Google Scholar]
  83. SanzRequena, J.F.; Guimaraes, A.C.; QuirósAlpera, S.; ReleaGangas, E.; Hernandez- Navarro, S.; NavasGracia, L.M.; Martin-Gil, J.; Fresneda Cuesta, H. Life Cycle Assessment (LCA) of the biofuel production process from sunflower oil, rapeseed oil, and soybean oil. Fuel Process. Technol. 2011, 92, 190–199. [Google Scholar] [CrossRef]
  84. Prasad, S.; Singh, A.; Korres, N.E.; Rathore, D.; Sevda, S.; Pant, D. Sustainable utilization of crop residues for energy generation: A life cycle assessment (LCA) perspective. Bioresour. Technol. 2020, 303, 122964. [Google Scholar] [CrossRef] [PubMed]
  85. Hanaki, K.; Portugal-Pereira, J. Effect of Biofuel Production on Greenhouse Gas Emission Reductions. In Biofuels and Sustainability; Takeuchi, K., Shiroyama, H., Saito, O., Matsuura, M., Eds.; Science for Sustainable Societies; Springer: Tokyo, Japan, 2018; pp. 53–71. [Google Scholar]
  86. Shafie, S.M.; Masjuki, H.H.; Mahlia, T.M.I. Life cycle assessment of rice strawbased power generation in Malaysia. Energy 2014, 70, 401–410. [Google Scholar] [CrossRef]
  87. Tonini, D.; Hamelin, L.; Alvarado-Morales, M.; Astrup, T.F. GHG emission factors for bioelectricity, biomethane, and bioethanol quantified for 24 biomass substrates with consequential life-cycle assessment. Bioresour. Technol. 2016, 208, 123–133. [Google Scholar] [CrossRef] [PubMed] [Green Version]
  88. Sanscartier, D.; Dias, G.; Deen, B.; Dadfar, H.; McDonald, I.; MacLean, H.L. Life cycle greenhouse gas emissions of electricity generation from corn cobs in Ontario, Canada. Biofuels Bioprod. Biorefin. 2014, 8, 568–578. [Google Scholar] [CrossRef]
  89. Cherubini, F.; Jungmeier, G. LCA of a biorefinery concept producing bioethanol, bioenergy, and chemicals from switchgrass. Int. J. Life Cycle Assess. 2009, 5, 53–66. [Google Scholar] [CrossRef]
  90. Hiloidhari, M.; Baruah, D.C.; Singh, A.; Kataki, S.; Medhi, K.; Kumari, S.; Ramachandra, T.V.; Jenkins, B.M.; Thakur, I.S. Emerging role of Geographical Information System (GIS), Life Cycle Assessment (LCA), and spatial LCA (GIS-LCA) in sustainable bioenergy planning. Bioresour. Technol. 2017, 242, 218–226. [Google Scholar] [CrossRef] [PubMed]
  91. United Nations General Assembly. Report of the World Commission on Environment and Development: Our Common Future; United Nations General Assembly, Development and International Co-operation: Environment: Oslo, Norway, 1987. [Google Scholar]
  92. Working Group for Sustainable Biomass Utilisation Vision in East Asia. Sustainable Biomass Utilisation Vision in East Asia, ERIA Research Project Report 2007–6-3. In Sustainability and Biomass Utilisation; Sagisaka, M., Ed.; IDE-JETRO: Chiba, Japan, 2008; pp. 23–37. [Google Scholar]
  93. Kasmaprapruet, S.; Paengjuntuek, W.; Saikhwan, P.; Phungrassami, H. Life cycle assessment of milled rice production: Case study in Thailand. Eur. J. Sci Res. 2009, 30, 195–203. [Google Scholar]
  94. Jensen, A.A. Life Cycle Assessment (LCA): A Guide to Approaches, Experiences and Information Sources (No. 6); European Communities: Maastricht, The Netherlands, 1998. [Google Scholar]
  95. Rathore, D.; Pant, D.; Singh, A. A comparison of life cycle assessment studies of different biofuels. In Life Cycle Assessment of Renewable Energy Sources; Green Energy and Technology Series; Singh, A., Pant, D., Olsen, S.I., Eds.; Springer: London, UK, 2013. [Google Scholar]
  96. Chan, Y.H.; Cheah, K.W.; How, B.S.; Loy, A.C.M.; Shahbaz, M.; Singh, H.K.G.; Yusuf, N.R.; Shuhaili, A.F.A.; Yusup, S.; Ghani, W.A.W.A.K.; et al. An overview of biomass thermochemical conversion technologies in Malaysia. Sci. Total Environ. 2019, 680, 105–123. [Google Scholar] [CrossRef] [PubMed]
  97. Wei-Hua, Y.; Sheng-nan, Z.; Tao, X.; Kan-hong, W. CO2 emission reduction and energy recovery from straw cogeneration project. In Bioinformatics and Biomedical Engineering; Springer: Cham, Switzerland, 2009. [Google Scholar]
  98. Martin, M.; Frida Røyne, I.D.; Ekvall, T.; Moberg, Å. Life cycle sustainability evaluations of bio-based value chains: Reviewing the indicators from a Swedish perspective. Sustainability 2018, 10, 547. [Google Scholar] [CrossRef] [Green Version]
  99. Kloepffer, W. Life cycle sustainability assessment of products. Int. J. Life Cycle Assess. 2008, 13, 89–94. [Google Scholar] [CrossRef]
Figure 1. Map of study area.
Sustainability 14 01434 g001
Figure 2. Quantity of crop straw produced from 2017 to 2019 in the three regions. G’nut = Groundnut; SE = Standard Error.
Sustainability 14 01434 g002
Figure 3. Map of Northern region.
Sustainability 14 01434 g003
Figure 4. Map of North East region.
Sustainability 14 01434 g004
Figure 5. Map of Savannah Region.
Sustainability 14 01434 g005
Figure 6. Comparison of the annual technical and theoretical straw yield (2017 to 2019). G’nut = Groundnut; SE = Standard Error.
Sustainability 14 01434 g006
Figure 7. Comparison of the energy potential of the crop straws. G’nut = Groundnut.
Sustainability 14 01434 g007
Table 1. Average quantity of crop straws produced in all three regions.
DistrictCrop Straw (tonnes)Percentage (%)DistrictCrop Straw (tonnes)Percentage (%)
Kpandai238,9216.0Tatale Sanguli214,3575.4
Gushiegu139,0373.5Zabzugu201,7835.1
Karaga110,0672.8Bunkpurugu–Yunyoo88,4012.2
Nanumba North300,4957.6East Mamprusi97,7982.5
Nanumba South261,9556.6Chereponi62,7691.6
Saboba102,7542.6West Mamprusi169,4904.3
Savelugu
and Nanton
242,4316.1Mamprugu Moagduri79,5562.0
Tamale Metro113,7532.9Bole105,4672.7
Sagnerigu33,6830.8Central Gonja89,5542.3
Tolon204,9405.2East Gonja and North East Gonja252,3906.4
Kumbungu60,3271.5Sawla–Tuna–Kalba100,9822.5
Yendi233,6155.9West Gonja247,5626.2
Mion175,9984.4North Gonja36,6980.9
Table 2. Annual production for major crop straw in the Northern region from 2017 to 2019 (tonnes).
DistrictMaize StrawRice StrawMillet StrawSorghum StrawCassava StrawYam StrawG’nut * StrawCowpea StrawSoybean Straw
Kpandai4809520627014,36933,533143,6539962219024,930
Gushiegu21,21712,0667464957221,06314,17721,149659125,738
Karaga21,48312,61268759203326910,99014,482456926,582
Nanumba North28,6765205498913,36048,348143,71517,179301036,015
Nanumba South19,3804884258019,78553,658124,47112,143914415,910
Saboba82613452769712,807182437,27714,083385713,496
Savelugu and Nanton41,43436,92030016771583547,48850,13917,22833,616
Tamale Metro25,07529,03018926174308430,120822474812,808
Sagnerigu16,022642815516236121456180816113968
Tolon44,98933,091529211,22220,38132,97720,36511,12425,500
Kumbungu16,13419,7502573505927154671278813295308
Yendi23,05525,32510,599985219,85255,93030,29813,44245,261
Mion17,47425,789715115,798833327,61020,127868045,035
Tatale
Sanguli
14,16111,953961711,30319,31182,91257,24430594795
Zabzugu17,940763517,31013,84817,729102,42019,99718673038
Total320,113239,34587,465160,746259,546859,868292,58492,450322,000
* G’nut = Groundnut.
Table 3. Annual production for major crop straw in the North East region from 2017 to 2019 (tonnes).
DistrictMaize StrawRice StrawMillet StrawSorghum StrawCassava StrawYam StrawG’nut * StrawCowpea StrawSoybean Straw
Bunkpurugu–Yunyoo7345143010,68010,3512170422310,65014,57126,982
East Mamprusi898711,05216,64196222075439014,448924221,340
Chereponi10,134555136283900134157923831331825,274
West Mamprusi27,83526,13711,97118,710198213,45841,363389624,139
Mamprugu Moagduri21,167563032043641198998230,44310,9431557
Total75,46749,79946,12446,225955728,843100,73541,97099,292
* G’nut = Groundnut.
Table 4. Annual production for major crop straw in the Savannah region from 2017 to 2019 (tonnes).
DistrictMaize StrawRice StrawMillet StrawSorghum StrawCassava StrawYam Straw G’nut * StrawCowpea StrawSoybean Straw
Bole21,19826231533879413,88043,833693322604412
Central Gonja15,66111,343786186511,32627,92714,13419174595
East Gonja and North East Gonja20,80918,7132405137130,674137,36123,351479712,910
Sawla–Tuna–Kalba23,821512412,47817,8875105852618,77955453717
West Gonja30,115498828767324100,54461,15020,305816412,096
North Gonja10,6433171877110839632400841410875036
Total122,24745,96220,95538,349165,492281,19791,91723,76942,766
* G’nut = Groundnut.
Table 5. Annual technical straw production in the Northern region from 2017 to 2019 (tonnes).
DistrictMaize StrawRice StrawMillet StrawSorghum StrawCassava StrawYam Straw G’nut * StrawCowpea StrawSoybean Straw
Kpandai4074183021611,49510,601114,9229962219019,944
Gushiegu17,974424259717658665911,34121,149659120,591
Karaga18,1994434550073631033879214,482456921,266
Nanumba North24,3381830399110,68815,284114,97217,179301028,812
Nanumba South16,4171717206415,82816,96399,57712,143914412,728
Saboba72191214615810,24557729,82214,083385710,796
Savelugu and Nanton35,10012,98024015417184537,99050,13917,22830,210
Tamale Metro21,24210,2061514493997524,096822474810,247
Sagnerigu13,572226012412981941165180816113174
Tolon38,11111,63442338977644326,38220,36511,12420,400
Kumbungu13,6686943205940478583737278813294246
Yendi19,531890384797882627644,74430,29813,44236,209
Mion14,8039066572112,639263422,08820,127868036,028
Tatale Sanguli11,996420276949043610566,33057,24430593836
Zabzugu15,197268413,84811,078560581,93619,99718672430
Total271,43984,14569,972128,59782,050687,895292,58492,450260,918
* G’nut = Groundnut.
Table 6. Annual technical straw production in the North East region from 2017 to 2019 (tonnes).
DistrictMaize StrawRice StrawMillet StrawSorghum StrawCassava StrawYam Straw G’nut * StrawCowpea StrawSoybean Straw
Bunkpurugu–Yunyoo622250385448281686337810,65014,57121,585
East Mamprusi7613388513,3137698656351214,448924217,072
Chereponi858419522903312042446333831331820,219
West Mamprusi23,5799189957714,96862710,76641,363389619,311
Mamprugu Moagduri17,93119792563291362978530,44310,9431246
Total63,92917,50836,90036,980302123,075100,73541,97079,433
* G’nut = Groundnut.
Table 7. Annual technical straw production in the Savannah region from 2017 to 2019 (tonnes).
DistrictMaize StrawRice StrawMillet StrawSorghum StrawCassava StrawYam StrawG’nut * StrawCowpea StrawSoybean Straw
Bole17,95792212267035438835,067693322603530
Central Gonja13,26739886291492358122,34114,13419173676
East Gonja and North East Gonja17,6276579192410979697109,88923,351479710,328
Sawla–Tuna–Kalba20,1791801998214,3091614682118,77955452974
West Gonja25,51117532301585931,78548,92020,30581649677
North Gonja9016111570288612531920841410874029
Total103,55716,15916,76430,67952,317224,95891,91723,76934,213
* G’nut = Groundnut.
Table 8. Annual energy potential of crop straws in the Northern region (TJ).
DistrictMaize StrawRice StrawMillet StrawSorghum StrawCassava StrawYam StrawG’nut * StrawCowpea StrawSoybean Straw
Kpandai5327316697170915629288
Gushiegu23464791116116933188297
Karaga2366773106913122761307
Nanumba North3162753154140171026940416
Nanumba South21326272291551481190122184
Saboba951881148544422152156
Savelugu
and Nanton
456195327817565786231436
Tamale Metro276153207193581364148
Sagnerigu17634219217282246
Tolon4951755613059392319149295
Kumbungu1781042758856441861
Yendi25413411211457666475180523
Mion1921367518324329315116520
Tatale Sanguli15663101131569879044155
Zabzugu197401831605112193132535
Total35281262922185875110,232459212383768
* G’nut = Groundnut.
Table 9. Annual energy potential of crop straws in the North East region (TJ).
DistrictMaize StrawRice StrawMillet StrawSorghum StrawCassava StrawYam StrawG’nut * StrawCowpea StrawSoybean Straw
Bunkpurugu–Yunyoo818113120650167195312
East Mamprusi9958176111652226124247
Chereponi1122938454696044292
West Mamprusi306138126216616064852279
Mamprugu Moagduri23330344261247714718
Total8312634865342834315795621147
* G’nut = Groundnut.
Table 10. Annual energy potential of crop straws in the Savannah region (TJ).
DistrictMaize StrawRice StrawMillet StrawSorghum StrawCassava StrawYam StrawG’nut * StrawCowpea StrawSoybean Straw
Bole2331416102405221093051
Central Gonja17260822333322212653
East Gonja and North East Gonja22999251689163536664149
Sawla–Tuna–Kalba26227132207151012947443
West Gonja331263085291728318109140
North Gonja1171791311291321558
Total134524222144347933461440318494
* G’nut = Groundnut.
Publisher’s Note: MDPI stays neutral with regard to jurisdictional claims in published maps and institutional affiliations.

