Article

Water Demand in Maize Is Projected to Decrease under Changing Climate in India

by
Santanu Kumar Bal
1,
Malamal Alickal Sarath Chandran
1,*,
Sandeep Vadakkemethel Madhavan
1,
Abburi Venkata Maruthi Subba Rao
1,
Narayanan Manikandan
1,
Ramagiri Praveen Kumar
1,
Pramod Valiyaparambil Parameswaran
1,
Shiv Dev Attri
2,
Priyanka Singh
2,
Ashutosh Mohanty
3,* and
Vinod Kumar Singh
1
1
ICAR-Central Research Institute for Dryland Agriculture, Hyderabad 500059, India
2
India Meteorological Department, Lodhi Road, New Delhi 110003, India
3
Faculty of Science and Technology, Madhyanchal Professional University, R&D Cell, Ratibad, Bhopal 462044, Madhya Pradesh, India
*
Authors to whom correspondence should be addressed.
Sustainability 2022, 14(3), 1419; https://doi.org/10.3390/su14031419
Submission received: 12 November 2021 / Revised: 11 January 2022 / Accepted: 19 January 2022 / Published: 26 January 2022
(This article belongs to the Special Issue Impact of Indo-Pacific Climate Variability)

Abstract

:
Crop stage-specific information on the impacts of projected climate change on crop and irrigation water requirements are essential for improving productivity. This study investigated the possible implications of projected climate change on the phenology, effective rainfall (Peff), crop (CWR) and irrigation water requirements (IWR) of maize in eight locations in India. CWR, Peff and IWR were estimated for seven crop stages viz., emergence, 5th leaf stage, tasseling, silking, milking, dough and maturity during the baseline (1980–2009) and near-century (2022–39) using climate data derived from a subset of 29 general circulation models. The results indicated that mean seasonal maximum temperature, minimum temperature and rainfall were projected to increase in all the locations. Hence, the total crop duration (3–7 days), CWR (8–69 mm) and IWR (1–54 mm) were projected to decrease. The study could identify the specific stages in which the greatest reduction in crop duration, CWR and IWR would occur. Such information will be of immense help to farmers and varietal improvement programs in the study regions in the near future.

1. Introduction

Water availability is critical for human settlement, agriculture production, and animal husbandry. Population growth, industrialization, and urbanization have all resulted in the increased use of water resources over the centuries. Due to these factors, the worldwide water demand has increased at a rate of 1% each year since 1980 [1]. Because of industrial and domestic needs, global water usage would grow by 20–30%, putting more than 2 billion people in high water stress and over 4 billion people in severe water scarcity for at least a month each year. Simultaneously, the United Nations’ Sustainable Development Goal-6 aims to ensure the availability and long-term management of water resources for all people everywhere [2].
In India, almost 81% of water resources are utilized by agriculture [3]. A rise in temperature as a result of global warming necessitates additional water for agriculture in order to meet crop evapotranspiration requirements [4,5]. The global mean surface temperature increased by 0.8–1.3 °C between 1850 and 1900 and from 2000 to 2019, while global surface temperature is expected to continue to rise until the mid-21st century [6]. Under all potential greenhouse gas emission scenarios in the near term, i.e., 2021–2040, the surface temperature rise would most likely be between 1 and 1.6 °C. On the other hand, as the temperature rises, crop phenology/duration will decrease/shorten [7,8,9,10,11,12,13], reducing irrigation frequency and water consumption [14,15]. As a result, a full understanding of the interactions between climate change, crop phenology, and crop water demands is critical at this time to ensure sustainable use of irrigation resources.
The area under maize cultivation in India has expanded from 6.61 million hectares in 2000-01 to 9.03 million hectares in 2018-19 [16], owing to prospects in the cattle and poultry feed industries as well as a shift in maize consumption patterns in the country. The total maize production of India in 2018-19 was 27.8 MT [17] and is projected to increase to 121 MT to meet demand in 2050 [18]. During the kharif (June–September) season, over 83 percent of maize is cultivated under rainfed conditions, while 17 percent is planted under assured irrigation during the rabi (post-rainy season) season [19]. Due to the significant variability of monsoon rainfall and the frequency of intra-seasonal dry spells, kharif maize productivity in India is lower than rabi maize productivity. Hence, research on irrigation water management in rainfed maize to increase water use efficiency is relevant. Most of the previous studies on crop water requirements in rainfed maize are confined to seasonal water requirement. No studies have been reported so far on how crop and irrigation water requirements will be affected during different growth stages of maize under projected climate change in India.
The objective of the study was to quantify the impact of projected climate change on the phenology, crop and irrigation water requirements of maize, spatially and temporally in India. Furthermore, we have tried to identify the critical stages of crop growth during which major changes in crop and irrigation water requirements are expected in the near future. The null-hypothesis of the work was ‘the crop and irrigation water requirements of maize will increase under the projected climate change of the near future’.

2. Materials and Methods

2.1. Study Locations

Eight locations, spread across three states in India were selected for the study to cover diverse climatic conditions, soil types and crop duration. A brief description of the study locations is given in Table 1.

2.2. Collection of Crop Data

Field experimental data on maize was provided by a network of Agromet Field Units/District Agromet Units under Gramin Krishi Mausam Sewa project network of India Meteorological Department (IMD) in coordination with ICAR & State Agricultural Universities (SAUs). The data mainly consisted of information on crop phenology, date of sowing etc. These data were used to estimate crop growth stage-specific accumulated growing degree days. More details regarding the data collected are presented in Supplementary Table S1. This was used to predict the duration of phenological stages under the projected climate.

2.3. Weather Data–Baseline and Projected

2.3.1. Baseline Climate Data

The daily rainfall, maximum temperature (Tmax) and minimum temperature (Tmin) of the study locations during 1980–2009 were collected from IMD, Pune website [20]. The rainfall data have a spatial resolution of 0.25° × 0.25° [21] while the Tmax and Tmin data have a spatial resolution of 1° × 1° [22].

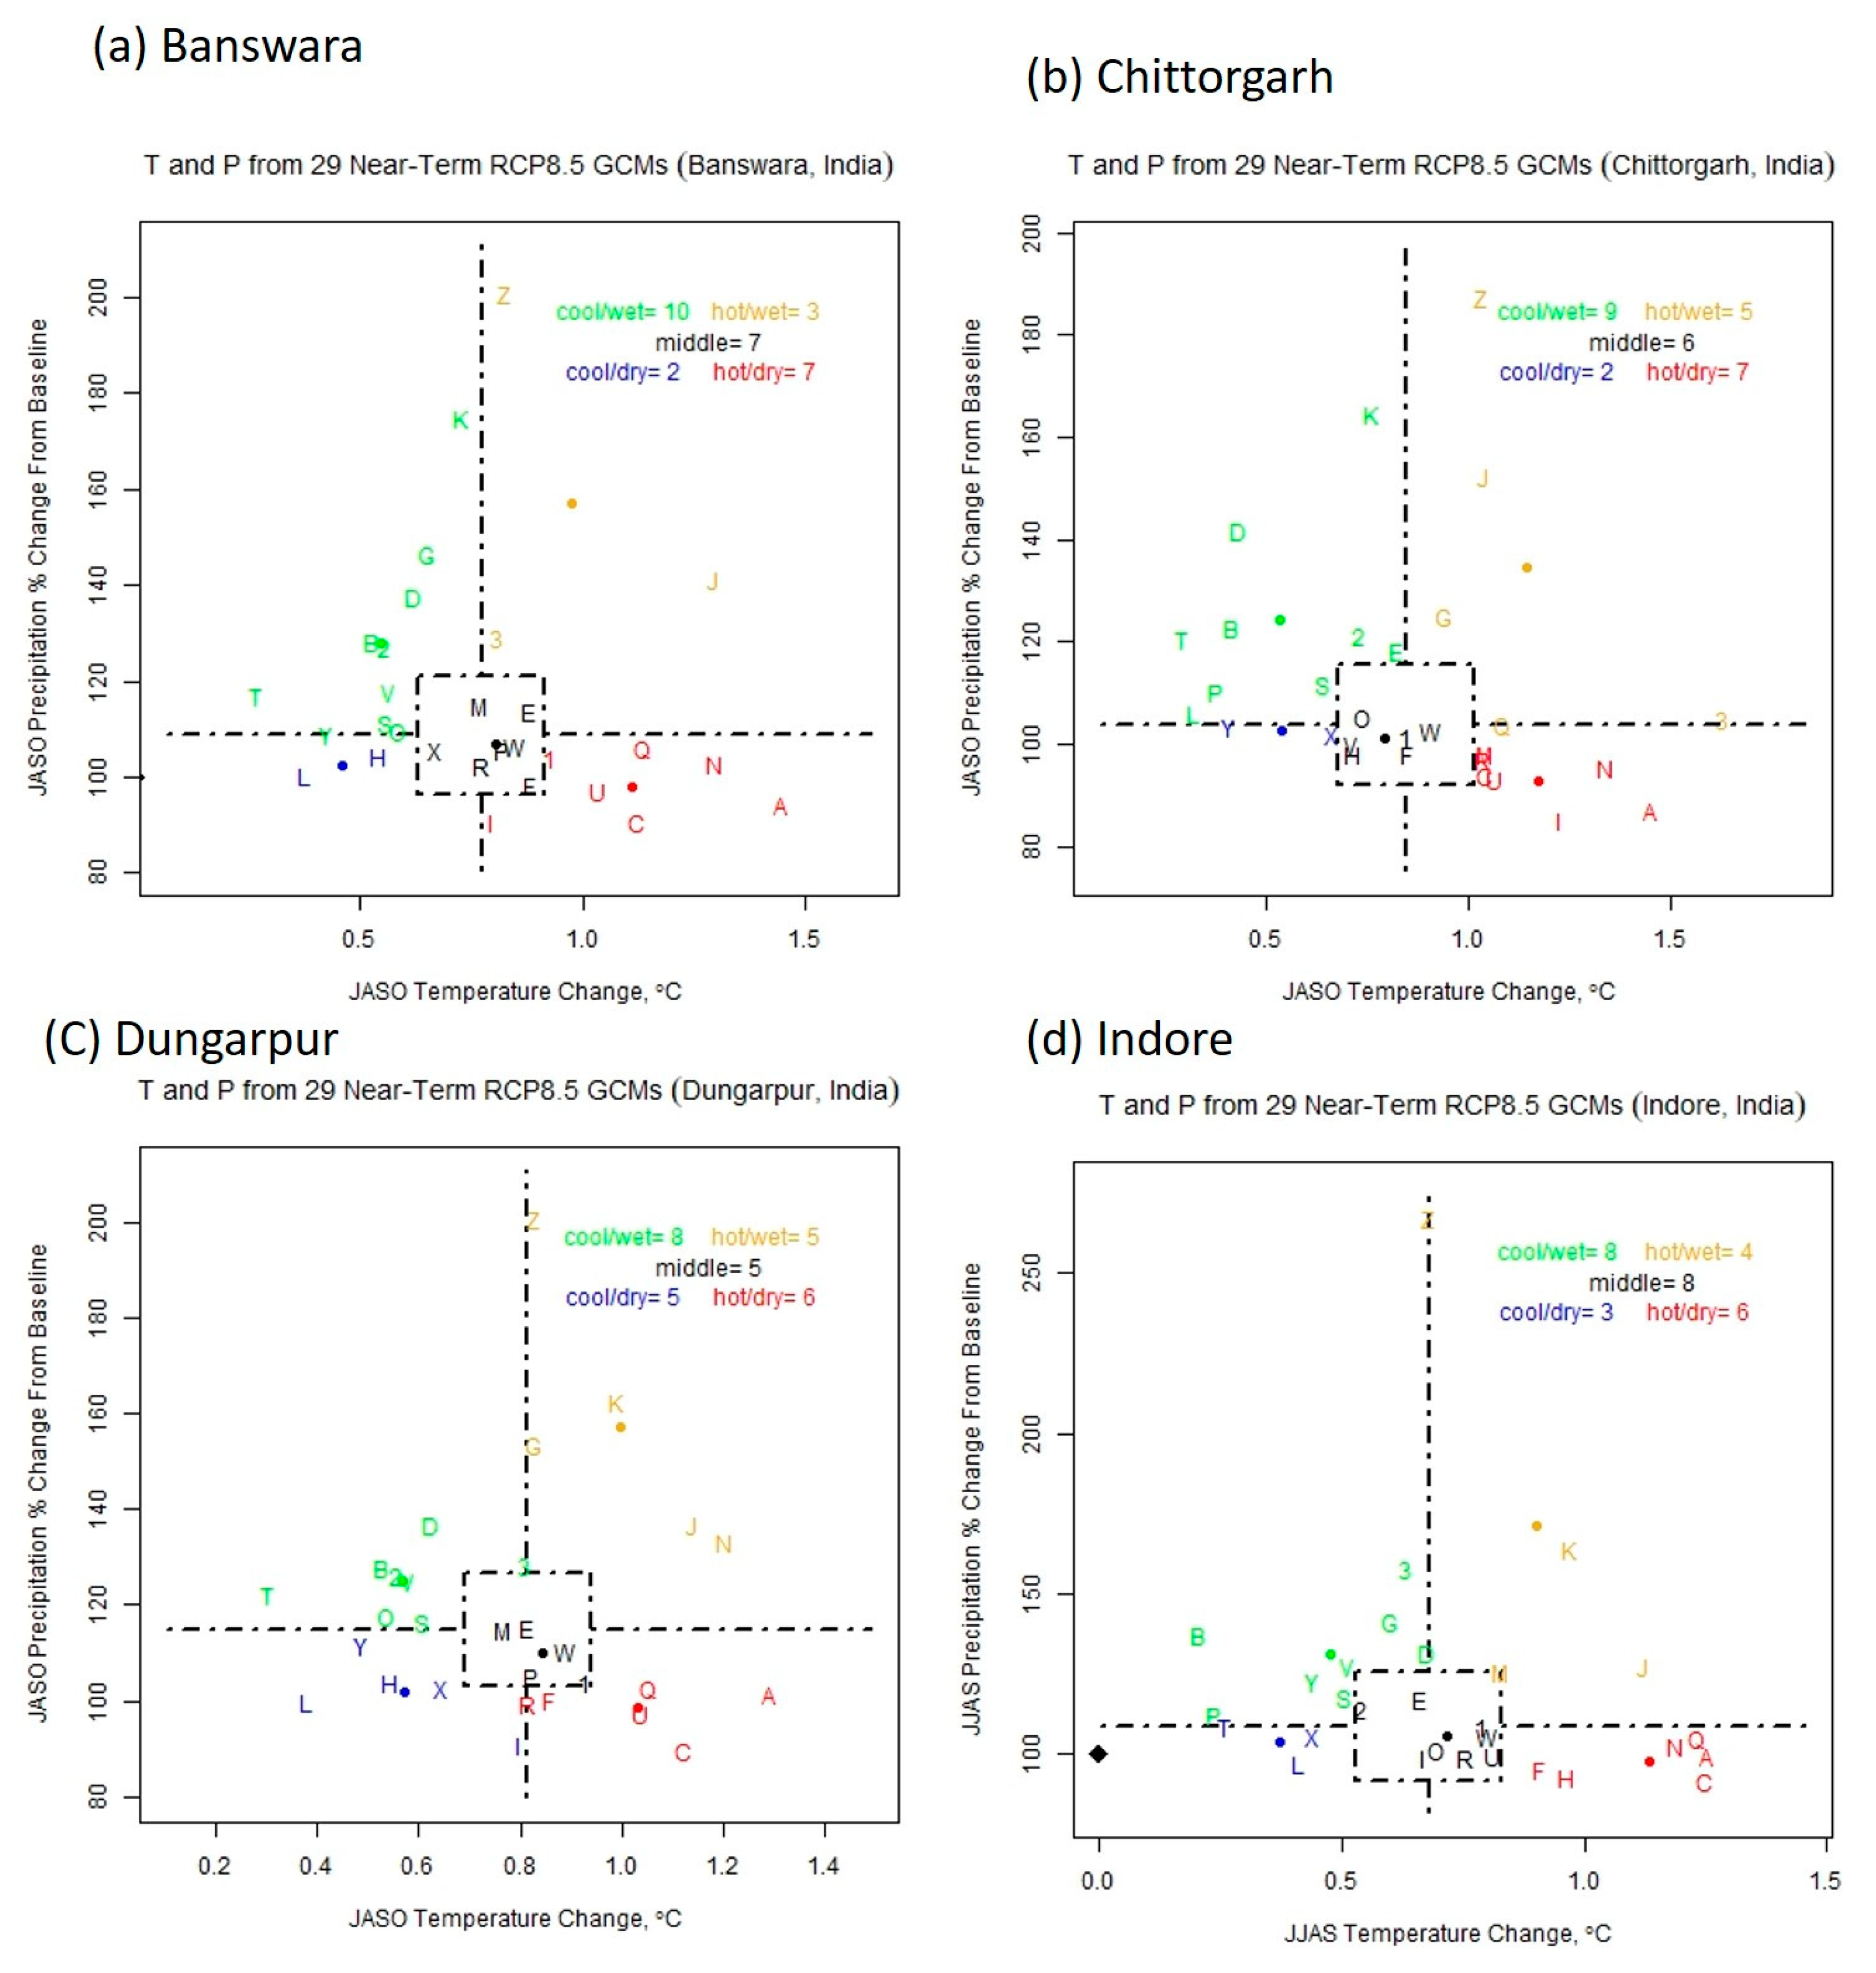
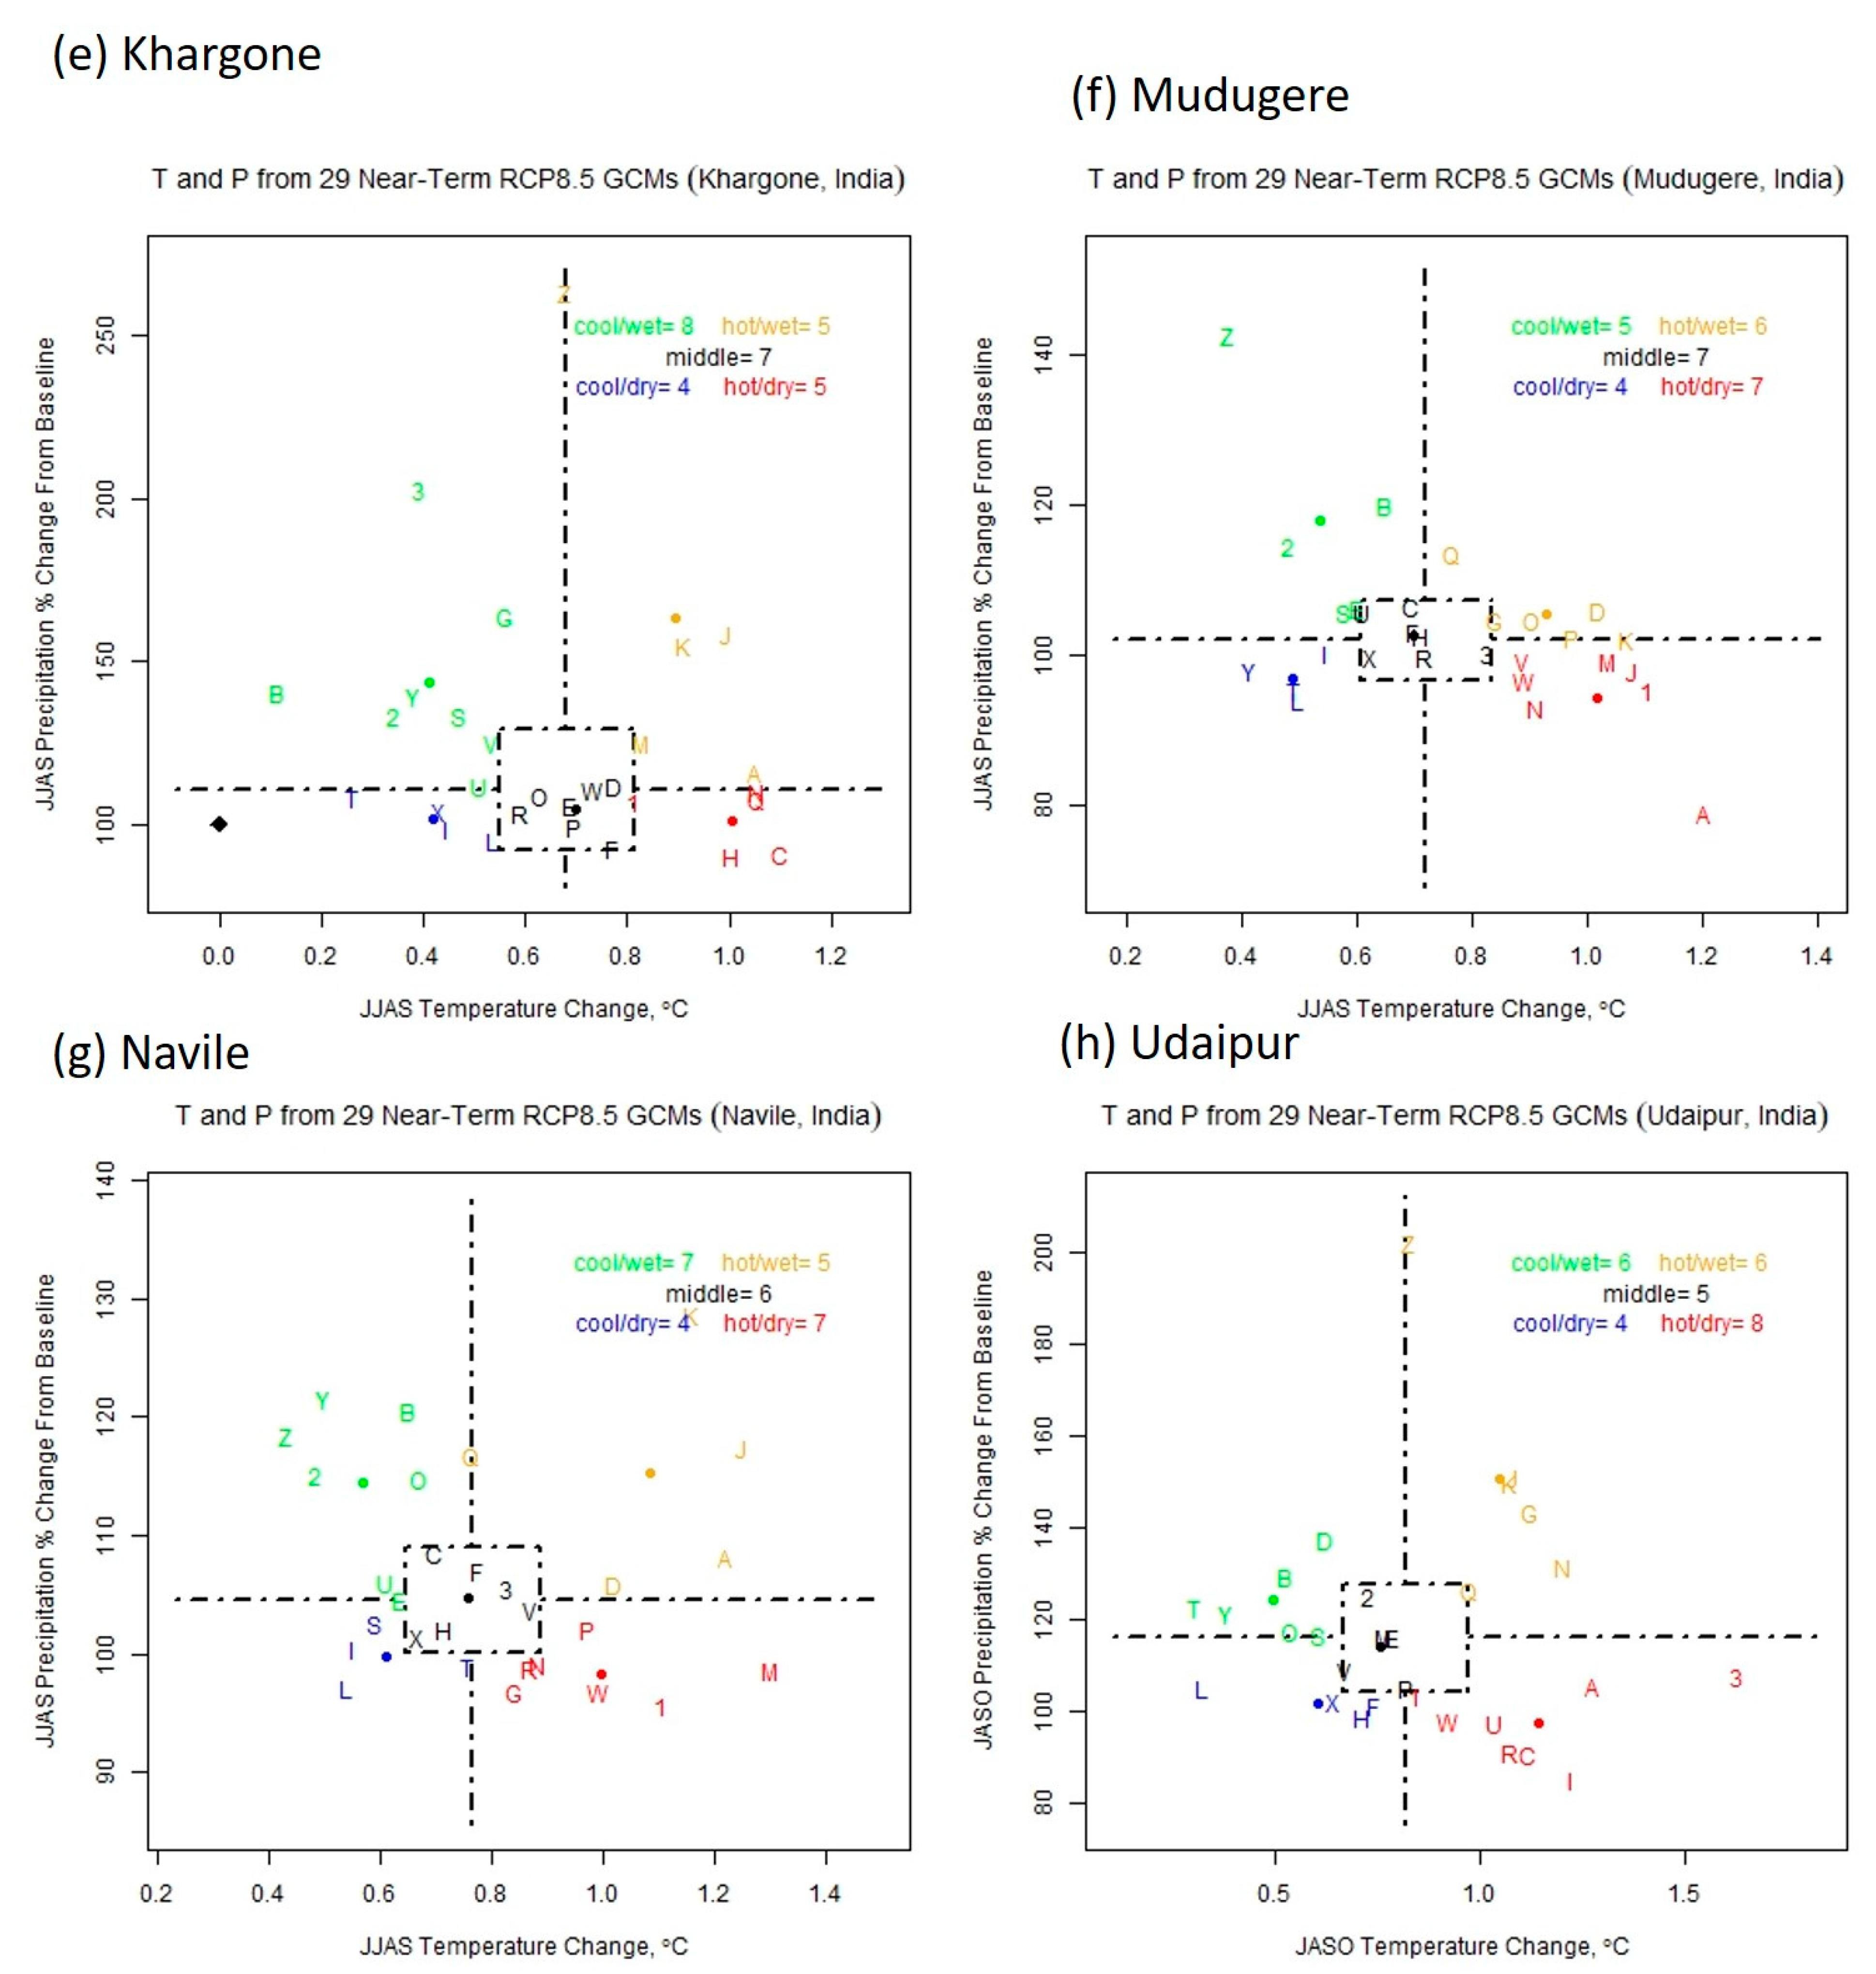
2.3.2. Projected Climate Data

The projected climate data for the study locations were derived using 29 general circulation models (GCMs) from a fifth coupled model inter-comparison project (CMIP-5) (Table 2). Using the ‘Representative Temperature and Precipitation (T&P) GCM Sub setting Approach’ [23], 5 GCMs were chosen from a pool of 29 GCMs for this investigation. In this method, 29 GCMs were classified into five quadrants based on their divergence from the ensemble median in temperature and rainfall. Figure 1a–h depicts the five quadrants of 29 GCMs obtained for the study locations. The GCM with the projected change in temperature and rainfall closest to the quadrant’s median was chosen for each location (Table 3). ‘Empirical quantile mapping’ was used to correct the bias of the selected GCMs. For downscaling, it uses empirical cumulative distributions of observed and modelled precipitation. GCM simulated values were ’mapped’ onto historical observed data by quantile, and each simulated quantile value was adjusted separately. Monthly mean maximum and minimum temperatures, precipitation, daily maximum and minimum temperature standard deviations, the number of wet days, and the shape of the rainfall distribution were all adjusted. The historical time series was stretched in this way to mimic future projections where the mean and variability had changed.

2.4. Computation of Crop and Irrigation Water Requirement

2.4.1. Estimation of Sowing Time

In India, farmers generally sow during kharif season (June-September) after the onset of the southwest monsoon. This ensures enough soil moisture for germination and crop establishment. The amount of available soil moisture is determined by the texture and structure of the soil and the amount of rainfall received, among other factors. Estimation of daily soil water balance is a popular method of estimating soil moisture. Here, we have used the daily water balance model proposed by Robinson and Hubbard [24]. The model uses soil water balance Equation (1) as an input to determine soil water in the root zone (S) from a value one day before (S0), precipitation (p), irrigation (I), evapotranspiration (ET), runoff (R0), and drainage below the root zone (Dr).
S = S 0 + p + I E T R 0 D  
In this equation, evapotranspiration was estimated using the Penman-Monteith equation. The difference between the volumetric percentage of water at wilting point and at field capacity was used to estimate the potential available water for crop use. Within a fixed, user-defined sowing window, the optimum sowing date was determined when the soil moisture became equal to or more than a proportion of the available water in the soil (i.e., available soil water multiplied by a factor known as the soil moisture threshold). The value of the soil moisture threshold (F) was assumed to be 0.5, as mentioned in [24]. As the soil water level reached wilting point, this factor (F) was used to limit crop water use. The available water in the soil was calculated by the difference in moisture content at field capacity and permanent wilting point. Hence, whenever the criteria for sowing are met within the sowing window, that particular date was selected as the sowing date. More details regarding estimation of sowing time can be obtained from [25].

2.4.2. Estimation of Crop Phenology

Once the optimum sowing date was identified, the subsequent crop growth stages were identified based on thermal time concept [26,27]. For this, field experimental data of rainfed maize in the study locations were collected to estimate the average accumulated growing degree days (AGDD) required to achieve each growth stage. Based on these AGDD values, the crop phenology of rainfed maize (emergence, 5th leaf stage, tasseling, silking, milking, dough and maturity) was estimated during the baseline (1980–2009) and near-century (2022–39) under RCP4.5 and RCP8.5 emission scenarios.

2.4.3. Estimation of Crop and Irrigation Water Requirements

The crop water requirement (CWR) is the total amount of water needed to compensate for evapotranspiration loss from a cultivated field under well-managed conditions, such as when there is no water, fertilizer, or insect stress [28]. Any abiotic stress (mainly drought, dry spells etc.) will negatively affect the production of biomass and hence yield [29].
The crop-specific water requirement was calculated by multiplying the stage specific crop coefficient parameter (Kc) with the reference evapotranspiration (ET0) at different maize growing stages, hence Equation (2):
C W R = E T 0     K c  
The Kc values were taken from FAO-56 [30]. CWR was estimated for each of the phenological stages of the crop during the baseline and near-century.
The IWR is the quantity of water needed to meet the CWR in addition to what is received through rainfall. Since all the rainfall that occurs in the field will not be available to the crop, the concept of effective rainfall (Peff) was considered in this study.
The Peff is the proportion of total precipitation (P) that is directly available to crops and does not run off. The Peff’s variation is influenced by a number of things. The key factors include precipitation characteristics, soil parameters, crop evapotranspiration rates, and irrigation management. In this study, we have used the soil conservation method of United States Department of Agriculture (USDA) to estimate Peff using the following Equations (3) and (4):
P e f f = P   ( 4.17 0.2 P ) 4.17   f o r   P < 8.2   mm  
P e f f = 4.17 + 0.1 P   f o r   P   8.2   mm  
Irrigation water requirement (IWR) was calculated using Equation (5):
I W R = ( K c   E T 0 ) P e f f   i f   ( K c   E T 0 ) > P e f f ;   o t h e r w i s e   I W R = 0      

2.5. Impact of Projected Climate on Phenology, Crop and Irrigation Water Requirement

The projected changes in seasonal rainfall during the near-century under RCP4.5 and RCP8.5 compared to that of the baseline was estimated using Equation (6):
P e r   c e n t   c h a n g e   i n   s e a s o n a l   r a i n f a l l        = [ ( W e i g h t e d   e n s e m b l e   G C M   m e a n B a s e l i n e   m e a n ) B a s e l i n e   m e a n ]        100
For maximum and minimum temperature, the absolute difference from the mean baseline of Tmax and Tmin was taken. Similarly, the changes in crop phenology, CWR and IWR under the projected climate were estimated in absolute terms (i.e., the difference between the durations/CWR/IWR of crop stages in the future and that of the baseline).
For simulation with future climate data, five GCM outputs were used. Hence, for each study location, there were five outputs for phenology, CWR and IWR during near-century-RCP4.5 and another five during near-century-RCP8.5. To combine this into a single output, the weighted average ensemble technique [31] was used via the following Equation (7):
W e i g h t e d   a v e r a g e   e n s e m b l e = X c o o l / w e t   n 1 + X h o t w e t n 2 + X h o t d r y n 3 + X c o o l d r y n 4 + X m i d d l e n 5 29
where X can be phenology, CWR or IWR; n1, n2, n3, n4 and n5 were the number of GCMs in cool/wet, hot/wet, hot/dry, cool/dry and middle quadrants respectively for each of the study locations; 29 was the total number of GCMs used in the study.

3. Results

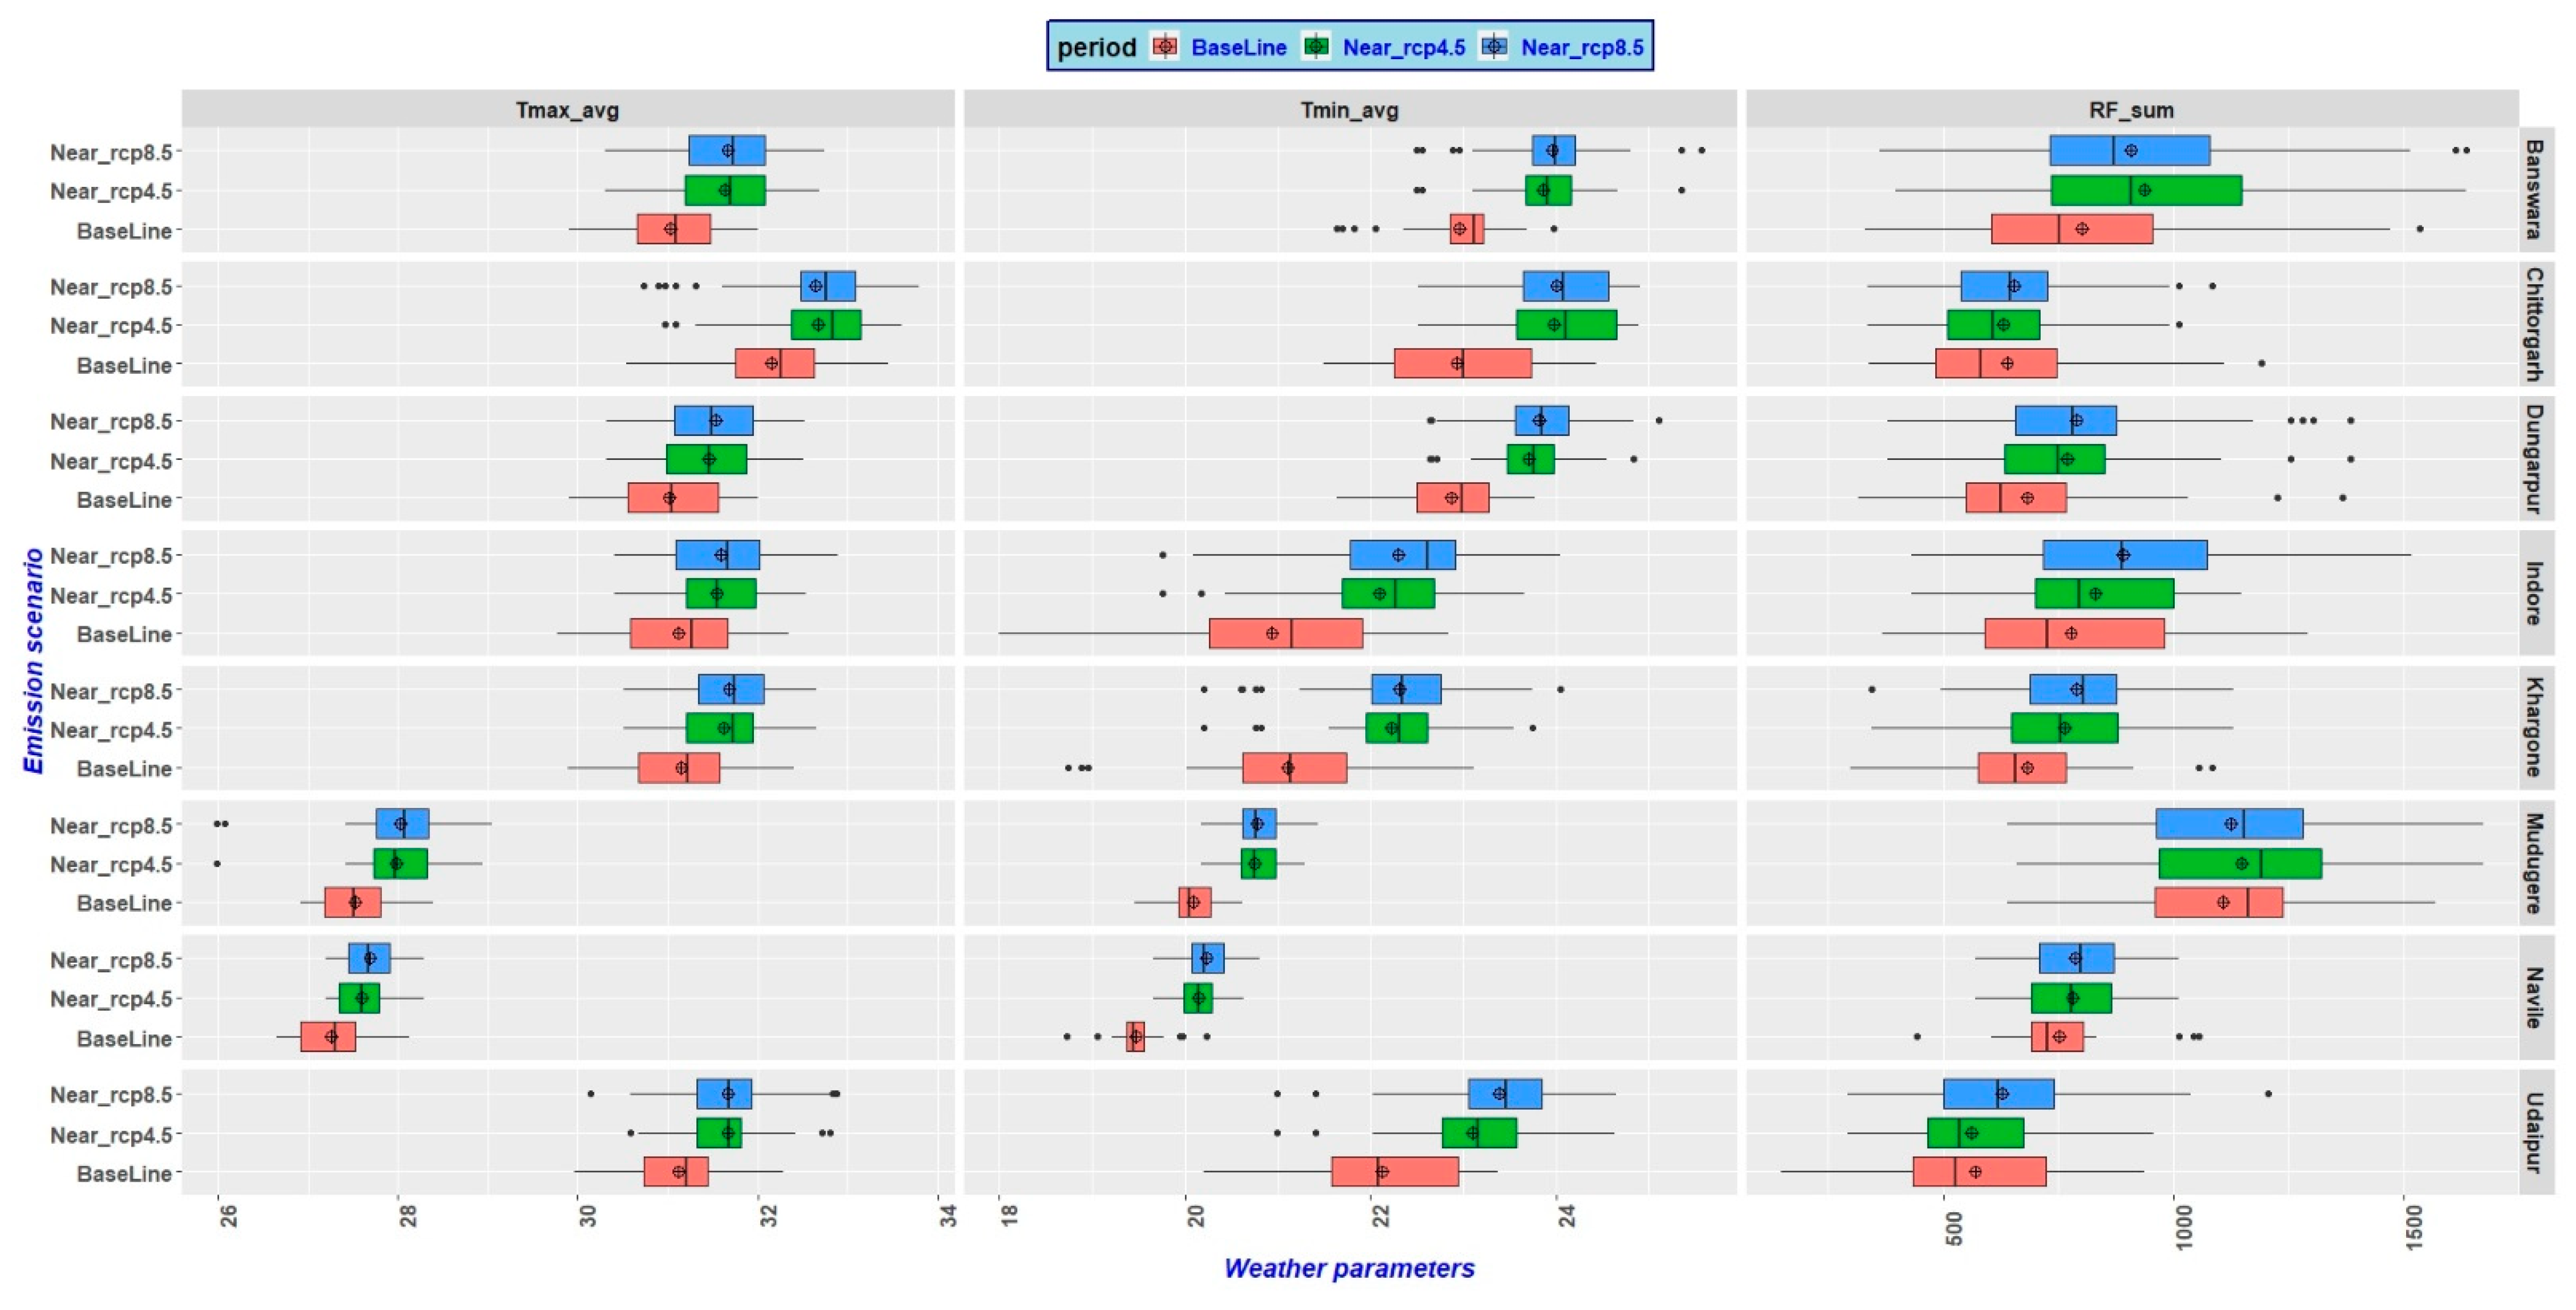
3.1. Projected Climate

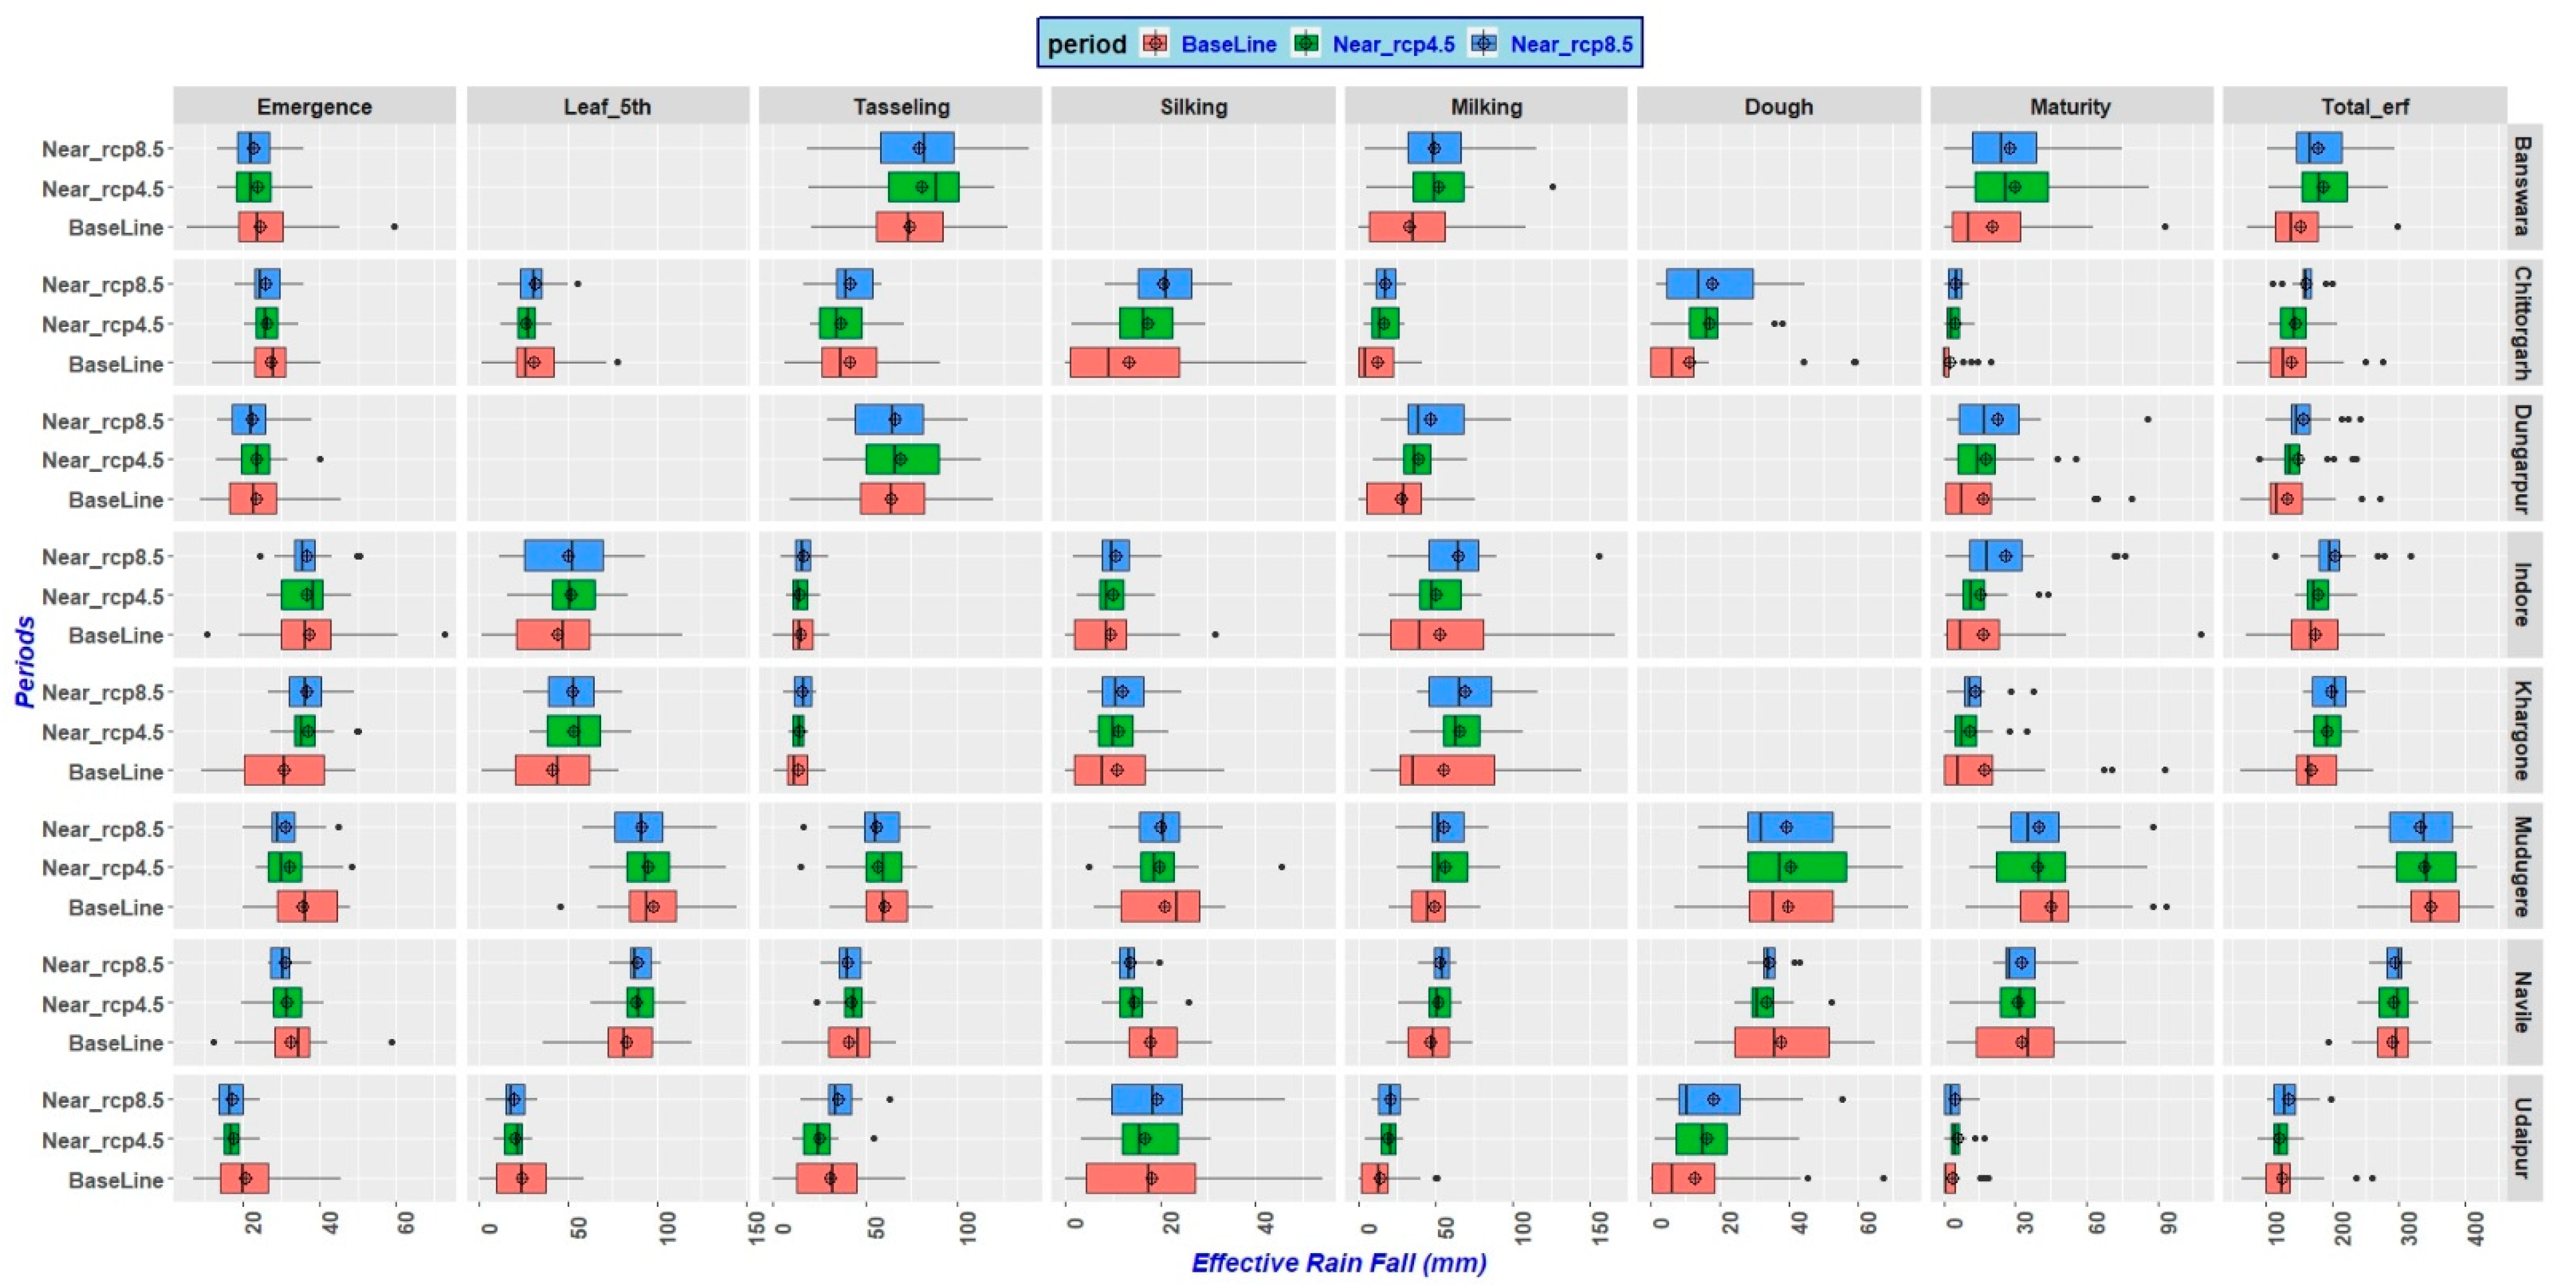
3.1.1. Seasonal Rainfall

Seasonal rainfall in the future is projected to increase in all the locations and RCP scenarios, except over Chittorgarh and Udaipur under RCP4.5. The highest increase in seasonal rainfall was projected over Banswara (+17% compared to the baseline mean of 800 mm) and Khargone (+16% from the baseline mean of 682 mm) under RCP4.5 and RCP8.5, respectively (Figure 2). Rainfall is projected to decrease over Chittorgarh and Udaipur by 1.4% and 1.2% respectively under RCP4.5. Compared to RCP4.5, the projected increase in seasonal rainfall would be higher under RCP8.5. Out of the 8 study locations, the total seasonal rainfall was projected to increase by over 100 mm in four locations (Banswara, Dungarpur, Indore and Khargone).

3.1.2. Tmax

The mean seasonal maximum temperature was projected to increase by 0.3–0.6 °C across the study locations (Figure 2). The highest increase was projected over Banswara (0.6 °C under both RCP4.5 and RCP8.5) and the lowest over Navile (0.3 °C under RCP4.5 and 0.4 °C under RCP8.5).

3.1.3. Tmin

The mean seasonal minimum temperature was projected to increase by 0.7–1.4 °C across the locations (Figure 2). The highest increase was projected in Indore (1.2 °C under RCP4.5 and 1.4 °C under RCP8.5) and the lowest over Mudugere (0.7 °C under both RCP4.5 and RCP8.5). The spread of the distribution was greater during the baseline than that of the future period (both under RCP4.5 and 8.5) in Chittorgarh, Indore, Khargone and Udaipur. The magnitude of increase in Tmin was higher than that of Tmax in all the locations, as indicated by Figure 2.
The projected increase in seasonal rainfall will cause a reduction in irrigation water requirements in the future. Similarly, the increase in temperature (both Tmax and Tmin) will cause faster accumulation of GDD and, hence, shorten the crop growing period. A reduction in crop duration will decrease the water requirement of the crop.

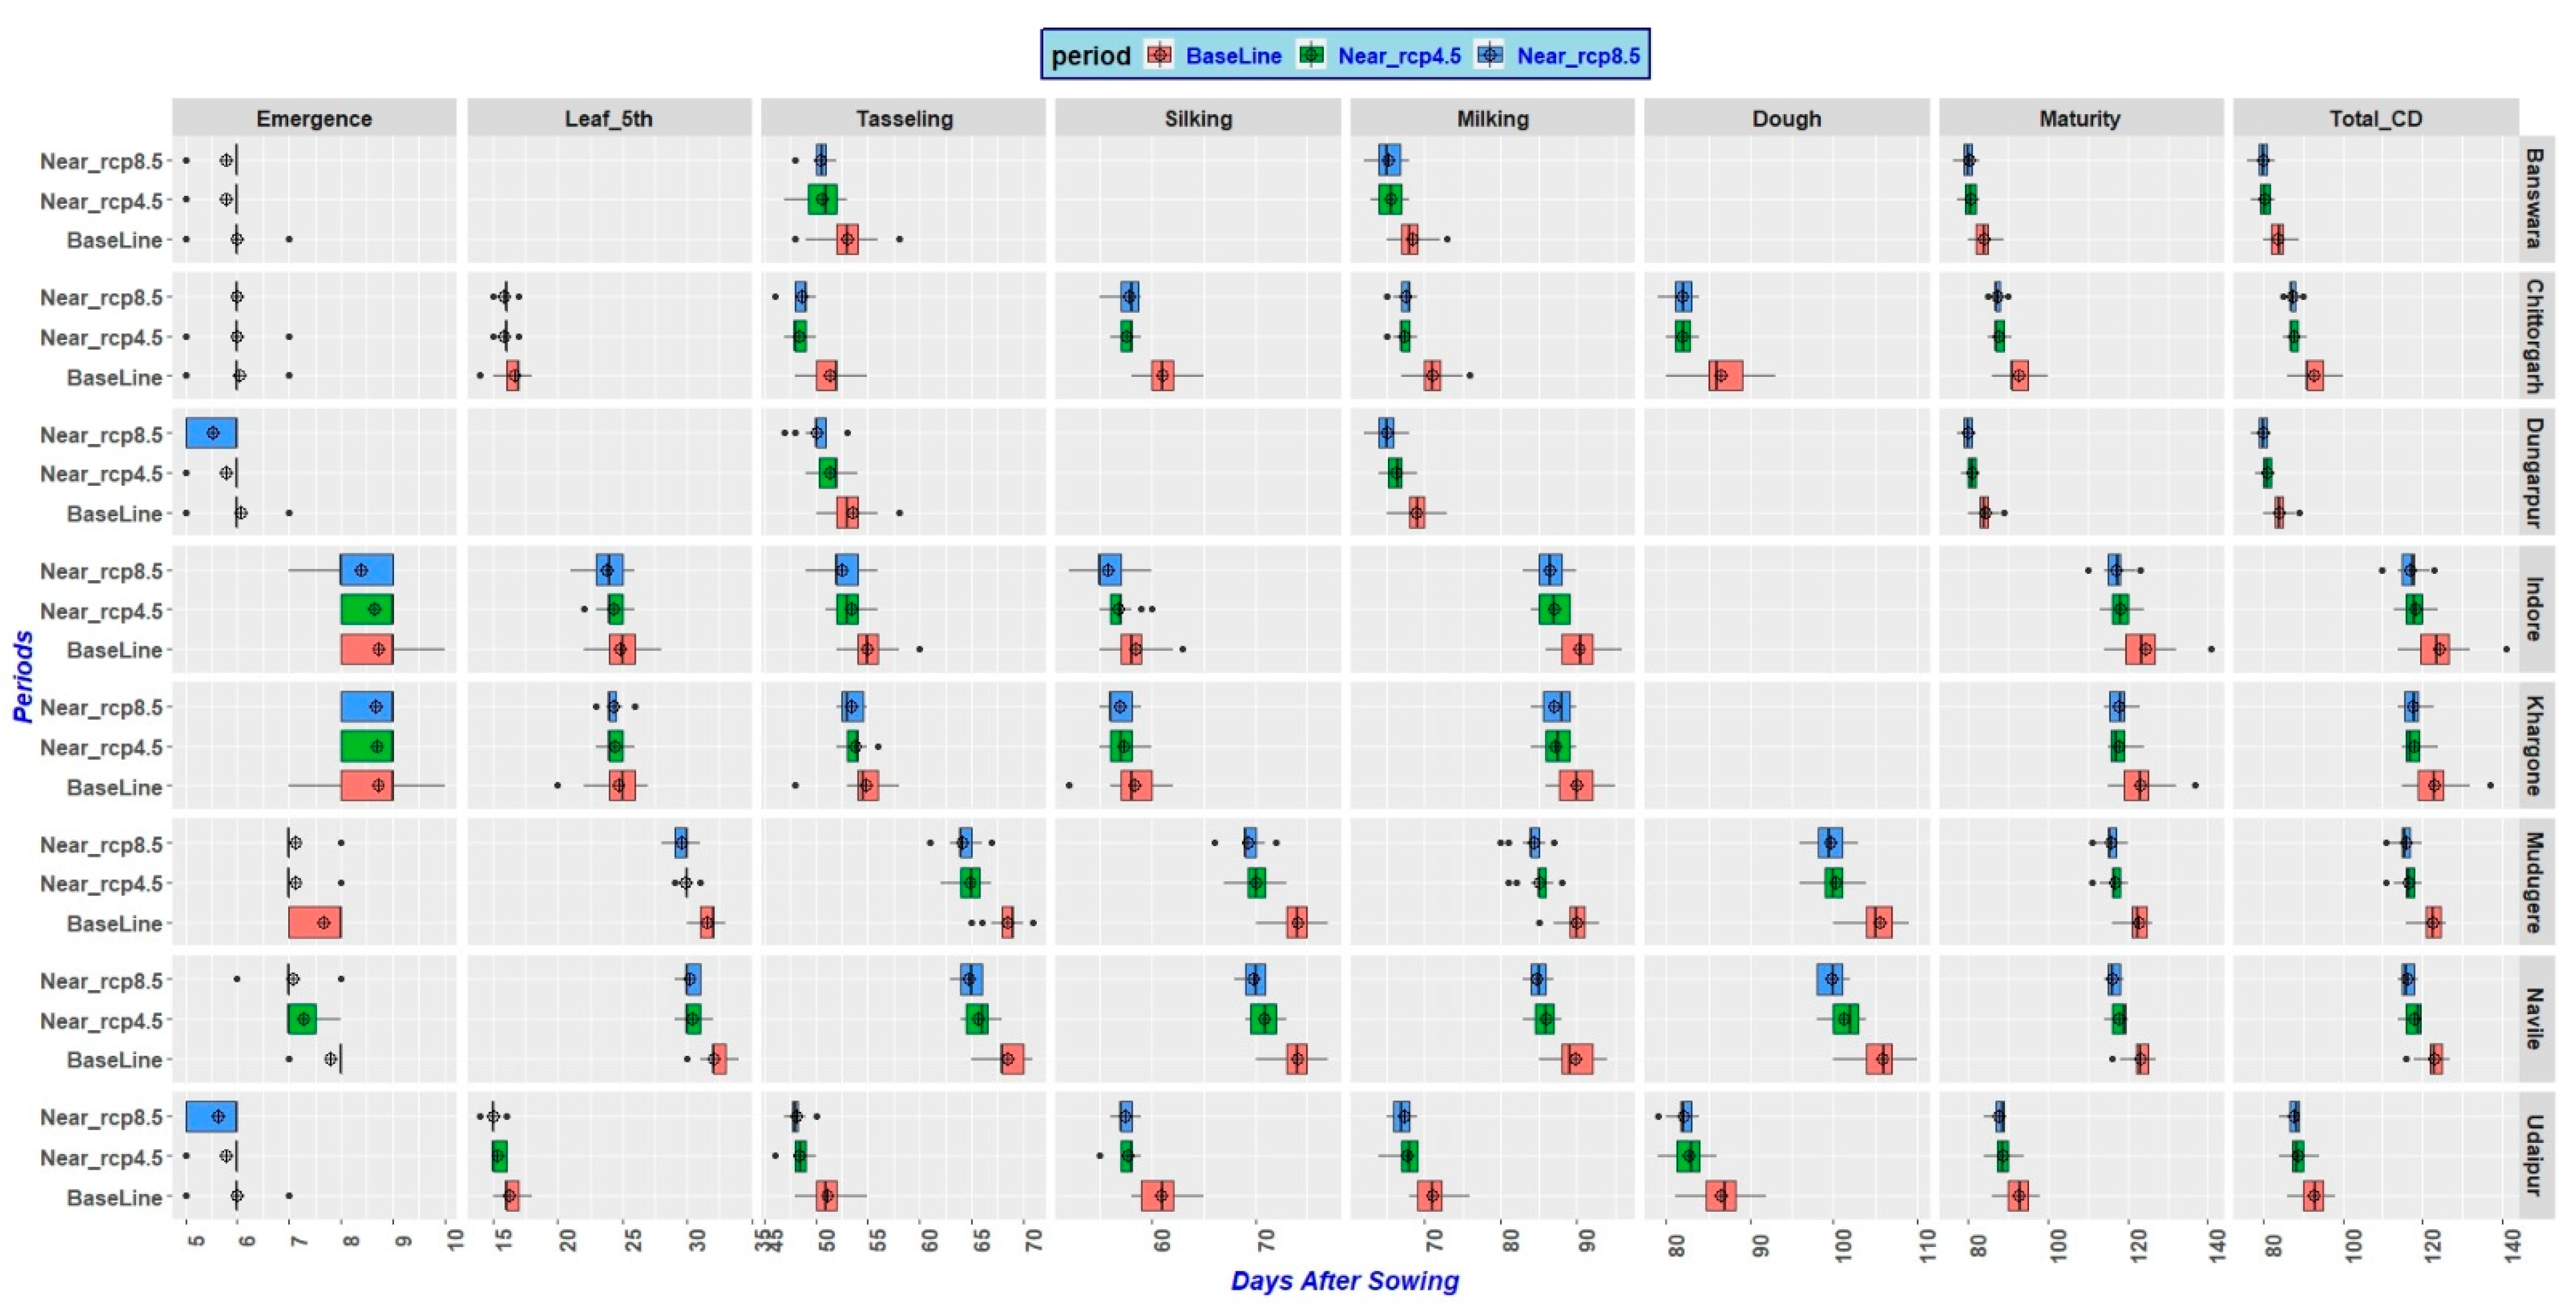
3.2. Changes in Phenology under Future Climate

A reduction in total crop duration is projected in all the study locations from 2022–39 under RCP4.5 and RCP8.5, compared to the baseline. The total duration of the crop was projected to decrease by 6 days (under RCP4.5) and 7 days (under RCP8.5) in Indore and Mudugere (Figure 3). Similarly, the projected reduction in Navile and Khargone was 5–7 and 5 days, respectively. In all the locations, a higher reduction was projected during reproductive stages than vegetative stages. The lowest reduction in total crop duration was projected in Banswara and Dungarpur (3–4 days). The projected reduction in crop duration across the locations can be attributed to the increase in both Tmax and Tmin. The increased temperature caused faster accumulation of GDD, which reduced the days required to reach specific growth phases. Hence, there was a reduction in total crop duration in all the study locations.

3.3. Changes in Crop Water Requirement

In the case of phenology, the total crop water requirement is projected to decrease in the period 2022–39 across all the study locations, though the magnitude varies spatially. The highest reduction in total CWR was projected in Udaipur (69 mm under RCP4.5 and 51 mm under RCP8.5) and the lowest in Banswara (8 mm each under RCP4.5 and RCP8.5) (Figure 4). The reduction in CWR can be attributed to the reduction in total crop duration, which in turn was caused by higher Tmax and Tmin under the projected climate. As the projected reduction in total crop duration ranged 3–7 days (across the locations and emission scenarios), a reduction in CWR was obvious. In the case of Udaipur, where the highest reduction in CWR was recorded, Tmax and Tmin were projected to increase by 0.5 °C (under both RCP4.5 and RCP8.5) and 1 °C (under RCP4.5) to 1.3 °C (under RCP8.5). Due to higher Tmax and Tmin, the total crop duration was projected to decrease by 4–5 days. Among the phenophases, the CWRs of the silking, milking and dough stages were projected to decrease by 9–12mm, 13–19 mm and 16–25 mm, respectively (the first and second values in the range denote the reduction in CWR under RCP8.5 and RCP4.5, respectively). Across the study locations, the highest reduction in CWR was recorded during silking to milking.

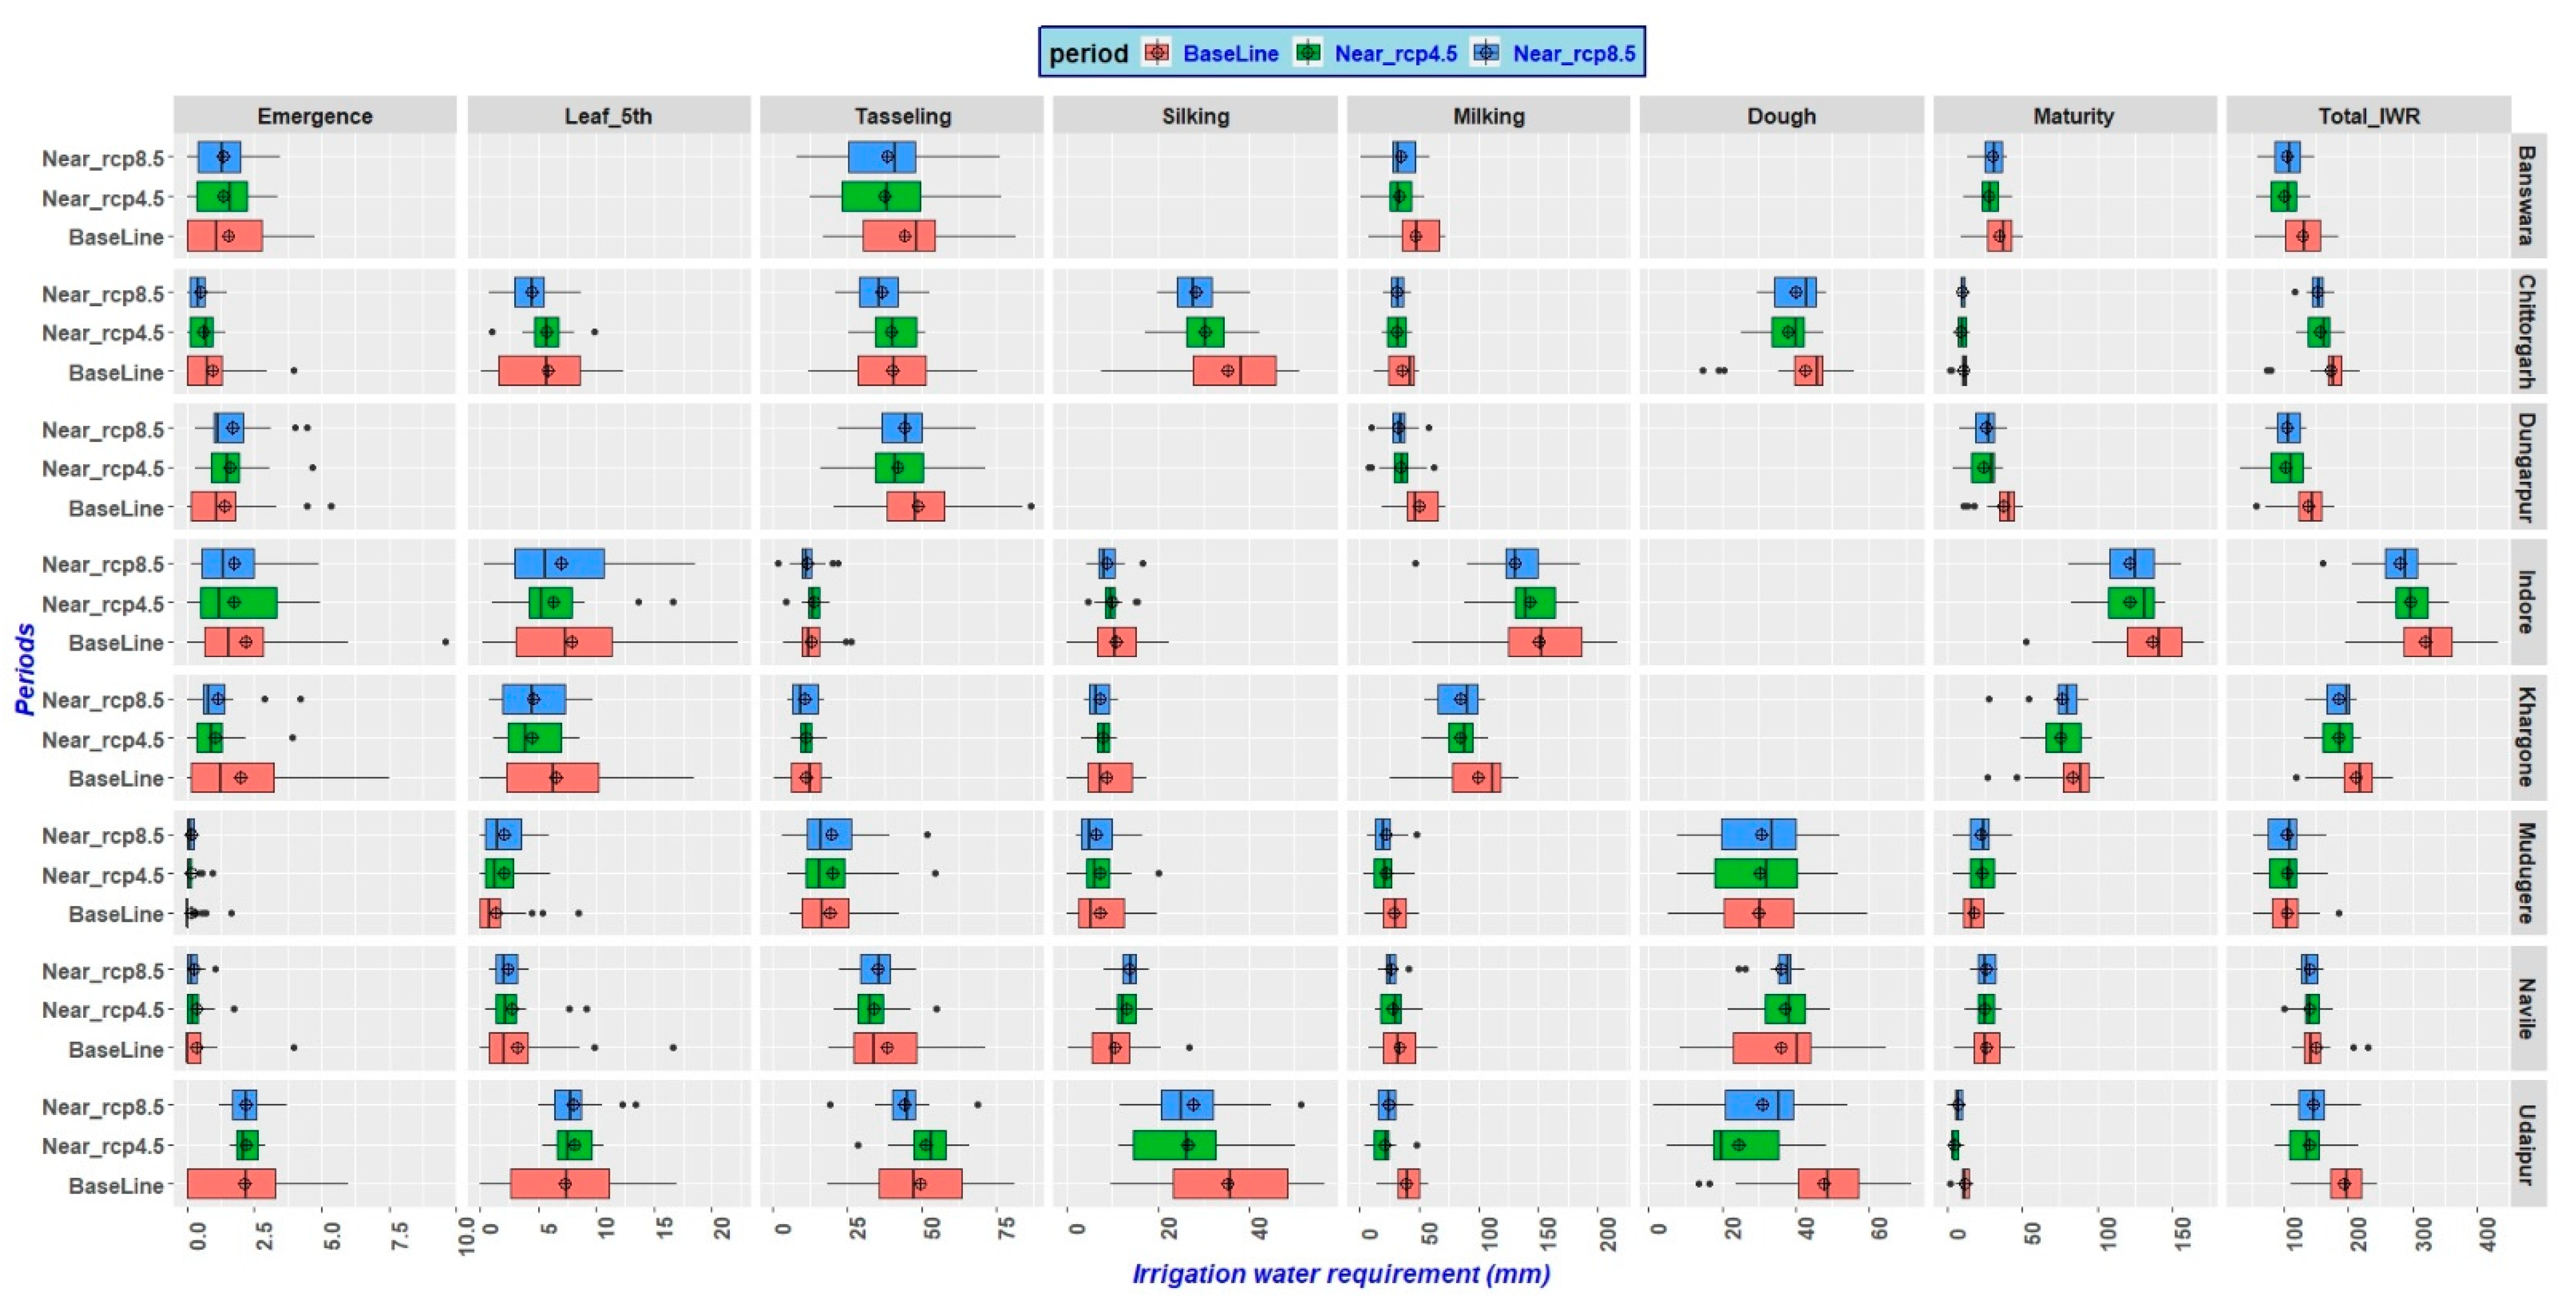
3.4. Changes in Irrigation Water Requirement

IWR was also projected to decrease during 2022–39 across all locations. While the highest projected reduction was in Udaipur (48–54 mm), the lowest was in Muduguere (no change under RCP4.5 and a reduction of 1 mm under RCP8.5) (Figure 5). The total seasonal Peff was projected to increase in all the locations under both RCP4.5 and RCP8.5, except Mudugere (decreasing by 9 mm under RCP4.5 and by 16 mm under RCP8.5) and Udaipur (decreasing by 4mm under RCP4.5) (Figure 6). The highest increase in Peff was projected in Banswara (35 mm under RCP4.5 and 27 mm under RCP8.5), followed by Khargone (23 mm under RCP4.5 and 30 mm under RCP8.5).
A summary of the water balance model components, CWR and IWR, in the study locations during the baseline and near-future periods is presented in Supplementary Table S2.

4. Discussion

The seasonal rainfall, mean Tmax and mean Tmin were projected to increase considerably in the study locations from their baseline mean. The projected increase in Tmax and Tmin over the study locations is in agreement with the latest report by IPCC [6], which stated that unless major reductions in carbon dioxide (CO2) and other greenhouse gas emissions occur in the coming decades, global warming of 1.5 °C and 2 °C will be exceeded during the twenty-first century. It has already been mentioned that the magnitude of the increase in Tmin would be greater than that of Tmax in all the study locations under the projected climate. While local conditions, particularly soil water content and evaporative heat loss as soil water evaporates, influence maximum temperatures, mesoscale changes in atmospheric water vapour concentration influence minimum air temperatures [32]. As a result, substantial increases in maximum temperatures are less likely to occur in areas where climate change is predicted to result in increased rainfall [8]. The results of the water balance components indicated that the total seasonal surface runoff will be higher in the future in Banswara, Dungarpur, Indore and Khargone compared to the baseline (Supplementary Table S2). Maize, being susceptible to waterlogging, may face water stagnation due to the projected increase in rainfall and runoff in these locations.
The results of the present study revealed that maize phenology, CWR and IWR were very responsive to the projected climate scenarios. The crop duration would reduce due to increases in Tmax and Tmin in the near-future (2022–39). The results are in agreement with previous studies [33,34,35,36], which have stated that rising temperatures caused a shortening of crop growth duration. An increase in temperature causes faster accumulation of degree days, which in turn reduces the number of days required to achieve a specific growth stage by the crop. The results also indicate that, compared to the vegetative stage, the reduction was higher during the reproductive stage, as reported by [37]. Non-perennial crops with a faster growth rate have a shorter life cycle, resulting in smaller plants, shorter reproductive periods, and reduced yield potential [8]. In all four study locations in Rajasthan (Banswara, Chittorgarh, Dungarpur and Udaipur), an average reduction of two days was projected in the near future between the 5th leaf stage and tasselling, irrespective of the emission scenarios. However, during reproductive stages, a higher reduction in crop duration was recorded under the RCP8.5 scenario than RCP4.5. For example, in Indore, a reduction of three days (four) was observed between milking and physiological maturity under the RCP4.5 (8.5) scenario when compared to the baseline mean. The magnitude of the total reduction in crop duration was lesser over study locations in Rajasthan (average reduction of 3–5 days) and greater over study locations in Karnataka and Madhya Pradesh (average reduction of 5–7 days). A possible reason for this may be the fact that the mean crop duration was shorter over study locations in Rajasthan (81–86 days) compared to other locations (114–116 days), as indicated by Table 1.
Various studies conducted on changes in the water requirement of crops under the projected climate have reported a decrease in CWR due to reduced growing days [38,39]. Similarly, using the AquaCrop model, a reduction in maize CWR under elevated temperatures and increasing CO2 concentrations has been predicted in China [40]. Despite the fact that an increase in temperature is expected to increase evapotranspiration [41,42], the seasonal CWR is expected to decrease compared to the baseline [43] due to the reduction in the growing period caused by early stomatal closure as a result of triggered fertilization through high CO2 concentration and elevated temperature. The same observation is applicable in the present study too, though we have not considered the impact of CO2 fertilization on the phenology, CWR and IWR of maize. Along with this, the projected increase in rainfall is likely to offset or reduce the impact of increasing Tmax and Tmin [44].
Furthermore, a recent study has confirmed that in North-West India, the total water footprint of kharif-season maize is expected to drop by more than 4% during the 2050s [45]. They have also reported that green water footprints in kharif-season maize decreased by 0.0–5.0 percent in Chhattisgarh, Odisha, Andhra Pradesh, Karnataka, and parts of Gujrat and Rajasthan. Four out of eight of our study locations are in Rajasthan state (which represents North-West India) and two locations each are in Karnataka and Madhya Pradesh. These results are also in agreement with this study.
The results indicated a reduction in the IWR in all the study locations in the near future. The change in IWR could be due to (1) change in CWR, (2) change in effective rainfall (Peff) or (3) change in crop duration. As discussed in Section 3.3, the CWR was projected to decrease under future climate scenarios. The increase in Peff can be attributed to the increase in seasonal rainfall. The highest increase in seasonal rainfall was projected in Banswara, followed by Khargone. Since the CWR in all the locations was projected to decrease and Peff was projected to increase (with two exceptions), the IWR decreased in all the study locations. Previous studies have predicted a reduction in IWR in future due to reductions in crop duration [46] and CO2 fertilization effect [47,48].
Unlike most of the other studies involving the impact of the projected climate on CWR and IWR, this study has estimated crop-stage specific changes in the phenology, CWR and IWR of maize across multiple locations in India. This has enabled a better understanding of the crop growth stages in which major changes in crop duration, CWR and IWR may to occur, spatially and temporally. Such information would be very useful for the scheduling of irrigation at critical stages, varietal development programs, and the planning and management of available fresh water resources for agricultural purposes, as there would be much competition from other sectors such as industry, domestic and tourism in the future.

5. Conclusions

The current study estimated the impact of the projected climate on crop duration, crop water requirement, effective rainfall and irrigation water requirement for kharif maize in eight locations in India. The selection of 5 GCMs from a pool of 29 CMIP-5 GCMs provided a comprehensive quantification of possible projected climates in the future. The study revealed the specific growth stages of maize in which the duration, CWR and IWR are projected to decrease. The decrease in the growth duration of maize was mainly due to increases in mean seasonal Tmax and Tmin. The increased seasonal rainfall and thereby effective rainfall caused reductions in CWR and IWR. The output of the study will be effective information for farmers and varietal development programs in the study locations in the near future.

Supplementary Materials

The following are available online at https://www.mdpi.com/article/10.3390/su14031419/s1, Figure S1: Delta temperature–delta precipitation scatter plot for (a) Banswara, (b) Chittorgarh (c) Dungarpur (d) Indore (e) Khar-gone (f) Mudugere (g) Navile and (h) Udaipur for a selection of representative GCMs (JJAS–June to September growing season of maize; JASO–July to October). Letters A to Z (26) and numbers 1 to 3 represent 29 GCMs (as presented in Table 2) and they are coloured according to their category. The dots represent the median of GCMs within a category; Figure S2: Changes in projected mean seasonal Tmax (°C), Tmin (°C) and rainfall (mm) during 2022–39 under RCP4.5 and 8.5 in all study locations, compared to baseline period (1980–2009). The cross hair and black line inside each box plot represent the mean and median of the distribution, respectively; Figure S3: Changes in phenology (stage-wise and total) of maize during 2022–39 under RCP4.5 and 8.5 in all study locations, compared to baseline period (1980–2009). The cross hair and black line inside each box plot represent the mean and median of the distribution, respectively; Figure S4: Changes in crop water requirement (stage-wise and total) of maize during 2022–39 under RCP4.5 and 8.5 in all study locations, compared to baseline period (1980–2009). The cross hair and black line inside each box plot represent the mean and median of the distribution, respectively; Figure S5: Changes in irrigation water requirement (stage-wise and total) of maize during 2022–39 under RCP4.5 and 8.5 in all study locations, compared to baseline period (1980–2009). The cross hair and black line inside each box plot represent the mean and median of the distribution, respectively; Figure S6: Changes in effective rainfall (stage-wise and total) of maize during 2022–39 under RCP4.5 and 8.5 in all study locations, compared to baseline period (1980–2009). The cross hair and black line inside each box plot represent the mean and median of the distribution, respectively; Table S1: Details of the study locations; Table S2: Summary of 29 GCMs used in this study for climate change impact assessment [23]; Table S3: Selected GCMs from each quadrant for the study locations and their weights.

Author Contributions

Conceptualization, S.K.B. and M.A.S.C.; methodology, M.A.S.C., N.M., S.K.B.; software, M.A.S.C., S.V.M. and R.P.K.; formal analysis, A.M., R.P.K., P.S.; investigation, S.K.B., M.A.S.C.; resources, S.D.A., P.S.; data curation, P.V.P., A.V.M.S.R.; writing—M.A.S.C., N.M.; writing—review and editing, S.K.B., A.V.M.S.R., S.D.A., A.M., V.K.S.; visualization, M.A.S.C., R.P.K.; supervision, V.K.S., S.K.B., S.D.A. All authors have read and agreed to the published version of the manuscript.

Funding

No external funding was received for this research work.

Institutional Review Board Statement

Not applicable.

Informed Consent Statement

Not applicable.

Data Availability Statement

The data presented in this study are available on request from the corresponding authors.

Conflicts of Interest

The authors declare no conflict of interest.

References

  1. WWAP (UNESCO World Water Assessment Programme). The United Nations World Water Development Report 2019: Leaving No One Behind; UNESCO: Paris, France, 2019. [Google Scholar]
  2. United Nations. Open Working Group of the General Assembly on Sustainable Development Goals. Issued as Document A/68/970. 2014. Available online: http://undocs.org/A/68/970 (accessed on 25 October 2021).
  3. Surendran, U.; Sandeep, O.; Mammen, G.; Joseph, E.J. A Novel technique of magnetic treatment of saline and hard water for irrigation and its impact on cow pea growth and water properties. Int. J. Agric. Environ. Biotechnol. 2013, 6, 85–92. [Google Scholar]
  4. Jalota, S.K.; Kaur, H.; Ray, S.S.; Tripathi, R.; Vashisht, B.B.; Bal, S.K. Mitigating Future Climate Change Effects by Shifting Planting Dates of Crops in Rice-Wheat Cropping System. Reg. Environ. Chang. 2012, 12, 913–922. [Google Scholar] [CrossRef]
  5. Mukherjee, J.; Bal, S.K.; Singh, G.; Bhattacharya, B.K.; Singh, H.; Kaur, P. Surface energy fluxes in wheat (Triticum aestivum L.) under irrigated ecosystem. J. Agrometeorol. 2012, 14, 16–20. [Google Scholar]
  6. IPCC. Summary for Policymakers. In Climate Change 2021: The Physical Science Basis. Contribution of Working Group I to the Sixth Assessment Report of the Intergovernmental Panel on Climate Change; Masson, D.V., Zhai, P., Pirani, A., Connors, S.L., Péan, C., Berger, S., Caud, N., Chen, Y., Goldfarb, L., Gomis, M.I., et al., Eds.; Cambridge University Press: Cambridge, UK, 2021. [Google Scholar]
  7. Chen, P.; Liu, Y. The impact of climate change on summer maize phenology in the northwest plain of Shandong province under the IPCC SRES A1B scenario. IOP Conf. Ser. Earth Environ. Sci. 2014, 17, 012053. [Google Scholar] [CrossRef] [Green Version]
  8. Hatfield, J.L.; Prueger, J.H. Temperature extremes: Effect on plant growth and development. Weather. Clim. Extrem. 2015, 10, 4–10. [Google Scholar] [CrossRef] [Green Version]
  9. Tubiello, F.N.; Donatelli, M.; Rosenzweig, C.; Stockle, C.O. Effects of climate change and elevated CO2 on cropping systems: Model predictions at two Italian locations. Eur. J. Agron. 2000, 13, 179–189. [Google Scholar] [CrossRef]
  10. Tao, F.; Yokozawa, M.; Xu, Y.; Hayashi, Y.; Zhang, Z. Climate changes and trends in phenology and yields of field crops in China, 1981–2000. Agric. For. Meteorol. 2006, 138, 82–92. [Google Scholar] [CrossRef]
  11. Wang, J.; Vanga, S.; Saxena, R.; Orsat, V.; Raghavan, V. Effect of climate change on the yield of cereal crops: A review. Climate 2018, 6, 41. [Google Scholar] [CrossRef] [Green Version]
  12. Tryjanowski, P.; Sparks, T.H.; Blecharczyk, A.; Małecka-Jankowiak, I.; Switek, S.; Sawinska, Z. Changing phenology of potato and of the treatment for its major pest (Colorado potato beetle)–a long-term analysis. Am. J. Potato Res. 2018, 95, 26–32. [Google Scholar] [CrossRef] [Green Version]
  13. Ahmad, S.; Abbas, Q.; Abbas, G.; Fatima, Z.; Naz, S.; Younis, H.; Khan, R.J.; Nasim, W.; Habib ur Rehman, M.; Ahmad, A.; et al. Quantification of climate warming and crop management impacts on cotton phenology. Plants 2017, 6, 7. [Google Scholar] [CrossRef] [Green Version]
  14. Woznicki, S.A.; Nejadhashemi, A.P.; Parsinejad, M. Climate change and irrigation demand: Uncertainty and adaptation. J. Hydrol. Reg. Stud. 2015, 3, 247–264. [Google Scholar] [CrossRef]
  15. Rahman, A.; Mojid, M.A.; Banu, S. Climate change impact assessment on three major crops in the north-central region of Bangladesh using DSSAT. Int. J. Agric. Biol. 2018, 11, 135–143. [Google Scholar] [CrossRef]
  16. Crop Production Statistics Information System. Available online: https://aps.dac.gov.in/APY/Public_Report1.aspx (accessed on 10 September 2021).
  17. India Maize Scenario. Available online: https://iimr.icar.gov.in/india-maze-scenario/ (accessed on 1 November 2021).
  18. Amarasinghe, U.A.; Singh, O.P. Changing consumption patterns of India: Implications on future food demand. In India’s Water Future: Scenarios and Issues; Amarasinghe, U.A., Shah, T., Malik, R.P.S., Eds.; International Water Management Institute: Colombo, Sri Lanka, 2008; pp. 131–146. [Google Scholar]
  19. Maize Production Technologies in India. Available online: https://farmer.gov.in/imagedefault/pestanddiseasescrops/normalmaizeproductiontechnologies.pdf (accessed on 6 December 2021).
  20. India Meteorological Department (IMD). Available online: https://www.imdpune.gov.in/Clim_Pred_LRF_New/Grided_Data_Download.html (accessed on 16 August 2021).
  21. Pai, D.S.; Latha Sridhar Rajeevan, M.; Sreejith, O.P.; Satbhai, N.S.; Mukhopadhyay, B. Development of a new high spatial resolution (0.25° × 0.25°) Long period (1901–2010) daily gridded rainfall data set over India and its comparison with existing data sets over the region. Mausam 2014, 65, 1–18. [Google Scholar] [CrossRef]
  22. Srivastava, A.K.; Rajeevan, M.; Kshirsagar, S.R. Development of high resolution daily gridded temperature data set (1969–2005) for the Indian Region. Atmos. Sci. Lett. 2009, 10, 249–254. [Google Scholar] [CrossRef]
  23. Ruane, A.C.; McDermid, S.P. Selection of a representative subset of global climate models that captures the profile of regional changes for integrated climate impacts assessment. Earth Perspect. 2017, 4, 1. [Google Scholar] [CrossRef] [Green Version]
  24. Robinson, J.M.; Hubbard, K.G. Soil water assessment model for several crops in the High Plains. J. Agron. 1990, 82, 1141–1148. [Google Scholar] [CrossRef] [Green Version]
  25. Vijaya Kumar, P.; Bal, S.K.; Dhakar, R.; Sarath Chandran, M.A.; Subba Rao, A.V.M.; Sandeep, V.M.; Pramod, V.P.; Malleswari, S.N.; Sudhakar, G.; Solanki, N.S.; et al. Algorithms for weather-based management decisions in major rainfed crops of India: Validation using data from multi-location field experiments. J. Agron. 2021, 113, 1816–1830. [Google Scholar] [CrossRef]
  26. Ritchie, J.T.; Nesmith, D.S. Temperature and crop development. In Modeling Plant and Soil Systems; Hanks, R.J., Ritchie, J.T., Eds.; Agronomy Monograph-31: Madison, WI, USA, 1991; pp. 5–29. [Google Scholar]
  27. McMaster, G.S.; Wilhelm, W.W. Growing degree-days: One equation, two interpretations. Agric. For. Meteorol. 1997, 87, 291–300. [Google Scholar] [CrossRef] [Green Version]
  28. Xu, H.; Tian, Z.; He, X.; Wang, J.; Sun, L.; Fischer, G.; Fan, D.; Zhong, H.; Wu, W.; Pope, E.; et al. Future increases in irrigation water requirement challenge the water-food nexus in the northeast farming region of China. Agric. Water Manag. 2019, 213, 594–604. [Google Scholar] [CrossRef]
  29. Bal, S.K.; Minhas, P.S. Atmospheric Stressors: Challenges and Coping Strategies. In Abiotic Stress Management for Resilient Agriculture; Minhas, P.S., Rane, J., Pasala, R.K., Eds.; Springer: Singapore, 2017; pp. 9–50. [Google Scholar] [CrossRef]
  30. Allen, R.G.; Pereira, L.S.; Raes, D.; Smith, M. Crop evapotranspiration-Guidelines for computing crop water requirements-FAO Irrigation and drainage paper 56. FAO Rome 1998, 300, D05109. [Google Scholar]
  31. Chandran MA, S.; Banerjee, S.; Mukherjee, A.; Nanda, M.K.; Kumari, V.V. Evaluating the long-term impact of projected climate on rice-lentil-groundnut cropping system in Lower Gangetic Plain of India using crop simulation modelling. Int. J. Biometeorol. 2021, 66, 55–69. [Google Scholar] [CrossRef]
  32. Alfaro, E.J.; Gershunov, A.; Cayan, D. Prediction of summer maximum and minimum temperature over the central and western United States: The roles of soil moisture and sea surface temperature. J. Clim. 2006, 19, 1407–1421. [Google Scholar] [CrossRef]
  33. Jagadish, S.V.K.; Bahuguna, R.N.; Djanaguiraman, M.; Gamuyao, R.; Vara Prasad, P.V.; Craufurd, P.Q. Implications of high temperature and elevated CO2 on flowering time in plants. Front. Plant Sci. 2016, 7, 913. [Google Scholar] [CrossRef] [Green Version]
  34. Zhang, Q.; Zhang, W.; Li, T.; Sun, W.; Yu, Y.; Wang, G. Projective analysis of staple food crop productivity in adaptation to future climate change in China. Int. J. Biometeorol. 2017, 61, 1445–1460. [Google Scholar] [CrossRef]
  35. Guo, Y.; Wu, W.; Du, M.; Liu, X.; Wang, J.; Bryant, C.R. Modelling climate change impacts on rice growth and yield under global warming of 1.5 and 2.0 °C in the Pearl River Delta, China. Atmosphere 2019, 10, 567. [Google Scholar] [CrossRef] [Green Version]
  36. Chandran, M.A.S.; Banerjee, S.; Mukherjee, A.; Nanda, M.K.; Mondal, S.; Kumari, V.V. Evaluating the impact of projected climate on rice–wheat-groundnut cropping sequence in lower Gangetic plains of India: A study using multiple GCMs, DSSAT model, and long-term sequence analysis. Theor. Appl. Climatol. 2021, 145, 1243–1258. [Google Scholar] [CrossRef]
  37. Shim, D.; Lee, K.J.; Lee, B.W. Response of phenology-and yield-related traits of maize to elevated temperature in a temperate region. Crop J. 2017, 5, 305–316. [Google Scholar] [CrossRef]
  38. Durodola, O.S.; Mourad, K.A. Modelling maize yield and water requirements under different climate change scenarios. Climate 2020, 8, 127. [Google Scholar] [CrossRef]
  39. Ding, Y.; Wang, W.; Song, R.; Shao, Q.; Jiao, X.; Xing, W. Modeling spatial and temporal variability of the impact of climate change on rice irrigation water requirements in the middle and lower reaches of the Yangtze River, China. Agric. Water Manag. 2017, 193, 89–101. [Google Scholar] [CrossRef]
  40. Li, J.; Zhu, T.; Mao, X.; Adeloye, A.J. Modeling crop water consumption and water productivity in the middle reaches of Heihe River Basin. Comput. Electron. Agric. 2016, 123, 242–255. [Google Scholar] [CrossRef]
  41. Boonwichai, S.; Shrestha, S.; Babel, M.S.; Weesakul, S.; Datta, A. Climate change impacts on irrigation water requirement, crop water productivity and rice yield in the Songkhram River Basin, Thailand. J. Clean. Prod. 2018, 198, 1157–1164. [Google Scholar] [CrossRef]
  42. Jalota, S.K.; Kaur, K.; Ray, S.S.; Tripathy, R.; Vashisht, B.B.; Bal, S.K. Past and General Circulation Model-driven future trends of climate change in Central Indian Punjab: Ensuing yield of rice-wheat cropping system. Curr. Sci. 2013, 104, 105–110. [Google Scholar]
  43. Luhunga, P.M. Assessment of the Impacts of Climate Change on Maize Production in the Southern and Western Highlands Sub-agro Ecological Zones of Tanzania. Front. Environ. Sci. 2017, 5, 51. [Google Scholar] [CrossRef] [Green Version]
  44. Malhi, G.S.; Kaur, M.; Kaushik, P. Impact of climate change on agriculture and its mitigation strategies: A review. Sustainability 2021, 13, 1318. [Google Scholar] [CrossRef]
  45. Mali, S.S.; Shirsath, P.B.; Islam, A. A high-resolution assessment of climate change impact on water footprints of cereal production in India. Sci. Rep. 2021, 11, 8715. [Google Scholar] [CrossRef]
  46. Gabaldón-Leal, C.; Lorite, I.J.; Mínguez, M.I.; Lizaso, J.I.; Dosio, A.; Sanchez, E.; Ruiz-Ramos, M. Strategies for adapting maize to climate change and extreme temperatures in Andalusia, Spain. Clim. Res. 2015, 65, 159–173. [Google Scholar] [CrossRef] [Green Version]
  47. Yano, T.; Aydin, M.; Haraguchi, T. Impact of climate change on irrigation demand and crop growth in a Mediterranean environment of Turkey. Sensors 2007, 7, 2297–2315. [Google Scholar] [CrossRef] [Green Version]
  48. Guereña, A.; Ruiz-Ramos, M.; Díaz-Ambrona, C.H.; Conde, J.R.; Mínguez, M.I. Assessment of climate change and agriculture in Spain using climate models. Agron. J. 2001, 93, 237–249. [Google Scholar] [CrossRef]
Figure 1. Delta temperature–delta precipitation scatter plot for (a) Banswara, (b) Chittorgarh (c) Dungarpur (d) Indore (e) Khargone (f) Mudugere (g) Navile and (h) Udaipur for a selection of representative GCMs (JJAS–June to September growing season of maize; JASO–July to October). Letters A to Z (26) and numbers 1 to 3 represent 29 GCMs (as presented in Table 2) and they are coloured according to their category. The dots represent the median of GCMs within a category.
Sustainability 14 01419 g001aSustainability 14 01419 g001b
Figure 2. Changes in projected mean seasonal Tmax (°C), Tmin (°C) and rainfall (mm) during 2022–39 under RCP4.5 and 8.5 in all study locations, compared to baseline period (1980–2009). The cross hair and black line inside each box plot represent the mean and median of the distribution, respectively.
Sustainability 14 01419 g002
Figure 3. Changes in phenology (stage-wise and total) of maize during 2022–39 under RCP4.5 and 8.5 in all study locations, compared to baseline period (1980–2009). The cross hair and black line inside each box plot represent the mean and median of the distribution, respectively.
Sustainability 14 01419 g003
Figure 4. Changes in crop water requirement (stage-wise and total) of maize during 2022–39 under RCP4.5 and 8.5 in all study locations, compared to baseline period (1980–2009). The cross hair and black line inside each box plot represent the mean and median of the distribution, respectively.
Sustainability 14 01419 g004
Figure 5. Changes in irrigation water requirement (stage-wise and total) of maize during 2022–39 under RCP4.5 and 8.5 in all study locations, compared to baseline period (1980–2009). The cross hair and black line inside each box plot represent the mean and median of the distribution, respectively.
Sustainability 14 01419 g005
Figure 6. Changes in effective rainfall (stage-wise and total) of maize during 2022–39 under RCP4.5 and 8.5 in all study locations, compared to baseline period (1980–2009). The cross hair and black line inside each box plot represent the mean and median of the distribution, respectively.
Sustainability 14 01419 g006
Table 1. Details of the study locations.
LocationStateMean Seasonal Rainfall (mm)Seasonal Mean Tmax (°C)Seasonal Mean Tmin (°C)Soil TextureMean Crop Duration
BanswaraRajasthan90732.523.7Sandy loam81
Chittorgarh77232.619.1Clay loam85
Dungarpur77432.523.7Sandy loam81
Udaipur68531.817.5Sandy loam86
IndoreMadhya Pradesh90332.522.4Silty clay loam114
Khargone79732.422.4Clay loam115
MudugereKarnataka121827.820.1Sandy clay loam116
Navile82727.419.6Sandy loam116
Table 2. Summary of 29 GCMs used in this study for climate change impact assessment [23].
SymbolGCMHorizontal ResolutionSymbolGCMHorizontal Resolution
AACCESS1-01.25° × 1.875°PMIROC-ESM~2.8° × 2.8°
BBCC-CSM 1-1~2.8° × 2.8°QMPI-ESM-LR~1.9° × 1.875°
CBNU-ESM~2.8° × 2.8°RMPI-ESM-MR~1.9° × 1.875°
DCanESM2~2.8° × 2.8°SMRI-CGCM3~1.1° × 1.125°
ECCSM4~0.9° × 1.25°TNorESM1-M~1.9° × 2.5°
FCESM1-BGC~0.9° × 1.25°UFGOALS-g2~2.8° × 2.8°
GCSIRO-Mk3-6-0~1.9° × 1.875°VCMCC-CM~0.75° × 0.75°
HGFDL-ESM2G~2.0° × 2.5°WCMCC-CMS~1.875° × 1.875°
IGFDL-ESM2M~2.0° × 2.5°XCNRM-CM5~1.4° × 1.4°
JHadGEM2-CC1.25° × 1.875°YHadGEM2-AO1.25° × 1.875°
KHadGEM2-ES1.25° × 1.875°ZIPSL-CM5B-LR~2.5° × 1.26°
LINM-CM4.01.5° × 2.0° 1GFDL-CM32° × 2.5°
MIPSL-CM5A-LR~1.9° × 3.75°2GISS-E2-R2° × 2.5°
NIPSL-CM5A-MR~1.3° × 2.5°3GISS-E2-H2° × 2.5°
OMIROC5~1.4° × 1.4°
Table 3. Selected GCMs from each quadrant for the study locations and their weights *.
LocationQuadrantSymbolGCMWeight
Banswaracool/wet2GISS-E2-R10/29
hot/wetJHadGEM2-CC3/29
cool/dryHGFDL-ESM2G2/29
hot/dryUFGOALS-g27/29
middlePMIROC-ESM7/29
Chittorgarhcool/wetBBCC-CSM 1-19/29
hot/wetGCSIRO-Mk3-6-05/29
cool/dryXCNRM-CM52/29
hot/dryUFGOALS-g27/29
middle1GFDL-CM36/29
Dungarpurcool/wetVCMCC-CM8/29
hot/wetKHadGEM2-ES5/29
cool/dryHGFDL-ESM2G5/29
hot/dryUFGOALS-g26/29
middleWCMCC-CMS5/29
Indorecool/wetVCMCC-CM8/29
hot/wetKHadGEM2-ES4/29
cool/dryLINM-CM4.03/29
hot/dryNIPSL-CM5A-MR6/29
middleOMIROC58/29
Khargonecool/wetYHadGEM2-AO8/29
hot/wetKHadGEM2-ES5/29
cool/dryXCNRM-CM54/29
hot/dryQMPI-ESM-LR5/29
middleECCSM47/29
Mudugerecool/wet2GISS-E2-R5/29
hot/wetOMIROC56/29
cool/dryTNorESM1-M4/29
hot/dryMIPSL-CM5A-LR7/29
middleFCESM1-BGC7/29
Navilecool/wet2GISS-E2-R7/29
hot/wetJHadGEM2-CC5/29
cool/drySMRI-CGCM34/29
hot/dryWCMCC-CMS7/29
middleFCESM1-BGC6/29
Udaipurcool/wetBBCC-CSM 1–16/29
hot/wetKHadGEM2-ES6/29
cool/dryXCNRM-CM54/29
hot/dryCBNU-ESM8/29
middleMIPSL-CM5A-LR5/29
Note: * Weightage was estimated by the ratio of number of GCMs under each quadrant (as per Figure 1) to the total number of GCMs (29).
Publisher’s Note: MDPI stays neutral with regard to jurisdictional claims in published maps and institutional affiliations.

