Abstract
Given that energy is a significant input factor for modern economic growth, which has also brought the most severe negative externalities damage to the environment, improving energy efficiency is considered critical globally. As a large energy producer and consumer, China faces challenges from both the economy and the environment. This study used the generalized method of moments estimation techniques to examine the impact of foreign direct investment (FDI) technology spillovers on energy efficiency in a sample of manufacturing industries. A super-efficient data envelopment measure of energy efficiency is examined. The novelty of this study is that it analyzes both the quantitative and qualitative values of various spillover effects at the industry level. Using a panel data set on 26 manufacturing industries in Guangdong Province of China covering the period 2000–2018, the empirical results show a positive and statistically significant relationship between FDI competitive effects and energy efficiency. In contrast, this relationship is in the opposite position when demonstration effects of FDI technology spillovers occur. The results also show these effects have more impact to the low or middle energy consumption industries. The study provides a reference for the formulation of the FDI strategy and energy policy in the manufacturing sector.
1. Introduction
With the acceleration of industrialization and urbanization in China, energy demand has increased substantially. China’s carbon emissions reached 7.4 metric tons per capita in 2018 compared with the world average of 4.5. Manufacturing industries and construction consumed 32% of total fuel combustion (Data source: World Bank https://data.worldbank.org/indicator/EN.ATM.CO2E.PC?locations=CN, accessed on 1 January 2022). As the world’s largest manufacturer, China’s manufacturing industry’s energy consumption was 2.68 billion tons standard coal equivalent in 2018, accounting for 55% of the nation’s annual energy consumption (Data source: CEIC: Global Economic Data, Indicators, Charts and Forecasts https://www.ceicdata.com/en/china/energy-consumption/cn-energy-consumption-industry-manufacturing, accessed on 1 January 2022). Under the impact of the global pandemic on the industrial supply chain, China’s manufacturing industry took the lead in resuming work and production. The continuing development of the manufacturing industry inevitably consumes large amounts of energy and brings an irreparable impact on the environment.
China aims to achieve carbon neutrality by 2060 and will peak carbon emissions before 2030. Between now and then, coal will continue to dominate China’s energy resources which supplied about 66% of the total energy consumption [1]; therefore, improving utilization efficiency to reduce consumption and emissions by deploying new and improved technologies is the most effective way. Blomström [2] believes that foreign direct investment (FDI) contributes a major role in the transfer and diffusion of advanced technology. China had USD 163 billion FDI in 2020, compared with USD 134 billion in the US, and has overtaken the US as the number one globally for FDI (Data source: United Nations Conference on Trade and Development (UNCTAD) Report). Approximately 20% of FDI had been invested into the manufacturing sector.
Outdated technology and the inefficient production process requires more energy inputs which results in less efficient production output. FDI inflows are likely to stimulate the technological progress of the host country through technology spillovers. How FDI inflows can improve energy efficiency has become a prominent topic of study. The results of existing studies are not in consensus. According to the provincial panel data, Zheng [3] found FDI encourages energy efficiency in the manufacturing sector. Elliott et al. [4], employing 206 largest prefecture-level cities, found evidence that FDI flows into a city can decrease the energy intensity. Studies undertaken by Pan et al. [5] and Salim et al. [6] found FDI has a significant positive effect on energy efficiency. Hübler and Keller [7] used macro-level panel data on 60 developing countries to examine the influence of FDI inflows on energy intensity. Such empirical results could not confirm that the FDI can reduce the energy intensity of developing countries.
Given the fact that the FDI spillovers can be transmitted into two channels: intra-industry spillovers and inter-industry spillovers [8], the spillovers that occur in the same industry are considered intra-industry or horizontal spillovers, while the spillovers that occur across industries are considered inter-industry or vertical spillovers. The intra-industry spillover may occur through two channels of productivity or efficiency benefits spillovers transmission mechanisms, which are demonstration effects and competitive effects [9]. There are different measures for the competitive effects, Aitken and Harrison [10] used the presence of foreign ownership in the industry, Xu [11] used the value added of multinational enterprises (MNEs) and Wang [12] used the FDI/GDP ratio. However, these measures cannot reflect the impacts of technology transfer and diffusion for intermediate and final products on the host country’s technological progress at different levels. Shen and Fu [13] used production localization of MNEs to measure the demonstration effects, which successfully distinguish the demonstration effects and competitive effects. The vertical FDI spillovers between industries create the forward and backward linkages that provide domestic suppliers or buyers with an opportunity to gain productivity spillovers [14].
Our study attempts to examine intra-industry spillovers of MNEs. Hence, spillovers from the support of the inter-industry will not be captured. In addition, detailed data to measure the demonstration effects of intra-industry spillovers are only available in Guangdong Industrial Statistical Yearbook. Therefore, we employ a unique dataset of 26 industries in Guangdong Province throughout 2000–2018.
With the highest GDP in China, Guangdong Province has become an expected economic model through 40 years of reform and opening up. The economic development and location of the Guangdong Pearl River Delta has obvious outward-looking characteristics. Foreign investment is essential to contribute to the Guangdong’s economic growth. Blomström and Kokko [9] mentioned that FDI seems more important for the geographical spread of technologies. Wang [15] found Special Economic Zones (SEZs) are instrumental in bringing FDI. Guangdong Province occupies a special position of China’s manufacturing industry. Figure 1 displays a summary of Guangdong’s FDI in the manufacturing industry compared with the total FDI from 2000 to 2018. Overall, there were steady upward trends in total FDI from USD 12.24 billion to USD 26.88 billion from 2000 to 2015 and slightly decreased in the following two years and bounced back to USD 21.11 billion in 2018. The FDI in the manufacturing industry accounted for more than 50% of total FDI and was relatively stable.
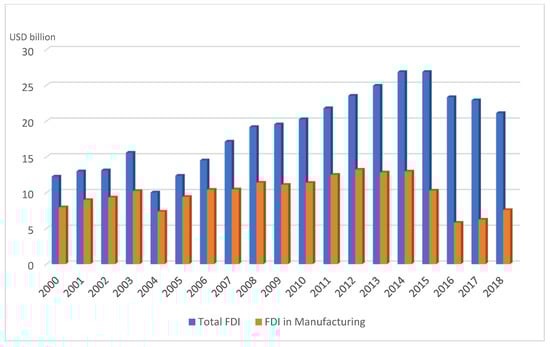
Figure 1.
FDI in the manufacturing industry compared with total FDI in Guangdong Province during 2000–2018.
Compared with the research on the impact of FDI spillovers on energy efficiency, there is abundant literature focusing on how FDI spillovers affect the total factor productivity, labor productivity, or economic growth. The study of Borensztein et al. [16], Raza et al. [17] and Kosztowniak [18] found that FDI contributes positive effects to economic growth and is an important vehicle for the transfer of technology. FDI technology spillovers, which drive economic growth by promoting technological progress, may improve energy efficiency but are uncertain as extensive economic growth cannot promote the improvement of energy efficiency. Based on studying the impact of FDI technology spillovers on economic growth, some scholars further discussed the effects of FDI technology spillovers on labor productivity. Caves [19] empirically examined this impact. Boghean and State [20] found that FDI can, through technology transfer, increase labor productivity to affect the host countries’ economies. Labor productivity only reflects the efficiency of labor resource utilization and cannot fully reflect the comprehensive utilization efficiency of resources. Therefore, the impact of FDI technology spillovers on labor productivity cannot mirror the effect of FDI technology spillovers on energy efficiency.
MNEs are more productive than local firms, thus contributing to increased productivity. The relationship between FDI spillovers and total factor productivity (TFP) attracts much attention from scholars. Xu [11] investigated the US MNEs as a channel of technology diffusion in 40 countries. Empirical results from Girma et al. [21] showed that foreign firms do have higher productivity than domestic firms in the UK. Woo [22] found that FDI has a positive and direct effect on TFP growth in developing countries. Although the improvement of energy efficiency depends on the progress of TFP [23], TFP cannot accurately reflect energy efficiency though. Traditional productivity measurement only considers capital and labor but ignores environmental and energy factors, leading to overestimating production efficiency. Hu and Wang [24] constructed a total factor energy efficiency (TFEE) index, which is a more appropriate index for evaluating energy efficiency.
Based on the background, it is necessary to explore the relationship between demonstration effects, competitive effects, and energy consumption, but studies of this relationship are scarce, especially on the industry level. Although many empirical studies analyze the impact of FDI spillovers on energy consumption, very little attention has been focused on various spillover effects and looking at both quantitative and qualitative values. Thus, the central purpose of this study is to extend our understanding of FDI spillovers, aiming for the deficiency of existing research, and has these main contributions: Firstly, it theoretically analyzes how demonstration effects and competitive effects impact the energy consumption in the host country on the industry level. An important question arises related to the role of FDI as a source of technology for the host country. From the host’s point of view of, it is not clear the actual technological benefits of FDI are from the presence of MNCs disturbing the existing equilibrium in the market and causing fierce competition, or MNC affiliates bring with the proprietary technology to operate in the local market. With a theoretically and empirically based model, this study reveals their differences.
Secondly, the core explanatory variables, demonstration effects and competitive effects are defined and measured in an empirical model to examine their impacts on the energy consumption of 26 manufacturing industries of Guangdong Province of China from 2000 to 2018. Moreover, we differentiate the high energy consumption and low or middle energy consumption manufacturing groups based on the classification standard of the National Bureau of Statistics of China (National Bureau of Statistics of China, five high energy consumption industries in the manufacturing industry are processing of petroleum, coking and nuclear fuel processing industry, chemical raw materials and chemical products industry, smelting and processing of non-ferrous metals industry, smelting and processing of ferrous metals industry, and non-metallic mineral products industry.) in order to understand better how these spillovers affect different energy consumption groups and draw some policy implications. Should governments intervene, and if so, how? The analytical framework of this study can provide practical significance for the development and transformation of the manufacturing industry. No previous studies could obtain such analysis because of the limitation of the data structure.
The method used in the study is a dynamic panel estimator, system GMM, run on an unbalanced panel of industries spanning 2000–2018. This estimation method allowed us to explore the data’s time series and industry dimensions while controlling for omitted variables and endogeneity biases. We control for endogeneity and reverse causality with matrices of instruments based on lagged levels and lagged differences of the key independent variables. We conduct robustness checks varying the size of the instrumental matrices.
2. Literature Review and Theoretical Analysis
Energy efficiency and energy consumption are intrinsically linked. Increased energy efficiency can lead to significant reductions in energy consumption provided that measures are in place to discourage the occurrence of rebound effects. There is an extensive literature looking into the relationship between FDI and energy consumption. Table 1 presents the summary of previous studies and brief descriptions. It can be seen this relationship has been investigated in many different countries with different results. He et al. [25] used the multivariate VAR model to reveal that FDI has a positive impact on energy saving in Shanghai. Another study by Paramati et al. [26] found that FDI is a key factor driving down energy consumption from seven frontier market economies in Africa. Similar results were shown by Amoako and Insaidoo [27]. FDI was positively correlated with energy consumption in Ghana from 1981 to 2014. Doytch and Narayan [28] examined the relationship between FDI and energy demand. They believed that technology brought by FDI would reduce the use of non-clean energy and promote renewable energy, which is considered a source to improve energy efficiency. In Lee’s [29] study, the research found the FDI link with clean energy use compelling by analyzing panel data of 19 nations of G20 from 1971 to 2009. Conversely, Yue et al. [30] decomposed energy consumption intensity into the FDI scale effect, structure effect and technology effect, and found the FDI structure effect as well as the technology effect do not promote the reduction in energy consumption in Jiangsu Province. The empirical results in Bento [31] showed there is a negative effect of FDI on energy consumption. Using panel data of 17 countries in the South and Southeast Asian, Behera and Dash [32] cointegration results showed that primary energy consumption and FDI are substantially increasing the CO2 emissions and accelerating the regional environmental degradation.

Table 1.
Summary of the literature on FDI and energy efficiency.
2.1. The Mechanisms of the Impact of FDI Demonstration Effects on Energy Efficiency
A few studies have discussed FDI demonstration effects on local firms in the host countries of MNCs. Barry et al. [33] examined the US and UK firms in Ireland, find demonstration effects are important determinants of entry for US firms, while the evidence is not obvious for UK firms. Kumar [34] suggested that the production localization of MNCs is important not only for the technology transfer and diffusion, but more generally reflect the participation of local factors in the MNCs’ new value production. Cheung and Lin [35], in the study of provincial data, pointed to the importance of demonstration effects in minor innovations. Kokko [36] also emphasized that local firms can imitate the new technologies through direct contact with foreign affiliates and can therefore become more productive.
The demonstration effects are that local firms adopt and master similar production techniques of the MNCs through “learning by doing”. Based on sufficient absorptive capacity, the higher the degrees of production localization, the greater the effects are. A micro-level perspective can explain technology transfer and diffusion from FDI through production localization. The unit value-added of the production is determined by the enterprise’s technological level. The value-added products can happen in multiple production processes. If each process corresponds to a value-added intermediate product and contains the knowledge of the corresponding process, which involves production, design, and development technology, then the value-added products would include all the product’s technologies. Value-added rate is the ratio of value-added output to total output. MNCs’ value-added rate reflects the technological level, which determines the possibility of technology transfer and diffusion. In general, MNCs would strictly control the transfer and diffusion of advanced technology to the host country to maintain the technological monopoly. Under such circumstances, only low value-added production chains are transferred in producing locally. Local firms obtain limited technical information through imitation, which has little effect on energy efficiency improvement.
The spillover effects of MNCs reflected by the degree of production localization are distinct in different industries. When FDI enters high energy consumption industries, the demonstration effects might not necessarily be conducive to the improvement of energy efficiency. In some cases, the host country might relax the level of environmental regulations to attract more FDIs to enhance or maintain competitiveness in the world market. MNCs often need to pay more attention to pollution control and environmental protection under strict environmental regulations in developed countries, so the relatively loose environmental regulations in developing countries have become an important factor in attracting FDI. Under low level of environmental regulations, MNCs are likely to transfer some low energy efficiency technologies to local firms. After observing and learning such technologies, local firms’ energy efficiency will be reduced. In empirical research, Walter and Ugelow [37] pointed out that relatively loose environmental supervision and abundant environmental resources in developing countries have given them a comparative advantage in producing high energy consumption trade products, resulting in the trend of accumulation of high pollution industries in developing countries. Scott [38] revealed that MNCs can transfer production chains with high energy consumption to developing countries through FDI, or adopt relatively low environmental control technology for production in developing countries to achieve cost savings.
In contrast, the impact of FDI demonstration effects in low or middle energy consumption industries is uncertain. Industries at the low-end of the global value chains (GVCs) often consumes more primary energy resources in production, but the product’s value-added is very low. The technology gap between local and foreign firms in these industries is small. Imitating the advanced technology would not significantly increase value added in products, whereby energy utilization improvement is not obvious. For those industries at the high-end of GVCs, the production localization of MNCs is mainly production chains to manufacture low value-added products. Local employees seldom have exposure and master the advanced technologies. Intermediate products containing core technologies that still rely on imports cause drops in the input-output rate. If MNCs choose to transfer the advanced technology to localized production, local firms might not produce similar products to those produced by MNC affiliates because of a large technological gap. The flow of skilled workers from MNC affiliates to local firms is difficult; hence local firms would not have the opportunity to learn and imitate such technology. There might be also a large flow of skilled workers from local firms to MNC affiliates. Bessant et al. [39] emphasized that the ability to absorb key technologies largely depends on the local firms’ ability to continue learning and upgrading with new technological opportunities. The MNCs’ degree of production localization is the path-dependent way for local firms to obtain such knowledge and experiences. Labor mobility provides a channel for local firms to acquire the technology of related intermediate products successfully.
Summarizing the mechanisms that demonstration effects on the improvement of energy efficiency of the host country can be expressed as follows: degree of localization production of FDI, imitative learning, local firms’ technological progress, increase input-output rate, and improvement of energy efficiency.
2.2. The Mechanisms of the Impact of FDI Competition Effects on Energy Efficiency
The competition effects are such that the entry of MNCs may generate greater competition in the domestic market. Local firms are forced to adopt new technology to keep their market share stable through independent innovation, technology introduction, or imitation to increase productivity and become more efficient. The competition effects are often intimately related to the demonstration. Over time, in order to compete successfully with the MNCs, local firms attempt to imitate the behavior of the MNCs; however, the competition effects may also negatively affect the efficiency of local firms. Sari et al. [14] argued that the competition from MNCs may result in negative effects when economic profit is more than economic efficiency. Aitken and Harrison [10] reported that the increase in average costs in local firms is a factor for the negative spillover effects. Local firms may lose their market shares because of the presence of MNCs, which forces them to produce less efficiently, showing a consequence of the increase in the average costs.
The effects of different groups of industries differ. The technology gap between local firms and MNCs possibly determines the degree of competition, whether it happens in high energy consumption or low or middle energy consumption industries. When the technology gap is small, in order to gain market share under the pressure of competition, local firms will increase independent innovation activities and technology introduction to improve their technological level to produce intermediate inputs containing key technologies, increase productivity and efficiency. When the technology gap is large, MNC affiliates may bring in relatively new technologies from the parent company to gain market shares. The technology might leak out to the local firms through the flow of skilled workers and thereby increase the competition MNC affiliates face even more. Sjöholm [40], in the study of Indonesia industrial data, suggested that the larger the technology gap between domestic and foreign establishments, the larger the spillovers with a high degree of competition. On the other hand, when there is a large technology gap, local firms may be too weak to mount a competitive situation, whereas the locals will often decrease R&D investments but rely on technology introduction. Companies investing in robotics, among other digital technologies, are seeing productivity increase, but the cost involves risks creating a wider technology gap.
3. Methodology and Data
3.1. Total-Factor Energy Efficiency (TFEE)
Energy efficiency can be measured by energy intensity, which is a ratio of energy input to gross domestic product (GDP) [41]. The advantages of this measurement are intuitive definition and simplified calculation. However, this method neglects to take the contribution of labor and capital into account and has been criticized by many researchers. The total-factor energy efficiency (TFEE) is an indicator of incorporate energy input, labor, and capital as multiple inputs so as to the GDP output.
The Data Envelopment Analysis (DEA) originally proposed by Charnes et al. [42], is a non-parameter linear programming method to evaluate the relative effectiveness of multiple input and multiple output indicators, which has gained ground in energy efficiency. A DEA evaluates the performance of a set of DMUs, (DMUj:j = 1, 2, …, n), which generates multiple outputs by utilizing multiple inputs. Each DMU has a set of s outputs, yrj ( = 1, 2, …, s) and a set of m inputs, xij ( = 1, 2, …, m). However, the existing DEA model cannot further analyze and rank of efficient DMUs, basically it compares the efficient DMUs in the sample and provides an efficiency rating of efficient units. Here we will adopt the extended DEA measure called super-efficiency DEA introduced by Andersen and Petersen [43]. According to Zhu [44] and Chen [45], the model in the output-oriented can be described as follows:
Max θo
where θo is the efficiency score, xi0 and yr0 are the ith input and rth output, respectively, for a DMU under evaluation, are weights. All inputs, outputs, and weights must be non-negative.
This study used 26 manufacturing industries in Guangdong Province from 2000 to 2018. All the data originate from China’s statistical yearbook, Guangdong’s statistical yearbook, and the energy yearbook. According to the Cobb–Douglas production function [Y = f (K, L, E)], capital stock, labor force, and energy consumption are the input factors and one output carries out the energy efficiency analysis.
- Capital input (K). The commonly used measure to estimate the capital stock is the perpetual inventory method [46]. The main object of this research is the manufacturing industry, the capital depreciation rate of each industry must be determined manually when using the perpetual inventory measure, the result might not be accurate. Therefore, this study chooses the annual average balance of the net fixed assets in the manufacturing industry as the capital input indicator [47] and to deflate the value in a constant 2000 price with fixed asset investment price index, in order to eliminate the impact of price changes;
- Labor input (L). The annual average number of employees in all manufacturing industries;
- Energy input (E). The total amount of energy consumption in each manufacturing industry;
- Output (Y) is measured by industrial total output value of each manufacturing industry in constant 2000 as the output indicator.
3.2. Empirical Models
We investigated the effects of FDI on industrial energy consumption by controlling for openness, marketization, and energy prices. Our model is influenced by the studies of Sadorsky [48], which examines the question with panel data. Our empirical model is:
where subscripts represent industry ( = 1, …, 26) and represents year ( = 2000, …, 2018). , the dependent variable, is a measure of industrial total factor energy efficiency. and are the key independent variables in this study, which are FDI competition effects and demonstration effects, respectively. is the degree of openness. is the degree of marketization. is an index of energy prices. is a stochastic error term, and , , … , are unknown parameters to be estimated.
Linear dynamic panel models, such as Equation (1), contain unobserved effects which may be either fixed or random [49]. A dynamic unobserved effects model is characterized by the influence of lagged value of the dependent variable on its present value. This makes most standard estimation approaches bias [49]. Thus, if such a correlation exists, the model has a dynamic nature and bias results cannot be fixed by controlling for fixed or random effects. A generalized method of moments (GMM) is a method superior to fixed endogeneity problem in the data. In this approach, the unobserved is eliminated by using a first differencing transformation. The model of Arellano and Bond [49] was designed for circumstances with a large number of cross sections and a small time periods. Blundell and Bond [50] developed a system GMM estimator by expanding the instrument list to include instruments for the level equation. In this study, we used the system GMM approach to estimate the models.
Our data are arranged into two energy consumption panels: high energy consumption and low or middle energy consumption. To explore this data through the two energy consumption panels further, in Figure 2, we present the average energy consumption of two panels. The story that emerges from the figure is that the average using the energy of high energy consumption industries is relatively two to three times more than low or middle energy consumption industries. Based on this scenario, two panels’ regressions were carried out and analyzed.
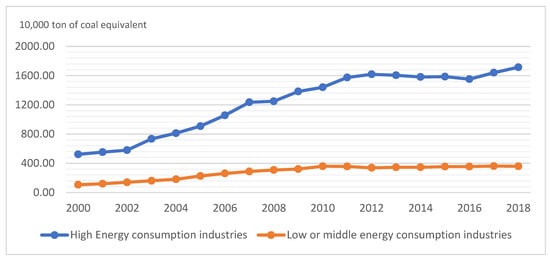
Figure 2.
Average value of energy consumption by panels during 2000–2018.
3.3. Data
This study used annual data on energy demand and FDI spillovers for 26 manufacturing industries in Guangdong Province. This panel data set is over the period from 2000 to 2018 by considering the data availability. All the variables are obtained from the Guangdong Statistical Yearbook, Guangdong Industrial Statistical Yearbook, and China Statistical Yearbook.
Aghion et al. [51] used the industry proportion of foreign-owned enterprises to reflect the FDI competition effects when examining the impact of FDI on British enterprises. We adopted the same measure here to use the total value of foreign-owned enterprises to the total value of all enterprises in the industry (recorded as Comp). Loc represents the demonstration effects and reflects the degree of foreign production localization, which is measured as the ratio of foreign added value to industry foreign value [13]. Under the assumption that local firms have sufficient learning ability, the higher the FDI production localization, the more production technologies local firms can obtain from foreign-funded enterprise production chains and improve the energy use of production.
In addition to FDI, the following control variables were used in this study, the degree of openness (Open) is measured by the ratio of industry export to total industrial sales value [52]. It is necessary to bring more investments in energy efficiency technologies with more liberalization and deregulation policies, which can provide access to high energy efficiency products. The positive impact of openness on energy efficiency is in line with several studies [53,54]. Marketization (Mark) is defined as the total value of non-state-owned enterprises divided by the total output value [55]. The accelerated marketization contributes to energy efficiency improvement. The measure to calculate the energy price (Price) is adopted from Li and Lin [56] to use producer price index (PPI) for raw materials, fuels, and power (at constant 2000 prices).
Table 2 shows the definitions and descriptive statistics for each of the variables. Table 3 shows the correlations between the panel data variables. For modelling purposes, all variables are expressed in natural logarithms. The energy efficiency variable shows the highest correlation with the marketization variable and the lowest correlation with the price variable. Notice that the openness variable and marketization variable have fairly high correlations with the FDI production localization variable. Other variables are all not highly correlated.
Table 2.
Variable definitions and descriptive statistics.
Table 3.
Correlations for the panel data set.
4. Empirical Results
4.1. Unit Root Test Results
We attempted to confirm that the same integration property exists for each of these variables when considered in a panel form. We addressed the issue of panel stationary by using three different panel unit root tests, namely the IPS test, LLC test, and the Breitung test. The results from the panel unit root tests are reported in Table 4 and are organized as follows. Column 2 consists of the LLC test, column 3 consists of the IPS test, while column 4 consists of the Breitung test. We found that three test statistics revealed consistent results: all the variables are panel non-stationary.
Table 4.
Panel unit root test results.
4.2. TFEE Estimation Results
This study used the super-efficiency DEA model to estimate the TFEE in different manufacturing industries from 2000 to 2018, and the average annual values are shown in Table 4. If TFEE is less than 1.00, it indicates that the energy use of this industry is ineffective, and there can be a waste of energy. When TFEE is greater or equal to 1.00, it means that the industry’s energy use is efficient. Table 5 shows the average annual value of TFEE in most of the manufacturing industries in Guangdong Province from 2000 to 2018 were greater than 1.00, while the processing of petroleum, coking, and nuclear fuel industry’s TFEE is only 0.511 and the manufacture of computers, communication and other electronic equipment is 0.977. The processing of petroleum, coking, and nuclear fuel industry is the second highest energy consumption industry, and accounts 15% of total energy consumption in the manufacturing sector. Most of the local firms in this industry are state-owned businesses, which are largely controlled by the state and have a government policy to support them. It is a monopoly industry with low competitiveness; hence, independent innovation, absorbing, and transforming foreign advanced technology is very slow. As a labor-intensive industry, this advantage gradually disappears because of the irreversible reduction in the labor force for a long period. Under this circumstance, the industry should try to accumulate human capital and competitive advantages to avoid falling into a passive position for energy efficiency improvement. Overall, energy input and carbon emissions are the main resistance to improving energy efficiency in energy-intensive industries [57].
Table 5.
The average annual value of TFEE for manufacturing industries in Guangdong Province, 2000–2018.
The manufacture of computers, communication, and other electronic equipment industry has shown relatively rapid development in recent years. However, the foundation for developing high-tech industries is not yet solid, and some of the industry’s problems need to be resolved, such as data centers, LCD screen manufacturing, new materials and other fields consuming relatively high energy resources. The other possible reason for the low energy efficiency is that the high-tech industry’s small and medium-sized local firms have fewer assets for mortgage and guarantee large investments in product research and development with long investment return periods. Firms are facing many difficulties in equity and debt financing. Technology improvement, research and development, and independent innovation capabilities are insufficient. Core technologies and components are still dependent on imports, especially in integrated circuits, key components, materials, and other technologies that cannot meet industry development needs. With a relatively high energy input, labor quality and capital become the crucial parts in manufacturing computers, communication and other electronic equipment to improve energy efficiency.
The energy efficiency of the manufacturing of non-metallic mineral products industry is the highest among high energy consumption industries, the nature of the sector itself determines this. Economies of scale are cost advantages as costs can be spread over larger goods when production becomes efficient. The lower costs can allow firms to pass those savings onto their customers through lower prices, enhancing their competitive advantage.
4.3. Estimation Results of Panel Regression
Panel estimates for the system GMM energy efficiency equation are reported in Table 6. Both the one-step and two-step GMM estimator are adopted here to calculate the estimation, and the results are consistent. The estimated coefficient on the lagged energy efficiency variable is positive, highly persistent, and statistically significant at 1% level indicating that energy efficiency in 1 year is heavily influenced by energy efficiency in the previous year. The estimated coefficient on the FDI competitive effects (Comp) is positive and statistically significant at the 5% level. In comparison, the estimated coefficient on the FDI demonstration effects (Loc) is negative and statistically significant at the 5% level in the model. The negative estimated coefficient on the open indicates that the degree of openness has a negative impact on energy efficiency in emerging economies. The negative estimated coefficient on the price variable indicates that the local firms can increase their energy demand over short periods of time even when prices are rising, which is the same as the results found in Sadorsky [48]. The estimated coefficient on the marketization variable is statistically significant at the 10% level. These results indicate that marketization has not much impact on energy efficiency in emerging economies.
Table 6.
System GMM panel estimation regression results.
The strongest results supporting the hypothesis that FDI increases energy efficiency comes from the spillovers using the FDI participation variable as a measure of competitive effects, while the demonstration effects are in the opposite position. In previous research, FDI has been found to improve energy efficiency [3,5,6], and in this study similar results were found.
Table 6 also includes some post estimation tests for autocorrelation and instrument validity. AR(2) is the Arellano and Bond [49] test for second-order autocorrelation in the first differenced errors. The p-value of AR(2) in the model is significantly higher than 0.1, implying that there is no second-order serial correlation for the random term. The Hansen test [49] is a test for overidentifying restrictions. The p-value of the Hansen test in the model is more significant than 0.1, reflecting the validity of the instrumental variable setting in the GMM estimation. These post estimation results indicate that the dynamic panel energy efficiency model is a reasonably good specification for energy efficiency in emerging economies.
Next step, we group the manufacturing industries by energy consumption to investigate the impact of FDI spillovers on energy efficiency. Table 7 presents results from the subsamples. Windmeijer [58] found that the estimated standard errors of the two-step GMM estimator were downward bias in the small sample. Since the observation data in the high energy consumption group is 85, the one-step system GMM is adopted here to estimate the model. To compare the coefficients of FDI demonstration effects and competitive effects between two groups, we employed the interaction term between Comp and the dummy variable d (d = 1 for high energy consumption group, d = 0 for low or middle energy consumption group), and Loc and d to draw conclusions about their difference in those coefficients.
Table 7.
System GMM panel estimation regression results for subsamples.
The coefficients comparison results are also reported in Table 7. We can see the estimated coefficient of LnLoc_d is significant but LnComp_d is not significant in the model. Such evidence reveals that the coefficient of LnLoc is significantly different between the two groups, which illustrates the effect of FDI spillovers can inhibit the energy efficiency more obviously in low or middle energy consumption industries.
A comparison of the empirical results of control variables in Table 7 with Table 6 show that the empirical estimates are fairly similar. The empirical results in Table 6 show that the estimated coefficients on Open and Price variable are each statistically significant with negative impact. The marketization variable is not statistically significant.
4.4. Robustness Check
In order to check the robustness of the preceding estimates, we used a different measurement for FDI competitive effects in the model. We replaced the existing measure of Comp by using the ratio of foreign industry sales value to industrial sales value. The estimation results are reported in Table 8. After comparing the results with previous estimates, we found that they are consistent, showing that the estimates are robust and effective.
Table 8.
Robustness test results.
5. Discussions
Beginning with the results for the high energy consumption group, we found that FDI competitive effects have a positive and statistically significant impact on energy efficiency. Such findings are consistent with previous research [3,4]. However, FDI demonstration effects have a statistically significant negative impact on energy efficiency. These results are consistent with the hypothesis. As explained earlier, local firms can increase investment in R&D, and adopt or imitate the new technology to gain competitive advantages. The local firms in these industries have strong economic strength with government support and the ability of technological transformation is high, so the technology gap between domestic and foreign establishments is not big. Local firms are not facing severe competition from the entry of FDI. From the production localization perspective, as MNCs put more local production lines in the host country, local firms can imitate and learn more technologies from production lines through close observation or by hiring technicians from MNC affiliates. Under the relaxed environmental regulations, MNCs are more likely to transfer high energy consumption and high pollution technologies due to the industries’ nature, which is not very helpful to improve the energy efficiency.
From the low or middle energy consumption group results, we can see it shows the similarity to the high energy consumption group. The possible reason is that FDI entered the labor-intensive traditional processing industries earlier due to high barriers to entry in capital-intensive industries. With China’s urbanization and the ageing population, the cost advantage of labor is gradually disappearing. Some original labor-intensive industries are shifting to countries with lower labor costs, such as Southeast Asia and India. China’s manufacturing industry is currently moving towards the direction of the high-end and intellectualization industry. FDI has been concentrated in the manufacture of computers, communication, and other electronic equipment, manufacture of electrical machinery and equipment, and manufacture of transportation in recent years. In these areas, China still needs to solve basic problems such as core basic parts and components, essential basic software, key basic materials, and advanced basic technology. Technology purchase and introduction are still better choices.
6. Conclusions and Policy Implications
6.1. Conclusions
This study proposes an approach to examine the relationship between FDI competitive effects, demonstration effects and energy efficiency, and tests this relationship empirically using industry level micro data. TFEE is measuring using a super-DEA approach to define a benchmark of best practice. Generalized method of moments is used to compute to control for possible endogeneity. The energy efficiency literature has emphasized the importance of FDI spillovers in helping improve energy utilization. To date, there is very little to say about the relationship between different FDI spillover effects and energy efficiency. This topic is likely to grow in importance as emerging economies develop. The empirical models fit the data well and pass a number of diagnostic tests. This study shows that FDI competitive effects, measured using the total value of foreign-owned enterprises to the total value of all enterprises in the industry, improve the energy efficiency for the manufacturing industry, but FDI demonstration effects prohibit energy efficiency improvement. Furthermore, we divided the total sample into two groups from the energy consumption perspective, high energy consumption and low or middle energy consumption groups. The research found that competitive effects of FDI spillovers have a significant positive impact on energy efficiency improvement in both groups, whereas the negative effect of demonstration effects are more obvious to the low or middle energy consumption group.
Due to the limitations of data, we only focused on the analysis of Guangdong’s manufacturing industry in the study. Although Guangdong’s unique position in economic development, the level of economic development in each region is different and cannot be generalized. Hence, the conclusions drawn based on the current research and relevant policy implications have great significance to other fast-growing regions such as Guangdong.
6.2. Policy Implications
These results are important for several reasons. Emerging economies that continue to promote the transformation and upgrading of the entire industrial chain of traditional industries focuses on a new generation of information technology, and target areas where weaknesses and shortcomings are concentrated. Enhancing the quality of foreign capital utilization and expanding FDI technology transfer and diffusion effects are essential to promote technological progress. Governments are advised to strengthen the policy guidance for FDI use in energy emission reduction, and strengthen MNCs’ energy emission goals. MNC affiliates in the low-energy, clean industries should be provided policy incentives and support to achieve the great combination of FDI and energy-saving and emission reduction. This way would avoid high energy consumption becoming a constraint in the development of the industry. For traditional industries with high energy consumption and high pollution, FDI should be suppressed through greater efforts. For high energy consumption industries with low energy efficiency, the government should guide local firms to energy-saving and carbon-reduction technological transformation, improving the energy efficiency of production and operation.
Our study drew some important conclusions and insightful suggestions for Guangdong Province to effectively improve energy efficiency in the manufacturing sector. The Guangdong-Hong Kong-Macao Greater Bay Area has played an important role in China’s economic development and opening up to the outside world. The Greater Bay Area has the advantages of industrial clusters, which is a strong foundation to support the achievements of transformation and innovation. Under the dual-cycle development pattern, the Greater Bay Area will further promote the integration of production, education, and research to become a leading international innovation center from scientific research and development to manufacturing.
In future studies, the service industry is an area worth examining the relationship between FDI spillovers and energy efficiency. In recent years, the proportion of China’s service industry attracting FDI has increased. With the rising labor costs in China, the manufacturing industry may no longer be the main industry for FDI. The service industry will eventually overtake the manufacturing industry and become the leading industry to attract FDI.
Author Contributions
Conceptualization, R.Z. and C.Z.; methodology, R.Z. and C.Z.; software, R.Z.; formal analysis, R.Z. and C.Z.; investigation, R.Z.; resources, R.Z.; data curation, R.Z.; writing—original draft preparation, R.Z.; writing—review and editing, R.Z.; supervision, C.Z. All authors have read and agreed to the published version of the manuscript.
Funding
This research received no external funding.
Data Availability Statement
The data that support the findings of this study are available upon request.
Conflicts of Interest
The authors declare no conflict of interest.
References
- Solarin, S.A.; Shahbaz, M.; Hammoudeh, S. Sustainable economic development in China: Modelling the role of hydroelectricity consumption in a multivariate framework. Energy 2019, 168, 516–531. [Google Scholar] [CrossRef]
- Blomstrom, M. Foreign Investment and Productive Efficiency: The Case of Mexico. J. Ind. Econ. 1986, 35, 97. [Google Scholar] [CrossRef]
- Zheng, W. Effects of China’s market-oriented economic reform, FDI inflows on electricity intensity. Energy 2021, 220, 119934. [Google Scholar] [CrossRef]
- Elliott, R.; Sun, P.; Chen, S. Energy intensity and foreign direct investment: A Chinese city-level study. Energy Econ. 2013, 40, 484–494. [Google Scholar] [CrossRef]
- Pan, X.; Guo, S.; Han, C.; Wang, M.; Song, J.; Liao, X. Influence of FDI quality on energy efficiency in China based on seemingly unrelated regression method. Energy 2020, 192, 116463. [Google Scholar] [CrossRef]
- Salim, R.; Yao, Y.; Chen, G.; Zhang, L. Can foreign direct investment harness energy consumption in China? A time series investigation. Energy Econ. 2017, 66, 43–53. [Google Scholar] [CrossRef]
- Hübler, M.; Keller, A. Energy savings via FDI? Empirical evidence from developing countries. Environ. Dev. Econ. 2010, 15, 59–80. [Google Scholar] [CrossRef] [Green Version]
- Kellerm, W. International Trade, Foreign Direct Investment and Technology Spillovers. Available online: https://ssrn.com/abstract=1498944 (accessed on 20 December 2021).
- Blomström, M.; Kokko, A. The Impact of Foreign Investment on Host Countries: A Review of the Empirical Evidence. 1996. Available online: https://www.researchgate.net/publication/200465457_The_Impact_of_Foreign_Investment_on_Host_Countries_A_Review_of_the_Empirical_Evidence (accessed on 20 December 2021).
- Aitken, B.J.; Harrison, A.E. Do Domestic Firms Benefit from Direct Foreign Investment? Evidence from Venezuela. Am. Econ. Rev. 1999, 89, 605–618. [Google Scholar] [CrossRef] [Green Version]
- Xu, B. Multinational enterprises, technology diffusion, and host country productivity growth. J. Dev. Econ. 2000, 62, 477–493. [Google Scholar] [CrossRef]
- Wang, S. Impact of FDI on energy efficiency: An analysis of the regional discrepancies in China. Nat. Hazards 2016, 85, 1209–1222. [Google Scholar] [CrossRef]
- Shen, K.R.; Fu, Y.H. The impact of technology transfer of FDI on the quality of domestic economic growth: A test based on China’s regional panel data. China Ind. Econ. 2010, 11, 5–15. [Google Scholar]
- Sari, D.W.; Khalifah, N.A.; Suyanto, S. The spillover effects of foreign direct investment on the firms’ productivity performances. J. Prod. Anal. 2016, 46, 199–233. [Google Scholar] [CrossRef]
- Wang, J. The economic impact of Special Economic Zones: Evidence from Chinese municipalities. J. Dev. Econ. 2013, 101, 133–147. [Google Scholar] [CrossRef]
- Borensztein, E.; De Gregorio, J.; Lee, J.-W. How does foreign direct investment affect economic growth? J. Int. Econ. 1998, 45, 115–135. [Google Scholar] [CrossRef] [Green Version]
- Raza, S.A.; Shah, N.; Arif, I. Relationship between FDI and Economic Growth in the Presence of Good Governance System: Evidence from OECD Countries. Glob. Bus. Rev. 2019, 22, 1471–1489. [Google Scholar] [CrossRef]
- Kosztowniak, A. What should the optimal financial structure of FDI inflows to Poland be for stimulating growth processes? J. Manag. Financ. Sci. 2021, 42, 25–38. [Google Scholar]
- Caves, R.E. Multinational Firms, Competition, and Productivity in Host-Country Markets. Economica 1974, 41, 176. [Google Scholar] [CrossRef]
- Boghean, C.; State, M. The relation between foreign direct investments (FDI) and labor productivity in the European Union countries. Procedia Econ. Financ. 2015, 32, 278–285. [Google Scholar] [CrossRef]
- Girma, S.; Greenaway, D.; Wakelin, K. Who Benefits from Foreign Direct Investment in the UK? Scott. J. Polit. Econ. 2001, 48, 119–133. [Google Scholar] [CrossRef]
- Woo, J. Productivity growth and technological diffusion through foreign direct investment. Econ. Inq. 2009, 47, 226–248. [Google Scholar] [CrossRef]
- Boyd, G.A.; Pang, J.X. Estimating the linkage between energy efficiency and productivity. Energy Policy 2000, 28, 289–296. [Google Scholar] [CrossRef]
- Hu, J.-L.; Wang, S.-C. Total-factor energy efficiency of regions in China. Energy Policy 2006, 34, 3206–3217. [Google Scholar] [CrossRef]
- He, W.F.; Gao, G.K.; Wang, Y.C. The relationship of energy consumption, economic growth and foreign direct investment in Shanghai. Adv. Appl. Econ. Financ. 2012, 3, 507–512. [Google Scholar]
- Paramati, S.R.; Bhattacharya, M.; Ozturk, I.; Zakari, A. Determinants of energy demand in African frontier market economies: An empirical investigation. Energy 2018, 148, 123–133. [Google Scholar] [CrossRef] [Green Version]
- Amoako, S.; Insaidoo, M. Symmetric impact of FDI on energy consumption: Evidence from Ghana. Energy 2021, 223, 120005. [Google Scholar] [CrossRef]
- Doytch, N.; Narayan, S. Does FDI influence renewable energy consumption? An analysis of sectoral FDI impact on renewable and non-renewable industrial energy consumption. Energy Econ. 2016, 54, 291–301. [Google Scholar] [CrossRef]
- Lee, J.W. The contribution of foreign direct investment to clean energy use, carbon emissions and economic growth. Energy Policy 2013, 55, 483–489. [Google Scholar] [CrossRef]
- Yue, T.; Long, R.Y.; Zhuang, Y.Y. Analysis of the FDI effect on energy consumption intensity in Jiangsu Province. Energy Procedia 2011, 5, 100–104. [Google Scholar]
- Bento, J.P. Energy Savings via Foreign Direct Investment?—Empirical Evidence from Portugal; Working Papers 2011/24; Maastricht School of Management: Maastricht, The Netherlands, 2011. [Google Scholar]
- Behera, S.R.; Dash, D.P. The effect of urbanization, energy consumption, and foreign direct investment on the carbon dioxide emission in the SSEA (South and Southeast Asian) region. Renew. Sustain. Energy Rev. 2017, 70, 96–106. [Google Scholar] [CrossRef]
- Barry, F.; Görg, H.; Strobl, E. Foreign direct investment, agglomerations, and demonstration effects: An empirical investigation. Rev. World Econ. 2003, 139, 583–600. [Google Scholar] [CrossRef] [Green Version]
- Kumar, N. Globalization and the Quality of Foreign Direct Investment; Oxford University Press: Oxford, UK, 2002. [Google Scholar]
- Cheung, K.-Y.; Lin, P. Spillover effects of FDI on innovation in China: Evidence from the provincial data. China Econ. Rev. 2004, 15, 25–44. [Google Scholar] [CrossRef] [Green Version]
- Kokko, A. Technology, market characteristics, and spillovers. J. Dev. Econ. 1994, 43, 279–293. [Google Scholar] [CrossRef]
- Walter, I.; Ugelow, J.L. Environmental policies in developing countries. Ambio 1979, 8, 102–109. [Google Scholar]
- Scott, T.M. Unbundling the pollution haven hypothesis. Adv. Econ. Anal. Policy 2005, 3, 1–28. [Google Scholar]
- Bessant, J.; Kaplinsky, R.; Lamming, R. Putting supply chain learning into practice. Int. J. Oper. Prod. Manag. 2003, 23, 167–184. [Google Scholar] [CrossRef] [Green Version]
- Sjöholm, F. Technology gap, competition and spillovers from direct foreign investment: Evidence from establishment data. J. Dev. Stud. 1999, 36, 53–73. [Google Scholar] [CrossRef]
- Patterson, M.G. What is energy efficiency? Concepts, indicators and methodological issues. Energy Policy 1996, 24, 377–390. [Google Scholar] [CrossRef]
- Charnes, A.; Cooper, W.W.; Rhodes, E. Measuring the efficiency of decision making units. Eur. J. Oper. Res. 1978, 2, 429–444. [Google Scholar] [CrossRef]
- Andersen, P.; Petersen, N.C. A Procedure for Ranking Efficient Units in Data Envelopment Analysis. Manag. Sci. 1993, 39, 1261–1264. [Google Scholar] [CrossRef]
- Zhu, J. Robustness of the efficient DMUs in data envelopment analysis. Eur. J. Oper. Res. 1996, 90, 451–460. [Google Scholar] [CrossRef]
- Chen, Y. Measuring super-efficiency in DEA in the presence of infeasibility. Eur. J. Oper. Res. 2005, 161, 545–551. [Google Scholar] [CrossRef]
- Goldsmith, R.D. A Perpetual Inventory of National Wealth. In Studies in Income and Wealth; NBER: Cambridge, MA, USA, 1951; Volume 14, pp. 5–73. [Google Scholar]
- Yuan, J.; Kang, J.-G.; Zhao, C.-H.; Hu, Z.-G. Energy consumption and economic growth: Evidence from China at both aggregated and disaggregated levels. Energy Econ. 2008, 30, 3077–3094. [Google Scholar] [CrossRef]
- Sadorsky, P. The impact of financial development on energy consumption in emerging economies. Energy Policy 2010, 38, 2528–2535. [Google Scholar] [CrossRef]
- Arellano, M.; Bond, S. Some Tests of Specification for Panel Data: Monte Carlo Evidence and an Application to Employment Equations. Rev. Econ. Stud. 1991, 58, 277. [Google Scholar] [CrossRef] [Green Version]
- Blundell, R.; Bond, S. Initial conditions and moment restrictions in dynamic panel data models. J. Econ. 1998, 87, 115–143. [Google Scholar] [CrossRef] [Green Version]
- Aghion, P.; Blundell, R.; Griffith, R.; Howitt, P.; Prantl, S. The Effects of Entry on Incumbent Innovation and Productivity; MIT Press Direct: Cambridge, MA, USA, 2009; Volume 91, pp. 20–32. [Google Scholar]
- Koengkan, M. The positive impact of trade openness on consumption of energy: Fresh evidence from Andean community countries. Energy 2018, 158, 936–943. [Google Scholar] [CrossRef]
- Narayan, P.K.; Smyth, R. Multivariate granger causality between electricity consumption, exports and GDP: Evidence from a panel of Middle Eastern countries. Energy Policy 2009, 37, 229–236. [Google Scholar] [CrossRef]
- Houssain, M.S. Panel estimation for CO2 emissions, energy consumption, economic growth, trade openness and urbanization of newly industrialized countries. Energy Policy 2011, 39, 6991–6999. [Google Scholar] [CrossRef]
- Fan, Y.; Liao, H.; Wei, Y.-M. Can market oriented economic reforms contribute to energy efficiency improvement? Evidence from China. Energy Policy 2007, 35, 2287–2295. [Google Scholar] [CrossRef]
- Li, K.; Lin, B. How to promote energy efficiency through technological progress in China? Energy 2018, 143, 812–821. [Google Scholar] [CrossRef]
- Zhu, L.; Luo, J.; Dong, Q.; Zhao, Y.; Wang, Y.; Wang, Y. Green technology innovation efficiency of energy-intensive industries in China from the perspective of shared resources: Dynamic change and improvement path. Technol. Forecast. Soc. Chang. 2021, 170, 120890. [Google Scholar] [CrossRef]
- Windmeijer, F. A finite sample correction for the variance of linear efficient two-step GMM estimators. J. Econ. 2005, 126, 25–51. [Google Scholar] [CrossRef]
Publisher’s Note: MDPI stays neutral with regard to jurisdictional claims in published maps and institutional affiliations. |
© 2022 by the authors. Licensee MDPI, Basel, Switzerland. This article is an open access article distributed under the terms and conditions of the Creative Commons Attribution (CC BY) license (https://creativecommons.org/licenses/by/4.0/).