Article

Construction of the Evaluation Model of Open Government Data Platform: From the Perspective of Citizens’ Sustainable Use

School of Economic and Management, Xiamen University of Technology, Xiamen 361005, China
*
Author to whom correspondence should be addressed.
Sustainability 2022, 14(3), 1415; https://doi.org/10.3390/su14031415
Submission received: 29 December 2021 / Revised: 13 January 2022 / Accepted: 19 January 2022 / Published: 26 January 2022

Abstract

:
Under the background of big data, citizens can freely access and use open data to create value through the open government data platform (OGDP). The sustainable use of OGDP can meet the needs of citizens. The value created by citizens can also improve quality of life, which is of great significance to the sustainable development of society. From the citizens’ perspective, we constructed an evaluation model of citizens’ sustainable use of OGDP, including 12 indicators in four dimensions: Data, platform, outcome, and citizen. We have built the complete evaluation system with the DANP (Decision-Making Trial and Evaluation Laboratory-Based Analytic Network Process) method. It explores the main influencing factors and mutual influence of citizens’ sustainable use of OGDP. Empirical research is done on four provincial OGDPs in China’s Shanghai, Zhejiang, Guizhou, and Fujian provinces. The TOPSIS (Technique for Order Preference by Similarity to an Ideal Solution) method was used to rank the OGDPs in four pilot areas in empirical research. The results demonstrate that the improvement priorities of dimensions have the following order: Citizen, outcome, data, and platform, in which data and platform are cause dimensions, and outcome and citizen are result dimensions. The satisfaction indicator has the highest weight among all evaluation indicators, followed by the quality and quantity of outcomes. The one with the lowest weight is non-discrimination. The empirical results show that the OGDP in Zhejiang ranks the highest overall, followed by the OGDPs of Shanghai, Fujian, and Guizhou provinces. In the outcome and citizen dimensions, Zhejiang provincial OGDP does the best. Fujian provincial OGDP does the best in the platform dimension. The citizens’ sustainable use of OGDP can be promoted by timely opening of data that citizens need urgently, perfecting the policy of privacy protection and user guide of OGDP, holding open data innovation competition, providing data visualization function, providing various download formats of data sets, and simplifying the download procedures for citizens.

1. Introduction

During the process of providing public services for citizens, the government has accumulated a large amount of data. On the premise of ensuring public safety and personal privacy, the data can be made open to citizens through the open government data platform (OGDP) for new value creation [1]. Citizens can freely access and use open data through the OGDP [2]. Citizens can learn the latest policy information through open data, which is helpful to improve the transparency of government work and the participation of citizens in public management [3]. By using and reusing open data, citizens can develop applications and services that benefit themselves, stimulate industrial innovation, and provide new economic opportunities, thus creating economic and social values [4]. During this process, the demand for government information can be met, and the value creation of open data and the life quality of citizens can be promoted by sustainable use of OGDP. Above all, it is one of the key paths for sustainable development to promote citizens’ sustainable use of OGDP.
By the end of April 2021, 174 provincial, sub-provincial, and prefecture-level governments in China had established OGDPs [5]. While providing open data for citizens to create value, OGDPs also have some problems, such as unbalanced development [6], uneven data quality, and low data utilization rate [7]. An evaluation can help us better find and solve the problems in the construction of OGDP. Citizens are the end users of OGDP. Only when citizens actively query, obtain, and use open data provided by OGDP can new values be generated. Thus, it is particularly important to build a sustainable use evaluation system of OGDP from the citizens’ perspective. At present, scholars mainly evaluate the OGDP from the perspective of the government. Lourenço explored whether the current organizational structure can support the transparency of the accountability system by analyzing some famous OGDPs [8]. Máchová et al. evaluated the quality of the national-level OGDP by proposing and verifying a benchmark framework [9]. Machado et al. developed an evaluation tool for the construction of OGDP from governments’ perspectives and evaluated the functions of OGDP and the free access means of information [10]. To sum up, there is little research on the overall evaluation from the citizens’ perspective. Only when citizens use and reuse open data of OGDP sustainably can new value be created. Therefore, it is important for the sustainable creation of value to clarify the influencing factors of citizens’ sustainable use of OGDP and suggest improvement views.
As an important medium for open government data, OGDP undertakes multiple tasks such as opening government data, collecting citizens’ needs, serving citizens, and communicating with citizens [1]. Thus, when evaluating the OGDP, it is necessary to adopt multiple indicators from multiple aspects to conduct evaluation research [6]. The DANP method is a method that combines the Decision-Making Trial and Evaluation Laboratory (DEMATEL) method with the Analytic Network Process (ANP) method to obtain stable limit supermatrix and element weights [11]. The DEMATEL method is suitable for analyzing the logical relationship and mutual influence relationship between the indicators in a specific system, but it cannot determine the specific impact weight of each indicator [11]. On the basis of considering the influence relationship between each indicator, the ANP method can determine the specific impact weight of each indicator in the system [12]. However, the questionnaire design of the ANP method is complicated, and the calculation process of pairwise comparison is time consuming and difficult to understand [12]. The DANP method retains the advantages of the two methods. It can determine the interdependence among the indicators and reduce the frequency of pairwise comparisons between elements when calculating the weights, thus reflecting the reality more objectively [12,13]. In recent years, the DANP method has been well applied in the research of online catering platform evaluation [14], vehicle procurement evaluation [15], electronic health record evaluation [16], and green building evaluation [17]. There are few studies on applying the DANP method to the OGDP evaluation. Meanwhile, the TOPSIS method has been widely used in empirical research, such as online catering platform evaluation [14] and vehicle procurement evaluation [15]. Based on the citizens’ perspective, this study applies the DANP method to construct the citizens’ sustainable use evaluation model of OGDP and applies the TOPSIS method to determine the comprehensive ranking of OGDPs in four pilot areas. In summary, the investigation aimed to:
  • Based on citizens’ perspectives, clarify the influencing factors and determine the evaluation dimensions and indicators of citizens’ sustainable use of OGDP.
  • Clarify the influence relations and weights of the evaluation dimensions and indicators using the DANP method, and establish the citizens’ sustainable use evaluation model of OGDP.
  • Apply the evaluation model constructed in the study to evaluate four provincial OGDPs in Shanghai, Zhejiang, Guizhou, and Fujian provinces, and analyze the current situation of citizens’ sustainable use of OGDP in China.
  • According to the research results, put forward management suggestions to promote citizens’ sustainable OGDP use.
The remainder of this paper is organized as follows. Section 2 reviews the research status of citizens’ use and the evaluation of OGDP. Section 3 elaborates the evaluation dimensions and indicators of citizens’ sustainable use of OGDP, from the perspective of citizens based on previous studies. Section 4 is the methodology, introducing the DANP method and TOPSIS method used in this study. The data analysis and results are presented in Section 5. The empirical study is elaborated in Section 6, and Section 7 presents the conclusions.

2. Literature Review

2.1. Use of OGDP

In recent years, the influencing factors and utilization outcomes of citizens’ use of OGDP have been fully studied. Zeleti et al. developed the six-value business model by open data of OGDP, enabling enterprises to realize innovative management and provide new employment opportunities to create economic value [18]. Gao et al. established the citizens’ initial adoption model of OGDP, which showed that perceived trust, performance expectation, and convenience conditions had a significant influence on the citizens’ initial adoption intention and behavior of OGDP [19]. Through building a citizens’ use willingness model of OGDP, Zhu et al. found that environmental stimulus and flow conditions positively influenced citizens’ willingness to use OGDP sustainably through citizens’ flow experience [20]. Rettore et al. established an intelligent transportation system by the vehicle data of OGDP, which improved the efficiency and safety of traffic [21]. Bulai et al. used open data of Romania to build community clusters and draw maps, which help enterprises and policymakers better estimate citizens’ income levels [22]. Analyzing the data related to the elderly of OGDP, Hou et al. argued that the matching degree between welfare services and the needs of the elderly should be strengthened for the maximum realization of social welfare services [23]. By constructing an integrated influencing factors framework for citizens’ sustainable use of open data, Chen et al. held that citizens, tasks, systems, environment, and initial acceptance behavior were the main factors promoting citizens’ sustainable OGDP use [24].
Overall, the existing research on citizens’ use of OGDP is mainly focused on the influencing factors and utilization of outcomes. However, there is a lack of research on the current situation of citizens’ sustainable use of OGDP. Only when citizens sustainably use OGDP to obtain and use open data will they create political, economic, and social values sustainably and promote the sustainable development of society. Therefore, we focus on the citizens’ sustainable use status quo of OGDP. The evaluation method and empirical method are used to study it.

2.2. Evaluation of OGDP

In recent years, the OGDP has been mainly evaluated from the overall level and specific angle level. From governments’ perspective, an overall evaluation system of OGDP was established in China Open Data Index, including 17 indicators in four dimensions: Readiness, platform, data, and utilization [6]. It is argued that the construction of OGDP can be strengthened from the aspects of policy supply, organizational guarantee, normal operation, function optimization, data utilization, and ecological cultivation [6]. Chatfield et al. evaluated the service capability of OGDP according to the strength of policy, open data provision, diversity of data formats, and entrepreneurial data services [25]. Máchová et al. selected the indicators of technology, language support, usability, accessibility, API, topic classification, keywords, and communication to evaluate the OGDP [9]. In the overall evaluation research of OGDP, it can be seen that the evaluation is mainly from the perspective of government.
Some specific perspectives have been used to evaluate the OGDP, like operation efficiency, satisfaction, participation, and data quality. Hai et al. evaluated the operation efficiency of OGDP from the point of view of government. Their study showed that the open awareness of government and rational allocation of resources should be strengthened to improve the operating efficiency of OGDP [26]. Osman et al. evaluated the satisfaction of OGDP from the perspective of citizens and found that the benefits and risks are the main influencing factors [27]. Zhu et al. evaluated the participation of OGDP from the perspective of citizens and found that citizens lacked a deeper understanding of open data [28]. Vetrò et al. constructed an evaluation framework of OGDP at the data level and applied it in Italy. They argued that the traceability and integrity of open data were poor [29]. Charalabidis et al. evaluated the data quality of OGDP from seven aspects: Data quantity, usefulness, integrity, accuracy, data theme, timeliness, and data from different countries [30].
In summary, the overall evaluation of OGDP from the perspective of the government has received a lot of research attention. However, research on the overall evaluation of OGDP from the perspective of citizens is lacking. Only when citizens use the OGDP sustainably can they promote the use and reuse of open data, the value creation of open data, and the sustainable development of society. Therefore, it is of great significance to construct the sustainable use evaluation model of OGDP from the perspective of citizens.

3. Evaluation Dimensions and Indicators

During the process of citizens using OGDP, it can be seen that the utilization effect of citizens on data is closely related to open data [31]. Data is the core of OGDP governance. Improving the quality of open data can save OGDP governance costs and promote the high-quality development of OGDP [31]. The services provided by OGDP will affect citizens’ feelings of using OGDP and whether citizens will use OGDP sustainably [30]. The platform is the foundation of OGDP governance. By optimizing the services provided by OGDP, faster and better development of OGDP can be promoted [30]. Outcomes refer to service applications generated by citizens using open data, which can provide richer services for citizens [6]. As an important part of OGDP governance, the strengthening of results utilization and transformation can promote OGDP to better serve citizens [6]. During this process, the technical literacy of citizens will affect the use effect of OGDP [32]. Citizens are the ultimate servants of OGDP governance. Understanding citizens’ satisfaction and real need for open data can help OGDP be more sustainable [32]. Therefore, this study adopts four dimensions (data, platform, outcome, and citizen) to construct the sustainable use evaluation model of OGDP from the perspective of citizens.

3.1. Data Dimension

Data quality directly affects the data utilization value of citizens [31,33]. Data quality is affected by the coverage, update frequency, and format diversification of open data [29,34]. That is the comprehensiveness, accuracy, timeliness, and flexibility in this study. Tan et al. have evaluated the data quality of OGDP from the aspects of comprehensiveness, timeliness, and diversity [35]. Máchová et al. evaluated the data quality from the aspects of update date, geographical coverage, and data format [9]. Thus, four indicators, comprehensiveness, accuracy, timeliness, and flexibility, are used to evaluate the data dimension.

3.2. Platform Dimension

When using the network platform, citizens first need to ensure security. It is necessary to ensure that the private information of citizens will not be leaked [9]. Non-discrimination refers to ensuring that citizens can normally use the functions and services of OGDP [30]. A good platform also needs a neat page design, which is convenient for citizens to operate [2]. In other words, it is the usability of OGDP. Interactivity is a very important feature of the current Internet environment. The platform can interact with citizens, thus creating a good atmosphere and shortening the distance between citizens and the platform [5]. Therefore, four indicators, security, non-discrimination, usability, and interaction, are used to evaluate the platform dimension [30].

3.3. Outcome Dimension

The type of outcome refers to the richness of outcomes, reflecting the available fields and ways of open data [6]. The quantity of outcomes is an indicator that can directly reflect the data utilization results [6]. The quality of outcomes refers to the actual application condition of outcomes [6]. The poor quality of outcomes will cause a waste of resources, and the truly useful outcomes can bring benefits [5]. Therefore, three indicators of outcome (type, quality, and quantity) are used to evaluate the outcome dimension.

3.4. Citizen Dimension

The ability of citizens to use open data will directly affect the effect of open government data [36]. The quality of outcomes and the degree of satisfaction can be reflected by the satisfaction of citizens with data or products. Satisfaction is often analyzed in combination with expectations so as to better explore the psychological state of citizens [27]. To sum up, this study uses utilization ability, expectation, and satisfaction to evaluate the citizen dimension. The final evaluation dimensions and indicators are shown in Table 1.

4. Methodology

4.1. DANP Method

At present, the DANP method has been well applied in the fields of online catering platform evaluation [14], vehicle purchase evaluation [15], electronic health record evaluation [16], and green building evaluation [17]. Therefore, this study uses the DANP method to calculate the weight of evaluation dimensions and indicators and construct the influential network relation map (INRM). Based on the above research results, this paper also puts forward management suggestions for the construction of OGDP in China.
The DANP method is a combination of DEMATEL and ANP. The comprehensive influence matrix of DEMATEL is directly used as the unweighted supermatrix of ANP, and the stable limit supermatrix is obtained to calculate the element weight [37]. The DANP method combines the advantages of the two methods and makes up for the deficiency of ANP. This reduces the number of pairwise comparisons between elements and can reflect reality more objectively when calculating the weight [38]. Thus, the DANP method can be used to solve real-world problems with feedback and interaction between criteria or dimensions and to determine the affecting weights [13]. In order to determine the influence weight of each evaluation dimension and indicator, the DANP method was used to process and calculate the expert questionnaire data. The specific steps are as follows.
Step 1: Build a direct impact matrix. Calculate the arithmetic average of the scoring table of direct influence degree between every two indicators scored by experts, and get the direct influence matrix A, as shown in Equation (1).
A = a i j m
Step 2: Calculate the normalized matrix, as shown in Equations (2) and (3).
D = s × A
s = m i n 1 m a x 1 i n j = 1 n a i j , 1 m a x 1 i n i = 1 n a i j
Step 3: Calculate the comprehensive influence matrix of evaluation dimensions and indicators, respectively. Using the normalized matrix D through Equation (4), the comprehensive influence matrices of dimension and index are G Y and G y .
G = D + D 2 + D 3 + = D E D 1
Step 4: Calculate the standardized matrix. Standardize the comprehensive influence matrices G Y and G y according to Equations (5)–(7) to obtain standardized matrices G Y c   and G y c , in which G y c ij is the submatrix of order m i   ×   m j in G y c .
G Y C = g Y c i j m × m = g Y 11 / d 1 g Y 1 j / d 1 g Y 1 m / d 1 g Y i 1 / d i g Y i j / d i g Y i m / d i g Y m 1 / d m g Y m j / d m g Y m m / d m
d i = j = 1 m g Y i j , i = 1 , 2 , , m
G y c = G y c 11 G y c 1 j G y c 1 m G y c i 1 G y c i j G y c i m G y c m 1 G y c m j G y c m m
Step 5: Calculate the unweighted supermatrix W ij . Transpose the standardized matrix G y c obtained in the previous step with Equation (8).
W = G y c T
Step 6: Calculate the weighted supermatrix W c , as shown in Equation (9).
W c = G y c W
Step 7: Calculate the limit supermatrix. The weighted supermatrix is multiplied until it converges so as to determine the weight of each dimension and indicator, as shown in Equation (10).
W μ = l i m μ W c μ

4.2. TOPSIS Method

TOPSIS was first proposed in 1981 [39]. The main idea of the TOPSIS method is to first determine the positive and negative ideal values of each indicator. The positive ideal value refers to the assumed optimal value scheme, in which each attribute value reaches the optimal value of each candidate scheme as a positive ideal goal. The negative ideal solution is the worst value scheme of another hypothesis, as the negative ideal goal. Secondly, the distance between each scheme and the positive and negative ideal values is calculated by using the Euclidean distance. Finally, the approach degree of each scheme to the affirmative ideal goal is obtained. The best result is the closest to affirming the ideal goal and the farthest from denying the ideal goal. For several schemes, the distance between each evaluation goal and the positive ideal goal and the negative ideal goal is calculated, respectively, and the ranking is obtained according to the closeness of ideal solutions. The specific steps are as follows.
Step 1: Establish a decision matrix. Design the evaluation indicator scoring table, which includes qualitative indicator and quantitative indicator. There are targets of evaluation D1, D2, …, DM. Each target has the evaluation indicators x1, x2, …, xn. The feature matrix D is shown in Equation (11).
D = x 11 x 1 j x 1 n x i 1 x i j x i n x m 1 x m j x m n = D 1 X 1 D i X j D m X n
Step 2: Calculate the normalized matrix. Establish the normalization matrix of the normalization vector, in which i = 1, 2, …, m, j = 1, 2, …, n, as shown in Equation (12).
r i j = x i j i = 1 m x i j 2
Step 3: Calculate the weighted decision matrix Z. Z is obtained by point multiplication of the weights of each indicator in the matrix and the elements in the normalized matrix.
Step 4: Calculate the positive ideal solution z+ and the negative ideal solution z. They can be determined by Equations (13) and (14), in which i = 1, 2, …, m.
z + = m a x Z i 1 , Z i 2 , , Z i n
z = m i n Z i 1 , Z i 2 , , Z i n
Step 5: Calculate the Euclidean distance between each evaluation factor and positive ideal solution D+ and negative ideal solution D by Equations (15) and (16).
D i + = j = 1 n r i j z j + 2
D i = j = 1 n r i j z j 2
Step 6: Calculate the ideal closeness, as shown in Equation (17). The evaluation targets are sorted according to the ideal paste progress value Ci. The smaller the Ci value, the closer the evaluation target is to the positive ideal solution.
C i = D i D i + + D i

5. Data Analysis

5.1. Data Collection

In this study, the expert questionnaire was used to collect data. The questionnaire, presented in Supplementary Materials, includes three parts: Questionnaire description, expert attributes, and comparative items. When the questionnaire is distributed and explained to experts, the experts are asked to fill in the questionnaire on the spot. The completion time of each questionnaire is 1 to 1.5 h. Experts use a five-point system to score the mutual influence degree of every two indicators at the same level; 0–4 stands for “no impact”, “low impact”, “medium impact”, “high impact”, and “extremely high impact” in turn. The survey was completed in March 2021, and 14 questionnaires were collected. There were five experts from universities and research institutions, four experts from enterprises, and five experts from the government. There were nine experts who have senior professional titles and 12 experts who have worked for more than 10 years. The inconsistent rate of the questionnaire was 4.04%, less than 5%. This shows that the questionnaire can reflect the real situation, and the additional quantity will not change the overall result.

5.2. Calculation of Weight

We standardized the returned questionnaire data according to Equations (1)–(3) and obtained the normalized matrix shown in Table A2 in Appendix A. Then Equation (4) was used to get the centrality and cause of each dimension indicator shown in Table 2. Equations (5)–(9) were used to calculate the weighted supermatrix W c , as shown in Table A6 in Appendix A. Equation (10) was used to obtain the limit supermatrix W μ , as shown in Table A7 in Appendix A. The results are shown in Table 2. In terms of dimension, the citizen dimension has the highest centrality, which is the key core factor. The outcome dimension and citizen dimension have negative cause values, which are the result factors. The cause value of the data dimension and platform dimension is positive, which is the cause factor. The platform dimension has the largest cause value, which can affect the other three evaluation dimensions.
In the citizens’ sustainable use evaluation model of OGDP, the weights of the four dimensions are relatively close. The citizen dimension has the largest weight, which is consistent with the highest centrality value of the citizen dimension, followed by the outcome dimension and data dimension. The platform dimension has the smallest weight value, which means it is relatively the least important, which is consistent with the lowest centrality value of platform dimension in Table 2. From the evaluation indicator, satisfaction has the highest weight among all indicators, followed by the quality and quantity of outcomes. Non-discrimination is the indicator with the lowest weight.
The satisfaction indicator has the highest weight, which is the most important indicator in the citizen dimension and the highest weight indicator among all evaluation indicators, followed by expectation and utilization ability. In the outcome dimension, the outcome quality was the most important indicator, followed by the outcome quantity, and the weight difference between them is small. Outcome type was the least important indicator under the outcome dimension. In the data dimension, accuracy was the most important indicator, followed by flexibility and timeliness. The comprehensive indicator has the lowest weight, which is relatively the least important indicator in the data dimension. In the platform dimension, interactivity is the most important indicator, followed by usability and security. Non-discrimination is the indicator with the smallest weight among all evaluation indicators. This shows that non-discrimination will not be considered emphatically when evaluating the current situation of citizens’ sustainable use of OGDP.

5.3. INRM Construction

With centrality as abscissa and cause as ordinate, the INRM of dimensions and indicators is drawn, as shown in Figure 1. In the data dimension, timeliness, as the highest cause factor, affects comprehensiveness, accuracy, and flexibility. Accuracy is the one with the lowest degree of cause and the most affected degree. In the platform dimension, interactivity is the resulting factor, which is influenced by usability, security, and non-discrimination. In the outcome dimension, the type, quantity, and quality of outcomes are all the result factors. The outcome type affects the outcome quantity and outcome quality. In the citizen dimension, the utilization ability is the cause factor, which affects the expectation and satisfaction of citizens.

6. Empirical Research

6.1. Object Selection and Indicator Quantification

One of the aims of this study was to analyze the actual situation of citizens’ sustainable use of OGDP by using the evaluation tool from the perspective of citizens so as to help managers find out the weaknesses in the current construction of OGDP and provide management suggestions. So, this study considered the data set from China and used the sustainable use evaluation model of OGDP for empirical research. In 2018, the Chinese government took Shanghai, Zhejiang, Guizhou, and Fujian provinces as pilot areas for open government data [40]. The OGDPs in these four pilot areas are all in the top ten in China Open Data Index in 2020 [6]. Therefore, the empirical data of this study comes from four OGDPs: Shanghai (https://data.sh.gov.cn/), Zhejiang (http://data.zjzwfw.gov.cn/), Guizhou (http://data.guizhou.gov.cn/), and Fujian (https://data.fujian.gov.cn/). Accessed on 15 December 2021.
To quantitatively analyze the evaluation indicators of OGDP, the meaning of the evaluation indicators in Table 1 is further elaborated. The scoring standard is set for the indicators described qualitatively, as shown in Table 3.

6.2. Data Analysis

In this study, the information of data sets, information of outcomes displayed on OGDP, and scoring information of data sets were collected by data crawling and manual observation. Each evaluation indicator was scored according to the scoring standard. The data was collected on 18 September 2021. The normalization method was used to de-dimension the original dimensional data. The TOPSIS method is used to rank and calculate four OGDPs in Shanghai, Zhejiang, Guizhou, and Fujian provinces. Based on the weights of various dimensions and indicators obtained by the DANP method, we used the TOPSIS method to calculate the collected objective data to obtain the final ranking of OGDPs of the four pilot regions. The positive and negative ideal solutions calculated according to Equations (11)–(16) are shown in Table A10 in Appendix A. We used Equation (17) to calculate the ideal proximity of four OGDPs, as shown in Table 4. It can be seen that the comprehensive ranking of the OGDP in Zhejiang is the highest, followed by the OGDPs of Shanghai and Fujian provinces. The last one is the OGDP in Guizhou.
The weights of each evaluation dimension and indicator are calculated as shown in Figure 2 and Figure 3. In terms of data, Zhejiang province has done the best, followed by Fujian, Guizhou, and Shanghai. In terms of platform, Fujian province has done the best, followed by Shanghai, Zhejiang, and Guizhou provinces. In terms of outcomes, Zhejiang province has done the best, followed by Shanghai, Guizhou, and Fujian provinces. In terms of citizens, Zhejiang province has done the best, followed by Shanghai, Guizhou, and Fujian provinces.
The weights of indicators of four OGDPs can be seen from Figure 3. Indicators without bars in Figure 3 have an indicator value of 0, such as Shanghai and Guizhou Province’s scores for flexibility indicators. This is because there are data with a score of either 0 or 1 in the indicator scoring standard setting and data collection. It can be seen that the OGDP in Shanghai has the highest score of outcome dimension and the lowest score of data dimension. The indicators of outcome quantity, non-discrimination, and outcome quality scored the highest. The score of flexibility and safety indicator is the lowest. The citizen dimension score of OGDP in Zhejiang is the highest, while the platform dimension score is the lowest. Expectation, outcome type, and outcome quantity indicators scored the highest. The non-discriminatory indicator has the lowest score. The OGDP in Guizhou has the highest outcome dimension score and the lowest platform dimension score. The outcome quality indicator scored the highest. Flexibility, usability, and non-discrimination had the lowest scores. The OGDP in Fujian had the highest platform dimension score and the lowest outcome dimension score. Non-discrimination and flexibility indicators scored the highest. And the outcome quality indicator had the lowest score.

7. Conclusions

7.1. Results

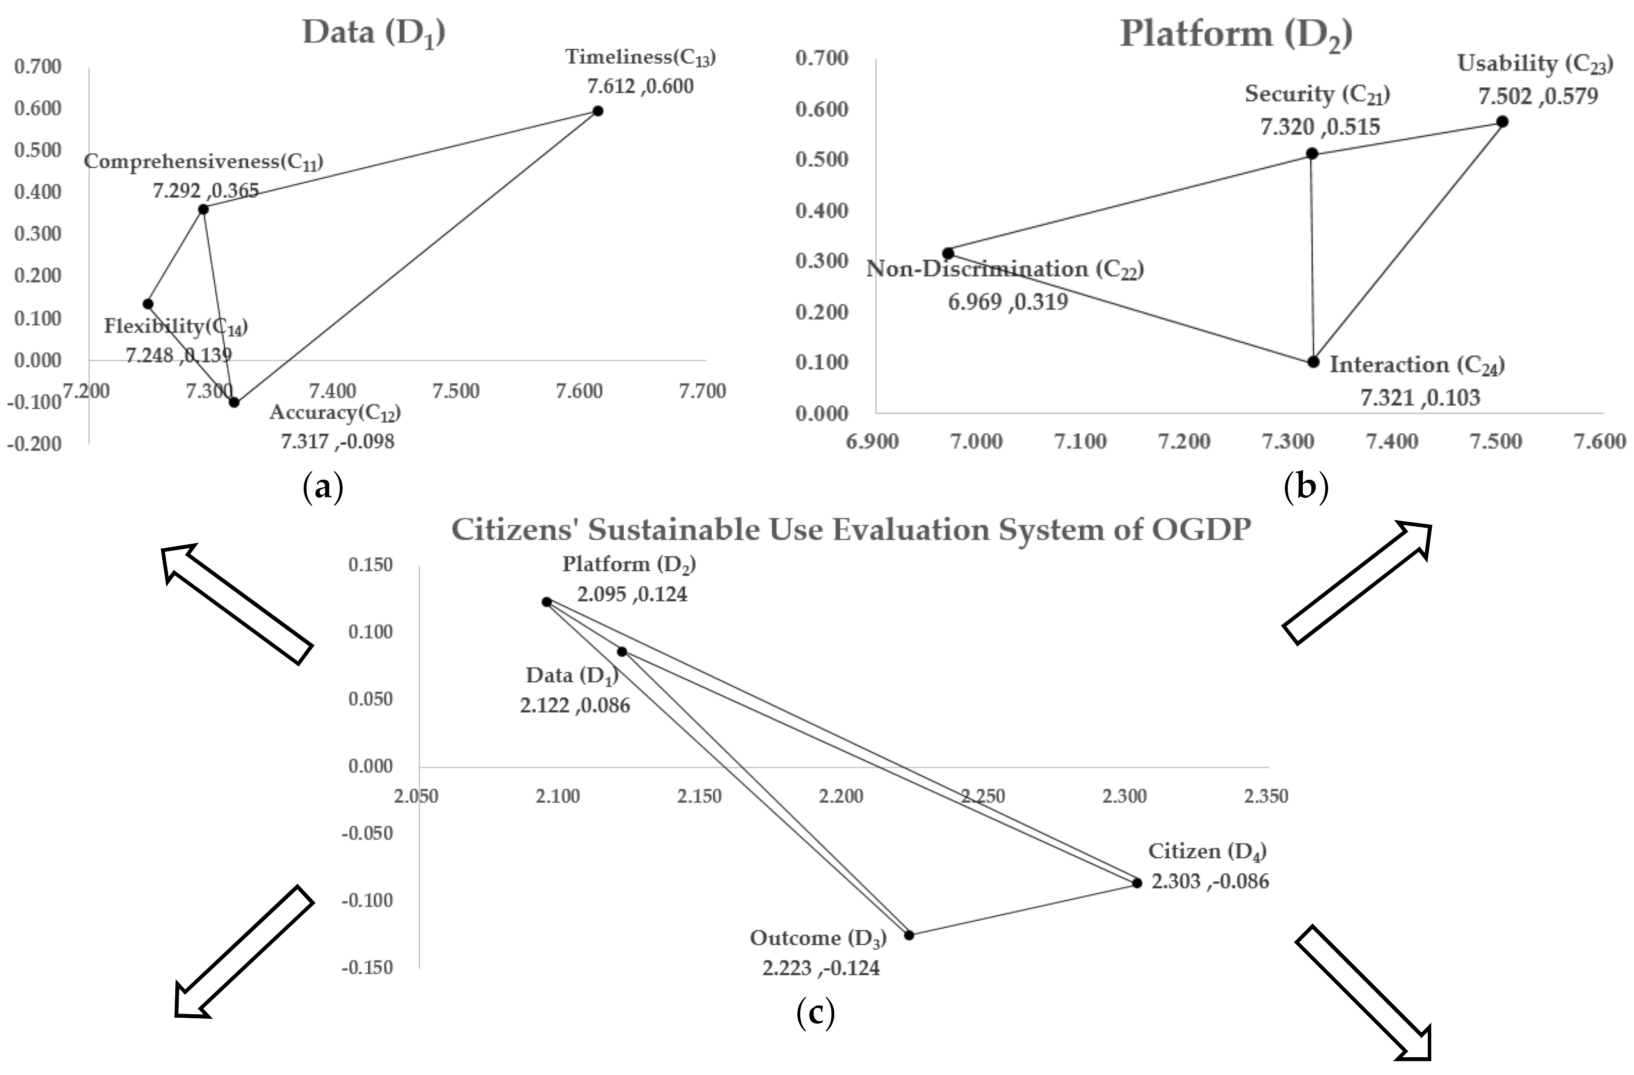
First, from the influence factors of OGDP, data, and platform are the cause factors, and outcome and citizen are the result factors. The platform dimension has the highest degree of cause, which affects the other three evaluation dimensions. The outcome dimension has the lowest degree of cause and is influenced by the other three dimensions. Judging from the weights of evaluation dimensions, the citizen dimension has the highest weight, followed by outcome, data, and platform dimensions. Specifically, among data dimensions, timeliness is the indicator with the highest degree of cause, which affects comprehensiveness, accuracy, and flexibility. Accuracy is the indicator with the lowest degree of cause and is affected by the other three indicators. This is consistent with the research results of Vetrò et al. [
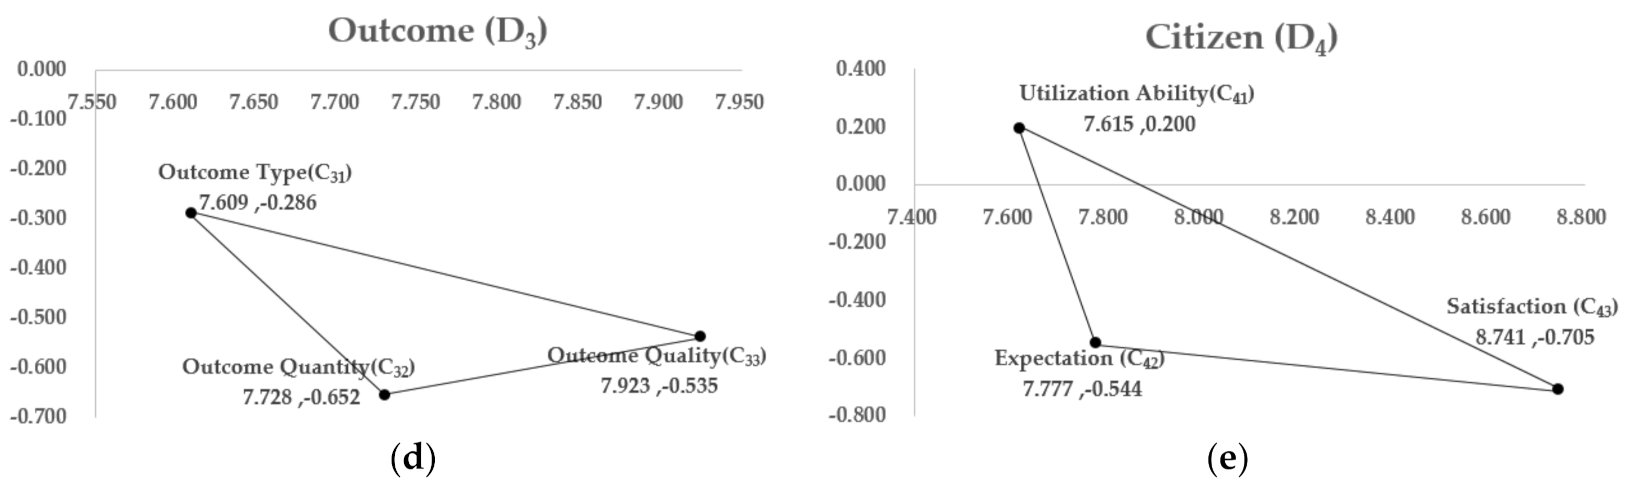
29]. It is all believed that the accuracy and timeliness of data need to be observed. Among platform dimension, usability, security, non-discrimination, and interactivity are all cause factors that influence each other. Among outcome dimension, outcome type, quantity, and quality are all result factors. Among citizen dimension, utilization ability is the cause factor. Expectation and satisfaction are the result factors. Utilization ability affects the expectation and satisfaction of citizens.
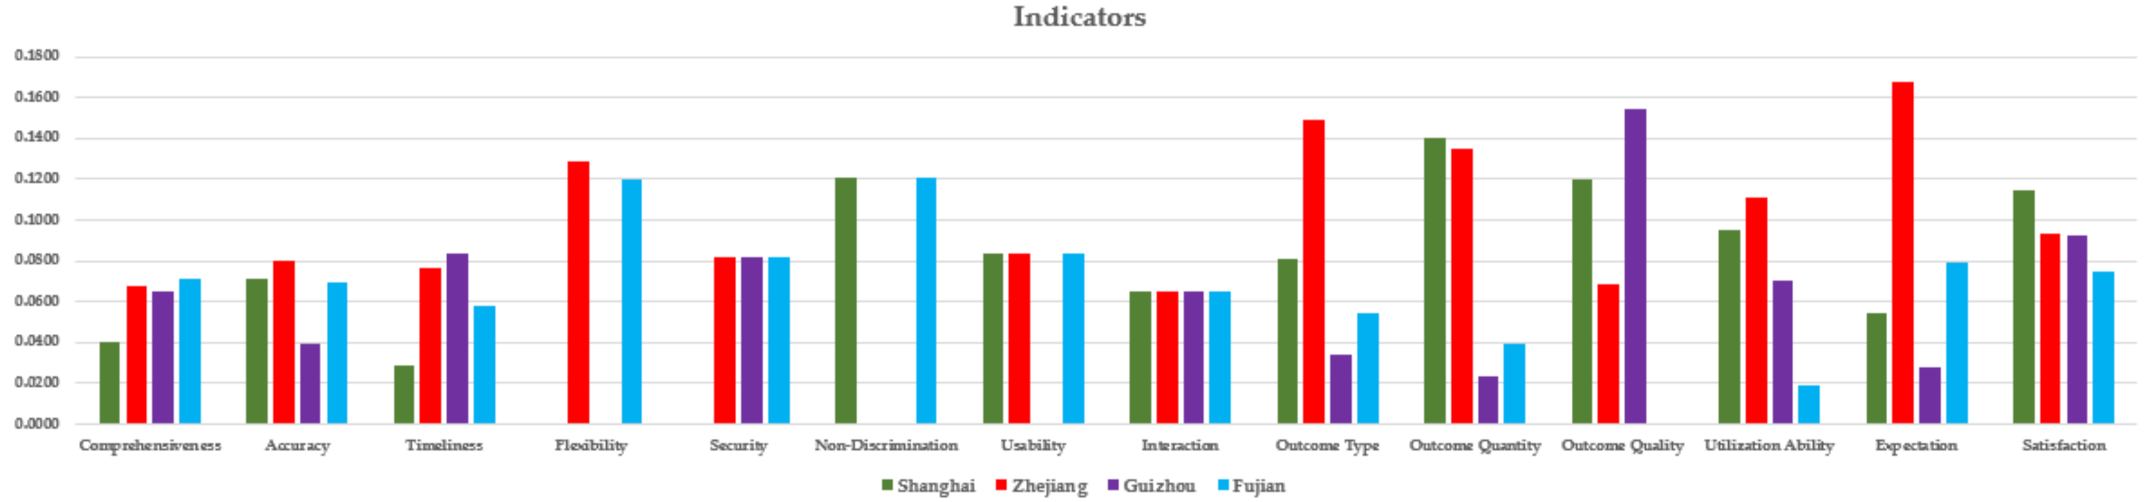
Second, judging from the evaluation weights, the citizen dimension has the highest weight, followed by the outcome dimension and data dimension, and platform dimension. Satisfaction is the highest weighted proportion of all indicators, followed by the quality and quantity of outcomes. The lowest indicator is non-discrimination. This is because the OGDPs were built by governments in China. During the process of open data, the OGDP has always upheld the principle of “serving the people” and is fair, judicial, and open. Thus, when evaluating the status quo of citizens’ sustainable use of OGDP, non-discrimination is not the focus. Specifically, accuracy is the most important indicator among data dimension. This is consistent with the research viewpoint of Jiang et al. [41]. The more accurate the data provided by OGDP, the better it is for citizens to use. Among platform dimension, interactivity is the most important indicator. This is consistent with the research results of Máchová et al. [9]. This is probably due to the fact that easy communication with citizens is much more important for OGDP. Among outcome dimension, outcome quality is the most important indicator. In the process of utilization and transformation of outcomes, the better the quality of outcomes, the higher the transformation efficiency. Among citizen dimension, satisfaction is the most important indicator. For all OGDPs, the satisfaction of citizens is the ultimate goal and the most important governance driver.
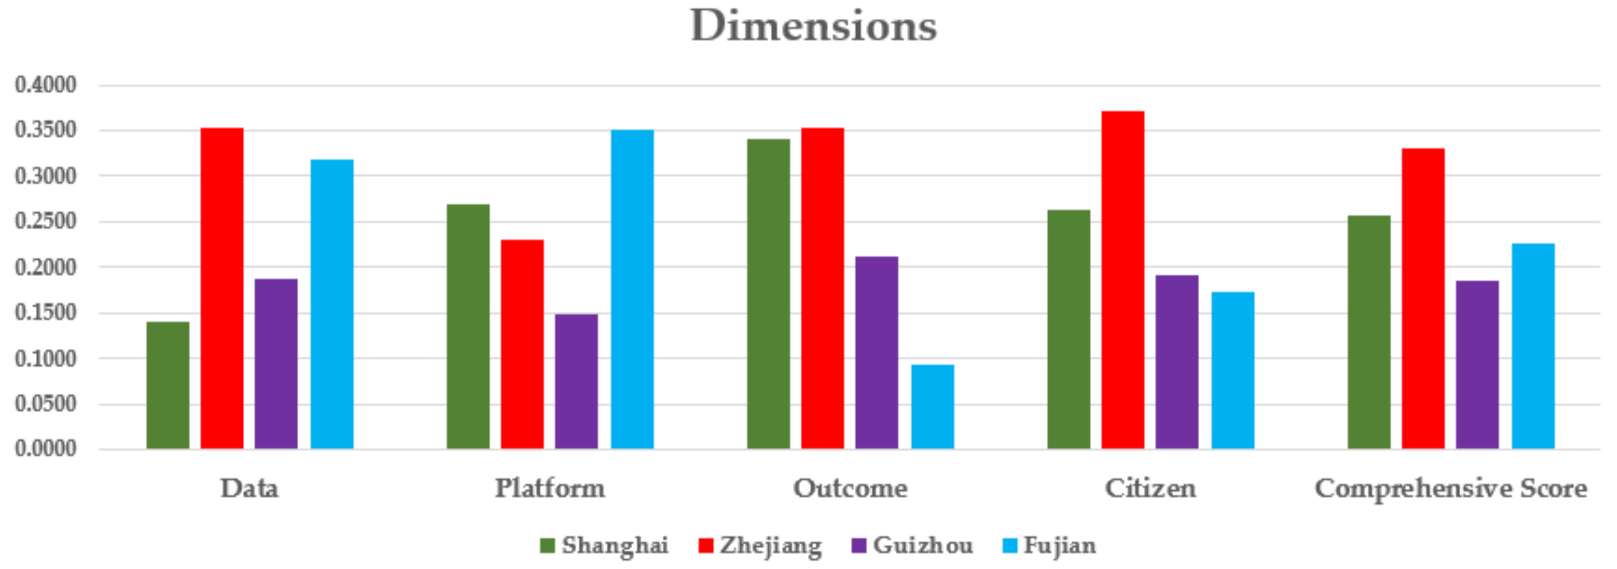
Third, according to the empirical research results, Zhejiang province has the best status of citizens’ sustainable use of OGDP, followed by Shanghai and Fujian provinces. The worst one is the OGDP in Guizhou. This shows that the Zhejiang government has done the best in the comprehensive management of OGDP. Shanghai and Fujian governments are next. The Guizhou government needs to strengthen the OGDP governance as soon as possible. In detail, the OGDP in Zhejiang has the lowest score in platform construction. The OGDP in Shanghai is poor in citizen, platform, and data fields, especially in the data field. The OGDP in Fujian does the worst in terms of citizens and outcomes, especially in the outcome dimension. The status quo of citizens’ sustainable use of OGDP in Guizhou does the worst. The citizen dimension, data dimension, and platform dimension need to be strengthened.
Finally, judging from the scores of each OGDP, the OGDP in Shanghai has done the best in terms of outcomes, especially in terms of the quantity and quality of outcomes. The data and platform dimensions are the worst, especially the flexibility of data and the security of platform. The citizen dimension of Zhejiang provincial OGDP is the best; it can well meet the expectations of citizens. Outcome and data are also well done, especially in the type and quantity of outcomes and the flexibility of data. Zhejiang province has done the worst in terms of platform, especially in terms of non-discrimination. The OGDP in Guizhou has done the best in the dimension of results, especially in the quality of results. Data and platform are the worst, especially the non-discrimination and usability of platform and the flexibility of data. The OGDP in Fujian has done the best in both platform and data, especially in non-discrimination of platform and flexibility of data. The outcome dimension is the worst, especially the quality of outcomes.

7.2. Suggestions

In conclusion, we consider that the government could issue questionnaires on OGDP to understand citizens’ needs and in a timely manner open data that citizens urgently need. The results show that the citizen dimension is the key core dimension. With the lowest cause value, the data dimension is the most important influencing factor of the citizen dimension. For citizens, satisfaction is the most important thing. Therefore, we can conduct a questionnaire survey on every citizen who browses the OGDPs. It can collect the current demand of citizens for government data and help the government open the government data that citizens urgently need in time. It could meet the needs of citizens and promote the utilization and value creation of government data, thus promoting the sustainable development of society.
Second, according to the results, the policy of privacy protection and guide for citizens should be perfected so that citizens can use the OGDP sustainably with ease and convenience. The results show that the platform dimension is the cause dimension, which affects the outcome dimension and the citizen dimension. Empirical results show that the OGDP in Shanghai does the worst in terms of platform security, while the OGDP in Guizhou does the worst in terms of platform usability. Overall, the security and usability of OGDP need to be strengthened. Therefore, the government should provide and update the policy of privacy protection on OGDP in time to ensure that citizens can use it with ease. The government can in a timely manner provide and update the user guide according to the functions of OGDP so that citizens can use it more conveniently.
Third, the open data innovation competition should be held to promote the research and development (R&D) of open data outcomes. The results show that the OGDPs in Guizhou and Fujian provinces have had poor outcomes, especially in the quality of outcomes of OGDP in Fujian province. Open data innovation competition is one of the key means to promote the utilization and outcome transformation of open data [42]. The government can hold open data innovation competitions on time to encourage citizens to actively participate in the utilization of open data and R&D of outcomes, strengthening the management and promotion of R&D outcomes, and promoting citizens’ application of outcomes, thus forming a virtuous circle between open data and citizens.
Fourth, we hold that the OGDP should provide a data visualization function to strengthen citizens’ sustainable use of open data. The results show that for OGDPs in Shanghai, Guizhou, and Fujian provinces, the citizen dimension score is very low, especially in Fujian. The utilization ability of citizens is not only related to their own knowledge reserves, such as educational quality and technical application ability, but also closely related to the data visualization function of OGDP. The perfect data visualization function can make citizens more clearly and intuitively understand the metadata content and the applicable industry fields of data sets. It can save time for citizens to filter and try out data sets, thus strengthening citizens’ sustainable use of open government data. By promoting citizens’ use and reuse of open data, government data can create more value and realize the sustainable development of society.
What’s more, various download formats of data sets should be provided. This can promote citizens’ multi-way and multi-field application of open data sets. The results show that the OGDPs in Shanghai and Guizhou provinces have the worst data flexibility. Expanding the download formats can make the utilization of data sets more flexible and convenient, which helps to improve the flexibility of open data. With the sustainable development of science and technology, the government can provide various download formats of data sets in time. This can promote citizens’ multi-way and multi-field application of data sets and then promote the value creation of open government data and the sustainable development of society.
Finally, we recommend that the government could unify the login account information of all OGDPs, and simplify the operation procedures for citizens to download data sets. The results show that the OGDPs in Zhejiang and Guizhou provinces are the worst in non-discrimination. The OGDP should adhere to the tenet of “serving the people” and simplify the procedures for citizens to freely access, obtain, and use open data. Thus, for China, without a national-level OGDP, it is possible to unify the login account information of all levels of OGDPs. This can simplify the operation procedures for citizens to download data sets, thus facilitating citizens to manage their own privacy information and obtain the data they need on each platform.

7.3. Limitation of Research

From the perspective of citizens, this study constructs a sustainable use evaluation system of OGDP with four dimensions and 12 indicators. Taking the OGDPs of four pilot areas in China as examples, the usability of this evaluation system is verified. However, there are still some limitations. First, the citizens in this study are more concerned about individuals than business organizations. Second, this study does not divide citizens according to age, gender, education level, and other attributes for comparative analysis. Therefore, from the perspective of enterprise organizations, the current situation of sustainable use of OGDP can be studied in future research. Second, we could consider subdividing citizens’ attributes and conduct a detailed research on the sustainable use status of OGDP in different categories in the future. Through further research, it is expected to promote citizens’ sustainable use of OGDP and the value creation of open data so as to realize sustainable development.

Supplementary Materials

The following are available online at https://www.mdpi.com/article/10.3390/su14031415/s1, Supplementary File: Questionnaire for Citizens’ Sustainable Use of OGDP.

Author Contributions

W.Z. collected relevant literature and drafted the manuscript; H.J. designed the research and revised the manuscript; Q.S. analyzed data and polished the language; T.S. interviewed experts and collected data. All authors have read and agreed to the published version of the manuscript.

Funding

This research was funded by the Social Science Fund of Fujian Province of China [FJ2020B023 and FJ2019JDZ051], the Ministry of Education in China Youth Fund Project of Hu-manities and Social Sciences [18YJC630140], Humanities and Social Sciences Gen-eral Project of Education Ministry of China [19YJA630027], Electronic Commerce Technology Open Fund Project of Fujian University Engineering Research Center in China [KBX2118], and Annual Open Project of Fujian Rural Revitalization Research Association in China [2021XCZX09].

Institutional Review Board Statement

No applicable.

Informed Consent Statement

Informed consent was obtained from all subjects involved in the study.

Data Availability Statement

The expert questionnaire data can be available upon request from [email protected]. Empirical research data are objective data, which can be collected according to the standards in Table 3. The empirical data can be collected from four OGDPs: Shanghai (https://data.sh.gov.cn/), Zhejiang (http://data.zjzwfw.gov.cn/), Guizhou (http://data.guizhou.gov.cn/), and Fujian (https://data.fujian.gov.cn/). Accessed on 15 December 2021.

Acknowledgments

The authors are extremely grateful for the valuable comments on improving the quality of this article from editors and the anonymous reviewers.

Conflicts of Interest

The authors declare no conflict of interest.

Appendix A. Results in Detail

We used the DANP method to establish the evaluation structure for the citizens’ sustainable use of OGDP and analyze the relationships and degree of influence of the four dimensions and 14 indicators. We collected questionnaires from 14 experts and obtained a 14 × 14 average initial direct influence matrix to form the average responses, as shown in Table A1. Then, the normalized matrix was obtained by Equations (2) and (3), as shown in Table A2. Table A3 and Table A4 show the degree of influence among the 14 indicators and the influential relations among the four dimensions. Table A5 presents the unweighted supermatrix W ij , which was obtained by transposing the normalized influence matrix based on Equations (5)–(8). The weighted supermatrix W c can be obtained using Equation (9), as shown in Table A6. Finally, the limit supermatrix W μ can be obtained using Equation (10), as shown in Table A7.
In the empirical research, we use TOPSIS method to sort and analyze the OGDPs in four pilot areas in China. First, the normalized decision matrix was built using Equation (12), as shown in Table A8. Table A9 shows the weighted decision matrix combining the determined weigh of indicators and the collected objective data. According to the normalized matrix, the positive ideal solution z+ and the negative ideal solution z were obtained based on Equations (13) and (14), as shown in Table A10.
Table A1. The average initial direct influence matrix.
C11C12C13C14C21C22C23C24C31C32C33C41C42C43
C110.0002.0711.6432.1431.5001.6431.5711.7141.9292.1431.7141.8572.0002.143
C121.2860.0001.7861.6431.6430.9291.3571.5001.8572.0002.2861.8572.1432.286
C131.5712.1430.0001.7861.8571.8572.0711.8571.8572.2142.0002.2142.0002.429
C141.5711.5001.3570.0001.5001.9292.0001.7141.8572.2141.9291.6431.6432.286
C211.8572.2141.9291.9290.0001.7141.5711.7861.7141.9292.0002.0712.1431.786
C221.7141.3571.6431.4291.7860.0001.5001.6431.8571.8571.9291.7862.0002.286
C231.5711.7141.3571.6431.5711.8570.0002.1432.4292.2862.2141.8572.3572.500
C241.4291.7141.4291.8571.7141.9291.5710.0002.0002.0001.6431.7861.9292.286
C312.0001.3571.2141.5001.5001.3571.5001.2860.0002.2142.2862.1432.0712.500
C321.5711.3571.5001.3571.5001.5711.7141.5711.6430.0002.5001.5001.7862.500
C331.5002.0712.0001.7861.2861.5001.7861.3571.7142.2860.0001.5002.0712.286
C411.5001.9292.0002.0001.4291.4291.6431.7862.5001.9291.9290.0002.2142.286
C421.7861.7862.0001.5711.6431.5001.5001.5711.9291.5711.7861.5000.0002.429
C432.1432.0001.9291.6432.2141.5711.7862.5711.6431.8572.3571.6431.9290.000
Note: The average gap-ratio in consensus (%) = i = 1 k j = 1 k d ij s d ij s 1 d ij s   ×   100 % = 4.04 %   <   5 % , where k is the number of indicators (k = 14), s is the number of experts (s = 14) and significant confidence reach 95.3% (more than 95%).
Table A2. The normalized matrix.
C11C12C13C14C21C22C23C24C31C32C33C41C42C43
C110.0000.0690.0550.0710.0500.0550.0520.0570.0640.0710.0570.0620.0670.071
C120.0430.0000.0600.0550.0550.0310.0450.0500.0620.0670.0760.0620.0710.076
C130.0520.0710.0000.0600.0620.0620.0690.0620.0620.0740.0670.0740.0670.081
C140.0520.0500.0450.0000.0500.0640.0670.0570.0620.0740.0640.0550.0550.076
C210.0620.0740.0640.0640.0000.0570.0520.0600.0570.0640.0670.0690.0710.060
C220.0570.0450.0550.0480.0600.0000.0500.0550.0620.0620.0640.0600.0670.076
C230.0520.0570.0450.0550.0520.0620.0000.0710.0810.0760.0740.0620.0790.083
C240.0480.0570.0480.0620.0570.0640.0520.0000.0670.0670.0550.0600.0640.076
C310.0670.0450.0400.0500.0500.0450.0500.0430.0000.0740.0760.0710.0690.083
C320.0520.0450.0500.0450.0500.0520.0570.0520.0550.0000.0830.0500.0600.083
C330.0500.0690.0670.0600.0430.0500.0600.0450.0570.0760.0000.0500.0690.076
C410.0500.0640.0670.0670.0480.0480.0550.0600.0830.0640.0640.0000.0740.076
C420.0600.0600.0670.0520.0550.0500.0500.0520.0640.0520.0600.0500.0000.081
C430.0710.0670.0640.0550.0740.0520.0600.0860.0550.0620.0790.0550.0640.000
Table A3. The total-influence matrix of indicators.
C11C12C13C14C21C22C23C24C31C32C33C41C42C43
C110.2010.2790.2550.2730.2450.2450.2510.2630.2890.3100.3000.2730.3040.341
C120.2310.2030.2490.2460.2380.2120.2330.2450.2740.2920.3030.2610.2940.329
C130.2650.2970.2180.2770.2700.2650.2800.2830.3040.3290.3260.2990.3210.369
C140.2440.2550.2390.1990.2380.2470.2560.2560.2790.3030.2980.2590.2850.335
C210.2640.2890.2690.2710.2020.2510.2550.2700.2880.3090.3140.2850.3140.337
C220.2460.2480.2460.2420.2440.1840.2390.2510.2760.2890.2940.2610.2920.332
C230.2620.2810.2580.2690.2580.2620.2120.2880.3170.3270.3280.2850.3280.367
C240.2410.2620.2430.2580.2460.2470.2440.2030.2840.2980.2900.2640.2940.337
C310.2550.2490.2340.2450.2360.2280.2400.2420.2190.3010.3060.2720.2950.339
C320.2360.2430.2360.2340.2300.2280.2400.2440.2630.2250.3040.2460.2790.330
C330.2420.2720.2590.2550.2320.2330.2500.2460.2750.3050.2370.2550.2970.336
C410.2530.2800.2700.2730.2470.2420.2570.2700.3110.3090.3110.2190.3150.351
C420.2460.2600.2550.2450.2390.2300.2380.2480.2760.2790.2880.2510.2280.334
C430.2770.2890.2740.2690.2760.2520.2670.2990.2920.3130.3300.2780.3140.287
Table A4. The total-influence matrix of dimensions.
D1D2D3D4
D10.2460.2520.3010.306
D20.2590.2410.3010.308
D30.2470.2370.2710.294
D40.2660.2550.3010.286
Table A5. The un-weighted supermatrix W ij .
C11C12C13C14C21C22C23C24C31C32C33C41C42C43
C110.1990.2490.2510.2600.2410.2500.2450.2400.2590.2490.2350.2350.2450.250
C120.2770.2190.2810.2720.2640.2530.2620.2610.2540.2560.2650.2600.2580.260
C130.2530.2680.2060.2560.2460.2500.2410.2420.2380.2490.2520.2510.2530.247
C140.2700.2650.2620.2120.2480.2460.2510.2570.2490.2470.2480.2540.2430.242
C210.2440.2560.2460.2390.2060.2660.2530.2610.2500.2450.2410.2430.2500.252
C220.2440.2280.2410.2470.2570.2000.2570.2630.2410.2420.2430.2380.2410.231
C230.2500.2510.2550.2570.2610.2600.2080.2600.2540.2550.2600.2530.2490.244
C240.2620.2640.2580.2570.2760.2740.2820.2160.2560.2590.2560.2660.2600.273
C310.3220.3150.3170.3170.3170.3210.3260.3260.2650.3320.3360.3340.3270.312
C320.3450.3360.3430.3450.3390.3370.3370.3410.3650.2840.3740.3320.3310.335
C330.3340.3490.3400.3380.3440.3420.3380.3330.3700.3840.2900.3340.3410.353
C410.2980.2950.3020.2950.3040.2950.2910.2950.3000.2870.2870.2480.3090.316
C420.3310.3330.3250.3240.3360.3300.3350.3290.3260.3260.3350.3560.2800.357
C430.3710.3720.3730.3820.3600.3750.3740.3760.3740.3860.3780.3960.4110.327
Table A6. The weighted supermatrix Wc.
C11C12C13C14C21C22C23C24C31C32C33C41C42C43
C110.0440.0550.0560.0580.0560.0590.0570.0560.0610.0580.0550.0560.0590.060
C120.0620.0490.0630.0610.0620.0590.0610.0610.0600.0600.0620.0620.0620.062
C130.0560.0600.0460.0570.0570.0590.0560.0570.0560.0590.0590.0600.0610.059
C140.0600.0590.0580.0470.0580.0580.0590.0600.0590.0580.0580.0610.0580.058
C210.0560.0580.0560.0540.0450.0580.0550.0570.0570.0550.0550.0560.0580.058
C220.0560.0520.0550.0560.0560.0430.0560.0570.0540.0550.0550.0550.0550.053
C230.0570.0570.0580.0590.0570.0570.0450.0560.0570.0530.0590.0580.0570.056
C240.0600.0600.0590.0590.0600.0600.0610.0470.0580.0590.0580.0610.0600.063
C310.0880.0860.0860.0860.0860.0870.0880.0880.0680.0860.0870.0910.0890.085
C320.0940.0910.0930.0940.0920.0910.0910.0930.0940.0730.0960.0900.0900.091
C330.0910.0950.0930.0920.0930.0930.0920.0900.0960.0990.0750.0910.0930.096
C410.0820.0820.0840.0820.0840.0820.0810.0820.0840.0810.0810.0640.0800.082
C420.0920.0920.0900.0900.0930.0920.0930.0910.0910.0920.0940.0920.0720.092
C430.1030.1030.1030.1060.1000.1040.1040.1040.1050.1080.1060.1020.1060.084
Table A7. The limit supermatrix Wμ.
C11C12C13C14C21C22C23C24C31C32C33C41C42C43
C110.057 0.057 0.057 0.057 0.057 0.057 0.057 0.057 0.057 0.057 0.057 0.057 0.057 0.057
C120.061 0.061 0.061 0.061 0.061 0.061 0.061 0.061 0.061 0.061 0.061 0.061 0.061 0.061
C130.058 0.058 0.058 0.058 0.058 0.058 0.058 0.058 0.058 0.058 0.058 0.058 0.058 0.058
C140.058 0.058 0.058 0.058 0.058 0.058 0.058 0.058 0.058 0.058 0.058 0.058 0.058 0.058
C210.056 0.056 0.056 0.056 0.056 0.056 0.056 0.056 0.056 0.056 0.056 0.056 0.056 0.056
C220.054 0.054 0.054 0.054 0.054 0.054 0.054 0.054 0.054 0.054 0.054 0.054 0.054 0.054
C230.057 0.057 0.057 0.057 0.057 0.057 0.057 0.057 0.057 0.057 0.057 0.057 0.057 0.057
C240.059 0.059 0.059 0.059 0.059 0.059 0.059 0.059 0.059 0.059 0.059 0.059 0.059 0.059
C310.086 0.086 0.086 0.086 0.086 0.086 0.086 0.086 0.086 0.086 0.086 0.086 0.086 0.086
C320.091 0.091 0.091 0.091 0.091 0.091 0.091 0.091 0.091 0.091 0.091 0.091 0.091 0.091
C330.092 0.092 0.092 0.092 0.092 0.092 0.092 0.092 0.092 0.092 0.092 0.092 0.092 0.092
C410.080 0.080 0.080 0.080 0.080 0.080 0.080 0.080 0.080 0.080 0.080 0.080 0.080 0.080
C420.090 0.090 0.090 0.090 0.090 0.090 0.090 0.090 0.090 0.090 0.090 0.090 0.090 0.090
C430.102 0.102 0.102 0.102 0.102 0.102 0.102 0.102 0.102 0.102 0.102 0.102 0.102 0.102
Table A8. The normalized decision matrix of four OGDPs.
C11C12C13C14C21C22C23C24C31C32C33C41C42C43
Shanghai 0.2780.3080.3080.5170.3330.0000.3330.2500.4680.4000.2000.3750.5090.248
Zhejiang 0.1650.2740.1180.0000.0000.5000.3330.2500.2550.4150.3500.3220.1640.305
Guizhou 0.2660.1510.3380.0000.3330.0000.0000.2500.1060.0690.4500.2380.0860.247
Fujian 0.2910.2670.2360.4830.3330.5000.3330.2500.1700.1150.0000.0640.2410.200
Table A9. The weighted decision matrix of four OGDPs.
C11C12C13C14C21C22C23C24C31C32C33C41C42C43
Shanghai 0.0680.0800.0760.1290.0820.0000.0840.0650.1490.1350.0690.1110.1680.093
Zhejiang 0.0400.0710.0290.0000.0000.1210.0840.0650.0810.1400.1200.0950.0540.115
Guizhou 0.0650.0390.0830.0000.0820.0000.0000.0650.0340.0230.1540.0700.0280.092
Fujian 0.0710.0690.0580.1200.0820.1210.0840.0650.0540.0390.0000.0190.0800.075
Table A10. The positive ideal solution z+ and negative ideal solution z of four OGDPs.
C11C12C13C14C21C22C23C24C31C32C33C41C42C43
z+0.0710.0800.0830.1290.0820.1210.0840.0650.1490.1400.1540.1110.1680.115
z0.0400.0390.0290.0000.0000.0000.0000.0650.0340.0230.0000.0190.0280.075

References

  1. Janssen, K. The Influence of the PSI Directive on Open Government Data: An Overview of Recent Developments. Gov. Inf. Q. 2011, 28, 446–456. [Google Scholar] [CrossRef]
  2. Charalabidis, Y.; Charalampos, A.; Euripidis, L. A Taxonomy of Open Government Data Research Areas and Topics. J. Org. Comp. Elect. Com. 2016, 26, 41–63. [Google Scholar] [CrossRef]
  3. Ruijer, E.; Grimmelikhuijsen, S.; Meijer, A. Open Data for Democracy: Developing a Theoretical Framework for Open Data Use. Gov. Inf. Q. 2017, 34, 45–52. [Google Scholar] [CrossRef]
  4. Attard, J.; Orlandi, F.; Scerri, S.; Auer, S. A Systematic Review of Open Government Data Initiatives. Gov. Inf. Q. 2015, 32, 399–418. [Google Scholar] [CrossRef]
  5. Lab for Digital & Mobile Governance. China Open Data Index (The First Half of 2021). Available online: http://www.dmg.fudan.edu.cn/?p=9014 (accessed on 2 August 2021).
  6. Lab for Digital & Mobile Governance. China Open Data Index (The Second Half of 2020). Available online: http://www.dmg.fudan.edu.cn/?p=8659 (accessed on 23 March 2021).
  7. Zhang, X.J.; Tan, J. Research on Metadata Quality Evaluation of Provincial Government Data Open Platform in China. E-Government 2019, 16, 58–71. [Google Scholar]
  8. Lourenco, R.P. An Analysis of Open Government Portals: A Perspective of Transparency for Accountability. Gov. Inf. Q. 2015, 32, 323–332. [Google Scholar] [CrossRef]
  9. Máchová, R.; Lnenicka, M. Evaluating the Quality of Open Data Portals on the National Level. J. Theor. Appl. Electron. Comm. 2017, 12, 21–41. [Google Scholar] [CrossRef] [Green Version]
  10. Machado, V.; Mantini, G.; Viterbo, J.; Bernardini, F.; Barcellos, R. An Instrument for Evaluating Open Data Portals: A Case Study in Brazilian Cities. In Proceedings of the 19th Annual International Conference on Digital Government Research (Dgo)-Governance in the Data Age, Delft, The Netherlands, 30 May–1 June 2018; pp. 164–173. [Google Scholar]
  11. Li, Q.C. Research on Evaluation Model of E-Commerce Platform Based on DANP. Straits Sci. 2017, 30, 89–93. [Google Scholar]
  12. Li, Y.G. Food Supplier Selection Model Based on DANP. J. Chongqing Univ. Sci. Technol. 2012, 19, 76–78. [Google Scholar]
  13. Cui, Q.A.; Xiao, T.L. Evaluating Car-Hailing Service Quality Based on the DANP and IPA Method. Ind. Eng. Manag. 2017, 22, 48–56. [Google Scholar]
  14. Zhang, Y.L.; Lu, Q.Q. Service Quality Satisfaction Analysis Based on DANP and TOPSIS: Take Online Catering Platform as Example. Appl. Res. Comp. 2020, 37, 2082–2086. [Google Scholar]
  15. Stokic, M.; Vujanovic, D.; Sekulic, D. A New Comprehensive Approach for Efficient Road Vehicle Procurement Using Hybrid DANP-TOPSIS Method. Sustainability 2020, 12, 4044. [Google Scholar] [CrossRef]
  16. Liou, J.J.H.; Lu, M.T.; Hu, S.K.; Cheng, C.H.; Chuang, Y.C. A hybrid MCDM Model for Improving the Electronic Health Record to Better Serve Client Needs. Sustainability 2017, 9, 1819. [Google Scholar] [CrossRef] [Green Version]
  17. Shao, Q.G.; Liou, J.J.H.; Weng, S.S.; Chuang, Y.C. Improving the Green Building Evaluation System in China Based on the DANP Method. Sustainability 2018, 10, 1173. [Google Scholar] [CrossRef] [Green Version]
  18. Zeleti, F.A.; Ojo, A.; Curry, E. Exploring the Economic Value of Open Government Data. Gov. Inf. Q. 2016, 33, 535–551. [Google Scholar] [CrossRef]
  19. Gao, T.P.; Mo, T.L. Research on Initial Adoption of Users of Government Data Open Platform. E-Government 2018, 15, 69–82. [Google Scholar]
  20. Zhu, H.C.; Hu, X.; Wang, X.B. The Users′ Continuance Use Intention of Government Data Open Platform Based on the S-O-R Framework. Mod. Inf. 2018, 38, 100–105+116. [Google Scholar]
  21. Paulo, R.; Guilherme, M.; Leandro, V.; Antonio, L. Vehicular Data Space: The Data Point of View. IEEE Commun. Surv. Tutor. 2019, 21, 2392–2418. [Google Scholar]
  22. Bulai, V.C.; Horobet, A.; Belascu, L. Improving Local Governments’ Financial Sustainability by Using Open Government Data: An Application of High-Granularity Estimates of Personal Income Levels in Romania. Sustainability 2019, 11, 1–11. [Google Scholar] [CrossRef] [Green Version]
  23. Hou, Z.P.; Chen, Z.F.; Luo, Y.Z. Applying Big Data Analysis to Discuss the Elderly Social Welfare Service Use Condition and the Relevant Factors. Rev. Cercet. Interv. Soc. 2020, 11, 5632. [Google Scholar] [CrossRef]
  24. Chen, L.; Duan, Y.Q. Heterogeneity Analysis on the Influencing Factors of Public Continuous Use Behavior of Government Open Data. Inf. Sci. 2021, 39, 134–142. [Google Scholar]
  25. Chatfield, A.T.; Reddick, C.G. A Longitudinal Cross-Sector Analysis of Open Data Portal Service Capability: The Case of Australian Local Governments. Gov. Inf. Q. 2017, 34, 231–243. [Google Scholar] [CrossRef]
  26. Hai, L.; Deng, S. Efficiency Evaluation of Urban Government Data Open Platform Based on DEA. E-Government 2018, 15, 112–118. [Google Scholar]
  27. Osman, I.H.; Anouze, A.L.; Irani, Z.; Al-Ayoubi, B.; Lee, H.; Balcı, A.; Medeni, T.D.; Weerakkody, V. COBRA Framework to Evaluate E-Government Services: A Citizen-Centric Perspective. Gov. Inf. Q. 2014, 31, 243–256. [Google Scholar] [CrossRef] [Green Version]
  28. Zhu, X.; Freeman, M.A. An Evaluation of US Municipal Open Data Portals: A User Interaction Framework. J. Assoc. Inf. Sci. Technol. 2019, 70, 27–37. [Google Scholar] [CrossRef] [Green Version]
  29. Vetrò, A.; Canova, L.; Torchiano, M.; Minotas, C.O.; Iemma, R.; Morando, F. Open Data Quality Measurement Framework: Definition and Application to Open Government Data. Gov. Inf. Q. 2016, 33, 325–327. [Google Scholar] [CrossRef] [Green Version]
  30. Charalabidis, Y.; Loukis, E.; Charalampos, A. Evaluating Second Generation Open Government Data Infrastructures Using Value Models. In Proceedings of the 2014 47th Hawaii International Conference on System Sciences, Waikoloa, HI, USA, 6 January 2014; pp. 2114–2126. [Google Scholar]
  31. Murillo, M.J. Evaluating the Role of Online Data Availability: The Case of Economic and Institutional Transparency in Sixteen Latin American Nations. Int. Politi. Sci. Rev. 2015, 36, 42–59. [Google Scholar] [CrossRef]
  32. Anderson, E.W.; Fornell, C. Foundations of the American Customer Satisfaction Index. Total Qual. Manag. 2000, 11, 869–882. [Google Scholar] [CrossRef]
  33. Martín, A.S.; Rosario, A.H.D.; Pérez, M.D.C.C. An International Analysis of the Quality of Open Government Data Portals. Soc. Sci. Comput. Rev. 2016, 34, 298–311. [Google Scholar] [CrossRef]
  34. Kučera, J.; Chlapek, D.; Nečaský, M. Open Government Data Catalogs: Current Approaches and Quality Perspective. In Proceedings of the Joint International Conference on Technology-Enabled Innovation for Democracy, Prague, Czech Republic, 26–28 August 2013; pp. 152–166. [Google Scholar]
  35. Tan, B.Y.; Chen, Y. Data Quality of Open Government Data [latform in China: Ten Provinces and Cities as the Research Object. J. Intell. 2017, 36, 99–105. [Google Scholar]
  36. Zheng, L. Study on Open Government Data: Definitions, Factors and Interactions. Chin. Pub. Adm. 2015, 31, 13–18. [Google Scholar]
  37. Tzeng, G.H.; Shen, K.Y. New Concepts and Trends of Hybrid Multiple Criteria Decision Making; CRC Press: Boca Raton, FL, USA, 2017. [Google Scholar]
  38. Hwang, C.L.; Yoon, K. Multiple Attribute Decision Making: Methods and Applications: A State-of-the-Art Survey; CRC Press: Berlin, Germany, 1981. [Google Scholar]
  39. Tzeng, G.H.; Chiang, C.H.; Li, C.W. Evaluating Intertwined Effects in E-Learning Programs: A Novel Hybrid MCDM Model Based on Factor Analysis and DEMATEL. Expert Syst. Appl. 2007, 32, 1028–1044. [Google Scholar] [CrossRef]
  40. Office of the Central Cyberspace Affairs Commission; National Development and Reform Commission; Ministry of Industry and Information Technology. Pilot Work Plan for Open Public Information Resources. Available online: http://www.cac.gov.cn/wxb_pdf/20180105006.pdf (accessed on 22 February 2020).
  41. Jiang, H.B.; Shao, Q.G.; Liou, J.J.H.; Shao, T.; Shi, X. Improving the Sustainability of Open Government Data. Sustainability 2019, 11, 2388. [Google Scholar] [CrossRef] [Green Version]
  42. Gao, Y.; Janssen, M.; Zhang, C. Understanding the Evolution of Open Government Data Research: Towards Open Data Sustainability and Smartness. Int. Rev. Adm. Sci. 2021, 13, 1–17. [Google Scholar] [CrossRef]
Figure 1. Influential Network Relation Map (INRM). (a) INRM among data dimension; (b) INRM among platform dimension; (c) INRM among all dimensions; (d) INRM among outcome dimension; (e) INRM among citizen dimension.
Sustainability 14 01415 g001aSustainability 14 01415 g001b
Figure 2. Score results of evaluation dimensions of four OGDPs.
Sustainability 14 01415 g002
Figure 3. Score results of evaluation indicators of four OGDPs.
Sustainability 14 01415 g003
Table 1. Citizens’ sustainable use evaluation dimensions and indicators of OGDP.
DimensionIndicatorLabelReferences
Data (D1) ComprehensivenessC11[29,30]
AccuracyC12
TimelinessC13
FlexibilityC14
Platform (D2) SecurityC21[9,30]
Non-DiscriminationC22
UsabilityC23
InteractionC24
Outcome (D3) Outcome TypeC31[5]
Outcome QuantityC32
Outcome QualityC33
Citizen (D4) Utilization AbilityC41[32,36]
ExpectationC42
SatisfactionC43
Table 2. Calculation results of evaluation dimensions and indicators.
DimensionIndicatorIndicator CentralityIndicator CauseDimension CentralityDimension CauseIndicator WeightIndicator RankingDimension WeightDimension Ranking
Data
(D1)
C117.2920.3652.1220.0860.244130.2333
C127.317−0.0990.2608
C137.6120.5600.24711
C147.2480.1390.24910
Platform
(D2)
C217.3200.5152.0950.1240.247120.2264
C226.9690.3190.24114
C237.5020.5790.2519
C247.3210.1030.2617
Outcome
(D3)
C317.609−0.2862.223−0.1240.31950.2682
C327.728−0.6520.3383
C337.923−0.5350.3432
Citizen
(D4)
C417.6150.2002.303−0.0860.29560.2731
C427.777−0.5440.3304
C438.742−0.7050.3751
Table 3. Indicator meaning and scoring standard.
DimensionIndicatorDescriptionsCriterion
Data ComprehensivenessThe number of industries or fields covered by data sets.Actual value
AccuracyThe proportion of data sets with complete metadata.
TimelinessThe proportion of timely updated data sets.
FlexibilityThe proportion of data sets in all five download formats.
Platform SecurityWhether the personal privacy policy is completed.If yes, score 1 point, otherwise score 0 points.
Non-DiscriminationWhether the restriction for logging in to download data exist.If yes, score −1 point, otherwise score 0 points.
UsabilityWhether the manual or guide for citizens exists.If yes, score 1 point, otherwise score 0 points.
InteractionWhether the scoring function of data exists.If yes, score 1 point, otherwise score 0 points.
Outcome Outcome TypeThe number of industries or fields covered by outcomes displayed.Actual value
Outcome QuantityThe number of outcomes displayed.
Outcome QualityThe number of outcomes displayed with a score of 5.
Citizen Utilization AbilityThe proportion of data sets with non-zero downloads.Actual value
ExpectationThe proportion of data sets applying for open independently.
SatisfactionThe average score of citizens’ scores.
Table 4. Ranking results of four OGDPs in China.
Pilot Areas D i + D i C i Sorting Result
Shanghai0.21530.24680.46592
Zhejiang0.14970.30630.32831
Guizhou0.29750.19260.60704
Fujian0.24850.22090.52943
Publisher’s Note: MDPI stays neutral with regard to jurisdictional claims in published maps and institutional affiliations.

