
A System Dynamics Approach to Modeling Groundwater Dynamics: Case Study of the Choshui River Basin


Abstract
:1. Introduction
2. Literature Review
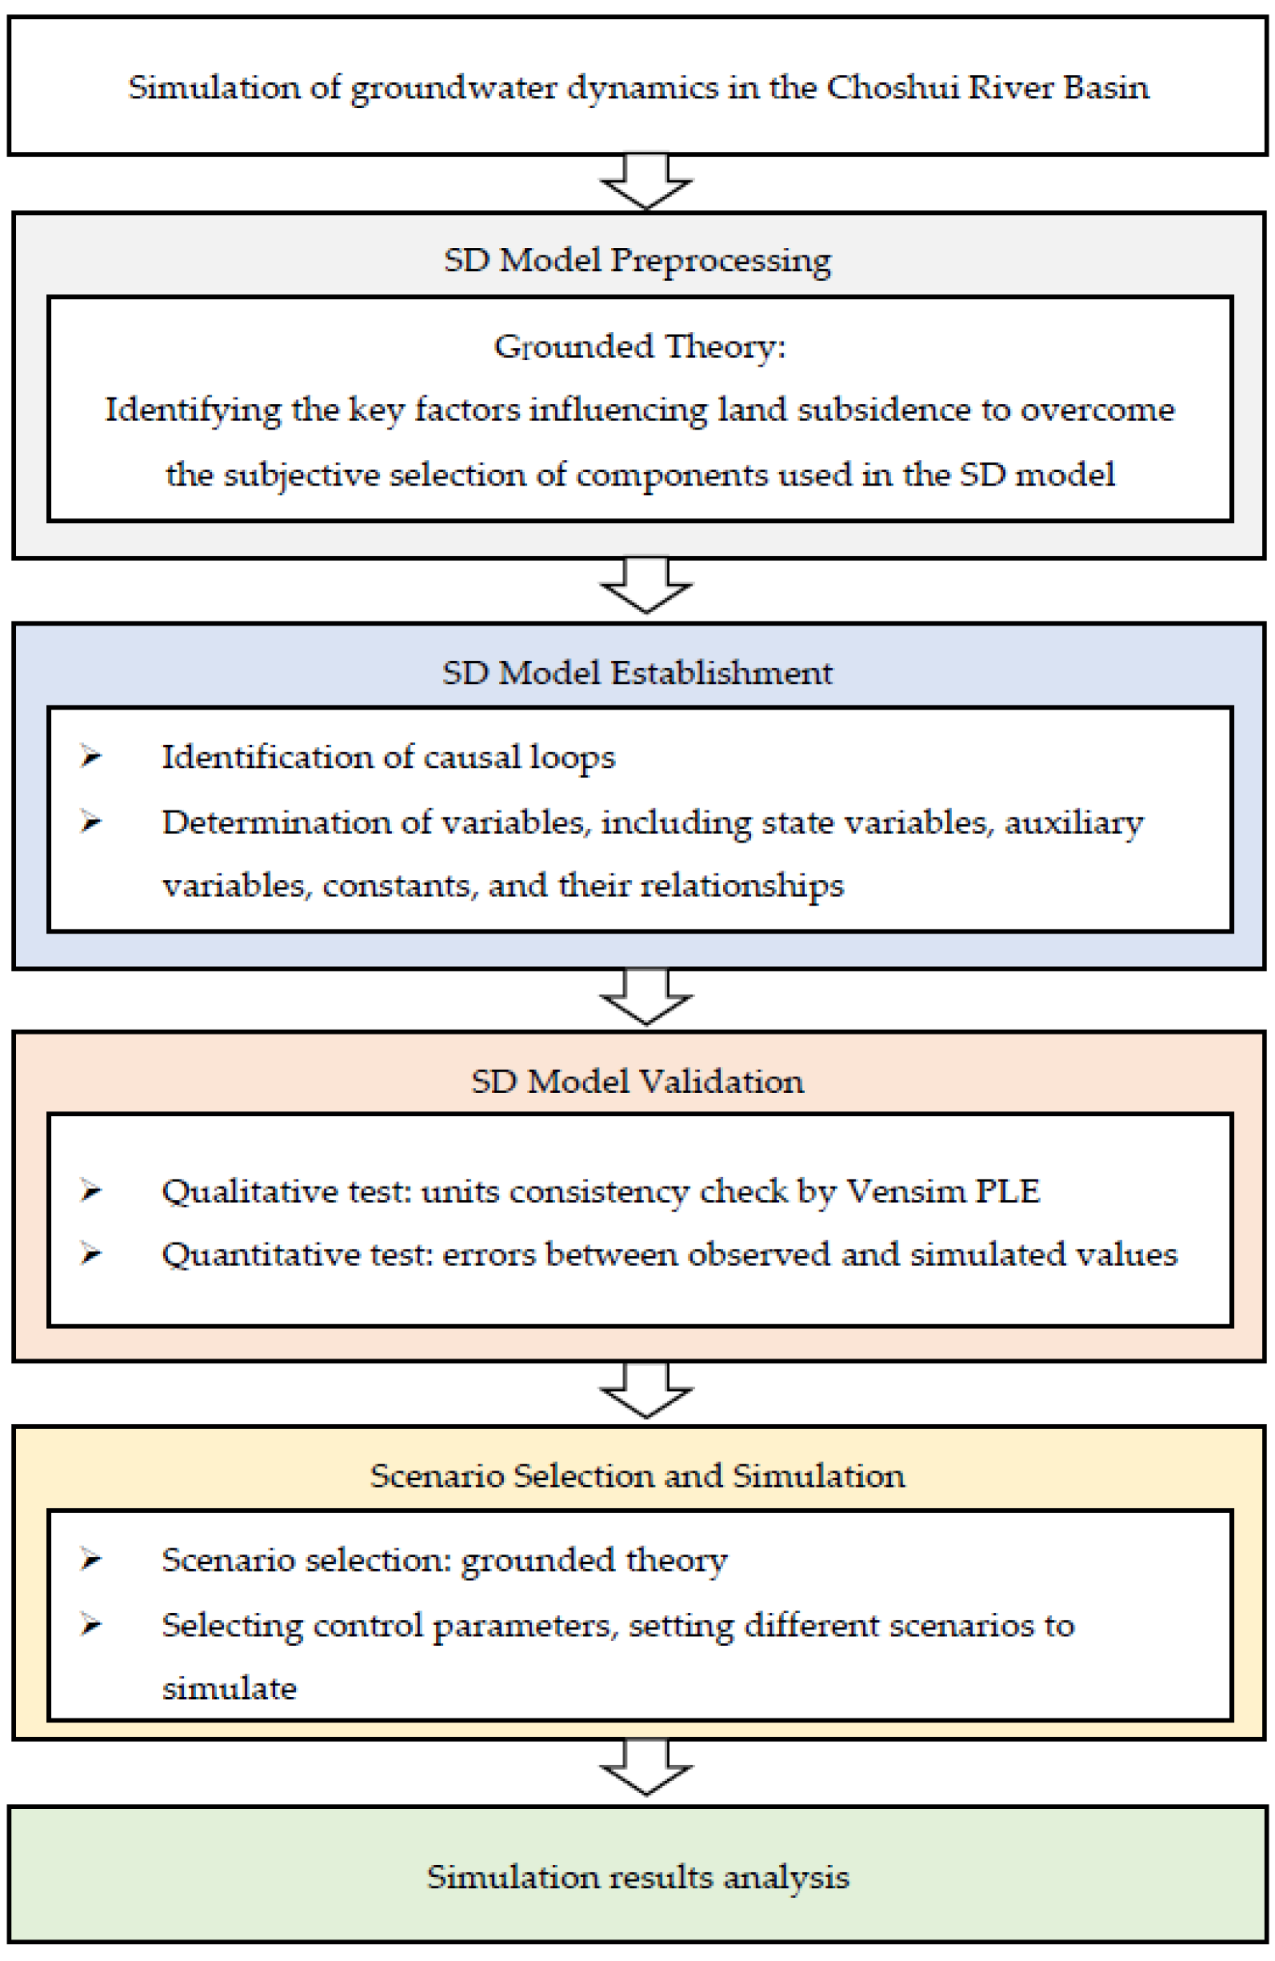
3. Materials and Methods
3.1. Selection of Key Factors—The Concept of Grounded Theory
- We began with a comprehensive review of the literature covering supply, demand, and policy. Supply included the development of water conservancy facilities, the excavation and sealing of water wells, and the construction of groundwater recharge facilities. Demand included water for agriculture, water for aquaculture, and water for industrial parks. Policy included water price adjustments and rewards for using recycled water.
- We then consolidated common factors based on segments and keywords repeatedly mentioned in the literature.
- Finally, we coded the factors and segments with the aim of identifying relationships among Level 1 codes in order to form higher-level concepts in accordance with the primary categories, such as supply and demand.
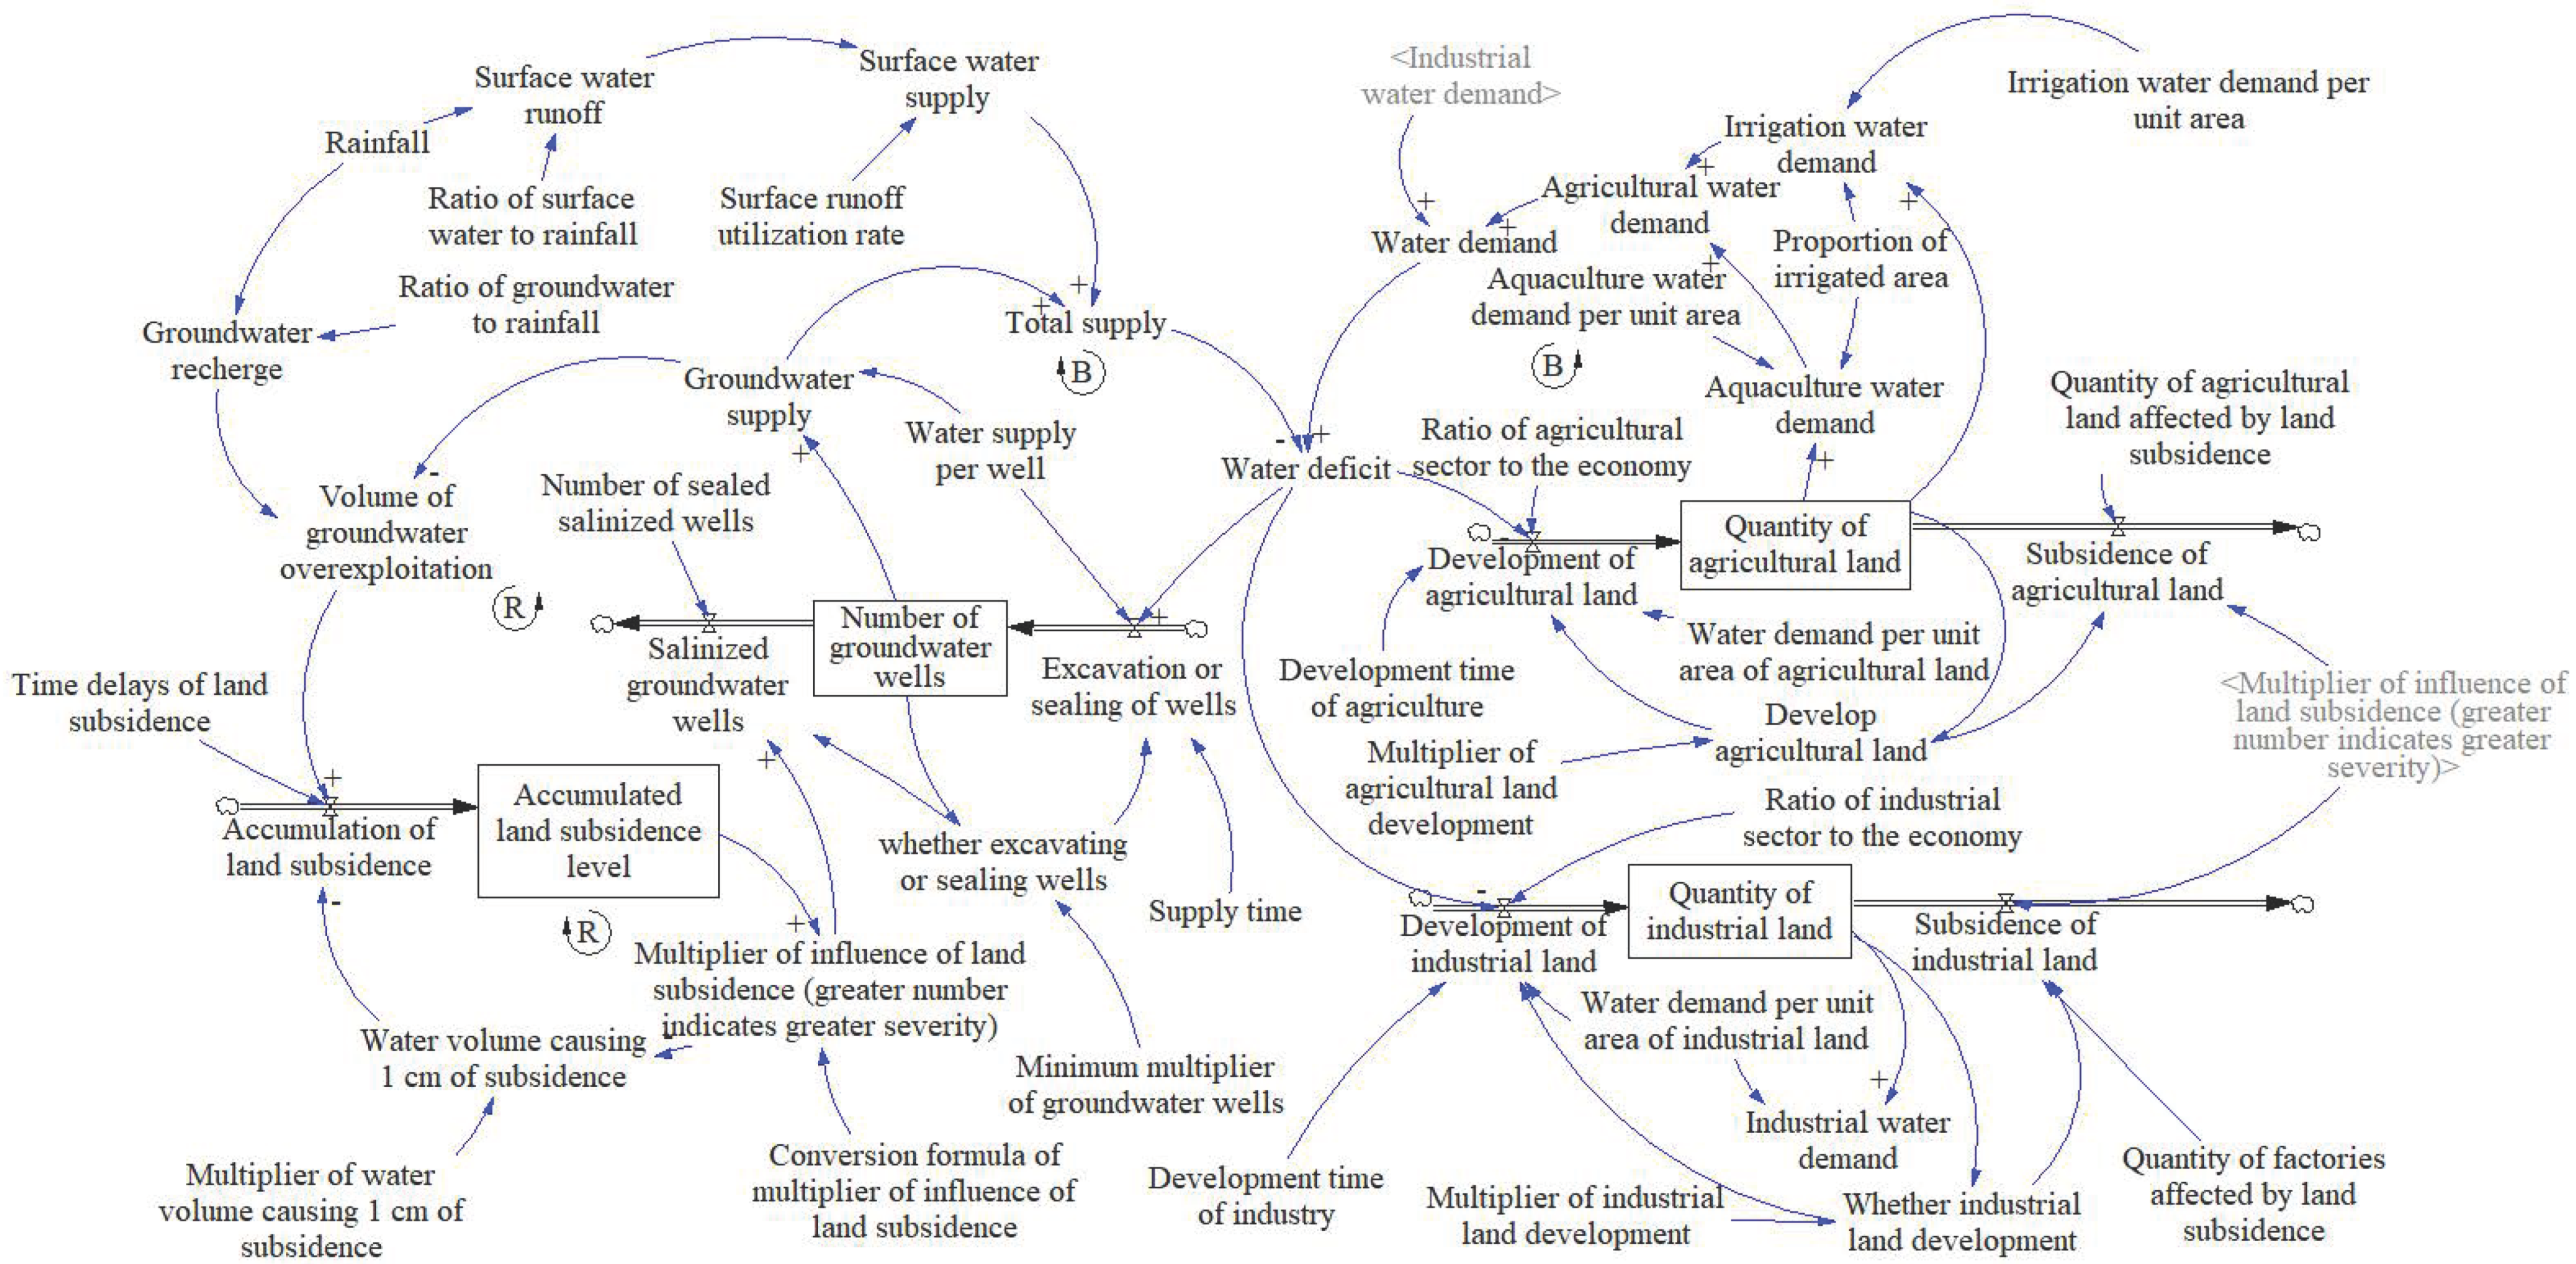
3.2. System Dynamics Model
3.3. Data Sources
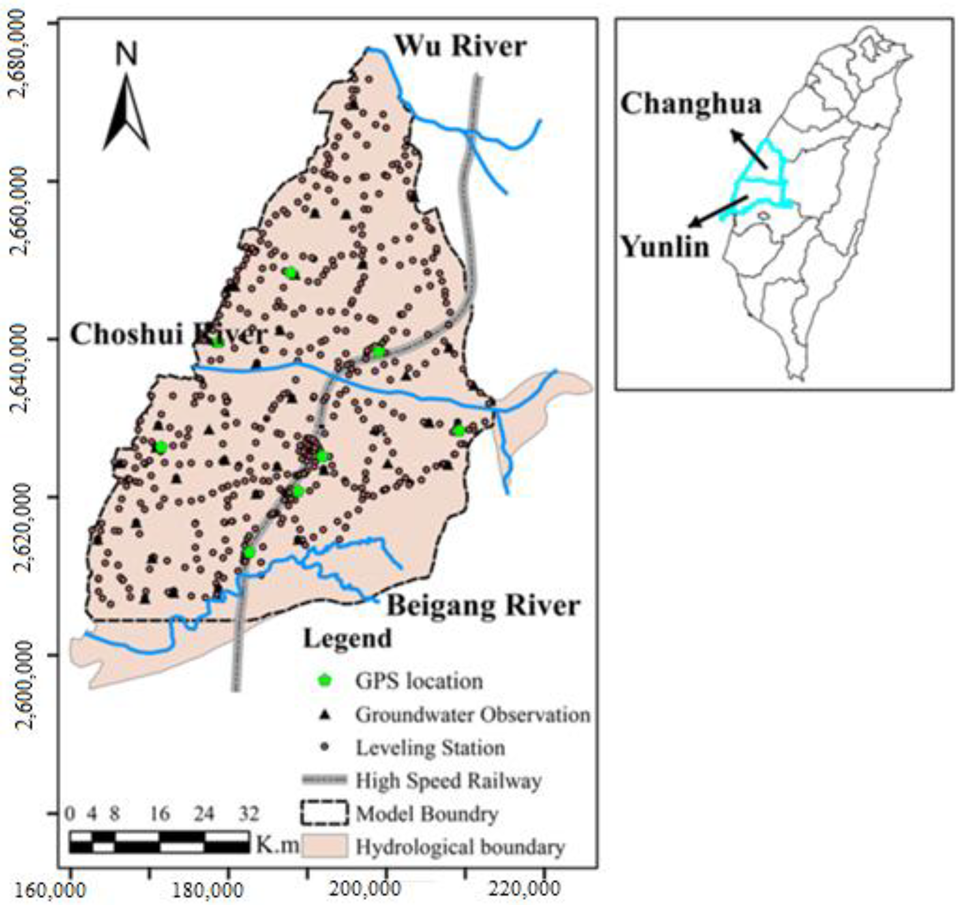
3.3.1. Study Area
3.3.2. Data Required for SD Model
4. Results
4.1. Scenario Design
- Scenario 1—Vigorous enforcement of well sealing
- Scenario 2—Promotion of surface water utilization
- Scenario 3—Reduced demand for irrigation water per unit area
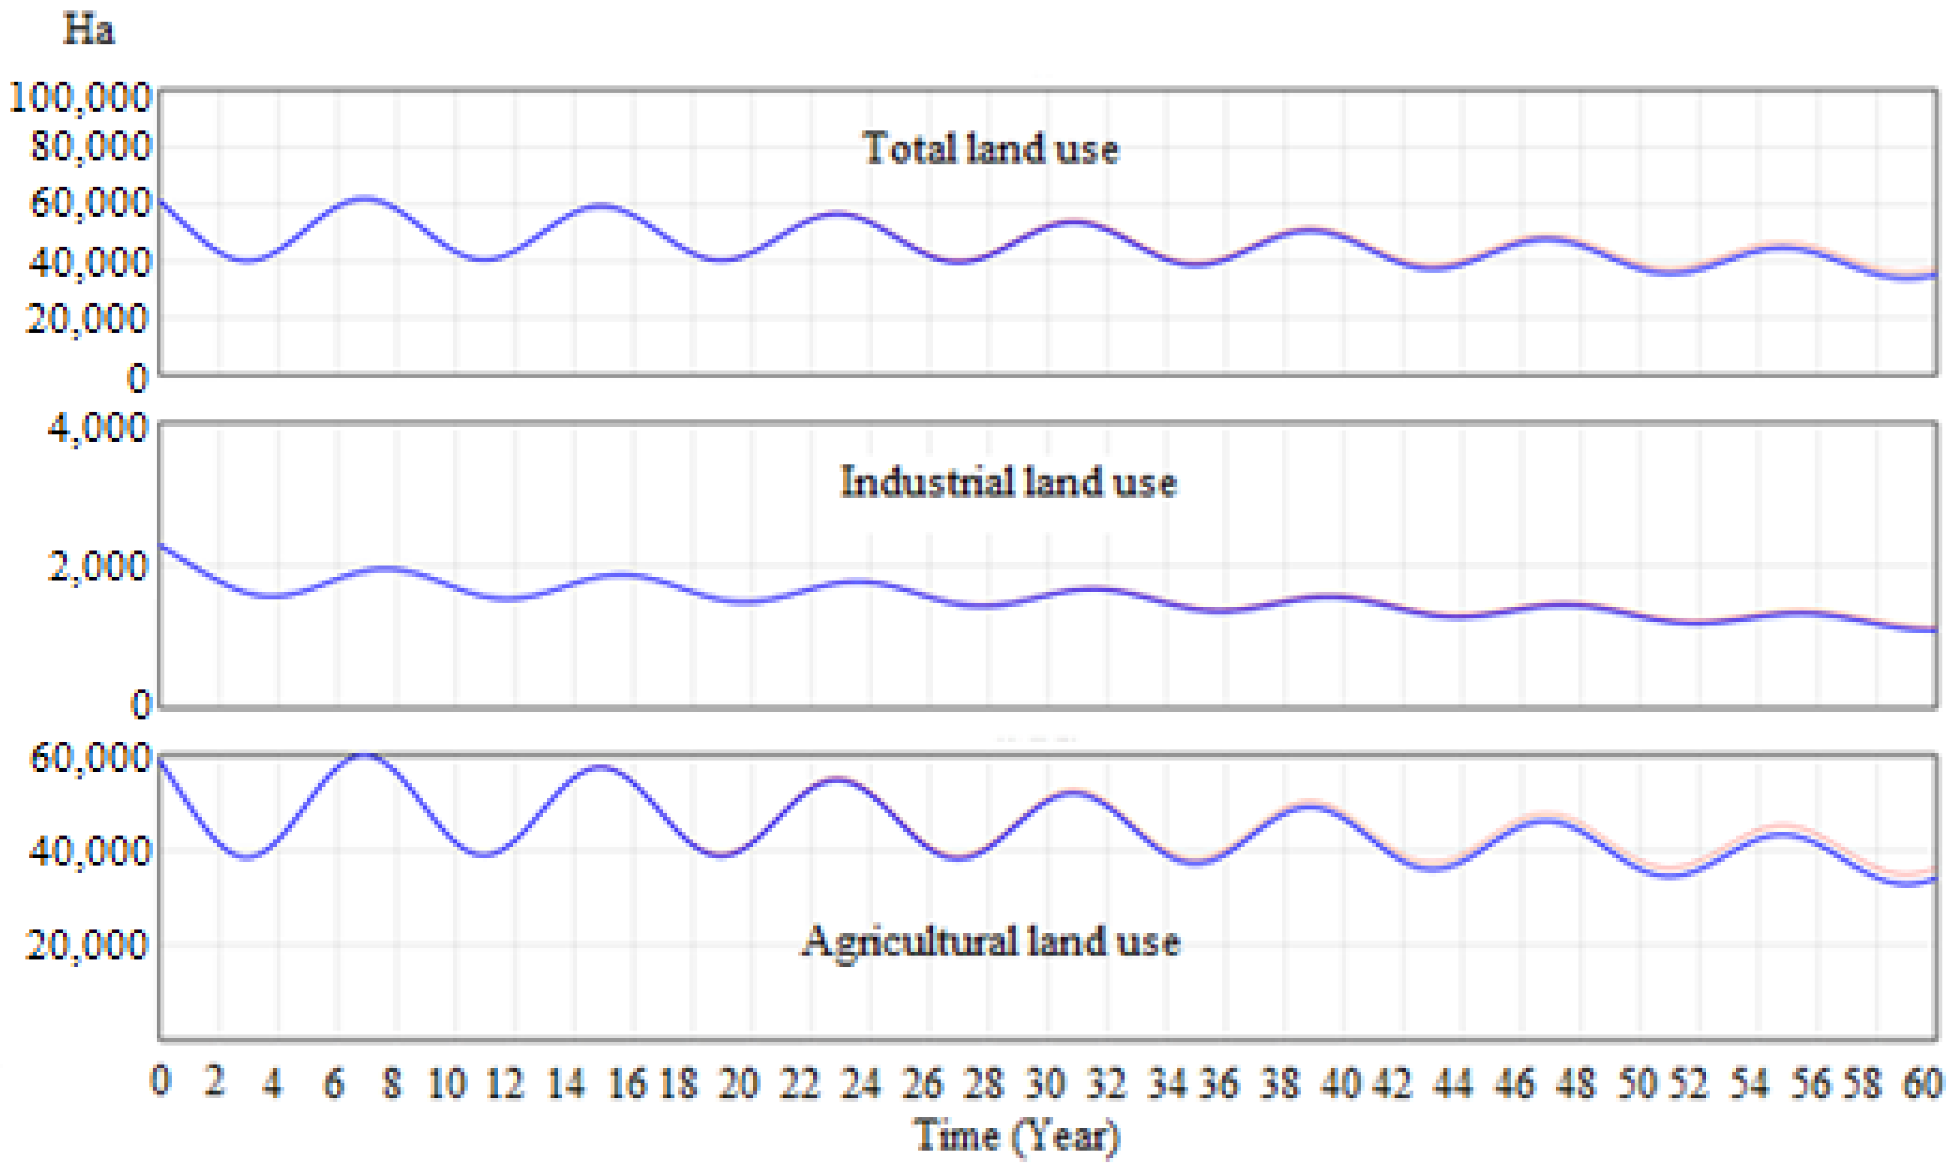
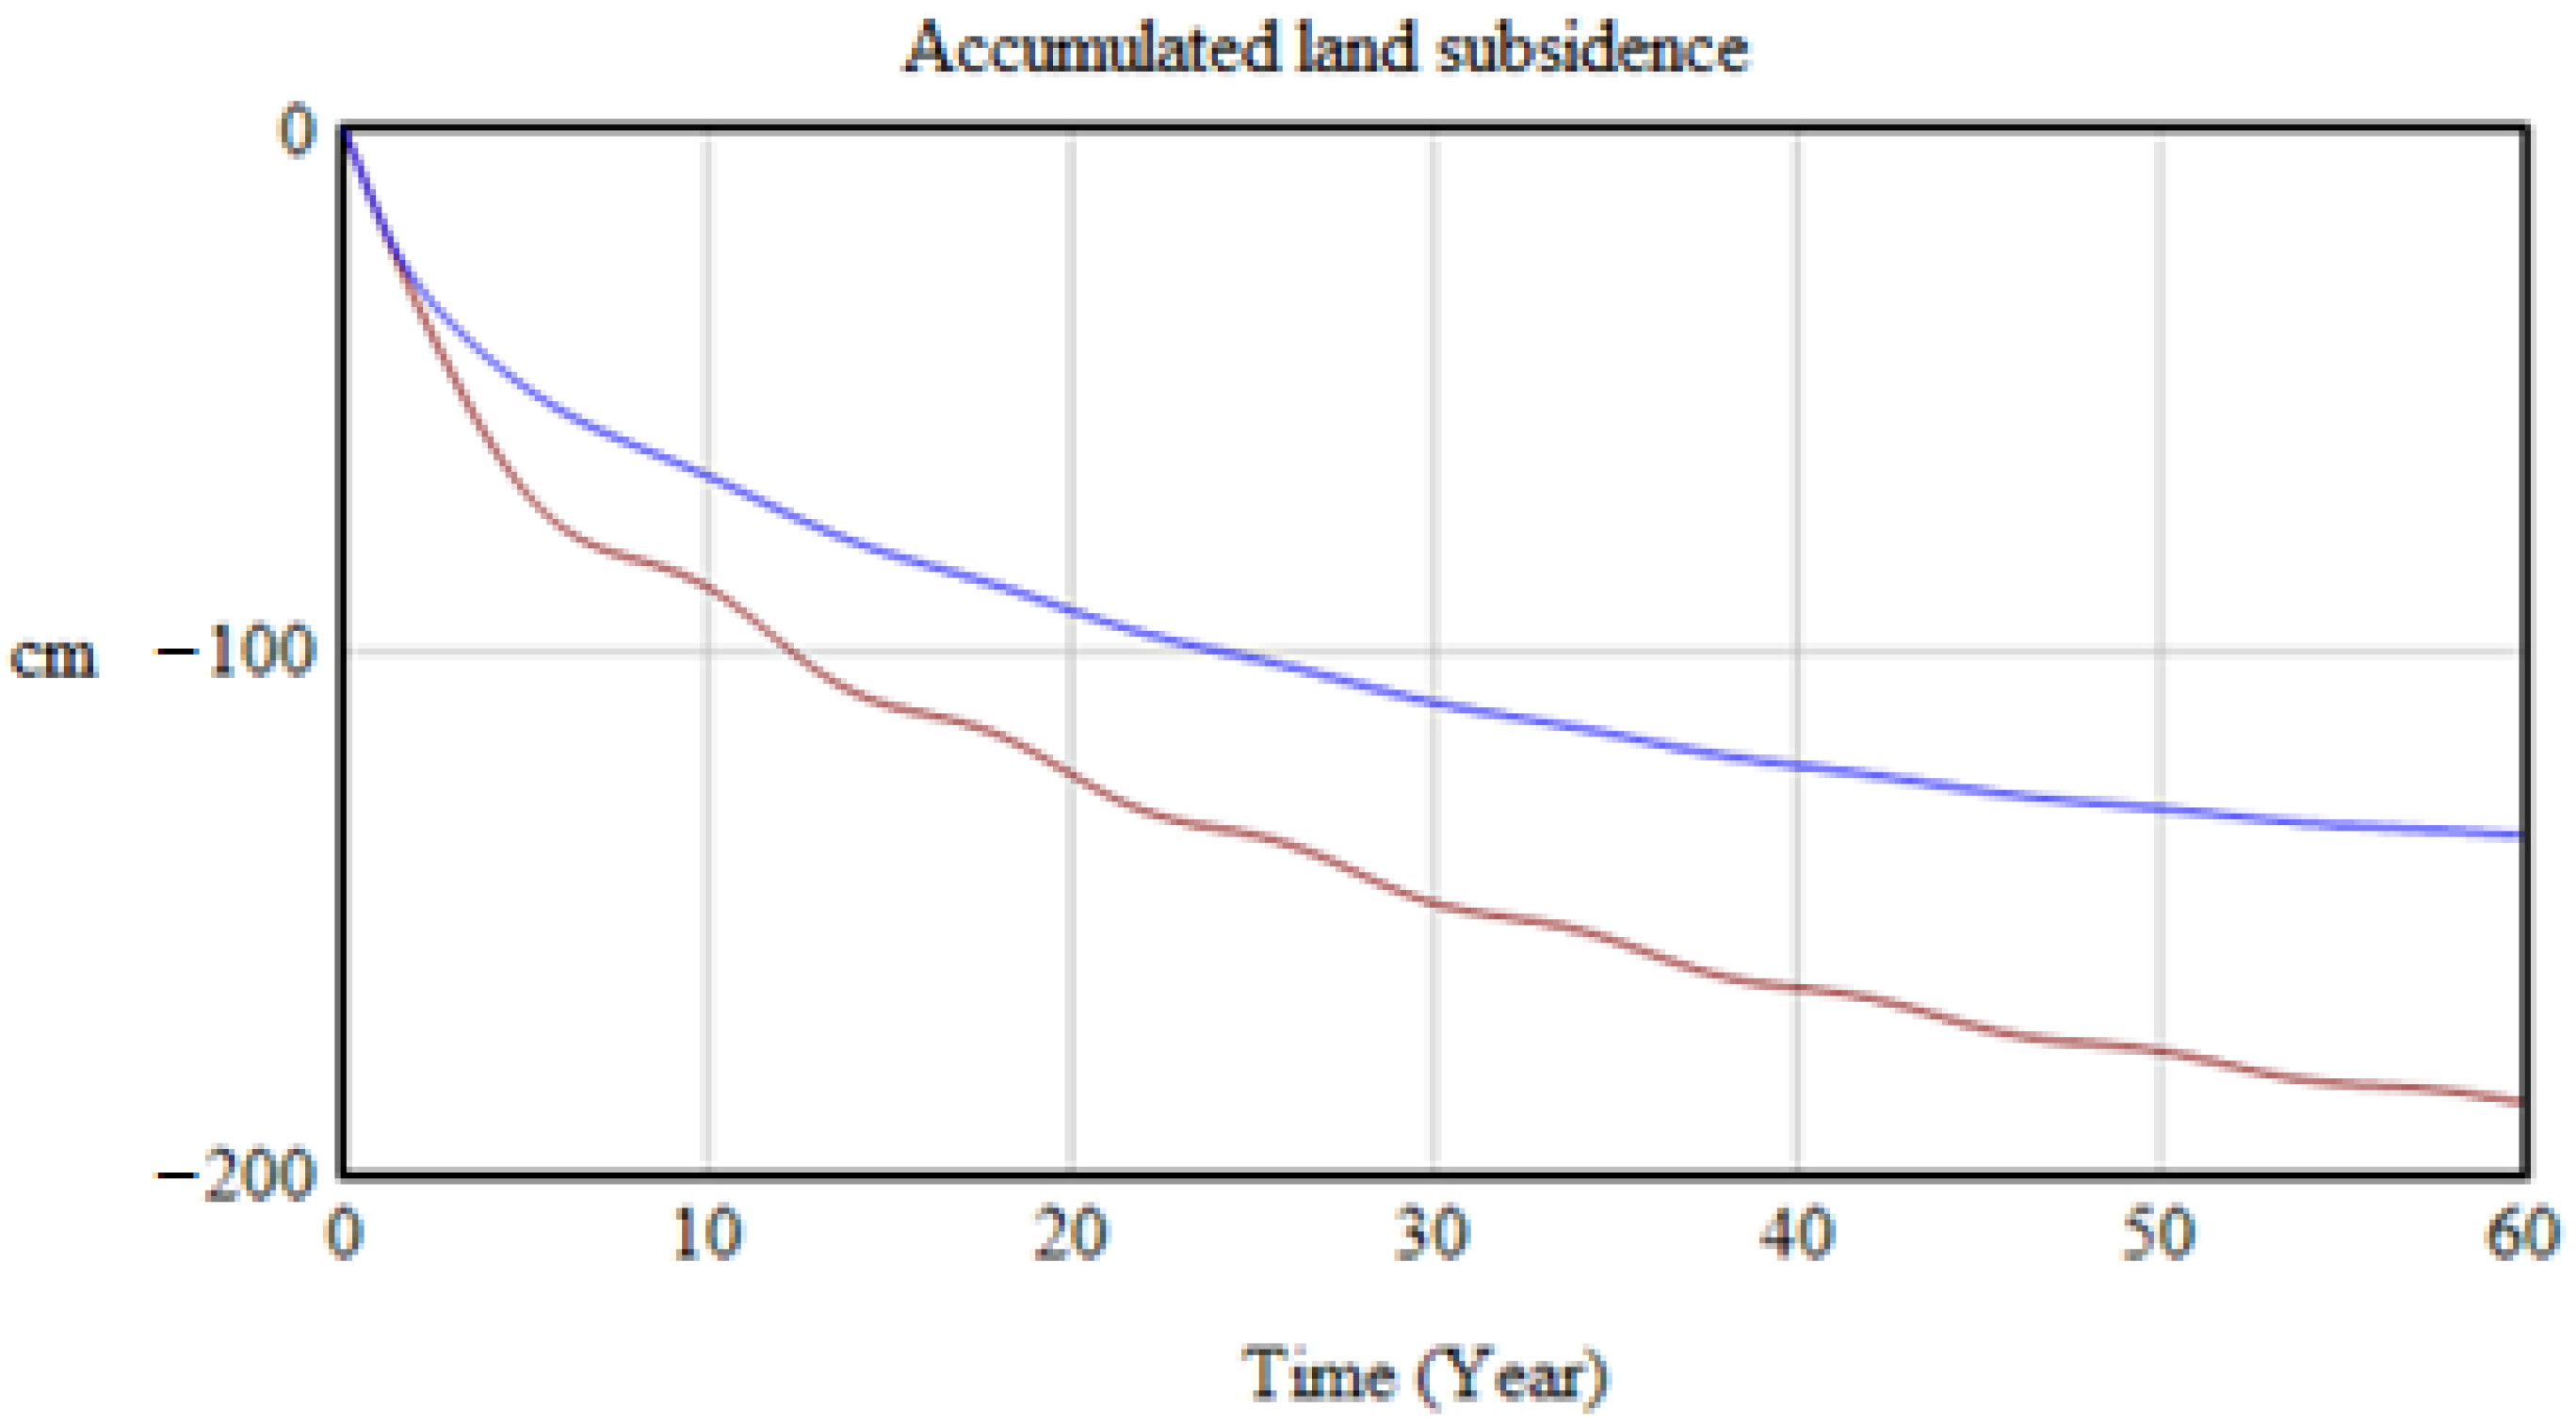
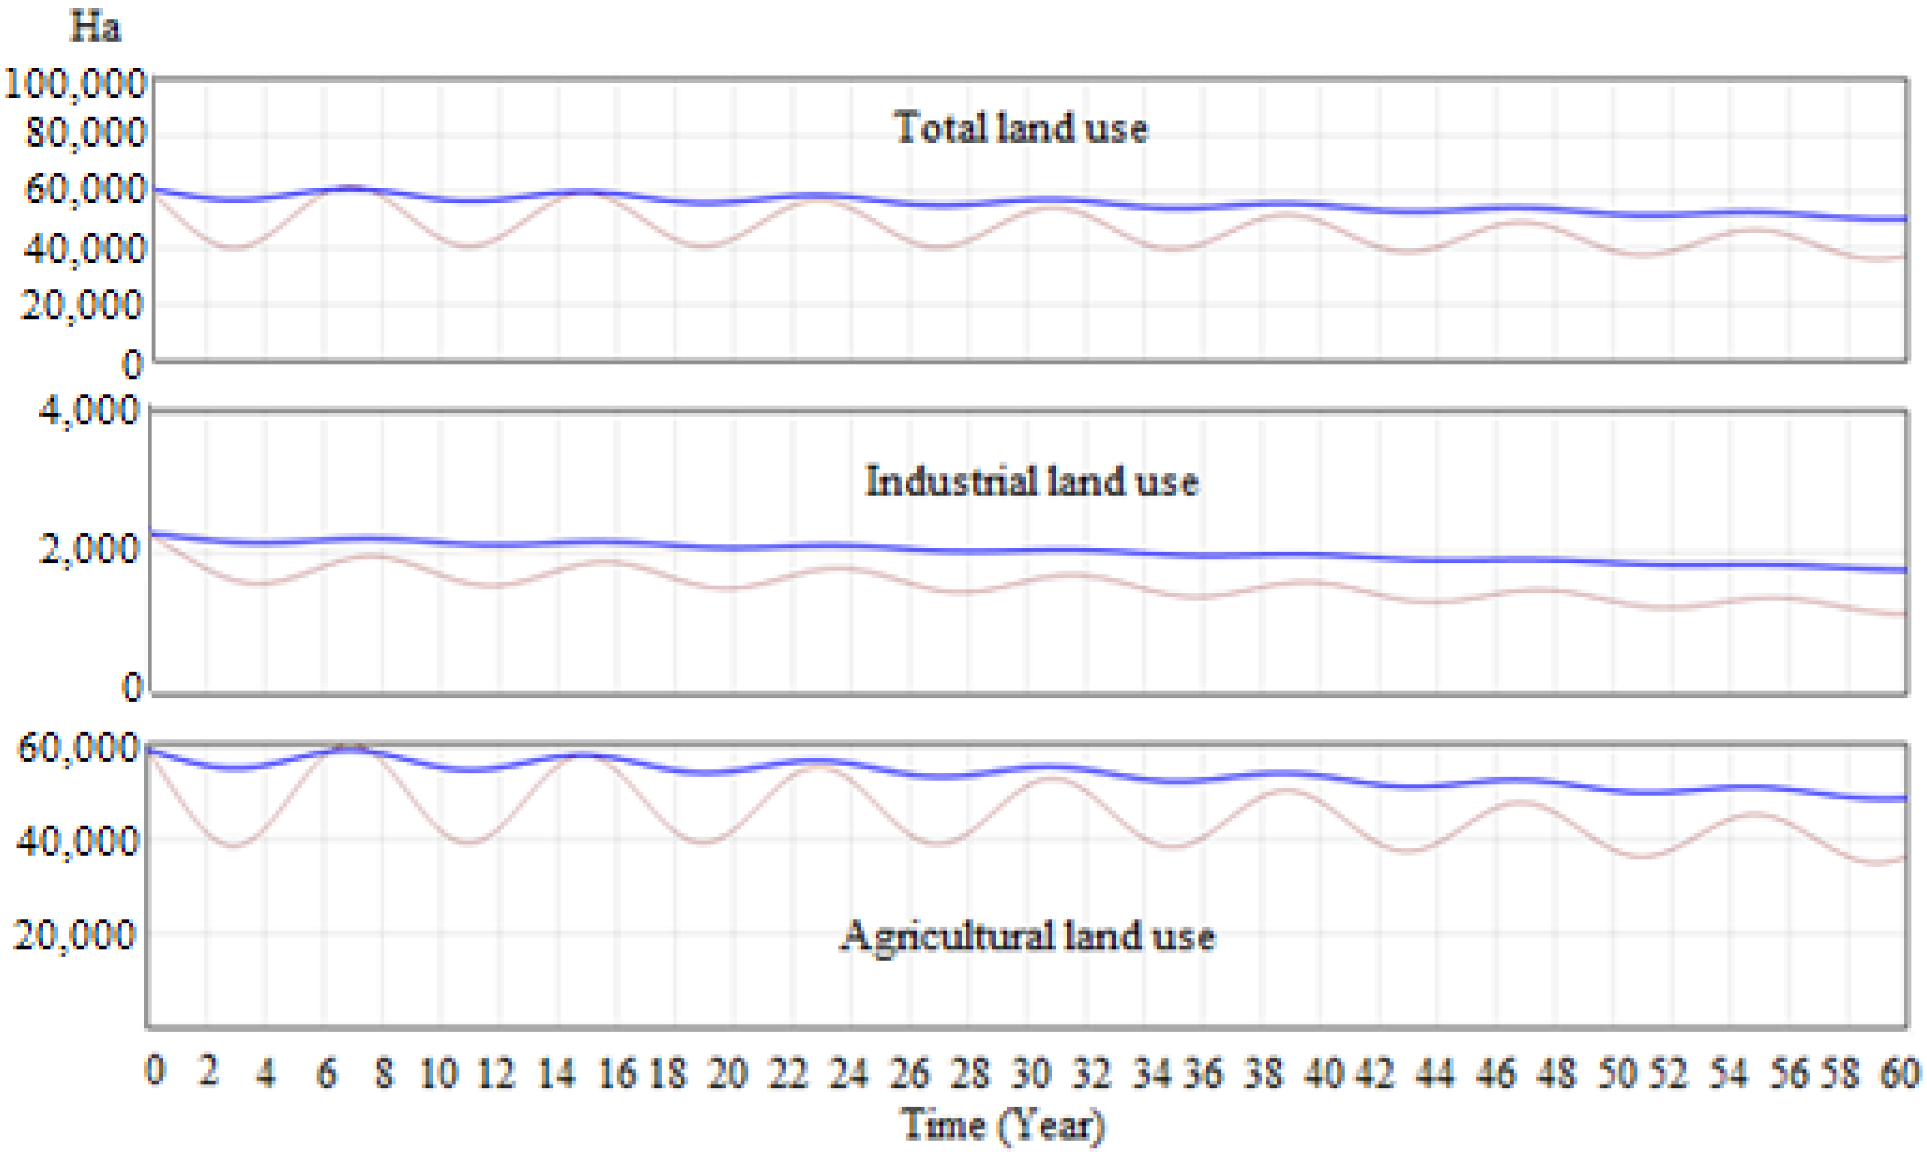
4.2. Simulation Results
- Scenario 1—Vigorous enforcement of well sealing
- Scenario 2—Promotion of surface water utilization
- Scenario 3—Reduced demand for irrigation water per unit area
5. Discussion
6. Conclusions
Author Contributions
Funding
Institutional Review Board Statement
Informed Consent Statement
Data Availability Statement
Conflicts of Interest
Appendix A
References
- Taylor, R.G.; Scanlon, B.; Doll, P.; Rodell, M.; van Beek, R.; Wada, Y.; Longuevergne, L.; Leblanc, M.; Famiglietti, J.S.; Edmunds, M.; et al. Ground water and climate change. Nat. Clim. Change 2013, 3, 322–329. [Google Scholar] [CrossRef] [Green Version]
- Foster, S.; Chilton, J.; Nijsten, G.J.; Richts, A. Groundwater—A global focus on the ‘local resource’. Curr. Opin. Environ. Sustain. 2013, 5, 685–695. [Google Scholar] [CrossRef]
- Jeanne, P.; Farr, T.G.; Rutqvist, J.; Vasco, D.W. Role of agricultural activity on land subsidence in the San Joaquin Valley, California. J. Hydrol. 2019, 569, 462–469. [Google Scholar] [CrossRef] [Green Version]
- Hwang, C.; Hung, W.C.; Liu, C.H. Results of geodetic and geotechnical monitoring of subsidence for Taiwan High Speed Rail operation. Nat. Hazards 2008, 47, 1–16. [Google Scholar] [CrossRef]
- Qureshi, M.A. Human development, public expenditure and economic growth: A system dynamics approach. Int. J. Soc. Econ. 2009, 36, 93–104. [Google Scholar] [CrossRef]
- Ghaffarzadegan, N.; Lyneis, J.; Richardson, G.P. How small system dynamics models can help the public policy process. Syst. Dyn. Rev. 2011, 27, 22–44. [Google Scholar] [CrossRef] [Green Version]
- Von Loeper, W.; Musango, J.; Brent, A.; Drimie, S. Analysing challenges facing smallholder farmers and conservation agriculture in South Africa: A system dynamics approach. S. Afr. J. Econ. Manag. Sci. 2016, 19, 747–773. [Google Scholar] [CrossRef]
- Wang, J.F.; Lu, H.P.; Peng, H. System dynamics model of urban transportation system and its application. J. Transp. Syst. Eng. Inf. Technol. 2008, 8, 83–89. [Google Scholar] [CrossRef]
- Aparicio, S.; Urbano, D.; Gómez, D. The role of innovative entrepreneurship within Colombian business cycle scenarios: A system dynamics approach. Futures 2016, 81, 130–147. [Google Scholar] [CrossRef] [Green Version]
- Nair, G.K.; Rodrigues, L.L.R. Dynamics of financial system: A system dynamics approach. Int. J. Econ. Financial Issues 2013, 3, 14–26. [Google Scholar]
- Meadows, D.H.; Meadows, D.L.; Randers, J.; Behrens, W.W., III. The Limits to Growth: A Report for the Club of Rome’s Project on the Predicament of Mankind; Universe Books: New York, NY, USA, 1972. [Google Scholar]
- Rong, L. Using System Dynamics in Decision Support for Sustainable Waste Management. Master’s Thesis, Department of Civil Engineering, National University of Singapore, Singapore, 2004. [Google Scholar]
- Simonovic, S.P. World water dynamics: Global modeling of water resources. J. Environ. Manag. 2002, 66, 249–267. [Google Scholar] [CrossRef]
- Zhang, L.; Mitsch, W.J. Modelling hydrological processes in created freshwater wetlands: An integrated system approach. Environ. Model. Softw. 2005, 20, 935–946. [Google Scholar] [CrossRef]
- Chen, C.H.; Liu, W.L.; Liaw, S.L.; Yu, C.H. Development of a dynamic strategy planning theory and system for sustainable river basin land use management. Sci. Total Environ. 2005, 346, 17–37. [Google Scholar] [CrossRef]
- Khan, S.; Yufeng, L.; Ahmad, A. Analysing complex behaviour of hydrological systems through a system dynamics approach. Environ. Model. Softw. 2009, 24, 1363–1372. [Google Scholar] [CrossRef]
- Wei, S.K.; Yang, H.; Song, J.X.; Abbaspour, K.C.; Xu, Z.X. System dynamics simulation model for assessing socio-economic impacts of different levels of environmental flow allocation in the Weihe river basin, China. Eur. J. Oper. Res. 2012, 221, 248–262. [Google Scholar] [CrossRef]
- Xi, X.; Poh, K.L. Using system dynamics for sustainable water resources management in Singapore. Procedia Comput. Sci. 2013, 16, 157–166. [Google Scholar] [CrossRef] [Green Version]
- Balali, H.; Viaggi, D. Applying a system dynamics approach for modeling groundwater dynamics to depletion under different economical and climate change scenarios. Water 2015, 7, 5258–5271. [Google Scholar] [CrossRef] [Green Version]
- Alifujiang, Y.; Abuduwaili, J.; Ma, L.; Samat, A.; Groll, M. System dynamics modeling of water level variations of Lake Issyk-Kul, Kyrgyzstan. Water 2017, 9, 989. [Google Scholar] [CrossRef] [Green Version]
- Ghasemi, A.; Saghafian, B.; Golian, S. System dynamics approach for simulating water resources of an urban water system with emphasis on sustainability of groundwater. Environ. Earth Sci. 2017, 76, 1–15. [Google Scholar] [CrossRef]
- Mokhtar, A.; Aram, S. Systemic insights into agricultural groundwater management: Case of Firuzabad Plain, Iran. Water Policy 2017, 19, 867–885. [Google Scholar] [CrossRef]
- Pluchinotta, I.; Pagano, A.; Giordano, R.; Tsoukiàs, A. A system dynamics model for supporting decision-makers in irrigation water management. J. Environ. Manag. 2018, 223, 815–824. [Google Scholar] [CrossRef]
- Bai, Y.; Langarudi, S.P.; Fernald, A.G. System dynamics modeling for evaluating regional hydrologic and economic effects of irrigation efficiency policy. Hydrology 2021, 8, 61. [Google Scholar] [CrossRef]
- Lo, C.Y. Study on the Managerial Strategy of Subsidence in Changha-Ynlin Area: Perspective of Collaborative Governance. Master’s Thesis, Graduate Institute of National Policy and Public Affairs, National Chung Hsing University, Taichung, Taiwan, 2016. (In Chinese). [Google Scholar]
- Liao, C.N.; Chen, B.H. Evaluation of the Effectiveness of a Subsidy Policy with Externality Consideration and the Flood Control Program in the Da-Cheng Township. Taiwan J. Appl. Econ. 2017, 101, 149–189. (In Chinese) [Google Scholar]
- Glaser, B.; Strauss, A. The Discovery of Grounded Theory: Stretegies for Qualitative Research; Aldine: Chicago, IL, USA, 1967. [Google Scholar]
- Forrester, J.W. Industrial Dynamics; Pegasus Communications: Waltham, MA, USA, 1961. [Google Scholar]
- Ventana Systems. Vensim PLE 8.0; Ventana Systems, Inc.: Harvard, MA, USA, 2021; Available online: https://vensim.com/vensim-software/ (accessed on 18 November 2021).
- Yu, H.L.; Chu, H.J. Understanding space–time patterns of groundwater system by empirical orthogonal functions: A case study in the Choshui River alluvial fan, Taiwan. J. Hydrol. 2010, 381, 239–247. [Google Scholar] [CrossRef]
- Chu, H.J.; Ali, M.Z.; Burbey, T. Development of a Groundwater-Drawdown Function to Estimate Spatially Varying Land Subsidence: A Case Study of the Choshui River Basin, Taiwan; Authorea Preprints: Tainan, Taiwan, 2020. [Google Scholar]
- Yang, Y.S. Analysis and Modeling between Groundwater and Land Subsidence in Choushui River Alluvial Fan. Master’s Thesis, Department of Resources Engineering, National Cheng Kung University, Tainan City, Taiwan, 2013. (In Chinese). [Google Scholar]
- Executive Yuan. Concrete Solutions and Action Plans for Land Subsidence in Yunzhang Area; Executive Yuan: Taipei, Taiwan, 2011. (In Chinese) [Google Scholar]


| Main Category | Level 2 | Level 1 | Concepts Drawn from Literature |
|---|---|---|---|
| Supply | Use of surface water | Inadequate interception of surface runoff | Insufficient planning of water for home use and irrigation, resulting in groundwater exploitation by the public and private sectors |
| Development of water conservancy facilities | Government investment in water supply facilities for the allocation of surface water resources | ||
| Development of water resource facilities aimed at increasing the water supply, such as the Hushan Reservoir and Niaozueitan Artificial Lake | |||
| Use of groundwater | Water well management and sealing | Implementation of water well management and industrial planning to mediate water usage | |
| Ceasing all subsidies involving consumables and power consumption leading to groundwater exploitation | |||
| Management of existing illegal wells, prevention of new illegal wells, and an annual reduction in the number of publicly operated water wells | |||
| Groundwater recharge | Installation of groundwater recharge facilities in Yunlin and Changhua | ||
| Demand | Water use by industry | Changes in use of water for agricultural irrigation | Provision of rewards to promote the conversion of farms irrigated with groundwater to dry farming or afforestation, or leaving such farms fallow |
| Converting 6000 hectares of farmland to dry farming and 2000 hectares of flatland to afforestation | |||
| Changes in use of water for aquaculture | Government allocation of coastal areas with poor soil in Yunlin and Changhua to freshwater aquaculture | ||
| Gradual replacement of freshwater aquaculture with seawater aquaculture | |||
| Industrial water use | Majority of water supply for industry from wells | ||
| More pronounced impact of deep water wells than shallow wells on land subsidence | |||
| Other water uses | Water price adjustments in response to changes in demand | Establishing a reasonable water price structure aimed at controlling consumption to prevent waste: the adoption of tiered pricing and removal of basic fees, while accounting for the costs involved in developing water resources | |
| Rewards for using recycled water | Encouraging major water users to employ water-saving equipment and recycle water |
| Name | Quantity | Data Source |
|---|---|---|
| Ratio of surface water to rainfall | 0.71 (no unit) | Water Resources Agency, Ministry of Economic Affairs |
| Ratio of groundwater to rainfall | 0.04 (no unit) | Water Resources Agency, Ministry of Economic Affairs |
| Surface runoff utilization rate | 0.16 (no unit) | Water Resources Agency, Ministry of Economic Affairs |
| Area of land under agricultural development | 106,566 hectare | Water Resources Agency, Ministry of Economic Affairs |
| Area of land under industrial development | 4978 hectare | Water Resources Agency, Ministry of Economic Affairs |
| Water demand for irrigation per unit area | 14.2 thousand cubic meters per hectare | Water Resources Agency, Ministry of Economic Affairs and our estimates |
| Water demand for aquaculture per unit area | 32.3 thousand cubic meters per hectare | Water Resources Agency, Ministry of Economic Affairs and our estimates |
| Water demand for industry per unit area | 56.6 thousand cubic meters per hectare | Water Resources Agency, Ministry of Economic Affairs and our estimates |
| Proportion of area used for irrigation | 0.9 (no unit) | Water Resources Agency, Ministry of Economic Affairs |
| Proportion of area used for aquaculture | 0.1 (no unit) | Water Resources Agency, Ministry of Economic Affairs |
| Proportion of water used for agriculture | 0.97 (no unit) | Water Resources Agency, Ministry of Economic Affairs |
| Proportion of water used for industry | 0.03 (no unit) | Water Resources Agency, Ministry of Economic Affairs |
| Name | Quantity | Data Source |
|---|---|---|
| Rainfall | 6.1 billion cubic meters | Our estimates and verified by experts |
| Average volume of water excavated from each well | 100 thousand cubic meters per well | Our estimates and verified by experts |
| Number of water wells | 150,000 wells | Our estimates and verified by experts |
| Number of wells sealed due to land subsidence | 500 wells annually for each 1 cm of subsidence | Our estimates and verified by experts |
| Time delays effect | 1~3 years | Our estimates and verified by experts |
| Water volume causing 1 cm of land subsidence | 19,011~263,157 thousand cubic meters per cm | Yang [32] |
Publisher’s Note: MDPI stays neutral with regard to jurisdictional claims in published maps and institutional affiliations. |
© 2022 by the authors. Licensee MDPI, Basel, Switzerland. This article is an open access article distributed under the terms and conditions of the Creative Commons Attribution (CC BY) license (https://creativecommons.org/licenses/by/4.0/).
Share and Cite
Huang, Y.-H.; Lai, Y.-J.; Wu, J.-H. A System Dynamics Approach to Modeling Groundwater Dynamics: Case Study of the Choshui River Basin. Sustainability 2022, 14, 1371. https://doi.org/10.3390/su14031371
Huang Y-H, Lai Y-J, Wu J-H. A System Dynamics Approach to Modeling Groundwater Dynamics: Case Study of the Choshui River Basin. Sustainability. 2022; 14(3):1371. https://doi.org/10.3390/su14031371
Chicago/Turabian StyleHuang, Yun-Hsun, Yan-Jiang Lai, and Jung-Hua Wu. 2022. "A System Dynamics Approach to Modeling Groundwater Dynamics: Case Study of the Choshui River Basin" Sustainability 14, no. 3: 1371. https://doi.org/10.3390/su14031371
APA StyleHuang, Y.-H., Lai, Y.-J., & Wu, J.-H. (2022). A System Dynamics Approach to Modeling Groundwater Dynamics: Case Study of the Choshui River Basin. Sustainability, 14(3), 1371. https://doi.org/10.3390/su14031371