Article

Outreach and Post-Publication Impact of Soil Erosion Modelling Literature

1
Faculty of Civil and Geodetic Engineering, University of Ljubljana, 1000 Ljubljana, Slovenia
2
Department of Earth and Environmental Sciences, University of Pavia, 27100 Pavia, Italy
3
Department of Biological Environment, Kangwon National University, Chuncheon 24341, Korea
4
Joint Research Centre (JRC), European Commission, 21027 Ispra, Italy
*
Author to whom correspondence should be addressed.
Sustainability 2022, 14(3), 1342; https://doi.org/10.3390/su14031342
Submission received: 29 November 2021 / Revised: 18 January 2022 / Accepted: 20 January 2022 / Published: 25 January 2022
(This article belongs to the Section Soil Conservation and Sustainability)

Abstract

:
Back in the 1930s, the aphorism “publish or perish” first appeared in an academic context. Today, this phrase is becoming a harsh reality in several academic environments, and scientists are giving increasing attention to publishing and disseminating their scientific work. Soil erosion modelers make no exception. With the introduction of the bibliometric field, the evaluation of the impact of a piece of scientific work becomes more articulated. The post-publication impact of the research became an important aspect too. In this study, we analyse the outreach and the impact of the literature on soil erosion modelling using the altmetric database, i.e., Altmetric. In our analysis, we use only a small fraction (around 15%) of Global Applications of Soil Erosion Modelling Tracker (GASEMT) papers because only 257 papers out of 1697 had an Altmetric Score (AS) larger than 0. We observed that media and policy documents mentioned more frequently literature dealing with global-scale assessments and future projection studies than local-scale ones. Papers that are frequently cited by researchers do not necessarily also yield high media and policy outreach. The GASEMT papers that had an AS larger than 0 were, on average, mentioned by one policy document and five Twitter users and had 100 Mendeley readers. Only around 5% and 9% of papers with AS > 0 appeared in news articles and blogs, respectively. However, this percentage was around 45% for Twitter and policy mentions. The top GASEMT paper’s upper bound was around 1 million Twitter followers, while this number was around 10,000 for the 10th ranked GASEMT paper. The exponentially increasing trend for erosion modelling papers having an AS has been confirmed, as during the last 3 years (2014–2017), we estimated that the number of entries had doubled compared to 2011–2014 and quadrupled if we compare it with 2008–2011.

1. Introduction

Land use and management policies in the years and decades to come will need to better adapt to climate change and, inherently, also be more effectively related to soil erosion, as soil degradation is a rising global threat to land, fresh waters, and oceans [1]. Sustainable land use and management policies need to take into account the extent and hotspots of soil erosion, for which today soil erosion modelling offers cost-effective assessments worldwide. In addition, soil erosion models allow us to gain insights into future dynamics too, which is important when substantially different future scenarios for climate and land use are envisaged. Therefore, we notice a strong link between soil erosion modelling and land use policy [2,3,4]. There are many open challenges related to soil erosion and policy developments in Europe [5]. For example, the Sustainable Development Goals (SDGs) and the Common Agricultural Policy (CAP) present challenges for integrating soil erosion modelling into policy [5]. However, there are still some open questions, such as: (a) are soil erosion modelling studies actually picked up by different policy documents? (b) What is the attention of the soil erosion modelling studies given by paper and digital media? In order to gain new insights regarding the outreach of soil erosion modelling studies, a bibliometric investigation of the recently developed Global Applications of Soil Erosion Modelling Tracker (GASEMT) [6,7,8] and altmetric.com (accessed on 15 November 2021) [9] could be a pragmatic approach.
Altmetrics stands for “alternative metrics” to long-standing and established bibliometrics such as citation counts, journal impact factors or h-index. Altmetrics are social web metrics for academic publications [10]. Altmetric.com tracks multiple sources such as Twitter, blogs, news, Wikipedia, social media, and policy documents and then collects entries originating from research papers. In this context, altmetrics are a welcome addition to traditional scientometric indices (e.g., number of citations, downloads, etc.) and allow users to understand and measure the outreach and impact of research through online interactions. The use of altmetrics is based on the studies of Priem and his collaborators, who investigated social media for its impact on academia and research [11,12,13]. However, altmetric products do not only measure social media but also detect other content, such as policy mentions or references in journals, blogs, and online sources. Websites such as altmetric.com [9] aggregate different bibliometric data from a range of media sources by tracking these engagement events.
It should be noted that altmetrics are gaining popularity. A search in the SCOPUS database in August 2021 using the string “altmetrics AND citation” in “All Fields” revealed 2741 documents, of which 1338 were open access of any kind, 1835 were articles from journals, 293 were conference papers, and 265 were review papers. The first three papers indexed in SCOPUS and relevant to altmetrics were published in 2011, and the increasing trend is obvious (507 altmetric-related papers were published in 2020). A slightly modified search in the SCOPUS database additionally with the string “altmetric” AND “soil” in the document title, abstract, and keywords resulted in only one document [14]. It should also be noted that this paper did not directly investigate the soil erosion modelling topic, but rather focused on climate change and only briefly mentioned soil [14]. Therefore, it is clear that very few studies have evaluated the outreach of soil erosion modelling or soil-related studies to different types of media and policy documents. Moreover, altmetric data can inform researchers in the field of soil erosion modelling on the societal impact of their research. By carrying out a review from the altmetrics perspective, one may better understand how global, continental, national or local soil erosion modelling is being interacted with by relevant stakeholders, such as policy makers, governments, non-governmental organizations, influencers, bloggers, journalists or general public, among others.
The overall aim of this study is to measure the post-publication impact of soil erosion modelling studies using the GASEMT database and altmetric.com. More specifically, this study will investigate: (i) the correlations among studies that have Altmetric Scores of AS = 0, AS > 0, and AS > 10 in relation to the GASEMT attributes, such as scale, continent, and model used; (ii) the most appropriate predictor in altmetrics (or the most suited metric) relevant to the number of citations; and (iii) what is the overall outreach of soil erosion modelling papers or journals in media and policy documents? In addition, this study will add new elements into the GASEMT database and will provide a baseline dataset for AS in soil erosion modelling, which may be compared with other modelling fields or soil-related aspects. Thus, to the best of the authors’ knowledge, no study has been published that has investigated the outreach and post-publication impact of soil erosion modelling studies. Such a study would investigate the link between soil erosion modelling and policy developments, providing evidence for sustainable development.

2. Materials and Methods

2.1. GASEMT Database

The recently published GASEMT database [6,8], freely available in the European Soil Data Centre (ESDAC) [7], includes 3030 soil erosion modelling records from 1697 individual papers. It should be noted that GASEMT includes papers published between 1994 and 2017 [6]. More than 8400 scientific contributions were reviewed by 67 soil-erosion scientists from 25 countries [6]. Each soil erosion modelling record in the GASEMT database includes almost 50 fields such as location of the study, model used, input data, calibration method, etc. [6]. Based on the GASEMT database, a global review and statistical analysis were performed [6], as well as a bibliometric investigation [8]. It should also be noted that this bibliometric investigation did not include any altmetric data. Thus, this study aims also to add the outreach and post-publication impact of the soil erosion modelling studies into the GASEMT database. Bezak et al. (2021) [8] primarily focused on the relationship between number of citations and different GASEMT characteristics. Moreover, bibliometric networks were visualized and investigated. GASEMT was selected in this study since it provides the most comprehensive and relatively large database of soil erosion modelling applications that was constructed based on the manual review of 8400 papers by 67 soil erosion modelers. Thus, the GASEMT database is not just a simple output of a search from Scopus or Web of Science. GASEMT records were carefully picked up (after a quality control) and statistical, bibliographic and a plethora of other information were extracted from the papers. Therefore, the GASEMT database is, according to the author’s best knowledge, the most suitable database available to study outreach and post-publication impact of the soil erosion modelling studies. Additional information about the GASEMT database can be found in Borrelli et al. [6].

2.2. Altmetric.com

It should be noted that there are multiple altmetric sources such as altmetric.com [9], PlumX or Crossref Event Data [15]. In the scope of this study, we used altmetric.com as this product provides better coverage of tweets, news and blog posts [15]. Moreover, altmetric.com provides a coverage of policy documents, which are of interest for this study. Some shortcomings of altmetrics are the lack of standard definitions, the fact that data are not normalized plus some known tracking issues (e.g., if a bibliographic record does not have a DOI—Digital Object Identifier).
Altmetric.com tracks multiple sources in order to provide details about conversations related to different scholarly content [9]. This product has been used for numerous applications in recent years [16,17,18,19,20]. We harvested the GASEMT papers (with the DOI) using the Altmetric Explorer, which among other things allows us to extract the Altmetric Score (AS), the number of Mendeley readers and the number of dimensions citations. The AS in Altmetric is an integer calculated by an algorithm as following: mentions per News (8 points), Blog (5 points), Policy (3 points), Patent (3 points), Wikipedia (3 points), Peer Review (1 point), Weibo (1 point), Google+ (1 point), F1000 (1 point), Syllabi (1 point), LinkedIn (0.5 points), Twitter (0.25 points), Facebook (0.25 points), Reddit (0.25 points), Pinterest (0.25 points), Q&A (0.25 points) and YouTube (0.25 points) [9]. As can be seen, different sources have different weights, where news, blogs, and policy documents have higher weights compared to mentions in networks of communities and social media such as Reddit or Facebook [9]. It should be noted that number of Mendeley readers and dimension citation do not count towards the AS (0-point weight).
The AS provides a weighted approximation of the papers’ outreach and it is calculated using three main factors: volume, sources and authors [9]. Since 2012, altmetric.com tracks mentions in multiple sources using different identifiers such as DOI [9]. Moreover, altmetric.com uses the so-called altmetric donut badges in order to provide information about the AS and different sources of attention [9]. Moreover, using the Altmetric Explorer, one can also obtain data about specific mentions that scholarly content has received through time [9]. The data from altmetric.com were extracted in June 2021 and show status at the time of data extraction. It should be noted that the AS is dynamic and changes over time.

2.3. Statistical Analysis

In the scope of the conducted statistical investigation, different subsets of the GASEMT database were created based on the AS values, i.e., AS = 0, AS > 0. The last one was analysed in two subsets: 10 > AS > 0 (low outreach/impact) and AS > 10 (high outreach/impact). A statistical analysis was performed using (i) the Pearson correlation coefficient as an indicator of the linear correlation and (ii) linear regression to set up the linear function between dependent variables. We also investigated the papers with the highest AS in relation to policy, media mentions and Twitter mentions (i.e., number of Twitter followers). Furthermore, we also compared the altmetric characteristics of journals where soil erosion modelling studies are most frequently published [8]. The statistical analysis provides numerous indicators (per model, spatial scale, temporal scale, etc.) in order to provide evidence of the most important drivers for having higher outreach/impact.

3. Results and discussion

3.1. Relationship between GASEMT Attributes and Altmeric Score

Almost 85% of records in the GASEMT database have an AS = 0. This finding already allows us to draw a first conclusion, which is that soil erosion modelling is not a (scientific) topic of high interest for the general public. This appears very evidently when we compare the AS values with the one of topics that are more frequently discussed in media, such as climate change [14] or COVID-19 [21,22,23]. For example, Rahimi et al. [14] showed that around 50% of papers about climate change were also detected by altmetric.com. Using the GASEMT data, it was found that only 15% of records have an AS larger than 0, and only around 1% have an AS larger than 10 (Table 1). Furthermore, almost all records with AS larger than 0 were published in journals and not conference proceedings or book series (Table 1). Thus, it seems that conference proceedings and book series publications are not recognized by the altmetric.com tracking engines in the case of soil erosion modelling studies.
Back in 2015, Costas et al. [24] confirmed that the presence and density of (social) media altmetric counts were still very low and not very frequent among scientific publications, with 15–24% of the publications presenting an Altmetric Score. These numbers are similar to the ones observed by the GASEMT database. It was also found that around 60% of the soil erosion papers with an AS > 0 were published in the last 5 years, showing an increasing trend in altmetrics. These results are related to the assumption of whether or not scholars populate their results in social media and manage to raise the importance of their findings both in the news (electronic newspapers, blogs, etc.) or in policy documents. It is also clear that GASEMT records related to a higher AS yield more citations and are generally published in journals with a higher CiteScore (Table 1). Larger AS are also associated with more co-authors (Table 1), as more intense interaction [25] is achieved by their response to online comments in diverse social media. No clear relationship between number of authors and number of citations was detected by Bezak et al. (2021) [8].
Global studies have an AS larger than 0 and also larger than 10 more frequently compared to regional/local studies (Table 2), suggesting that such large-scale studies attract more attention in the news, blogs and social media. However, for local communities, smaller-scale studies can be as important as global studies since the former deal with specific problems that attract attention from the local community. Global studies were also related to a higher number of citations [8]. Moreover, studies that focused on South America, Africa, Asia and Oceania have a decreasing percentage of modelling records with increasing AS (Table 2). There are only a few studies that focused on these continents and have an AS of more than 10 (Table 2). Furthermore, it is clear that case studies conducted in Europe and North America have larger AS (Table 2) compared to other continents. This could be related to the fact that different types of media (e.g., social or mass) are more frequently used or more developed in these two continents. More specifically, online journals, news, other media and social media users [26] pick up research and environmental aspects in Europe and USA more frequently than in Africa or Asia. Similar results were obtained using the scale of the study area (Table 3). Increasing percentages for higher AS values were observed for global, continental and hillslope studies while opposite results were detected for plot, national and farm/landscape scales (Table 3).
In terms of applied models, it can be seen that RUSLE and WEPP have higher percentages of modelling records for AS > 10 (Table 4). The higher percentage of the WEPP model also probably explains the higher percentage for the hillslope studies (Table 3). On the other hand, the WaTEM/SEDEM model that was associated with the highest number of normalized citations [8] does not have a very high percentage of modelling records for the AS > 10 (Table 4). The higher percentage of the RUSLE model can be attributed to some studies with relatively high AS [27,28]. Furthermore, the percentage of entries for the USLE model is decreasing with increasing AS (Table 4). However, it should be noted that RUSLE and USLE model applications represent around 1/3 of all entries in the GASEMT database [6]. As the percentage of “other models” significantly decreases for AS > 10, this means that other less frequently applied models attract less attention than more frequently applied ones such as RUSLE, USLE, and WaTEM/SEDEM (Table 4). As altmetrics developed only a decade ago, temporal variations are present and more clear trends may only be observed in years to come. The only obvious trend is the one that the total social media activity is increasing, and the percentage of scientific papers that are showing such activity of any form is also increasing. Therefore, scientists are more and more active on social media where they present their publications.
In terms of field activities, model calibration, soil sampling activities and model validation, no clear pattern could be detected in terms of the AS values (Table 5). It was shown by Bezak et al. (2021) [8] that the soil erosion modelling research community should give more attention to these soil erosion modelling characteristics since the number of citations was not significantly higher in cases where these activities were included in soil erosion modelling studies. Therefore, investigation using altmetric.com only confirms this conclusion. Moreover, the percentage of studies dealing with the present decreases with increasing AS; the opposite trend is found for the studies dealing with past and future (Table 6). This former result could be related to the fact that climate change studies clearly have a relatively big presence in different social media. In addition, the online journal would have a much easier study with future erosion projections (Table 6) than ones referring to the past, as we can notice with the recent papers published by Panagos et al. (2021) [29] and Borrelli et al. (2020) [1]. However, it should be also noted that the absolute number of studies dealing with future soil erosion scenarios is substantially smaller compared to the number of studies focused on past or present in the soil erosion modelling community [6,8]. For example, Rahimi et al. (2017) [14] showed that around 50% of papers were also detected in altmetric.com, while this percentage is much lower in cases of soil erosion modelling studies (Table 1). According to Bornmann (2014)’s [30] study, soil erosion modelling seems to be a scientific domain and not a topic having attracted interest from a wide audience.

3.2. Relationship among Almetric.com Sources and Number of Citations

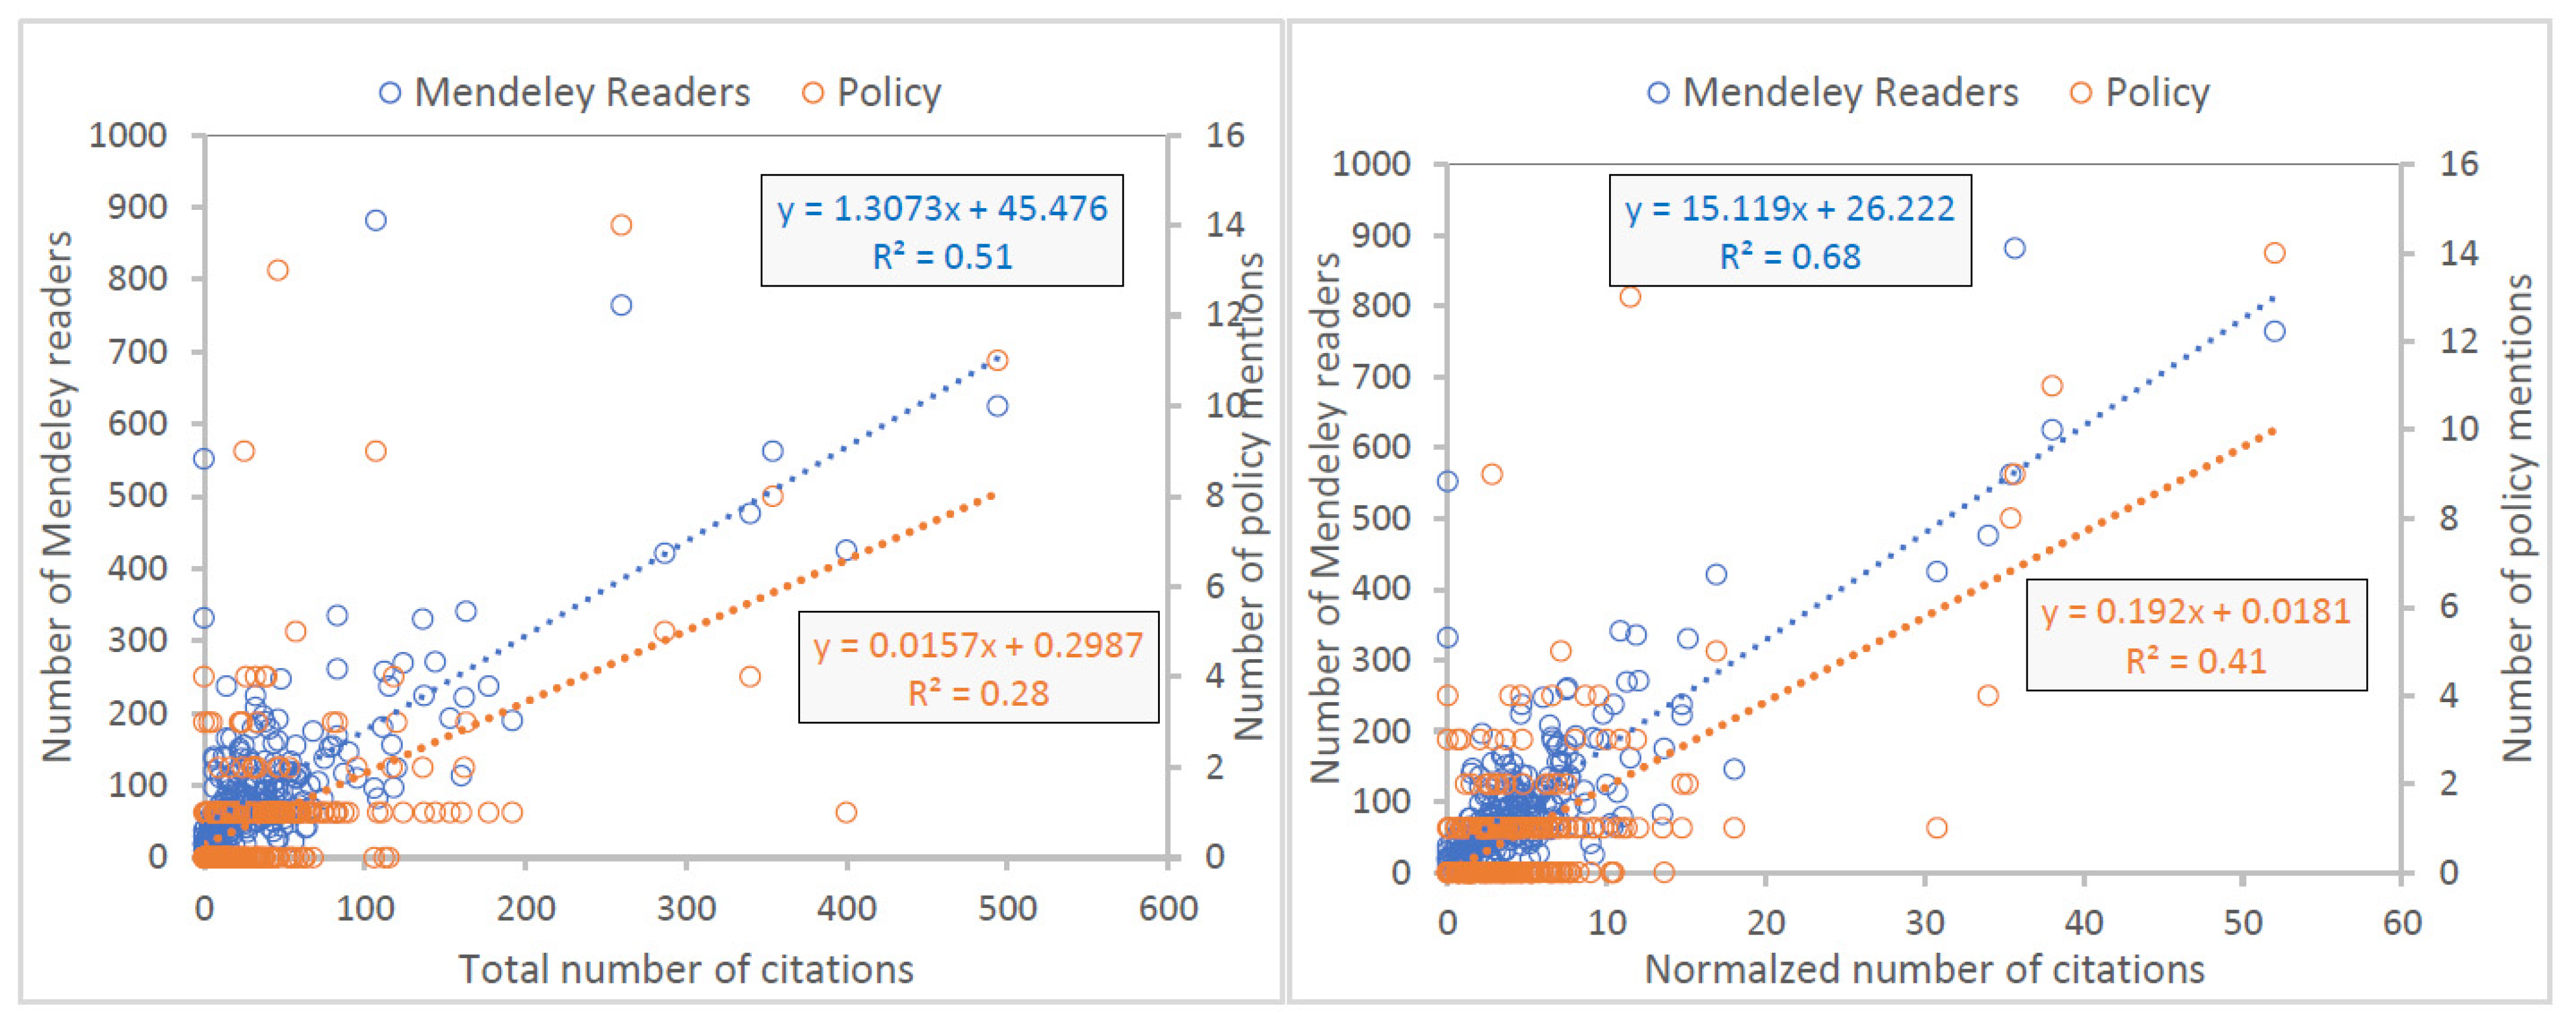
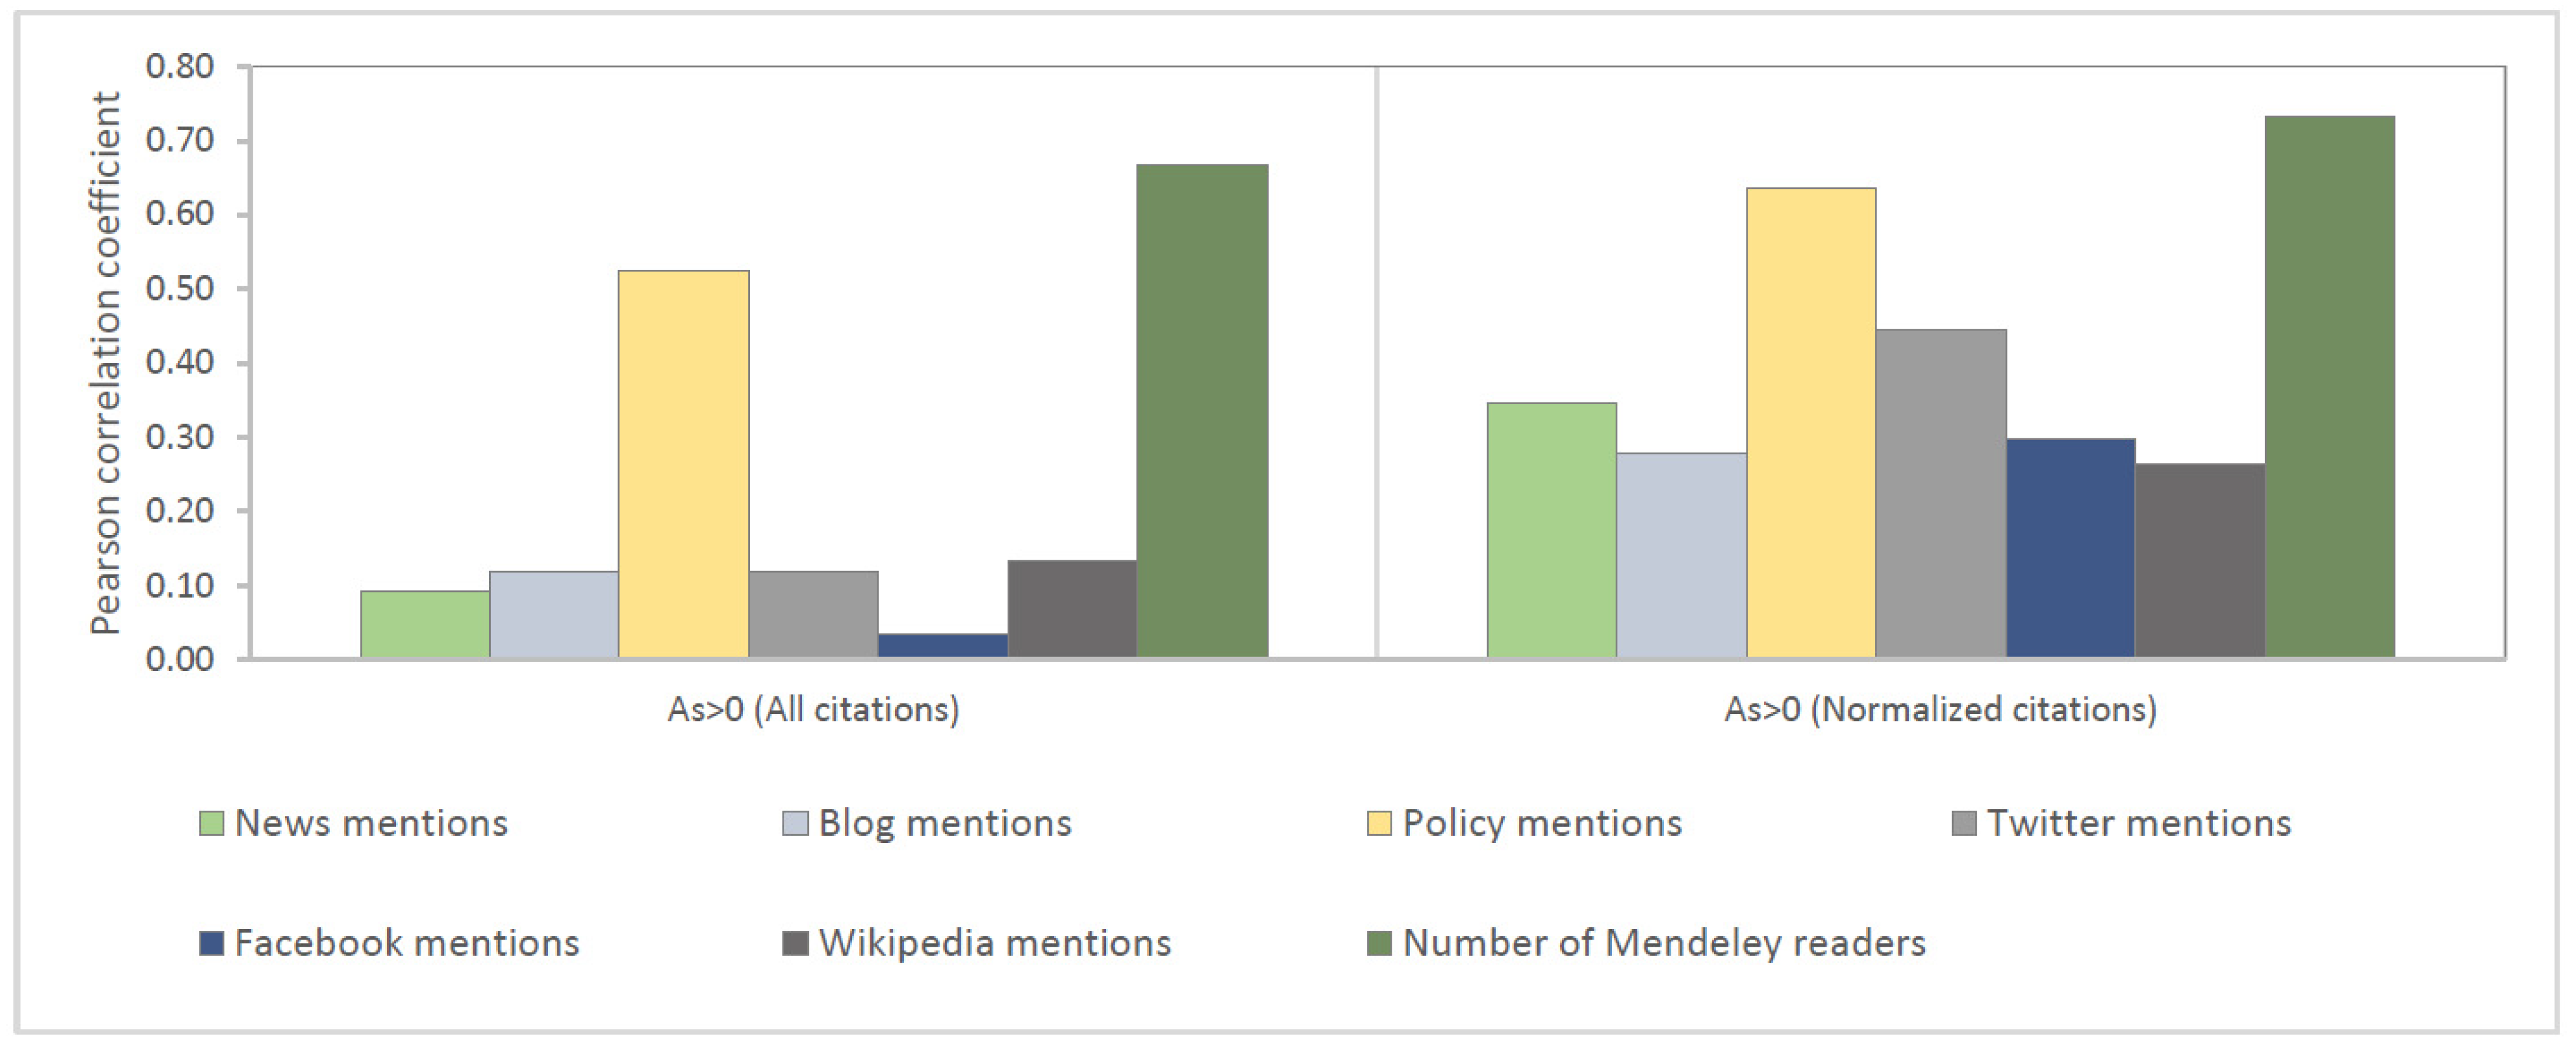
We also investigated the possible correlation between different altmetric.com sources and total and normalized number of citations in GASEMT database records. In the case of soil erosion modelling, the highest correlation is observed between number of Mendeley readers and number of citations (Figure 1 and Figure 2). This is then followed by policy mentions, Wikipedia mentions, and Twitter mentions. Relatively similar results were obtained for AS > 0 and AS > 10 and by using all citations and normalized number of citations. Several other studies have investigated these relationships [31,32,33,34] but not in the field of soil erosion modelling. According to Haustein et al. (2014) [32], Mendeley bookmarking was moderately correlated (0.45) with Scopus citation counts. Similar studies showed that altmetrics is still under development with the option to include other social media platforms and tools in the future (LinkedIn, Researchgate, Academia.edu, Mendeley, Google Scholar, etc.). Peoples et al. (2016) [33] studied 1599 primary research articles from 20 ecology journals published in the period 2012–2014 and found a strong positive relationship between Twitter activity (i.e., the number of unique tweets about an article) and number of citations in Web of Science. Biljecki (2016) [18] studied 12,436 papers published in 20 GIS science journals in the period 2000–2014, and nearly all (97.2%) were bookmarked by at least one reader in Mendeley, two thirds (64.4%) having at least 10 readers. This rate of attention is significantly better than any other discipline (with an average of 66.2%) [31,32,34]. In the case of soil erosion modelling, around 15% of papers included in the GASEMT had at least one Mendeley reader. Around 15% of GASEMT studies had more than 10 Mendeley readers. Hassan et al. (2017) [
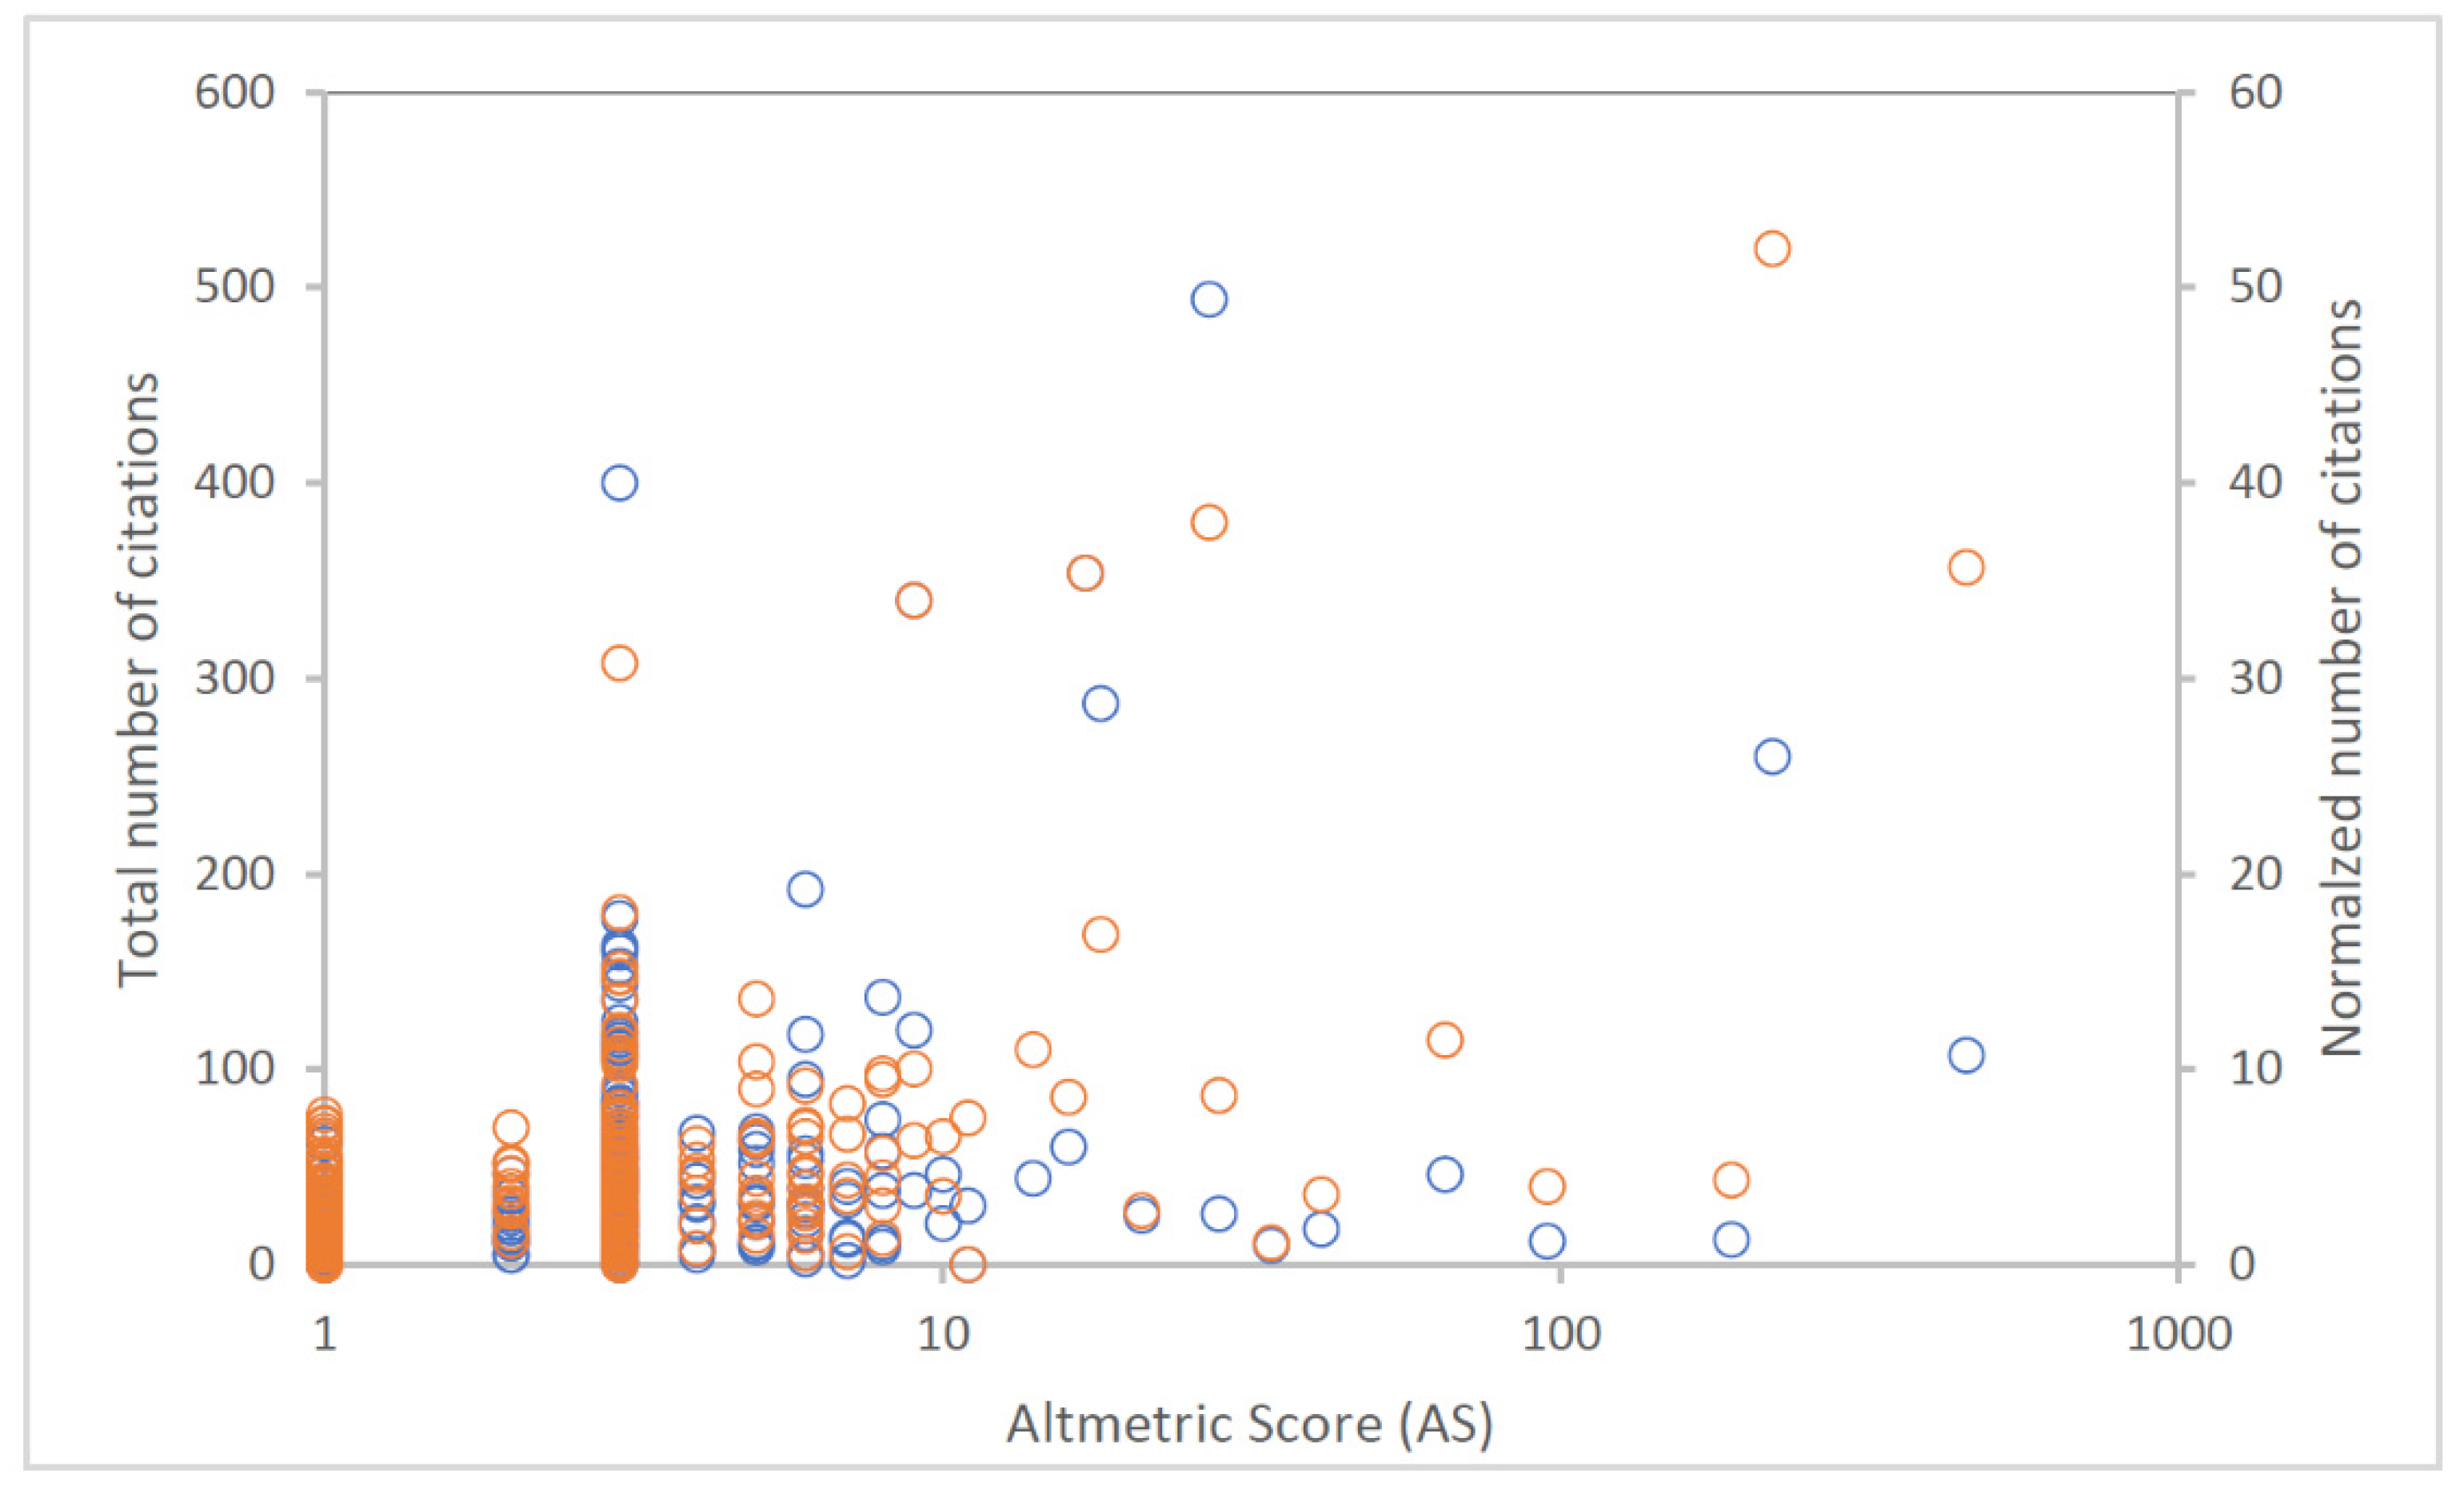
20] measured social media activities in 15 broad scientific disciplines indexed in the Scopus database using altmetric.com data. They concluded that altmetric indices can be a good indicator for highly cited publications. Zou and Han (2017) [17] who studied the top 100 papers from altmetric.com in 2016 found no correlation whatsoever between AS and citation counting (Pearson correlation coefficient was 0.036). A stronger correlation between AS and number of citations was observed in this study (Figure 3).
Table 7 shows some descriptive statistics of different altmetric.com sources for the GASEMT modelling records with AS larger than 0. Overall, the total number of policy mentions of the studies included in the GASEMT database totalled 247. Policy mentions are three times higher than the news mentions (Table 7). In addition, Twitter is dominant among social media for soil erosion study outreach. More specifically, one can notice that on average, a soil erosion modelling paper with an AS > 0 had one policy mention, with the highest number (n = 14) scored by Panagos et al. (2015) [35]. The selected papers with the highest AS will be studied in more detail in the following section (i.e., Section 3.3). It should be noted that only 5% of papers with an AS > 0 appeared in news and around 9% in blogs. This percentage was much higher for Twitter and policy mentions, 44% and 48%, respectively.
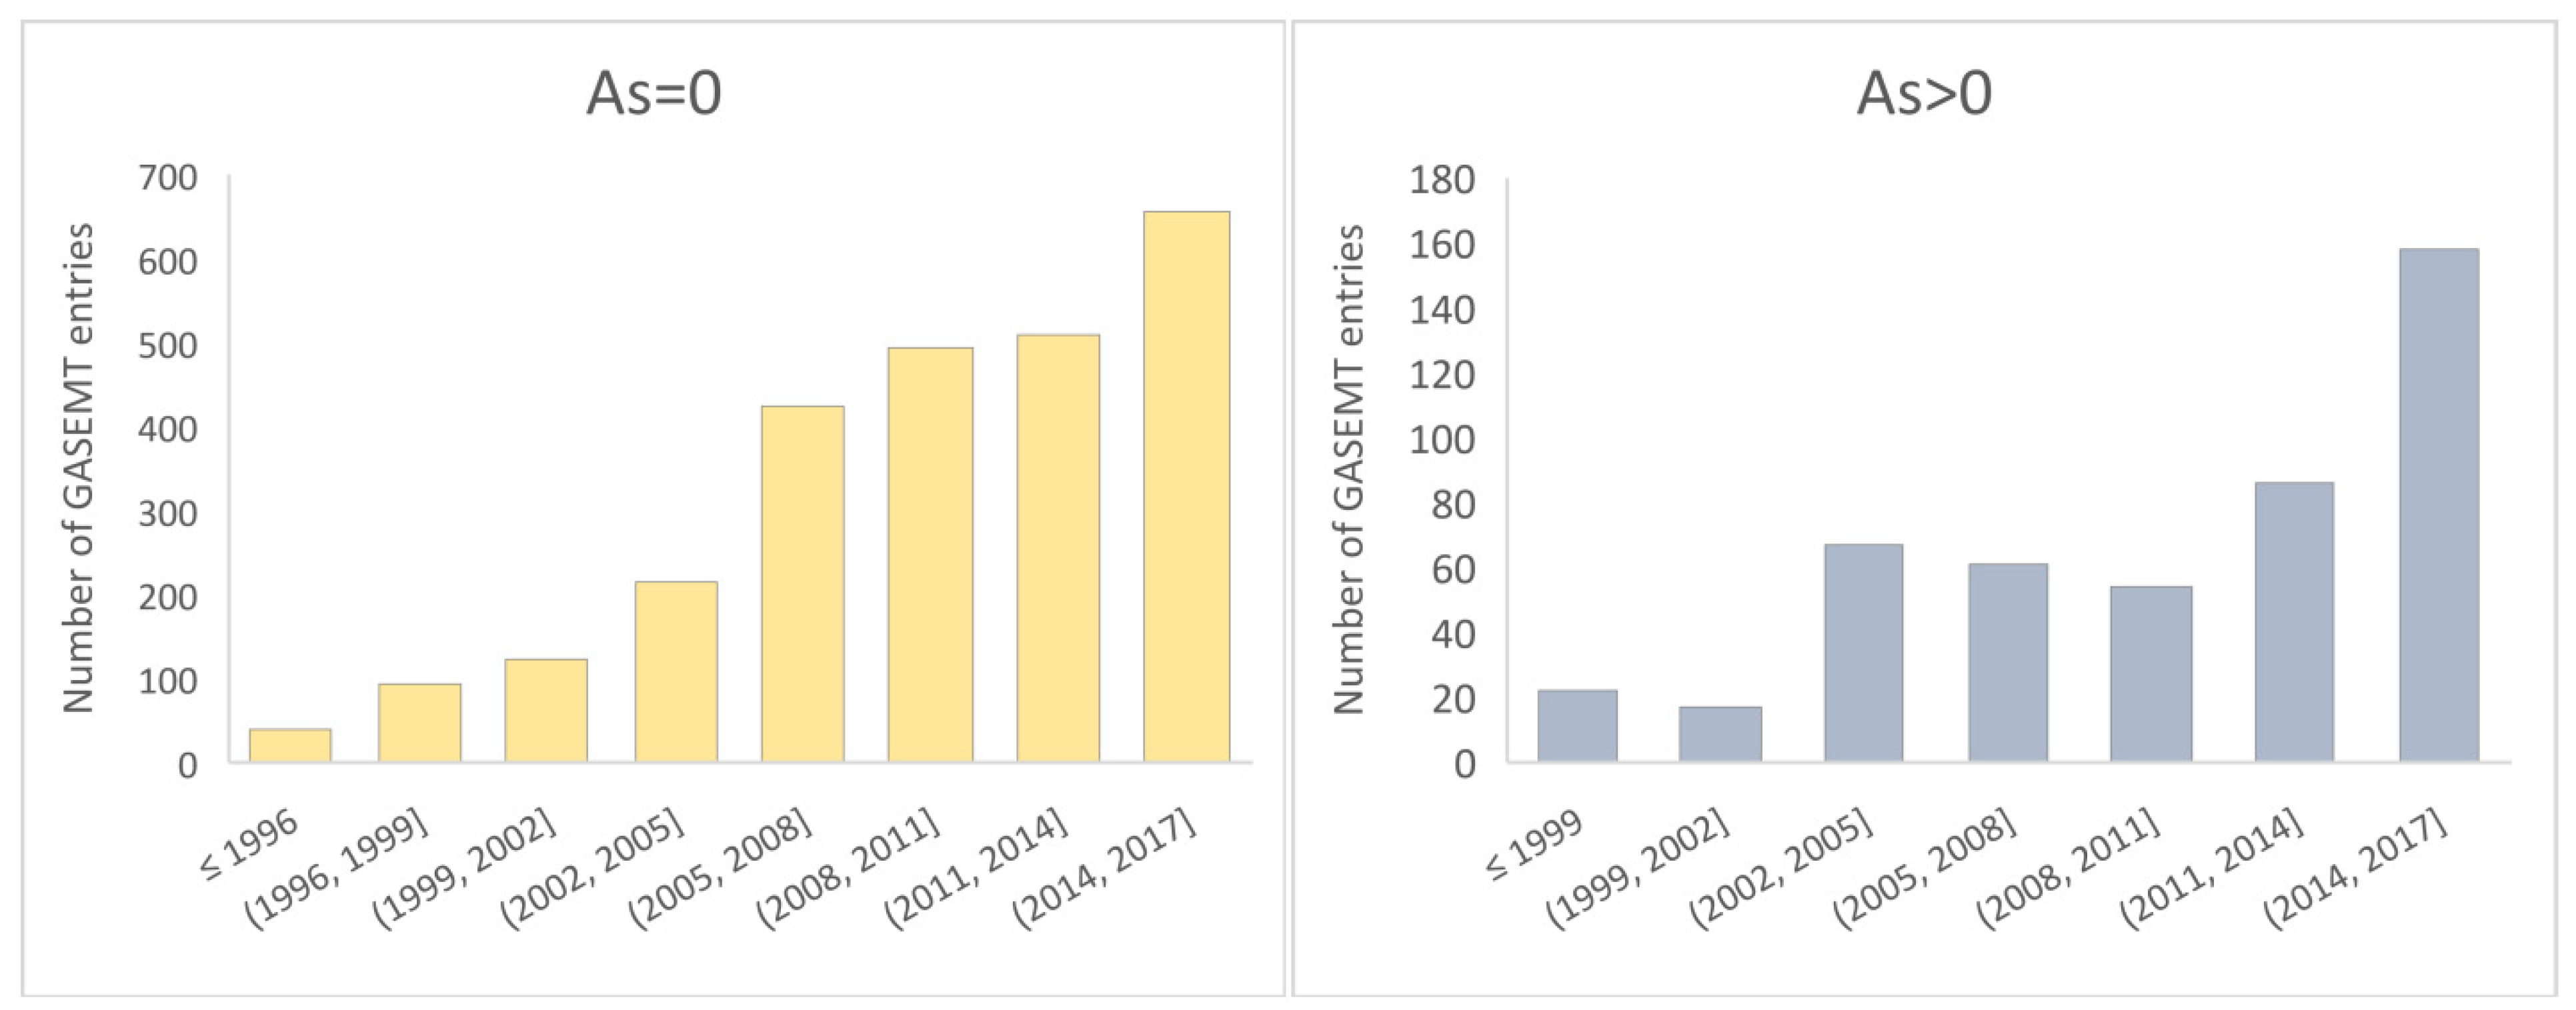
Moreover, we analysed the temporal distribution of the GASEMT modelling records for two different subsets based on the AS value (Figure 4). It can be seen that there were quite some GASEMT records that were published in the period before 2010 (i.e., before the significant development of social media and altmetric trackers). Thus, the higher AS of these studies can mainly be attributed to the above average number of policy mentions [28,36]. This could also be related to the topics of the papers that are related to the AS > 10 (Figure S1). The trend of AS > 0 is exponential during the last 6 years (2011–2017) of the GASEMT as the number of studies quadruples compared to the period before 2011. It is clear that these papers more frequently deal with agriculture, that is, the term that does not appear on the world cloud in the case that the AS > 0 subset is shown (Figure S1).

3.3. The Impact and Outreach of Soil Erosion Modelling Papers with Top Altmetric Score

In the following section, detailed investigation of the selected papers with an AS > 10 is provided (Table 8). As is inferable from Table 8, the number of Twitter and policy mentions are non-uniformly distributed, with some papers having a much larger number of mentions (Table 8). For example, Pearson’s correlation coefficient between Twitter and news mentions for papers shown in Table 8 totals to 0.49. It can also be noticed that some papers with a slightly lower number of citations and Mendeley readers tend to have a relatively high number of Twitter and policy mentions (Table 8). The data reported in Table 8 help us to notice a time lag between Twitter mentions and Scopus citations, estimated in approximately 1–2 years. It should be noted that the majority of social media activity such as tweets and news mentions occur immediately after publication, while the policy mentions usually occur 2–5 years after publication. In terms of Twitter mentions, the papers with the most mentions [25,35,37,38] were mostly mentioned by people or institutions from Italy, the UK, Chile, Spain, Belgium, the USA, and Australia. In terms of policy documents, there was no clear time lag between Scopus citations and policy mentions. Thus, these are more overlapping than the Twitter (or other social media) mentions and number of citations. In terms of origin of policy documents, the following countries or institutions are mostly using the results of research studies in different policy documents: Italy, Luxemburg (European Commission) and the USA [25,35,38]. In terms of other sources that are tracked by altmetric.com, one can also mention news, which has a slightly higher absolute number of mentions, while for other sources (e.g., Reddit, Google+), there was almost no activity for the soil erosion modelling studies included in the GASEMT database. For example, Gocht et al. (2017) [27] had more than 20 news mentions (mostly from the USA) but only one policy mention and two Twitter mentions. This larger number of news mentions also resulted in higher AS (i.e., 189) since the weight for the news mentions is also higher than, for example, for the Twitter mentions.
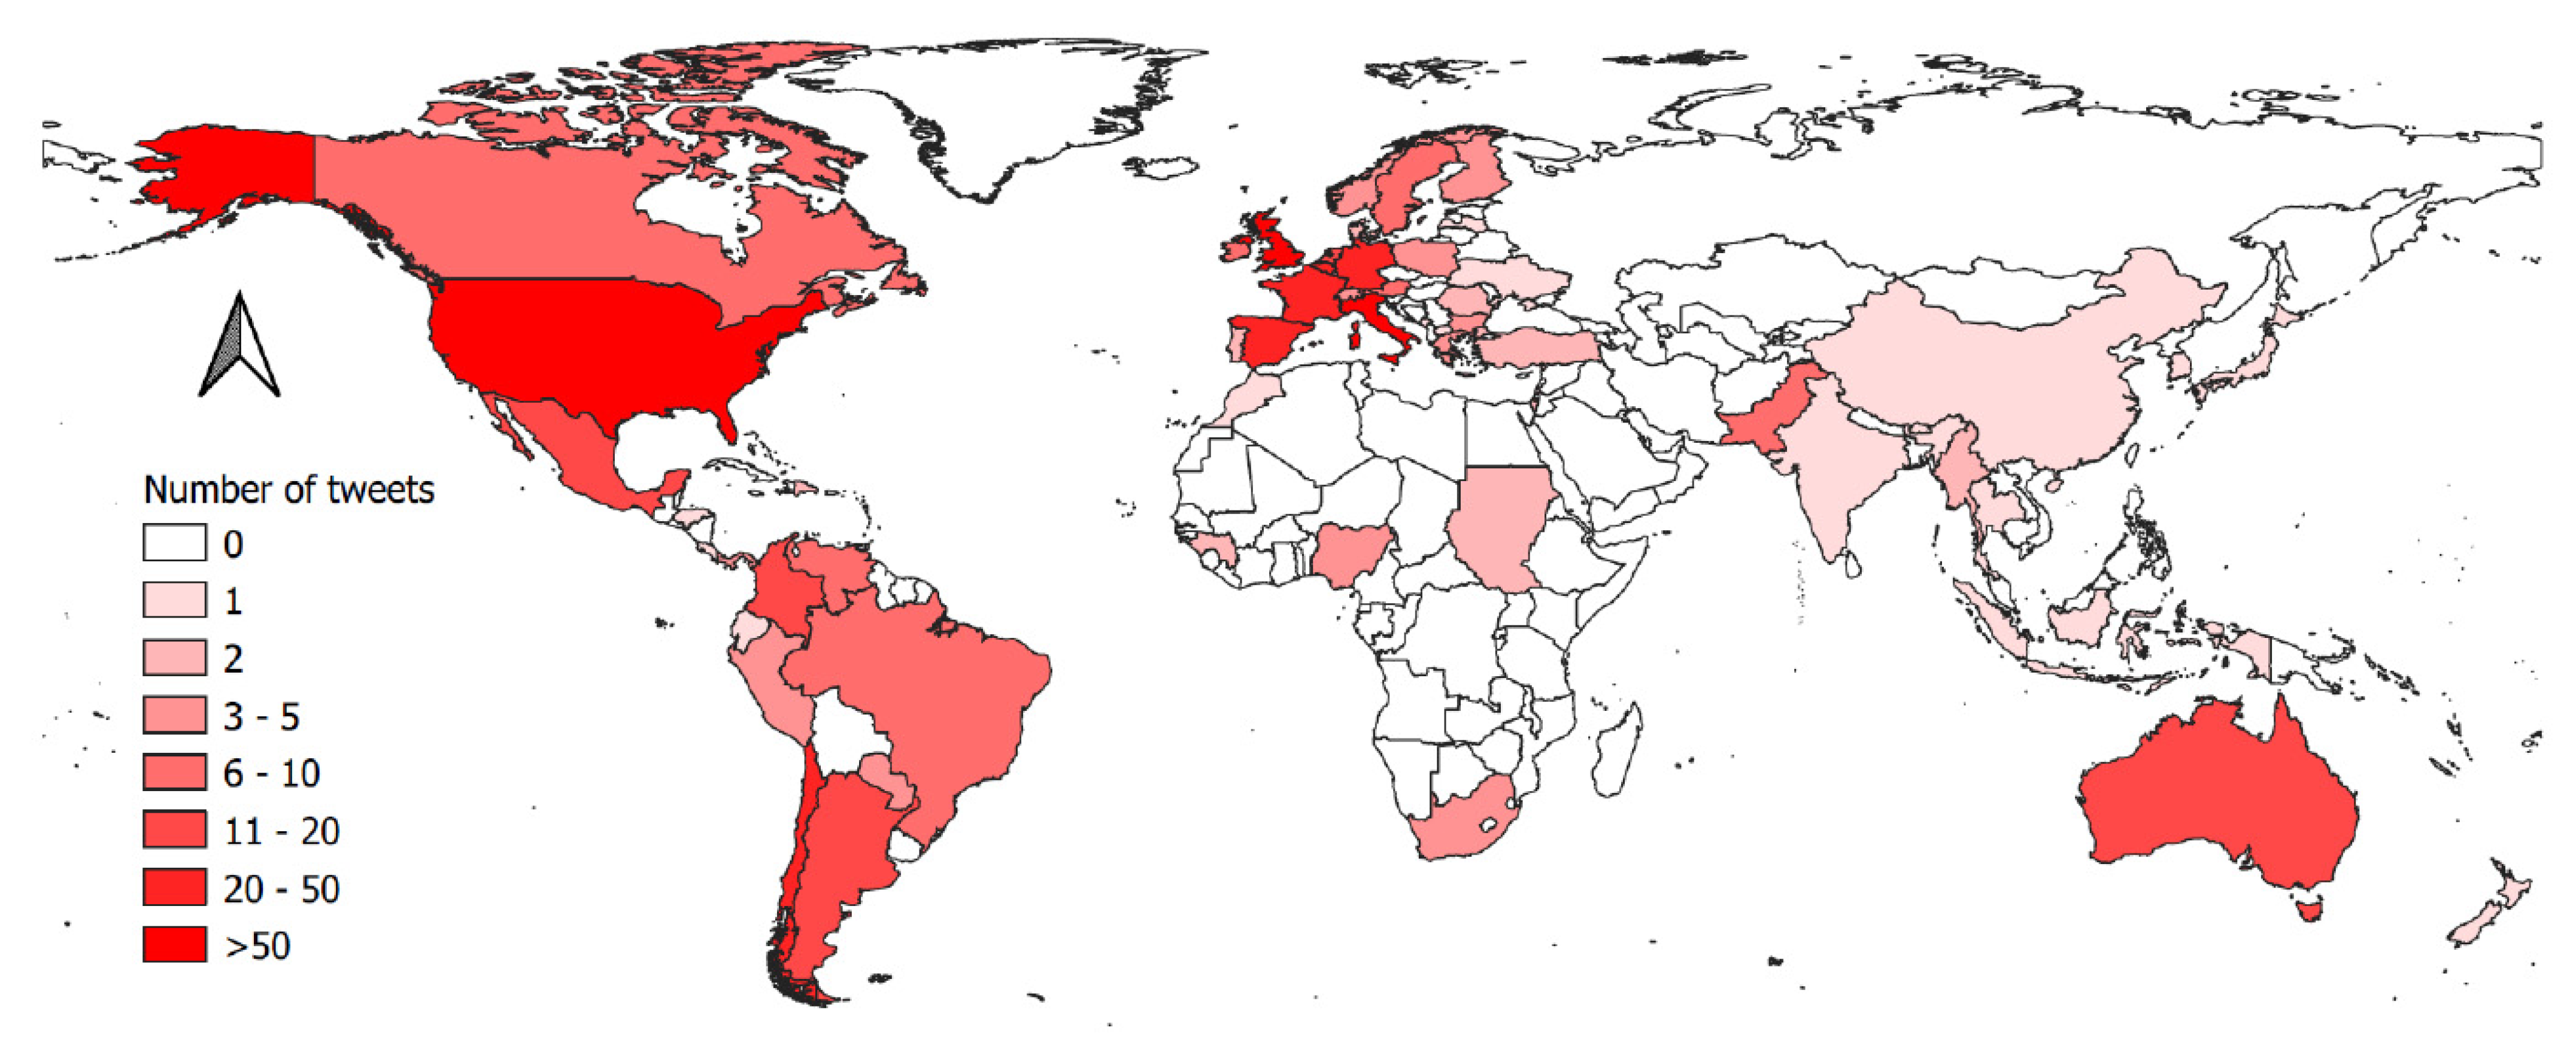
Since the number of Twitter mentions was higher than other media, or policy mentions, we also investigated the characteristics of the Twitter users that tweet about specific papers. Figure 5 shows the number of Twitter posts for the GASEMT papers with AS > 10 (Table 8). As discussed in Section 2.1, social media such as Twitter are more widely used in Europe and North America than Africa and Asia (Figure 5). Additionally, Figure S2 shows the number of followers for Twitter account users that tweeted about the selected papers for the GASEMT database that have at least 10 Twitter mentions. Additionally, we select as benchmark (i.e., papers with high outreach in terms of Twitter activity), one paper with the highest AS from the Land Use Policy journal [39] and one from the Landscape and Urban Planning journal [40] (Figure S2). It can be seen that the paper with the highest number of Twitter mentions from the GASEMT database (i.e., Borrelli et al., 2017) [25] is comparable or even performs better than the selected two benchmark papers that are the two top papers from the selected journals. This means that the outreach of these twitter activities can be relatively significant since tweets of users with more followers are seen by a larger number of people. Furthermore, the second-ranked GASEMT paper (based on the number Twitter mentions) [35] is also comparable to the benchmark paper published in the Land Use Policy journal [39]—this somehow stresses the importance of soil erosion as a theme comparable to other topics published in these two journals.
Moreover, bibliographic and altmetric characteristics of journals where soil erosion modelling studies are mostly published [8] are also shown in Table 8. The Land Use Policy journal has the highest total number of policy mentions and the highest percentage of papers that are tracked by altmetric.com (Table S1). This journal also has the second highest number of total mentions, while Journal of Hydrology is ranked first, but it also publishes around three times as many papers. Furthermore, it can also be seen that there exist quite some differences among the journals where soil erosion modelling studies are more frequently published (Table S1). Papers included in the GASEMT database were overall mentioned 247 times in policy documents and 1333 times on social media (Table 8). Some journals have higher and some lower numbers of policy documents and social media mentions (Table S1) than the GASEMT database. The total number of mentions was 1712. Hoverer, only 15% of GASEMT papers could be linked with some altmetric.com activities. A similar percentage was characteristic of Catena and Geoderma, while most other journals (Table S1) had higher percentages.

4. Conclusions

Bridging the gap between scientific research and policy making represents a critical challenge for academia interested in actively contributing to the development of tools and options useful to support citizens and all relevant stakeholders in environmental sustainability. Building on some relevant indicators and metrics of altmetrics, we try to estimate the influence of research papers on soil erosion modelling in decision-making processes, dissemination in media, blogging, reaching citizens, etc. In this sense, the knowledge transfer between academics, policymakers and practitioners could represent an important driver for development in the soil science and land degradation that are important for sustainability.
Currently, only 15% of papers included in the GASEMT were picked up by altmetric.com and had AS > 0, while only around 1% of papers had AS higher than 10. Almost all papers with AS > 0 were published in journals, while conference proceedings and books have neither important outreach nor impact on policy processes. The global-scale studies and the ones touching on emerging issues (i.e., climate change) more frequently lead to higher AS than local studies and studies dealing with the past or current situation. Thus, a global scale and future projections attract the attention of both the public and policy makers.
The number of Mendeley readers and policy mentions were more explicitly correlated with number of citations than other altmetric.com sources, such as number of Twitter or news mentions. Thus, the quality of the scientific work (measured by the number of citations) does not necessarily lead to high altmetric activities. A GASEMT paper with an AS > 0 had on average around 1 policy mention, 5 Twitter mentions and 100 Mendeley readers. Only 5% of papers with an AS > 0 appeared in the news and around 9% appeared in blogs. This percentage was much higher for Twitter and policy mentions (i.e., 44% and 48%, respectively).
The paper with the highest AS in the GASEMT also had relatively significant outreach on social media (e.g., Twitter), since the upper bound exceeded 1 million followers. Moreover, these papers were comparable to the selected benchmark papers in environmental science. In terms of journals, the Land Use Policy journal had a stronger impact on policy compared to some other journals where soil erosion modelling papers are published and GASEMT.

Supplementary Materials

The following supporting information can be downloaded at: https://www.mdpi.com/article/10.3390/su14031342/s1, Figure S1: World cloud of the most frequent title words for the Altmetric Score (AS) > 10 and AS > 0 (i.e., from left to right). In both cases only 10 most frequent words are shown.; Figure S2: Comparison between number of followers of Twitter account that tweeted about specific paper and ranks of such users based on the number of their followers. Table S1: Basic altmetric.com journals statistics for journals where soil erosion modelling studies are mostly published.

Author Contributions

P.P. firstly proposed the idea and reviewed the manuscript. N.B., P.B., M.M. and P.P. contributed to the main idea. N.B. and M.M. gathered the data and conducted the analysis. N.B. prepared first draft. All other authors reviewed the draft and improved the figures. All authors have read and agreed to the published version of the manuscript.

Funding

This research was funded by Slovenian Research Agency, core project number P2-0180, and by the University of Ljubljana for activities related to the UNESCO Chair on Water-related Disaster Risk Reduction. Pasquale Borrelli was funded by the EcoSSSoil Project, Korea Environmental Industry & Technology Institute (KEITI), Korea (Grant No. 2019002820004).

Institutional Review Board Statement

Not applicable.

Informed Consent Statement

Not applicable.

Data Availability Statement

The GASEMT database can be downloaded from the ESDAC: https://esdac.jrc.ec.europa.eu/content/global-applications-soil-erosion-modelling-tracker (accesed on 15 November 2021). An updated version of the GASEMT with altmetric data will be made available upon the publication of this paper. The altmetric bookmark tool can be used to obtain the altmetric.com data.

Acknowledgments

We would like to thank altmetric.com for providing free access to the Altmetric Explorer.

Conflicts of Interest

The authors declare no conflict of interest.

References

  1. Borrelli, P.; Robinson, D.A.; Panagos, P.; Lugato, E.; Yang, J.E.; Alewell, C.; Wuepper, D.; Montanarella, L.; Ballabio, C. Land use and climate change impacts on global soil erosion by water (2015–2070). Proc. Natl. Acad. Sci. USA 2020, 117, 21994–22001. [Google Scholar] [CrossRef] [PubMed]
  2. Van Rompaey, A.J.J.; Govers, G.; Van Hecke, E.; Jacobs, K. The impacts of Land Use Policy on the soil erosion risk: A case study in central Belgium. Agric. Ecosyst. Environ. 2001, 83, 83–94. [Google Scholar] [CrossRef]
  3. Zare, M.; Panagopoulos, T.; Loures, L. Simulating the impacts of future land use change on soil erosion in the Kasilian watershed, Iran. Land Use Policy 2017, 67, 558–572. [Google Scholar] [CrossRef]
  4. Borrelli, P.; Panagos, P. An indicator to reflect the mitigating effect of Common Agricultural Policy on soil erosion. Land Use Policy 2020, 92, 104467. [Google Scholar] [CrossRef]
  5. Panagos, P.; Katsoyiannis, A. Soil erosion modelling: The new challenges as the result of policy developments in Europe. Environ. Res. 2019, 172, 470–474. [Google Scholar] [CrossRef] [PubMed]
  6. Borrelli, P.; Alewell, C.; Alvarez, P.; Anache, J.A.A.; Baartman, J.; Ballabio, C.; Bezak, N.; Biddoccu, M.; Cerdà, A.; Chalise, D.; et al. Soil erosion modelling: A global review and statistical analysis. Sci. Total Environ. 2021, 780, 146494. [Google Scholar] [CrossRef]
  7. Panagos, P.; Van Liedekerke, M.; Jones, A.; Montanarella, L. European Soil Data Centre: Response to European policy support and public data requirements. Land Use Policy 2012, 29, 329–338. [Google Scholar] [CrossRef]
  8. Bezak, N.; Mikoš, M.; Borrelli, P.; Alewell, C.; Alvarez, P.; Anache, J.A.A.; Baartman, J.; Ballabio, C.; Biddoccu, M.; Cerdà, A.; et al. Soil erosion modelling: A bibliometric analysis. Environ. Res. 2021, 197, 111087. [Google Scholar] [CrossRef]
  9. Altmetric Altmetric. Available online: https://www.altmetric.com/ (accessed on 15 November 2021).
  10. Sud, P.; Thelwall, M. Evaluating altmetrics. Scientometrics 2014, 98, 1131–1143. [Google Scholar] [CrossRef]
  11. Priem, J.; Taraborelli, D.; Groth, P.; Neylon, C. Altmetrics: A Manifesto. Available online: http://altmetrics.org/manifesto/ (accessed on 15 November 2021).
  12. Priem, J.; Piwowar, H.A.; Hemminger, B.M. Altmetrics in the wild: Using social media to explore scholarly impact 2012. arXiv 2012, arXiv:1203.4745. [Google Scholar]
  13. Priem, J. Scholarship: Beyond the paper. Nature 2013, 495, 437–440. [Google Scholar] [CrossRef] [Green Version]
  14. Rahimi, F.; Riahinia, N.; Nourmohammadi, H.; Sotudeh, H.; Zadeh-Ravari, M.T. How Academia and Society Pay Attention to Climate Changes: A Bibliometric and Altmetric Analysis. Webology 2017, 16, 311–317. [Google Scholar] [CrossRef]
  15. Ortega, J.L. Reliability and accuracy of altmetric providers: A comparison among Altmetric.com, PlumX and Crossref Event Data. Scientometrics 2018, 116, 2123–2138. [Google Scholar] [CrossRef]
  16. Ellis, J.; Ellis, B.; Tyler, K.; Reichel, M.P. Recent trends in the use of social media in parasitology and the application of alternative metrics. Curr. Res. Parasitol. Vector-Borne Dis. 2021, 1, 100013. [Google Scholar] [CrossRef]
  17. Zou, D.; Han, Y. An Altmetrics study of TOP100 samples in 2016. In Proceedings of the ISSI 2017—16th International Conference on Scientometrics and Informetrics, Conference Proceedings, Leuven, Belgium, 12–15 July 2017; pp. 1710–1718. [Google Scholar]
  18. Biljecki, F. A scientometric analysis of selected GIScience journals. Int. J. Geogr. Inf. Sci. 2016, 30, 1302–1335. [Google Scholar] [CrossRef] [Green Version]
  19. Holmberg, K.; Hedman, J.; Bowman, T.D.; Didegah, F.; Laakso, M. Do articles in open access journals have more frequent altmetric activity than articles in subscription-based journals? An investigation of the research output of Finnish universities. Scientometrics 2020, 122, 645–659. [Google Scholar] [CrossRef] [Green Version]
  20. Hassan, S.-U.; Imran, M.; Gillani, U.; Aljohani, N.R.; Bowman, T.D.; Didegah, F. Measuring social media activity of scientific literature: An exhaustive comparison of scopus and novel altmetrics big data. Scientometrics 2017, 113, 1037–1057. [Google Scholar] [CrossRef] [Green Version]
  21. Tornberg, H.N.; Moezinia, C.; Wei, C.; Bernstein, S.A.; Wei, C.; Al-Beyati, R.; Quan, T.; Diemert, D.J. Assessing the Dissemination of COVID-19 Articles across Social Media with Altmetric and PlumX Metrics: Correlational Study. J. Med. Internet Res. 2021, 23, e21408. [Google Scholar] [CrossRef]
  22. Borku Uysal, B.; Islamoglu, M.S.; Koc, S.; Karadag, M.; Dokur, M. Most notable 100 articles of COVID-19: An Altmetric study based on bibliometric analysis. Ir. J. Med. Sci. 2021, 190, 1335–1341. [Google Scholar] [CrossRef]
  23. Edakar, M.A.M.; Shehata, A.M.K. Measuring the impact of COVID-19 papers on the social web: An altmetric study. Glob. Knowledge Mem. Commun. 2021, 71, 1–26. [Google Scholar] [CrossRef]
  24. Costas, R.; Zahedi, Z.; Wouters, P. Do “altmetrics” correlate with citations? Extensive comparison of altmetric indicators with citations from a multidisciplinary perspective. J. Assoc. Inf. Sci. Technol. 2015, 66, 2003–2019. [Google Scholar] [CrossRef]
  25. Borrelli, P.; Robinson, D.A.; Fleischer, L.R.; Lugato, E.; Ballabio, C.; Alewell, C.; Meusburger, K.; Modugno, S.; Schütt, B.; Ferro, V.; et al. An assessment of the global impact of 21st century land use change on soil erosion. Nat. Commun. 2017, 8. [Google Scholar] [CrossRef] [PubMed] [Green Version]
  26. Yu, H.; Xiao, T.; Xu, S.; Wang, Y. Who posts scientific tweets? An investigation into the productivity, locations, and identities of scientific tweeters. J. Informetr. 2019, 13, 841–855. [Google Scholar] [CrossRef]
  27. Gocht, A.; Ciaian, P.; Bielza, M.; Terres, J.-M.; Röder, N.; Himics, M.; Salputra, G. EU-wide Economic and Environmental Impacts of CAP Greening with High Spatial and Farm-type Detail. J. Agric. Econ. 2017, 68, 651–681. [Google Scholar] [CrossRef]
  28. Yang, D.; Kanae, S.; Oki, T.; Koike, T.; Musiake, K. Global potential soil erosion with reference to land use and climate changes. Hydrol. Process. 2003, 17, 2913–2928. [Google Scholar] [CrossRef]
  29. Panagos, P.; Ballabio, C.; Himics, M.; Scarpa, S.; Matthews, F.; Bogonos, M.; Poesen, J.; Borrelli, P. Projections of soil loss by water erosion in Europe by 2050. Environ. Sci. Policy 2021, 124, 380–392. [Google Scholar] [CrossRef]
  30. Bornmann, L. Validity of altmetrics data for measuring societal impact: A study using data from Altmetric and F1000Prime. J. Informetr. 2014, 8, 935–950. [Google Scholar] [CrossRef] [Green Version]
  31. Haustein, S.; Peters, I.; Sugimoto, C.R.; Thelwall, M.; Larivière, V. Tweeting biomedicine: An analysis of tweets and citations in the biomedical literature. J. Assoc. Inf. Sci. Technol. 2014, 65, 656–669. [Google Scholar] [CrossRef] [Green Version]
  32. Haustein, S.; Peters, I.; Bar-Ilan, J.; Priem, J.; Shema, H.; Terliesner, J. Coverage and adoption of altmetrics sources in the bibliometric community. Scientometrics 2014, 101, 1145–1163. [Google Scholar] [CrossRef] [Green Version]
  33. Peoples, B.K.; Midway, S.R.; Sackett, D.; Lynch, A.; Cooney, P.B. Twitter predicts citation rates of ecological research. PLoS ONE 2016, 11. [Google Scholar] [CrossRef] [Green Version]
  34. Mohammadi, E.; Thelwall, M.; Haustein, S.; Larivière, V. Who reads research articles? An altmetrics analysis of Mendeley user categories. J. Assoc. Inf. Sci. Technol. 2015, 66, 1832–1846. [Google Scholar] [CrossRef] [Green Version]
  35. Panagos, P.; Borrelli, P.; Poesen, J.; Ballabio, C.; Lugato, E.; Meusburger, K.; Montanarella, L.; Alewell, C. The new assessment of soil loss by water erosion in Europe. Environ. Sci. Policy 2015, 54, 438–447. [Google Scholar] [CrossRef]
  36. Nearing, M.A.; Jetten, V.; Baffaut, C.; Cerdan, O.; Couturier, A.; Hernandez, M.; Le Bissonnais, Y.; Nichols, M.H.; Nunes, J.P.; Renschler, C.S.; et al. Modeling response of soil erosion and runoff to changes in precipitation and cover. Catena 2005, 61, 131–154. [Google Scholar] [CrossRef]
  37. Sankey, J.B.; Kreitler, J.; Hawbaker, T.J.; McVay, J.L.; Miller, M.E.; Mueller, E.R.; Vaillant, N.M.; Lowe, S.E.; Sankey, T.T. Climate, wildfire, and erosion ensemble foretells more sediment in western USA watersheds. Geophys. Res. Lett. 2017, 44, 8884–8892. [Google Scholar] [CrossRef] [Green Version]
  38. Chappell, A.; Baldock, J.; Sanderman, J. The global significance of omitting soil erosion from soil organic carbon cycling schemes. Nat. Clim. Chang. 2016, 6, 187–191. [Google Scholar] [CrossRef]
  39. Geisler, C.; Currens, B. Impediments to inland resettlement under conditions of accelerated sea level rise. Land Use Policy 2017, 66, 322–330. [Google Scholar] [CrossRef]
  40. Bratman, G.N.; Daily, G.C.; Levy, B.J.; Gross, J.J. The benefits of nature experience: Improved affect and cognition. Landsc. Urban Plan. 2015, 138, 41–50. [Google Scholar] [CrossRef]
  41. Papanicolaou, A.N.; Wacha, K.M.; Abban, B.K.; Wilson, C.G.; Hatfield, J.L.; Stanier, C.O.; Filley, T.R. From soilscapes to landscapes: A landscape-oriented approach to simulate soil organic carbon dynamics in intensively managed landscapes. J. Geophys. Res. G Biogeosci. 2015, 120, 2375–2401. [Google Scholar] [CrossRef] [Green Version]
  42. Xu, X.; Tan, Y.; Yang, G.; Li, H.; Su, W. Soil erosion in the Three Gorges Reservoir area. Soil Res. 2011, 49, 212–222. [Google Scholar] [CrossRef]
  43. Borrelli, P.; Lugato, E.; Montanarella, L.; Panagos, P. A New Assessment of Soil Loss Due to Wind Erosion in European Agricultural Soils Using a Quantitative Spatially Distributed Modelling Approach. L. Degrad. Dev. 2017, 28, 335–344. [Google Scholar] [CrossRef] [Green Version]
  44. Van Oost, K.; Quine, T.A.; Govers, G.; De Gryze, S.; Six, J.; Harden, J.W.; Ritchie, J.C.; McCarty, G.W.; Heckrath, G.; Kosmas, C.; et al. The impact of agricultural soil erosion on the global carbon cycle. Science 2007, 318, 626–629. [Google Scholar] [CrossRef] [PubMed]
  45. Arias, M.E.; Cochrane, T.A.; Lawrence, K.S.; Killeen, T.J.; Farrell, T.A. Paying the forest for electricity: A modelling framework to market forest conservation as payment for ecosystem services benefiting hydropower generation. Environ. Conserv. 2011, 38, 473–484. [Google Scholar] [CrossRef] [Green Version]
  46. Quinton, J.N.; Govers, G.; Van Oost, K.; Bardgett, R.D. The impact of agricultural soil erosion on biogeochemical cycling. Nat. Geosci. 2010, 3, 311–314. [Google Scholar] [CrossRef] [Green Version]
  47. Ochoa-Cueva, P.; Fries, A.; Montesinos, P.; Rodríguez-Díaz, J.A.; Boll, J. Spatial Estimation of Soil Erosion Risk by Land-cover Change in the Andes OF Southern Ecuador. L. Degrad. Dev. 2015, 26, 565–573. [Google Scholar] [CrossRef]
  48. Borrelli, P.; Panagos, P.; Ballabio, C.; Lugato, E.; Weynants, M.; Montanarella, L. Towards a Pan-European Assessment of Land Susceptibility to Wind Erosion. L. Degrad. Dev. 2016, 27, 1093–1105. [Google Scholar] [CrossRef]
  49. Guerra, C.A.; Maes, J.; Geijzendorffer, I.; Metzger, M.J. An assessment of soil erosion prevention by vegetation in Mediterranean Europe: Current trends of ecosystem service provision. Ecol. Indic. 2016, 60, 213–222. [Google Scholar] [CrossRef]
Figure 1. Relationship among number of Mendeley readers, policy mentions, and total and normalized number of citations obtained from the GASEMT database for the modelling records with Altmetric Score (AS) larger than 0.
Sustainability 14 01342 g001
Figure 2. Calculated Pearson correlation coefficients among different sources detected by altmetric.com and total and normalized number of citations. Please note that the same colours are used as by the almetric.com donut except for the number of Mendeley readers that is not shown by the donut.
Sustainability 14 01342 g002
Figure 3. Relationship between Altmetric Score (AS) and total and normalized number of citations obtained from the GASEMT database.
Sustainability 14 01342 g003
Figure 4. Temporal distribution of GASEMT entries for modelling records with Altmetric Score (AS) = 0 and AS > 0.
Sustainability 14 01342 g004
Figure 5. Twitter demographics for GASEMT papers with the AS > 10 that are shown in Table 8.
Sustainability 14 01342 g005
Table 1. Bibliometric information for GASEMT modelling records based on the Altmetric Score (AS) values. Bibliometric information was extracted from the GASEMT database. Numbers in parentheses are the % per category. Background colour in the last two columns of the table indicates two subsets of the AS > 0 sample.
Bibliographic InformationAS = 0AS > 010 > AS > 0AS > 10
Number of GASEMT entries2565 (85%)465 (15%)428 (14%)37 (1%)
Number of records in journals2250 (82%)464 (1 conference proc.) (17%)427 (1 conference proc.) (16%)37 (1%)
Number of publications (some have multiple modelling records)1440 (85%)257 (15%)241 (14%)16 (1%)
Mean number of citations19.641.937.3111.6
Mean normalized number of citations2.14.94.2215.1
Mean CiteScore2.83.83.726.1
Mean number of authors3.84.74.67
Table 2. Continental information for GASEMT modelling records based on the Altmetric Score (AS) values. Continental information was extracted from the GASEMT database. Sum of each column is equal to 100%. Background colour in the last two columns of the table indicates two subsets of the AS > 0 sample.
Geographic CoverageAS = 0 (%)AS > 0 (%)10 > AS > 0 (%)AS > 10 (%)
Global0.14.11.237.8
North America19.326.927.321.6
Europe29.835.135.529.7
South America4.23.43.52.8
Africa8.48.49.20
Asia34.818.919.95.4
Oceania3.43.23.42.7
Total100100100100
Table 3. Scale information for GASEMT modelling records based on the Altmetric Score (AS) values. Scale information was extracted from the GASEMT database. Sum of each column is equal to 100%. Background colour in the last two columns of the table indicates two subsets of the AS > 0 sample.
Scale of the Study UsedAS = 0 (%)AS > 0 (%)10 > AS > 0 (%)AS > 10 (%)
Global0.13.70.837.8
Continental0.21.91.58.1
Farm/landscape0.9000
Regional13.316.817.68.1
Watershed59.550.552.427.0
Plot14.39.910.70
National2.13.73.72.7
Hillslope9.613.513.316.3
Total100100100100
Table 4. Model information for GASEMT modelling records based on the Altmetric Score (AS) values. Model information was extracted from the GASEMT database. Only models with at least 4% of entries are shown. Sum of each column is equal to 100%. Background colour in the last two columns of the table indicates two subsets of the AS > 0 sample.
Model UsedAS = 0 (%)AS > 0 (%)10 > AS > 0 (%)AS > 10 (%)
USLE14.011.412.12.7
RUSLE17.214.411.745.9
WaTEM/SEDEM4.36.26.52.7
SWAT6.34.95.22.7
WEPP5.79.99.118.9
All the rest52.553.255.427.1
Total100100100100
Table 5. Field activity, calibration, soil sampling and validation information for GASEMT modelling records based on the Altmetric Score (AS) values. Field activity, calibration, soil sampling and validation information were extracted from the GASEMT database. Please note that only percent of papers with these activities included are shown. Other studies where these activities were not conducted are not shown. Background colour in the last two columns of the table indicates two subsets of the AS > 0 sample.
Field Activities and Model Calibration/ValidationAS = 0 (%)AS > 0 (%)10 > AS > 0 (%)AS > 10 (%)
Field activity conducted54.850.350.054.1
Calibration attempt conducted34.039.339.538.0
Soil sampling activity conducted37.838.538.143.2
Validation attempt conducted57.960.661.254.0
Table 6. Temporal scale information for GASEMT modelling records based on the Altmetric Score (AS) values. Temporal scale information was extracted from the GASEMT database. Background colour in the last two columns of the table indicates two subsets of the AS > 0 sample.
Temporal ScaleAS = 0 (%)AS > 0 (%)10 > AS > 0 (%)AS > 10 (%)
Present53.745.446.729.8
Past26.726.023.159.5
Future03.02.68.1
Present and Past8.111.011.72.6
Present and Future5.29.710.50
Other6.34.95.40
Total100100100100
Table 7. Some descriptive statistics for the GASEMT modelling records with an Altmetric Score (AS) larger than 0.
MeanMaximumTotalNumber of Studies with Some Activity
News mentions0.29227712
Blog mentions0.1032622
Policy mentions0.9614247124
Patent mentions0.01133
Twitter mentions4.906851265112
Peer review mentions<0.01111
Facebook mentions0.25156537
Wikipedia mentions0.0922322
Google+ mentions<0.01133
Reddit mentions<0.01111
F1000 mentions<0.01111
Number of Mendeley readers100.588225,825257
Table 8. Basic altmetric.com statistics for papers included in the GASEMT database that have Altmetric Score (AS) > 10. References are ranked based on the AS.
ReferenceJournalASTwitter MentionsPolicy MentionsNews MentionsNumber of Dimensions CitationsNumber of Mendeley Readers
[25]Nature Communications453685915452882
[35]Environmental Science & Policy2202181412448764
[27]Journal of Agricultural Economics18921223576
[37]Geophysical Research Letters95323934140
[38]Nature Climate Change651813690162
[41]Journal of Geophysical Research G: Biogeosciences410053032
[42]Soil Research340031811
[43]Land Degradation and Development2836405697
[44]Science270111574625
[45]Environmental Conservation21189030155
[28]Hydrological Processes18050337421
[46]Nature Geoscience17380450562
[47]Land Degradation and Development1671074116
[48]Land Degradation and Development142106679
[36]Catena11040407552
[49]Ecological Indicators11132051179
Publisher’s Note: MDPI stays neutral with regard to jurisdictional claims in published maps and institutional affiliations.

