
Study of Design and Construction of Transit Facilities in Rural Areas in USA


Abstract
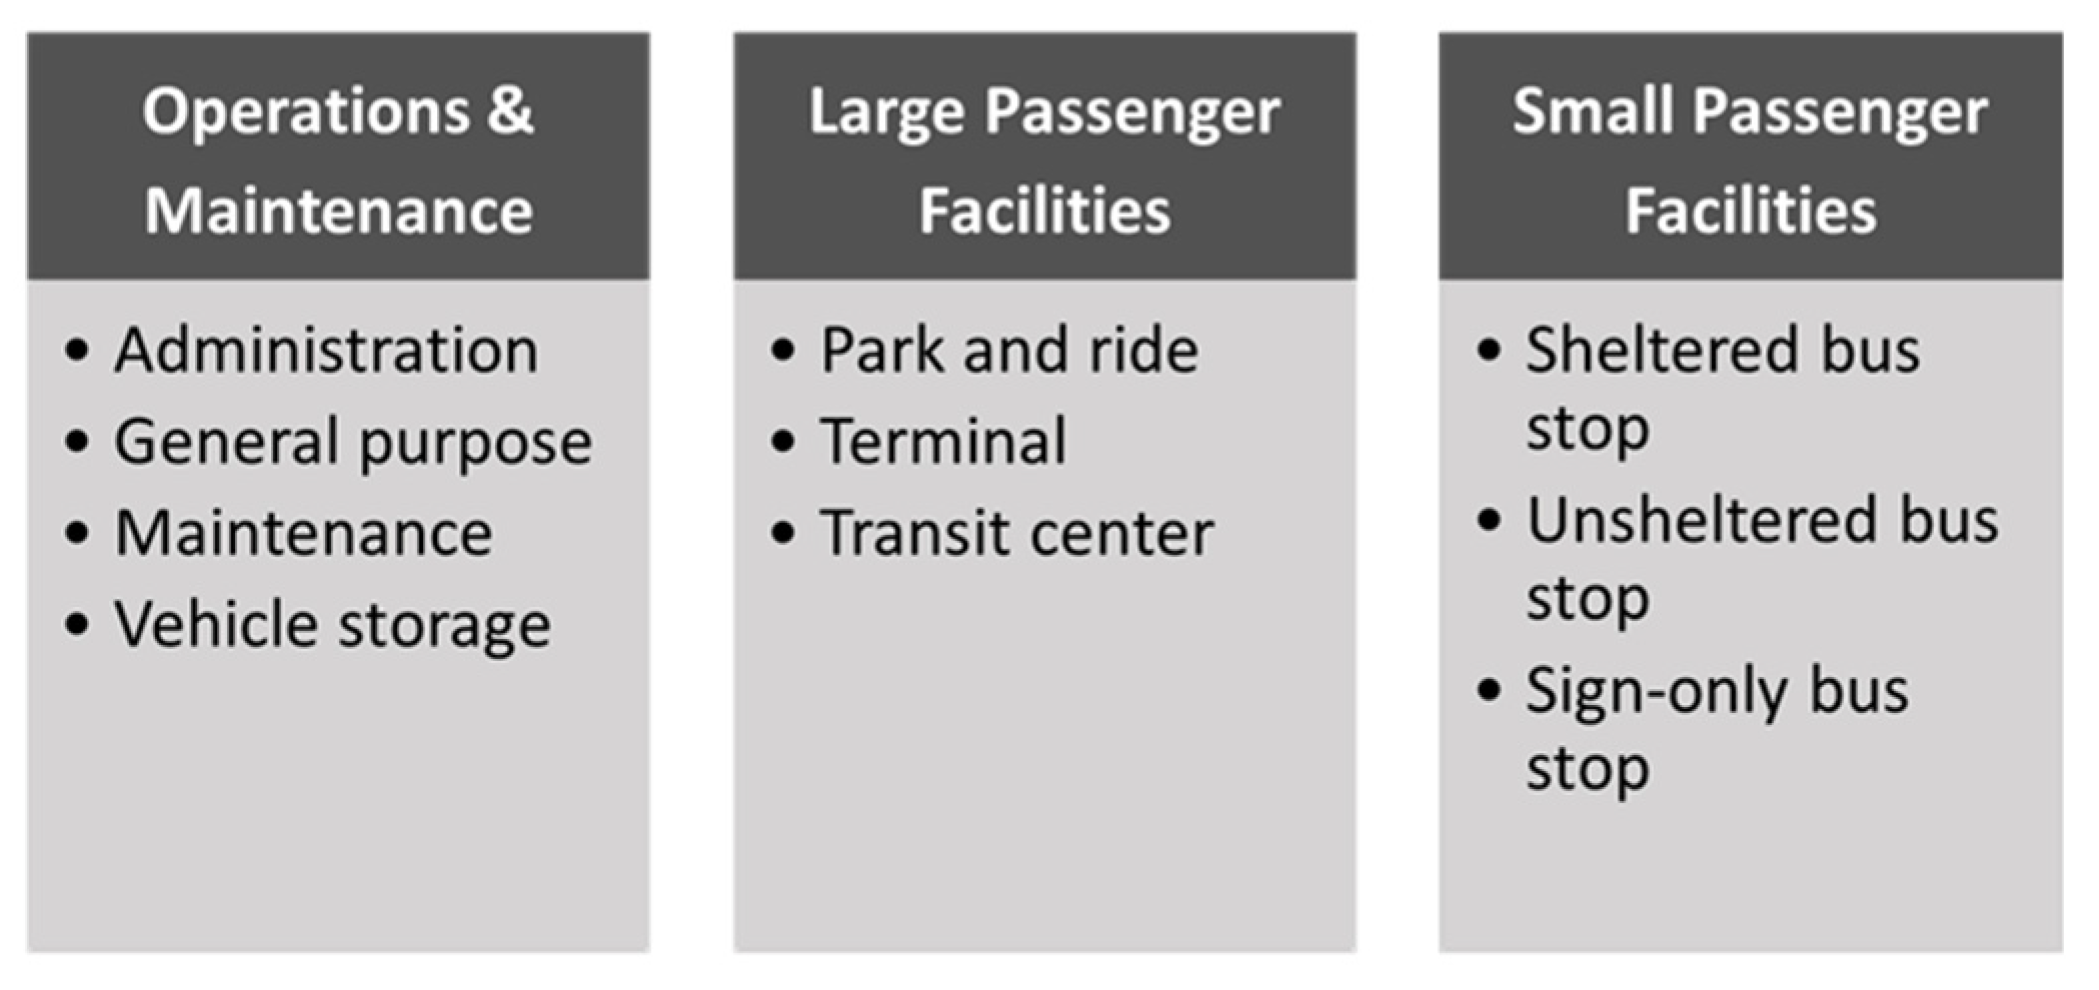
:1. Background
2. Research Gap
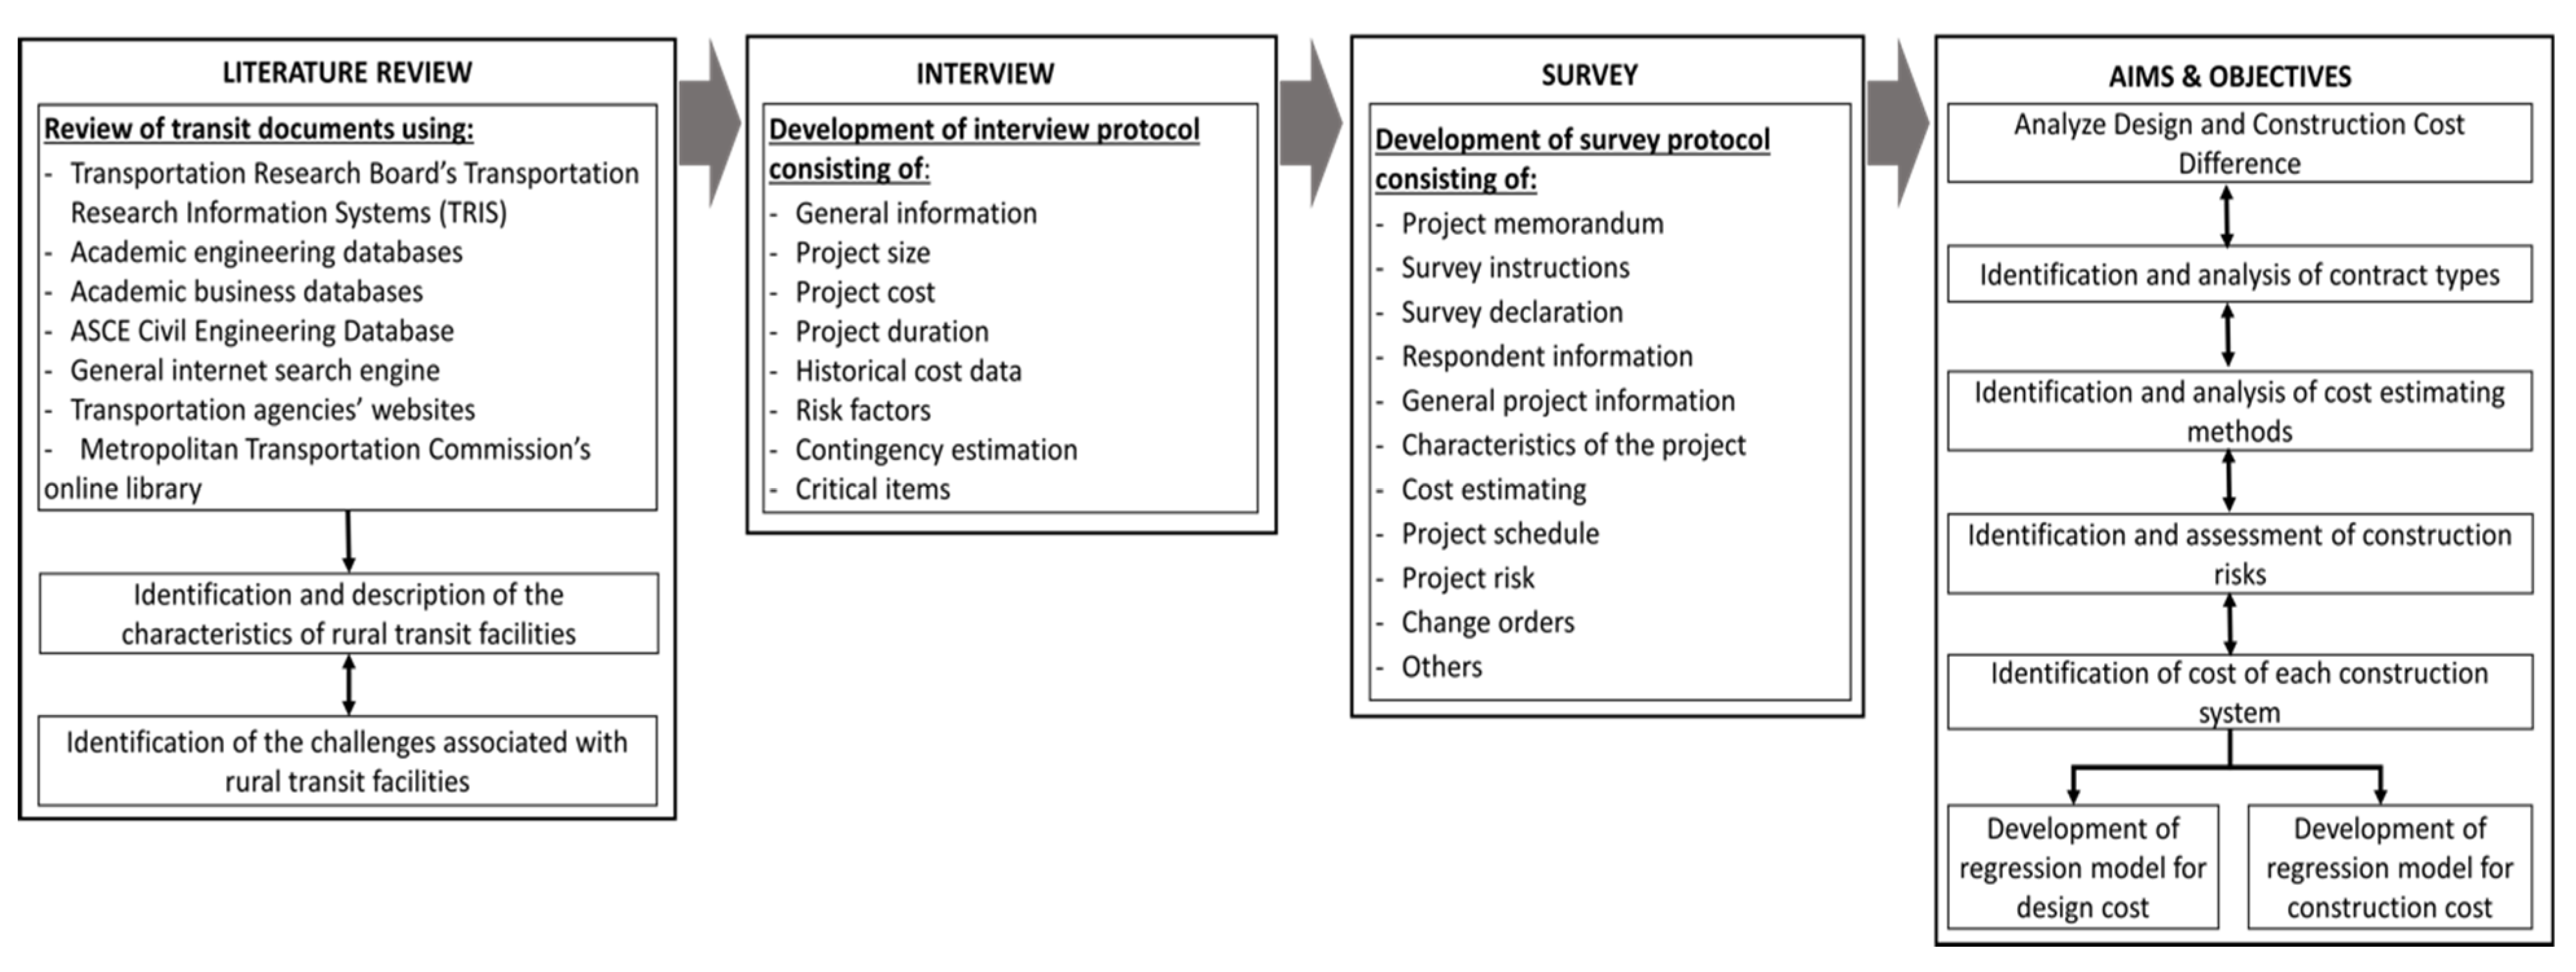
3. Research Framework
3.1. Interview
3.2. Survey
4. Data Analysis and Findings
4.1. Preliminary Data Analysis
4.2. Descriptive Data Analysis
4.2.1. Cost Difference (Overruns/Underruns)
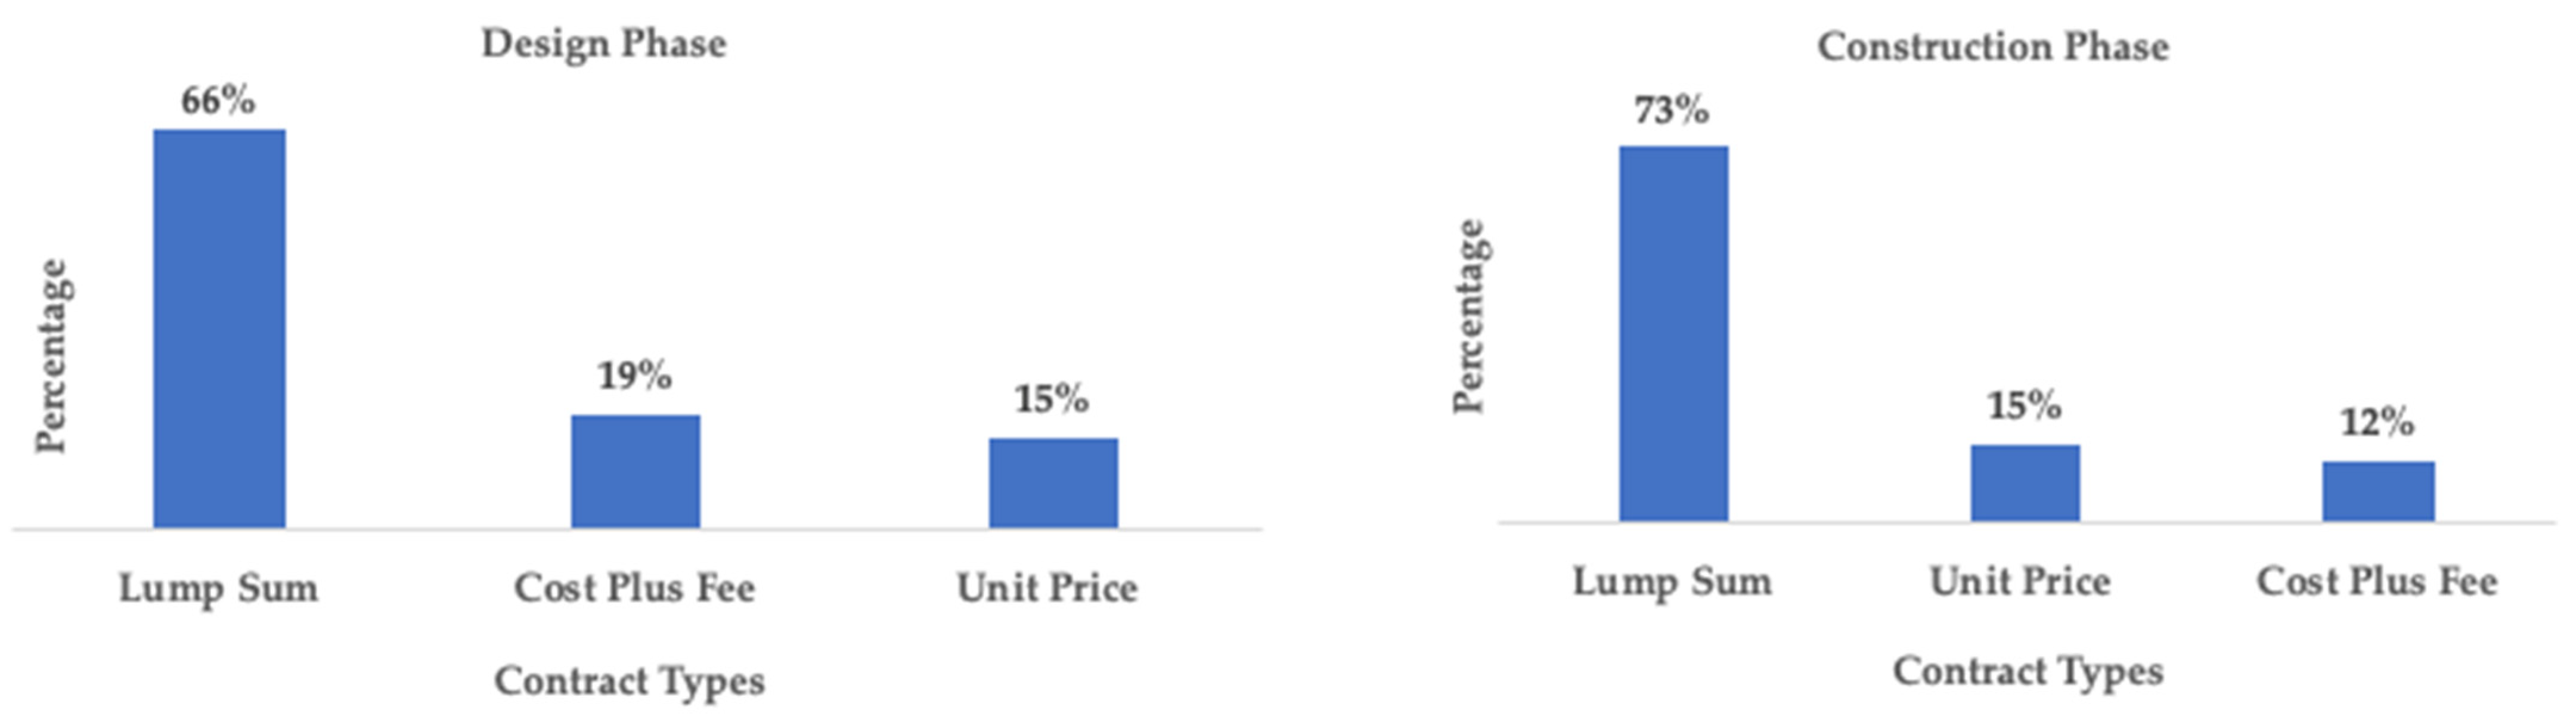
4.2.2. Contract Type
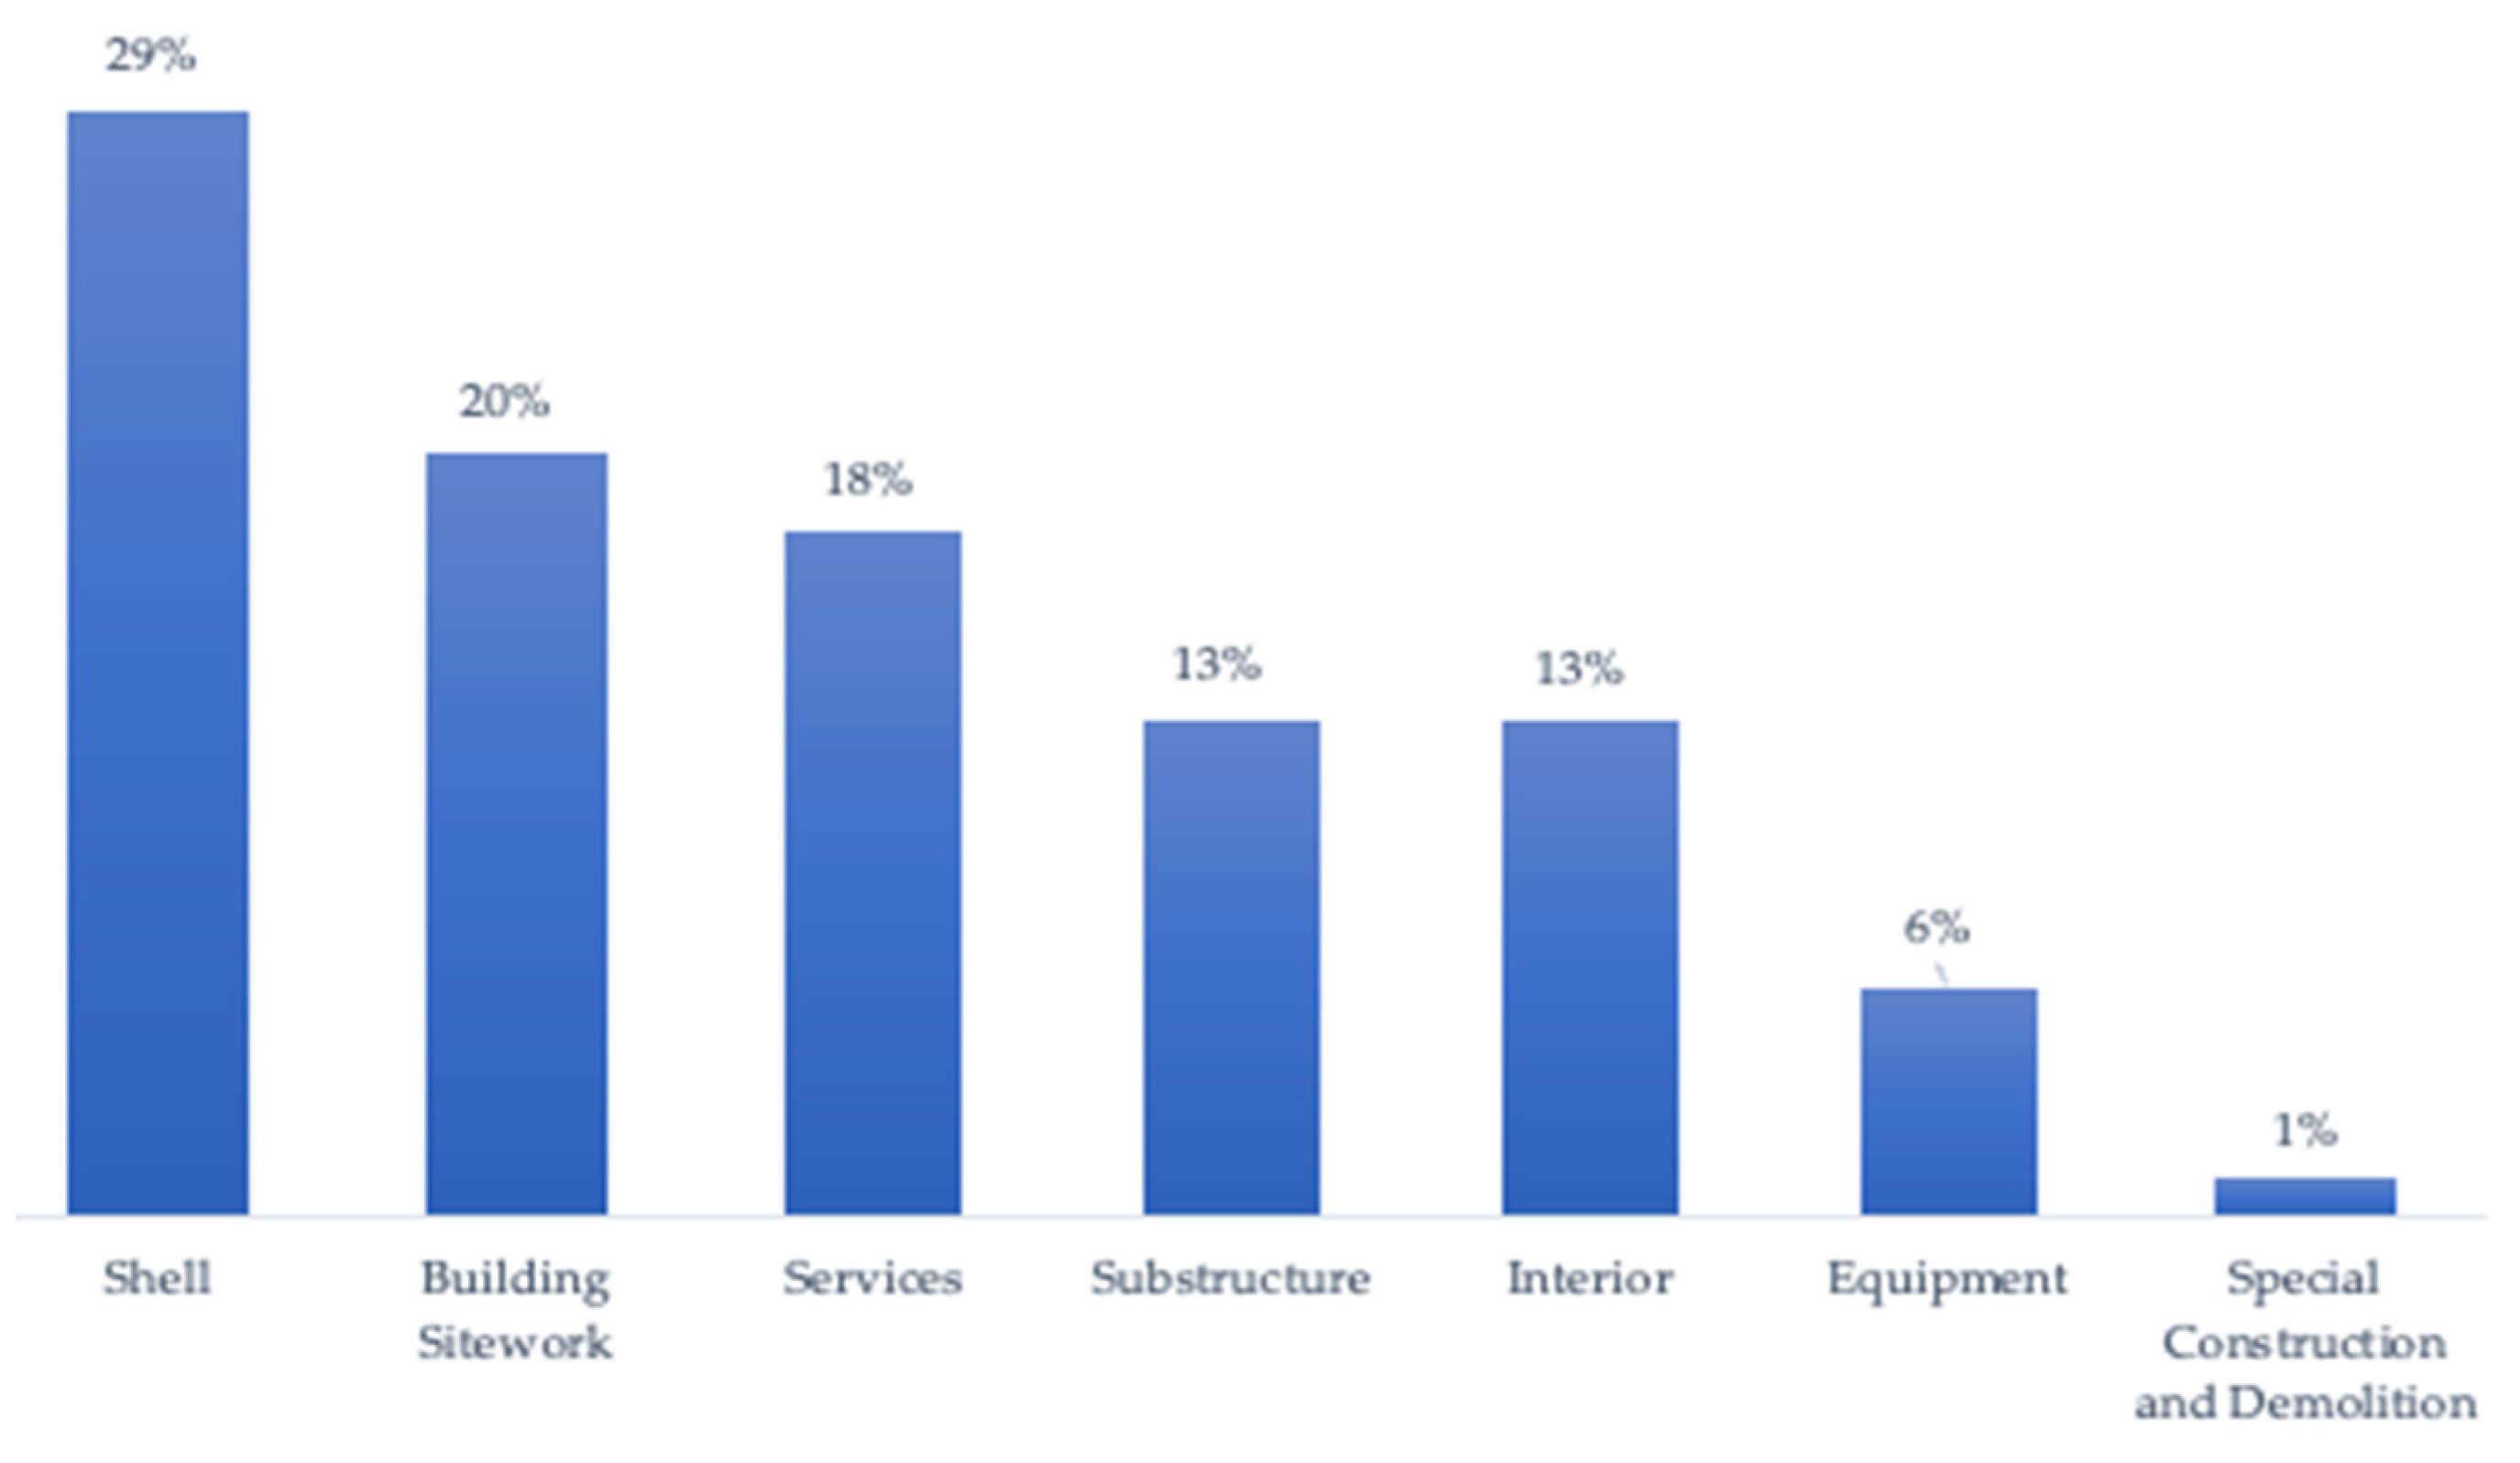
4.2.3. Cost Estimating Methods
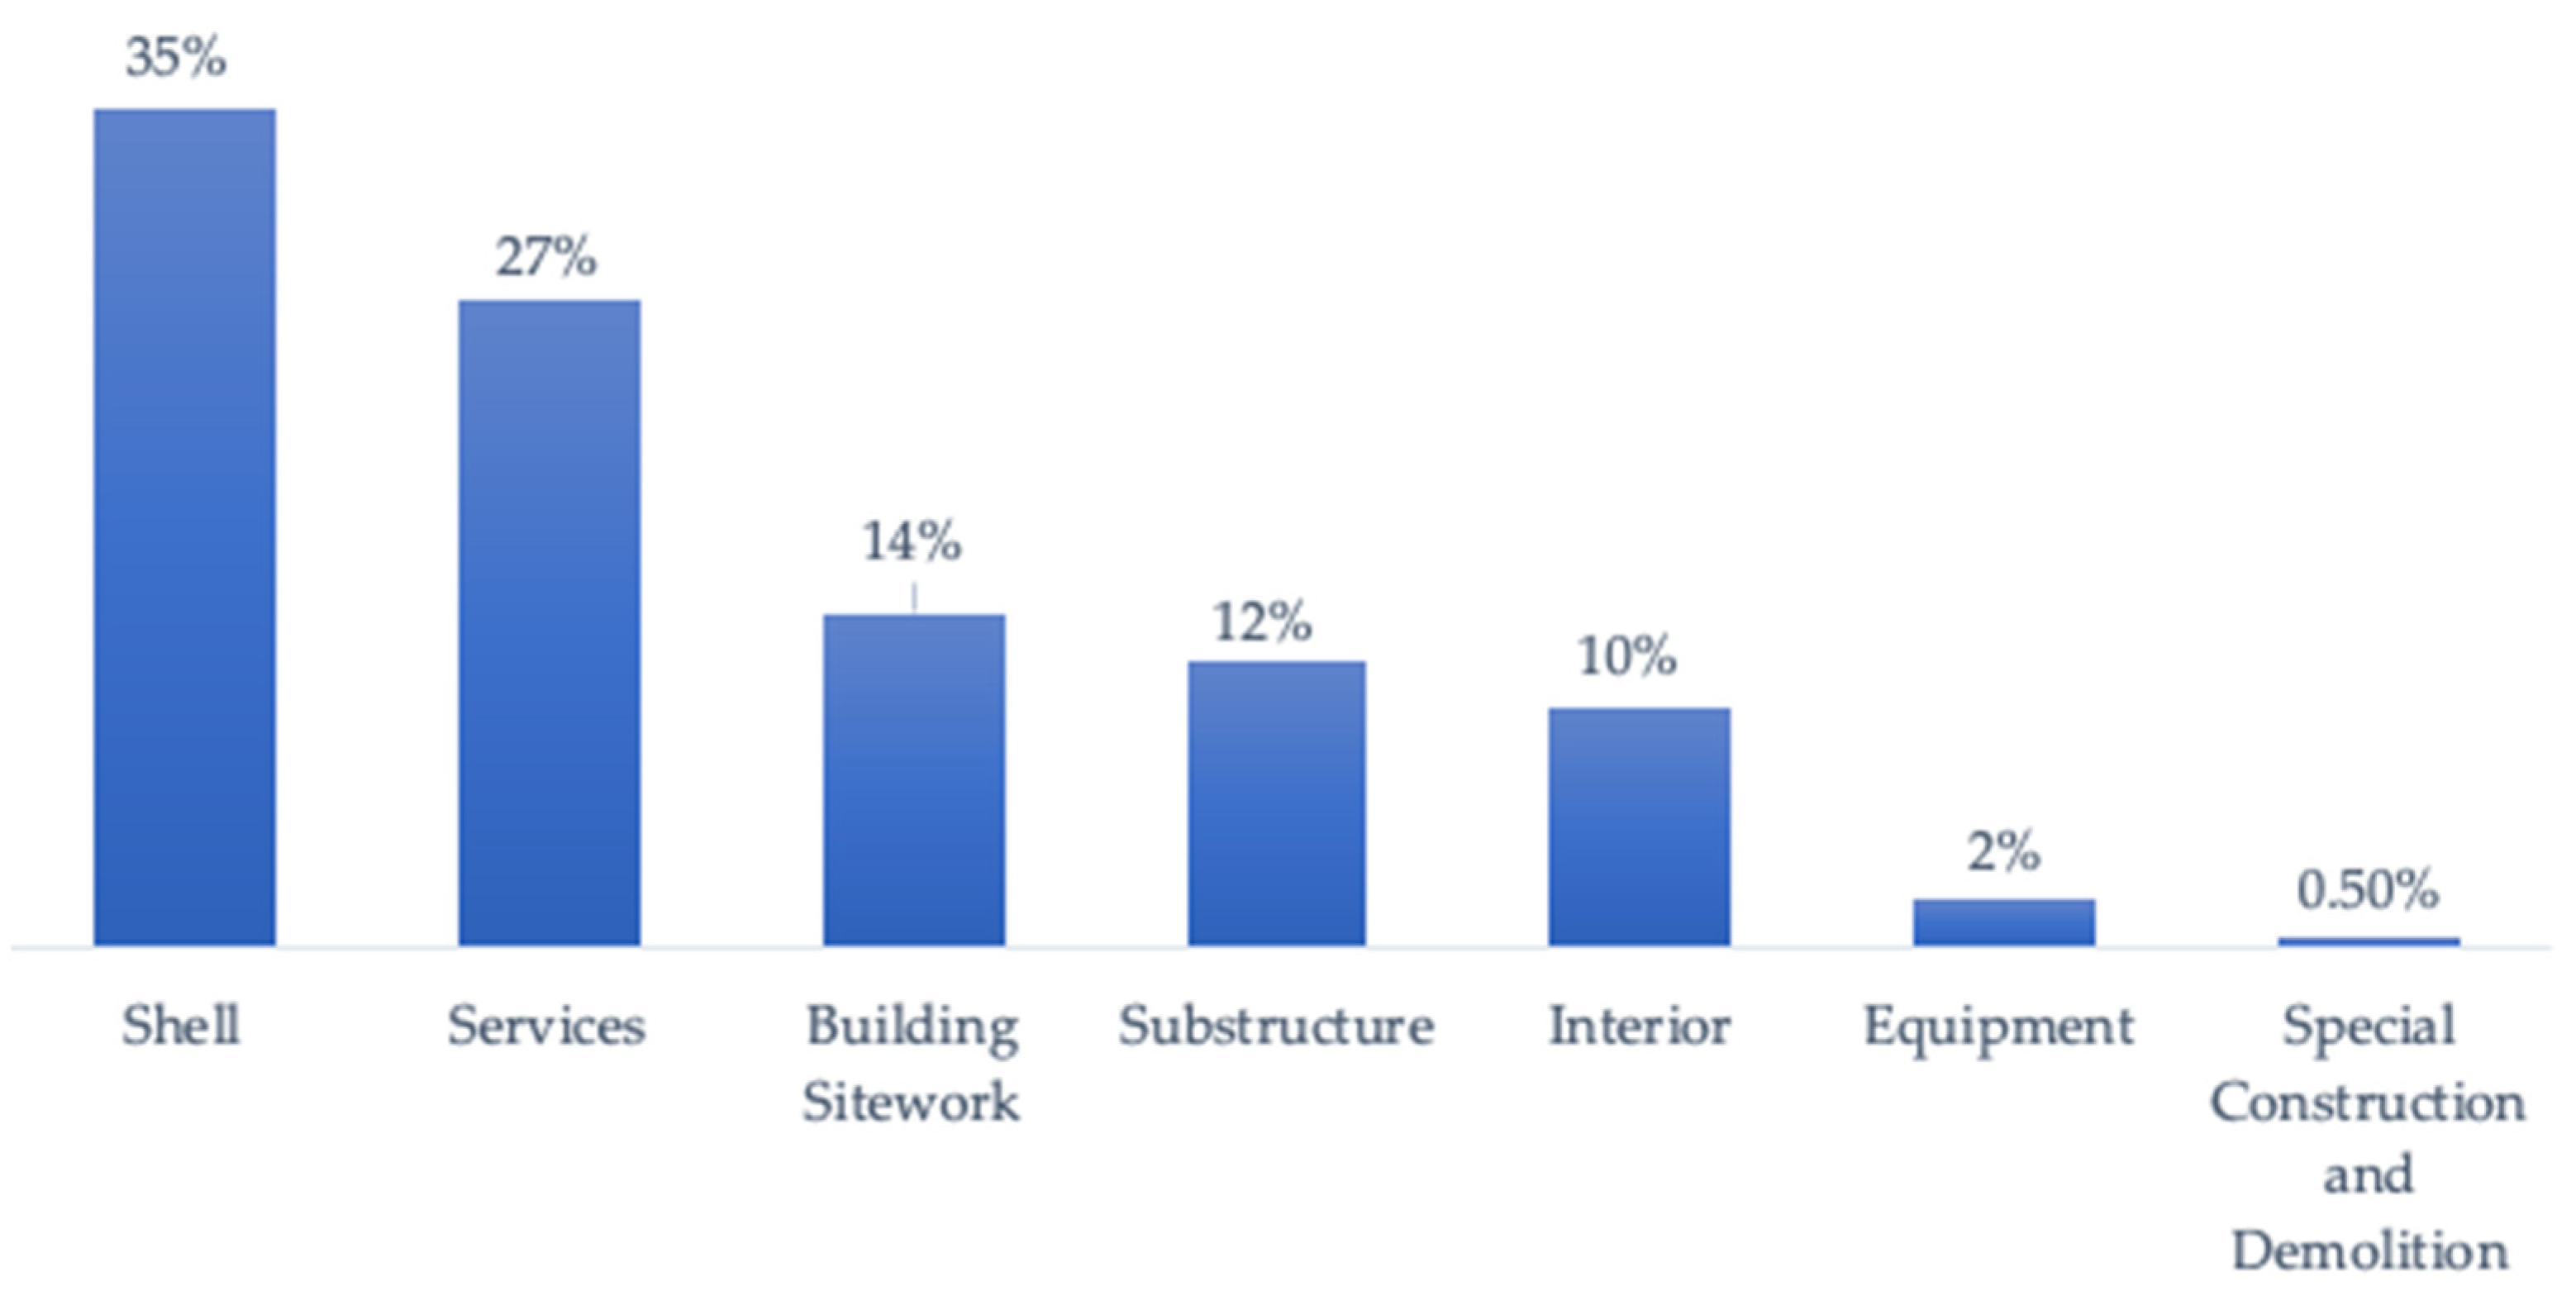
- A higher percentage of cost breakdown was recorded for building site work, because of the necessity for more mechanical and electrical utilities at the site.
- Combination I facilities had a higher percentage of cost of interior, equipment, and furnishings than those of Combination II, because a higher number of walls, floors, and ceiling finishes, interior doors, partitions, and furnishings were required.
- Combination II facilities had a higher shell and service cost percentage than Combination I facilities, owing to the fact that their function, maintenance, and vehicle storage typically require additional heating, airflow, conditioning systems, pipework, and electrical constructions to provide effective and reliable assistance.
4.2.4. Construction Risk Analysis
4.2.5. Contingency Estimating
4.2.6. Estimation of Design and Construction Cost
- The sample size was limited to data and information of 26 rural transit projects. The research team was aware that the small number might negatively affect the models’ predictability; however, there were not enough solid criteria associated with the required number of data to develop a regression model. Some researchers and authors, such as Roscoe [46], followed a rule of thumb, and assumed that 10 samples were required for each dependent variable. The rule of thumb is also commonly used for exploratory studies [47].
- The coefficient of determination was considered for the developed models to evaluate how accurately the regression models could predict the design and construction costs for rural transit facilities. If there was a strong relation between the independent variable and the dependent variable(s), the coefficient of determination became 1. On the contrary, if there was no relation between the independent variable and the dependent variable(s), the coefficient of determination became 0. The authors made an effort to develop regression models for design and construction costs with a coefficient of determination closer to 1.
5. Discussion
6. Conclusions
Author Contributions
Funding
Institutional Review Board Statement
Informed Consent Statement
Data Availability Statement
Acknowledgments
Conflicts of Interest
References
- Thiede, B.C.; Brown, D.L.; Sanders, S.R.; Glasgow, N.; Kulcsar, L. A Demographic Deficit? Local Population Aging and Access to Services in Rural America, 1990–2010. Rural Sociol. 2016, 82, 44–74. [Google Scholar] [CrossRef] [PubMed] [Green Version]
- Queiroz, C.; Gautam, S. Road Infrastructure and Economic Development: Some Diagnostic Indicators; World Bank Publications: Washington, DC, USA, 1992; Volume 921. [Google Scholar]
- Tran, D.Q.; Hallowell, M.R.; Molenaar, K.R. Construction management challenges and best practices for rural transit projects. J. Manag. Eng. 2015, 31, 04014072. [Google Scholar] [CrossRef]
- Federal Highway Administration. Planning for Transportation in Rural Areas. Available online: https://www.fhwa.dot.gov/planning/publications/rural_areas_planning/ruralguide.pdf (accessed on 15 May 2019).
- Womach, J. Agriculture: A Glossary of Terms; Programs, and Laws; Report; Library of Congress: Washington, DC, USA, 2005; p. 279.
- McAndrews, C.; Beyer, K.; Guse, C.E.; Layde, P. How do the definitions of urban and rural matter for transportation safety? Re-interpreting transportation fatalities as an outcome of regional development processes. Accid. Anal. Prev. 2016, 97, 231–241. [Google Scholar] [CrossRef] [PubMed]
- Godavarthy, R.P.; Mattson, J.; Ndembe, E. Cost–Benefit Analysis of Rural and Small Urban Transit in the United States. Transp. Res. Rec. J. Transp. Res. Board 2015, 2533, 141–148. [Google Scholar] [CrossRef]
- Chen, C.; Achtari, G.; Majkut, K.; Sheu, J.-B. Balancing equity and cost in rural transportation management with multi-objective utility analysis and data envelopment analysis: A case of Quinte West. Transp. Res. Part A Policy Pract. 2017, 95, 148–165. [Google Scholar] [CrossRef]
- Jiang, X.; Yang, Z.; Tao, T.; Hu, T. Service Design of Rural Transit Routes in China. In Proceedings of the CICTP 2015, Beijing, China, 24–27 July 2015; pp. 1407–1418. [Google Scholar] [CrossRef]
- Closs, S. Small Town Transit-Oriented Development in Eastern Ontario and Sweden. Master’s Thesis, York University, Toronto, ON, Canada, 2019. [Google Scholar]
- Murillo-Hoyos, J.; Volovski, M.; Labi, S. Rolling stock purchase cost for rail and road public transportation: Random-parameter modelling and marginal effect analysis. Transp. A Transp. Sci. 2016, 12, 436–457. [Google Scholar] [CrossRef]
- Sinha, K.C.; Labi, S. Transportation Decision Making: Principles of Project Evaluation and Programming; John Wiley & Sons: Hoboken, NJ, USA, 2007. [Google Scholar]
- Chou, J.-S.; O’Connor, J.T. Internet-based preliminary highway construction cost estimating database. Autom. Constr. 2007, 17, 65–74. [Google Scholar] [CrossRef]
- Chou, J.-S.; Chen, H.-M.; Hou, C.-C.; Lin, C.-W. Visualized EVM system for assessing project performance. Autom. Constr. 2010, 19, 596–607. [Google Scholar] [CrossRef]
- Kim, K.N.; Choi, J.-H. Breaking the vicious cycle of flood disasters: Goals of project management in post-disaster rebuild projects. Int. J. Proj. Manag. 2013, 31, 147–160. [Google Scholar] [CrossRef]
- Rui, Z.; Li, C.; Peng, F.; Ling, K.; Chen, G.; Zhou, X.; Chang, H. Development of industry performance metrics for offshore oil and gas project. J. Nat. Gas Sci. Eng. 2017, 39, 44–53. [Google Scholar] [CrossRef]
- Hallowell, M.; Tran, D.; Molenaar, K. Guidebook for Construction Management Practices for Rural Projects; Transportation Research Board: Washington, DC, USA, 2012. [Google Scholar]
- Majkut, K. Rural Transportation Issues and Strategies. Knowledge Synthesis for Monieson Centre, Queen’s School of Business 2011. Available online: https://smith.queensu.ca/centres/monieson/index.php (accessed on 10 October 2021).
- Lokshin, M.; Yemtsov, R. Has rural infrastructure rehabilitation in Georgia helped the poor? World Bank Econ. Rev. 2005, 19, 311–333. [Google Scholar] [CrossRef] [Green Version]
- Kermanshachi, S.; Beaty, C.; Anderson, S.D. Improving early phase cost estimation and risk assessment: A department of transportation case study. In Proceedings of the Transportation Research Board 95th Annual Meeting, Washington, DC, USA, 10–14 January 2016. [Google Scholar]
- Kermanshachi, S.; Safapour, E. Identification and quantification of project complexity from perspective of primary stakeholders in US construction projects. J. Civ. Eng. Manag. 2019, 25, 380–398. [Google Scholar] [CrossRef]
- Fox, W.F.; Porca, S. Investing in rural infrastructure. Int. Reg. Sci. Rev. 2001, 24, 103–133. [Google Scholar] [CrossRef] [Green Version]
- Kermanshachi, S.; Safapour, E.; Anderson, S.; Goodrum, P.; Taylor, T.; Sadatsafavi, H. Development of multi-level scoping process framework for transportation infrastructure projects using IDEF modeling technique. In Proceedings of the Transportation Research Board 98th Annual Conference, Washington, DC, USA, 13–17 January 2019. [Google Scholar]
- Lewis, C.A.; Higgins, L.; Perkins, J.; Zhan, F.B.; Chen, X. Regional Transit Coordination Guidebook; Texas Transportation Institute: Bryan, TX, USA, 2009. [Google Scholar]
- Texas Department of Transportation. The Texas Rural Transportation Plan. Transportation Planning and Programming Division; Texas Department of Transportation (TXDOT): Austin, TX, USA, 2012.
- Jin, Z.; Kang, S.; Jung, Y.; Koo, C.-G.; Choi, S.-H. Issues and Needs for Standard Classifications for Facility Management in Smart Manufacturing. In Proceedings of the International Symposium on Automation and Robotics in Construction, Berlin, Germany, 20–25 July 2018; pp. 1–8. [Google Scholar] [CrossRef] [Green Version]
- American Public Transportation Association (APTA). Architectural and Engineering Design for a Transit Operating and Maintenance Facility; Rep. No. APTA BTS-BMF-RP-001-11; American Public Transportation Association: Washington, DC, USA, 2010. [Google Scholar]
- Abd Wahab, S.R.H.; Chohan, A.H.; Che-Ania, A.I.; Tawil, N.M.; Omar, H. The Classification of Facilities to Determine the Management Fund Allocation at Non-Low Cost of High-Rise Residential Building. Rev. Fac. Ing. U.C.V. 2016, 31, 9–18. [Google Scholar] [CrossRef]
- Kermanshachi, S.; Rouhanizadeh, B. Sensitivity analysis of construction schedule performance due to increased change orders and decreased labor productivity. In Proceedings of the 7th CSCE International Construction Specialty Conference (ICSC), Laval, QC, Canada, 12–15 June 2019; pp. 12–15. [Google Scholar]
- Kermanshachi, S.; Safapour, E.; Anderson, S.D.; Goodrum, P.; Taylor, T.R. Establishment of effective project scoping process for highway and bridge construction projects. Pract. Period. Struct. Des. Constr. 2020, 25, 06020001. [Google Scholar] [CrossRef]
- Jacobs, F.H. The Five-tiered Approach to Evaluation: Context and Implementation. In Evaluating Family Programs; Aldine DeGruyter: New York, NY, USA, 1988; pp. 37–68. [Google Scholar] [CrossRef]
- Rossi, P.H.; Lipsey, M.W.; Freeman, H.E. Evaluation: A Systematic Approach; Sage Publications: Southend Oaks, CA, USA, 1993. [Google Scholar]
- Rouhanizadeh, B.; Kermanshachi, S.; Ramaji, I.J.; Shakerian, S. Development of an Automated Tool for Cost Estimation of Transportation Projects. In Proceedings of the ASCE International Conference on Transportation and Development, Virtual Conference. 8–10 June 2021; pp. 178–190. [Google Scholar]
- Karlaftis, M.G. Ownership and competition in European transit: Assessing efficiency. Transportmetrica 2010, 6, 143–160. [Google Scholar] [CrossRef]
- Kermanshachi, S.; Zheng, Y.; Anderson, S.D.; Cliff, S.; Molenaar, K.R. Cost Estimating Tool for Early Estimates for Rural and Small Urban Transit Facilities. In Proceedings of the 95th Annual Meeting of Transportation Research Board (TRB), Washington, DC, USA, 10–14 January 2016. [Google Scholar]
- Kermanshachi, S.; Safapour, E.; Anderson, S.; Molenaar, K.; Schexnayder, C. Development of the Cost Baseline for Achieving Excellence in Rural Transit Facilities. In Proceedings of the Transportation Research Board 98th Annual Conference, Washington, DC, USA, 4–7 November 2018. [Google Scholar]
- Anderson, S.; Quiroga, C.; Overman, J.; Choi, K.; Sahu, J.; Kermanshachi, S.; Goodrum, P.; Taylor, T.; Li, Y. Effective Project Scoping Practices to Improve on-Time and on-Budget Delivery of Highway Projects; Transportation Research Board: Washington, DC, USA, 2016; ISBN 9780309375108. [Google Scholar] [CrossRef]
- Zheng, Y. Cost Estimating Database and Prototype Tool to Support Design and Construction of Rural and Small Urban Transit Facilities. Master’s Thesis, Texas A & M University, College Station, TX, USA, 2014. [Google Scholar]
- Ferguson, E.M.; Duthie, J.; Unnikrishnan, A.; Waller, S.T. Incorporating equity into the transit frequency-setting problem. Transp. Res. Part A Policy Pract. 2012, 46, 190–199. [Google Scholar] [CrossRef]
- Dworkin, S.L. Sample Size Policy for Qualitative Studies Using In-Depth Interviews. Arch. Sex. Behav. 2012, 41, 1319–1320. [Google Scholar] [CrossRef] [Green Version]
- Kaplanogu, S.; Arditi, D. Pre-project peer reviews in GMP/lump sum contracts. Eng. Constr. Arch. Manag. 2009, 16, 175–185. [Google Scholar] [CrossRef]
- Kermanshachi, S.; Safapour, E.; Anderson, S.; Goodrum, P.; Taylor, T.; Sadatsafavi, H. Exploring current scoping practices used in the development of transportation infrastructure projects. In Proceedings of the CSCE 12th International Transportation Specialty, Fredericton, NB, Canada, 13–16 June 2018. [Google Scholar]
- Bogus, S.M.; Shane, J.S.; Molenaar, K.R. Contract payment provisions and project performance: An analysis of municipal water and wastewater facilities. Public Work. Manag. Policy 2010, 15, 20–31. [Google Scholar] [CrossRef]
- Bley, A.F.S. Improved Conceptual Estimating Performance Using a Knowledge-Based Approach; The University of Texas at Austin: Austin, TX, USA, 1990. [Google Scholar]
- Phaobunjong, K. Parametric Cost Estimating Model for Conceptual Cost Estimating of Building Construction Projects; The University of Texas at Austin: Austin, TX, USA, 2002. [Google Scholar]
- Roscoe, J.T. Fundamental Research Statistics for the Behavioral Sciences [by] John T. Roscoe; Holt, Rinehart and Winston: New York, NY, USA, 1975. [Google Scholar]
- Le-Hoai, L.; Dai Lee, Y. Time-cost relationships of building construction project in Korea. Facilities 2009, 27, 549–559. [Google Scholar] [CrossRef]
- Choudhury, I.; Rajan, S.S. Time-cost relationship for residential construction in Texas. CIB Rep. 2003, 284, 73. [Google Scholar]
- Forcada, N.; Gangolells, M.; Casals, M.; Macarulla, M. Factors affecting rework costs in construction. J. Constr. Eng. Manag. 2017, 143, 04017032. [Google Scholar] [CrossRef] [Green Version]


| Category | Description |
|---|---|
| Project Memorandum | The purpose of this section is to discuss the objectives of the research, email address of the research team, and the timeline for completing the online survey. |
| Survey Instructions | This section discussed specific types of transit facilities that have been constructed within the past five years. |
| Survey Declaration | The survey declaration was created to ensure that participants had a working knowledge of cost estimate procedures for rural and small urban transit facility projects and consented voluntarily to participate in the survey. |
| Respondent Information | The purpose of this section is to collect general information regarding the respondents such as full name, agency name, agency type, etc. |
| General Project Information | The purpose of this section is to collect general information regarding the project such as project location, start of the design and construction, funding source, etc. |
| Characteristics of the project | The purpose of this section is to collect information regarding the project characteristics such as size, main facility systems and elements, etc. |
| Cost Estimating | The purpose of this section is to collect actual data regarding the cost estimating methods, database, and documentation, etc. |
| Project Schedule | The purpose of this section is to collect information regarding the project duration, and delays. |
| Project Risk | The purpose of this section is to collect information regarding the project risk factors. |
| Change Orders | The purpose of this section is to collect information regarding the time, reason, and cost of design and/or construction changes. |
| Others | The purpose of this section is to collect any lesson learned about cost estimating of the project. |
| # | Transit Facility Type | Project Size (sf) | Baseline Budget ($) | |
|---|---|---|---|---|
| Design | Construction | |||
| 1 | Shelter bus stop, Sign-only bus stop | 30 sf | $1850 | $6691 |
| 2 | Shelter bus stop | 100 sf | $6000 | $90,000 |
| 3 | Administration, Maintenance | 200 sf | $12,400 | $20,000 |
| 4 | Administration, Operations, Maintenance, Vehicle Storage, Small Passenger Facility, Shelter bus stop, Un-shelter bus stop, Sign-only bus stop | 2000 sf | $15,278 | $122,500 |
| 5 | Administration, Shelter bus stop | 4078 sf | $127,210 | $1,345,760 |
| 6 | Operations | 5000 sf | $156,000 | $468,000 |
| 7 | Operations | 6000 sf | $130,000 | $1,170,000 |
| 8 | Operations, Vehicle Storage | 6720 sf | $100,000 | $277,637 |
| 9 | Operations, Maintenance, Vehicle Storage | 8184 sf | $ 43,600 | $545,000 |
| 10 | Operations, Maintenance | 8300 sf | $120,000 | $1,200,000 |
| 11 | Administration, Operations, Maintenance, Vehicle Storage | 12,500 sf | $90,000 | $985,000 |
| 12 | Administration, Vehicle Storage | 13,529 sf | $105,000 | $1,375,000 |
| 13 | Administration, Operations, Maintenance, Vehicle Storage | 16,500 sf | $200,000 | $4,790,000 |
| 14 | Administration, Operations, Vehicle Storage | 17,000 sf | $250,000 | $2,500,000 |
| 15 | Large Passenger Facility | 19,000 sf | $216,246 | $1,889,067 |
| 16 | Small Passenger Facility | 28,000 sf | $446,980 | $3,980,000 |
| 17 | Administration, Operations, Maintenance, Vehicle Storage | 29,030 sf | $482,000 | $4,088,000 |
| 18 | Administration, Operations, Maintenance, Vehicle Storage | 30,000 sf | $129,500 | $2,450,000 |
| 19 | Administration, Operations, Maintenance, Vehicle Storage | 32,000 sf | $350,000 | $5,000,000 |
| 20 | Administration, Operations, Maintenance, Vehicle Storage | 33,295 sf | $450,000 | $6,816,772 |
| 21 | Administration, Operations, Vehicle Storage | 36,967 sf | $350,000 | $3,739,432 |
| 22 | Administration, Operations, Maintenance, Vehicle Storage | 40,000 sf | $1,586,500 | $7,557,392 |
| 23 | Administration, Operations, Maintenance, Vehicle Storage | 45,000 sf | $70,696 | $1,390,762 |
| 24 | Administration, Operations, Maintenance, Vehicle Storage | 70,000 sf | $1,500,000 | $30,000,000 |
| 25 | Administration, Operations, Maintenance, Vehicle Storage | 75,000 sf | $2,000,000 | $30,000,000 |
| 26 | Operations | 75,000 sf | $95,000 | $210,000 |
| Different Categories | Minimum | Maximum | Mean | Standard Deviation | ||
|---|---|---|---|---|---|---|
| Cost | Design Phase | Baseline | $1850 | $2,000,000 | $356,570 | $529,817 |
| Actual | $2365 | $2,000,000 | $387,544 | $580,439 | ||
| Construction Phase | Baseline | $6691 | $30,000,000 | $4,851,832 | $8,419,886 | |
| Actual | $7531 | $40,000,000 | $5,278,808 | $10,011,426 | ||
| Schedule | Design Phase | Actual | 2 Months | 82 Months | 20 Months | 23 Months |
| Construction Phase | Actual | 4 Months | 53 Months | 11 Months | 11 Months | |
| Phase | Minimum | Maximum | Mean | Standard Deviation |
|---|---|---|---|---|
| Design | $0 | $103,678 | $11,506 | $24,861 |
| Construction | $0 | $10,000,000 | $598,576 | $1,946,754 |
| Cost Estimating Methods | P * (%) | Cost Estimating Methods | P * (%) | ||
|---|---|---|---|---|---|
| Design Phase | Similar projects | 48% | Construction Phase | Similar projects | 55% |
| Hours to design | 30% | Historical bid data | 20% | ||
| Historical percentage of construction cost | 9% | Contractor’s estimates | 10% | ||
| Architect’s estimates | 5% | Combination of similar projects and historical data | 5% | ||
| Contractor’s estimates | 4% | Architect’s estimates | 5% | ||
| Historical bid data | 4% | Consultant’s estimates | 5% | ||
| Risk Factors | Percentage (%) |
|---|---|
| Soil condition | 23 |
| Unexpected underground conditions | 17 |
| Environmental issues | 8 |
| Increased slope | 8 |
| High project complexity | 8 |
| Lack of bidding competition | 6 |
| Higher transportation expenses | 6 |
| Omissions and errors in design | 6 |
| Unexpected weather conditions | 3 |
| Bidding time | 3 |
| Complaint from neighborhood | 3 |
| Lack of funding | 2 |
| Buy America compliance | 2 |
| Material | 2 |
| Analysis of Variance | |||||
|---|---|---|---|---|---|
| Source | DF | Sum of Squares | Mean Square | F Ratio | Sig. |
| Model | 1 | 1.6421 × 10¹³ | 1.642 × 10¹³ | 132.9848 | 0.000 |
| Error | 13 | 1.6053 × 10¹² | 1.235 × 10¹¹ | ||
| C. Total | 14 | 1.8027 × 10¹³ | |||
| Parameter Estimates | |||||
| Term | Estimate | Std. Error | t Ratio | ||
| Project Size (sf) | 31.635567 | 2.743308 | 11.53 | ||
| Analysis of Variance | |||||
|---|---|---|---|---|---|
| Source | DF | Sum of Squares | Mean Square | F Ratio | Sig. |
| Model | 1 | 1.3637 × 10¹⁴ | 1.364 × 10¹⁴ | 175.0717 | 0.000 |
| Error | 11 | 8.5685 × 10¹² | 7.79 × 10¹¹ | ||
| C. Total | 12 | 1.4494 × 10¹⁴ | |||
| Parameter Estimates | |||||
| Term | Estimate | Std. Error | t Ratio | ||
| Project Size (sf) | 172.6989 | 13.05214 | 13.23 | ||
Publisher’s Note: MDPI stays neutral with regard to jurisdictional claims in published maps and institutional affiliations. |
© 2022 by the authors. Licensee MDPI, Basel, Switzerland. This article is an open access article distributed under the terms and conditions of the Creative Commons Attribution (CC BY) license (https://creativecommons.org/licenses/by/4.0/).
Share and Cite
Kermanshachi, S.; Safapour, E.; Pamidimukkala, A. Study of Design and Construction of Transit Facilities in Rural Areas in USA. Sustainability 2022, 14, 1338. https://doi.org/10.3390/su14031338
Kermanshachi S, Safapour E, Pamidimukkala A. Study of Design and Construction of Transit Facilities in Rural Areas in USA. Sustainability. 2022; 14(3):1338. https://doi.org/10.3390/su14031338
Chicago/Turabian StyleKermanshachi, Sharareh, Elnaz Safapour, and Apurva Pamidimukkala. 2022. "Study of Design and Construction of Transit Facilities in Rural Areas in USA" Sustainability 14, no. 3: 1338. https://doi.org/10.3390/su14031338
APA StyleKermanshachi, S., Safapour, E., & Pamidimukkala, A. (2022). Study of Design and Construction of Transit Facilities in Rural Areas in USA. Sustainability, 14(3), 1338. https://doi.org/10.3390/su14031338