
Improving Effects of Afforestation with Different Forest Types on Soil Nutrients and Bacterial Community in Barren Hills of North China

Abstract
:1. Introduction
2. Materials and Methods
2.1. Study Sites
2.2. Plot Design, Vegetation Survey and Soil Sampling
2.3. Soil Properties Assessment
2.4. Soil Bacterial Community Analysis
3. Result
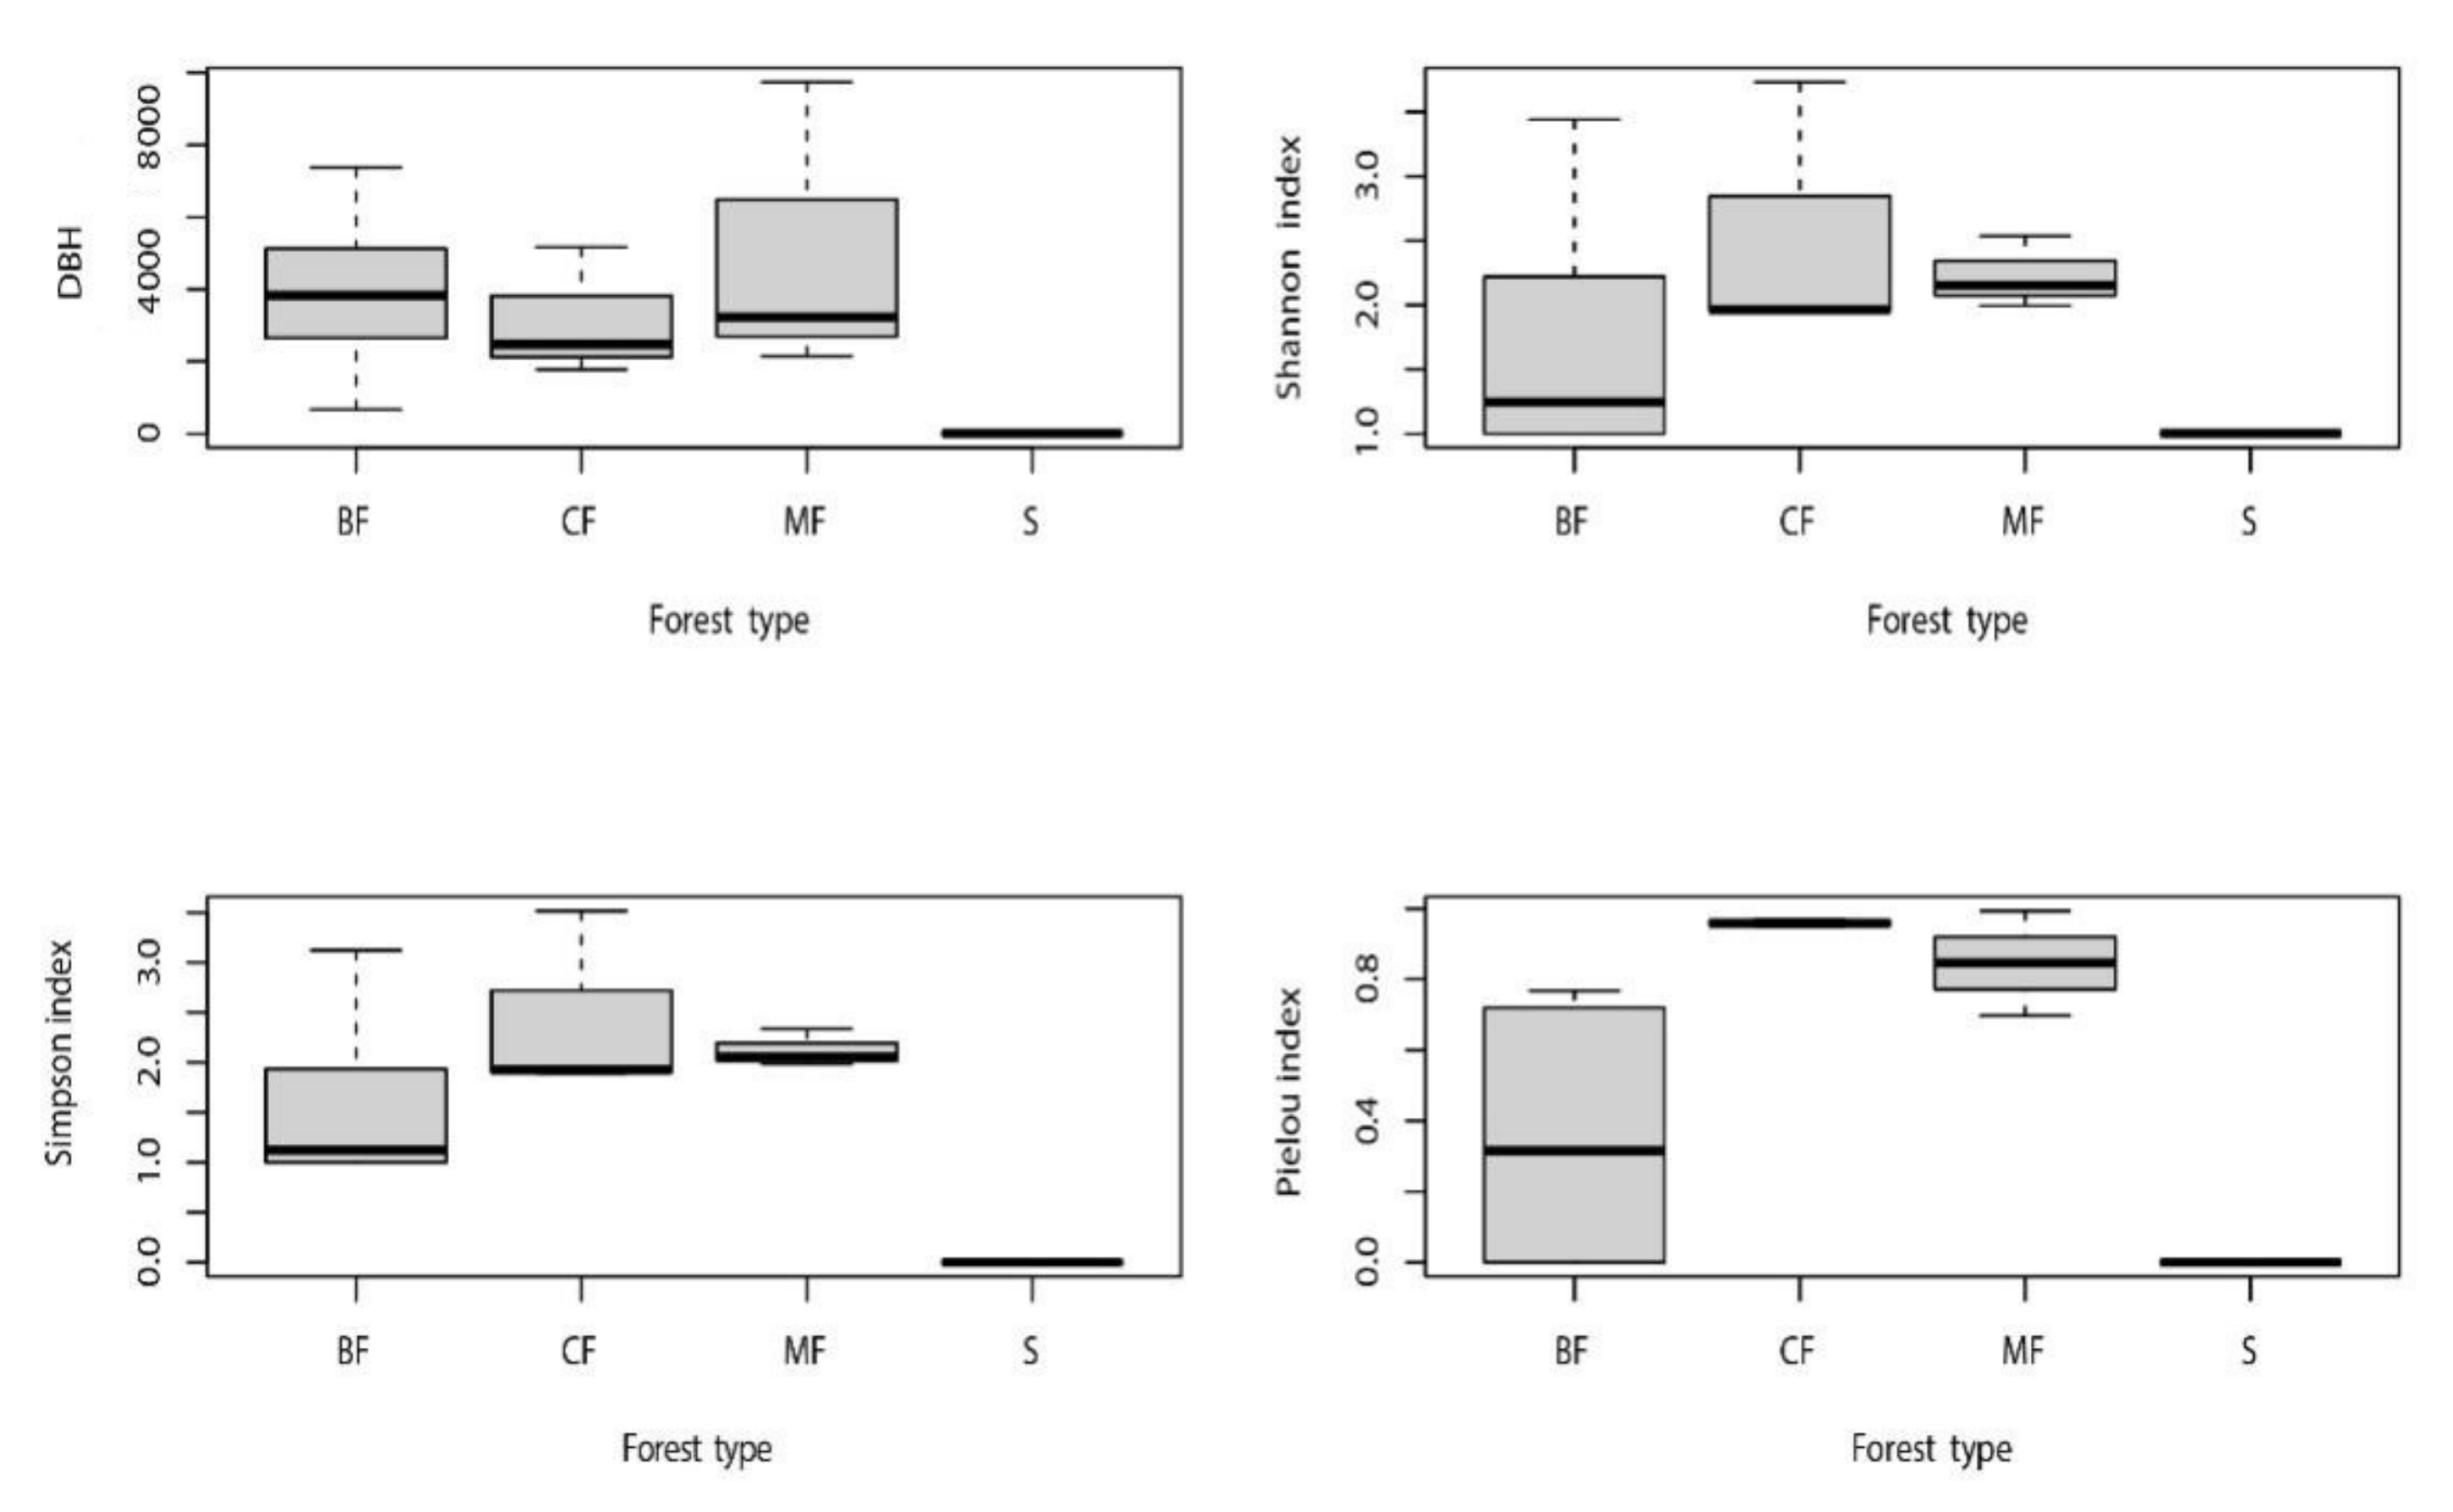
3.1. Vegetation Community Structure
3.2. Soil Physicochemical Properties
3.3. Soil Microbial Diversity and Composition
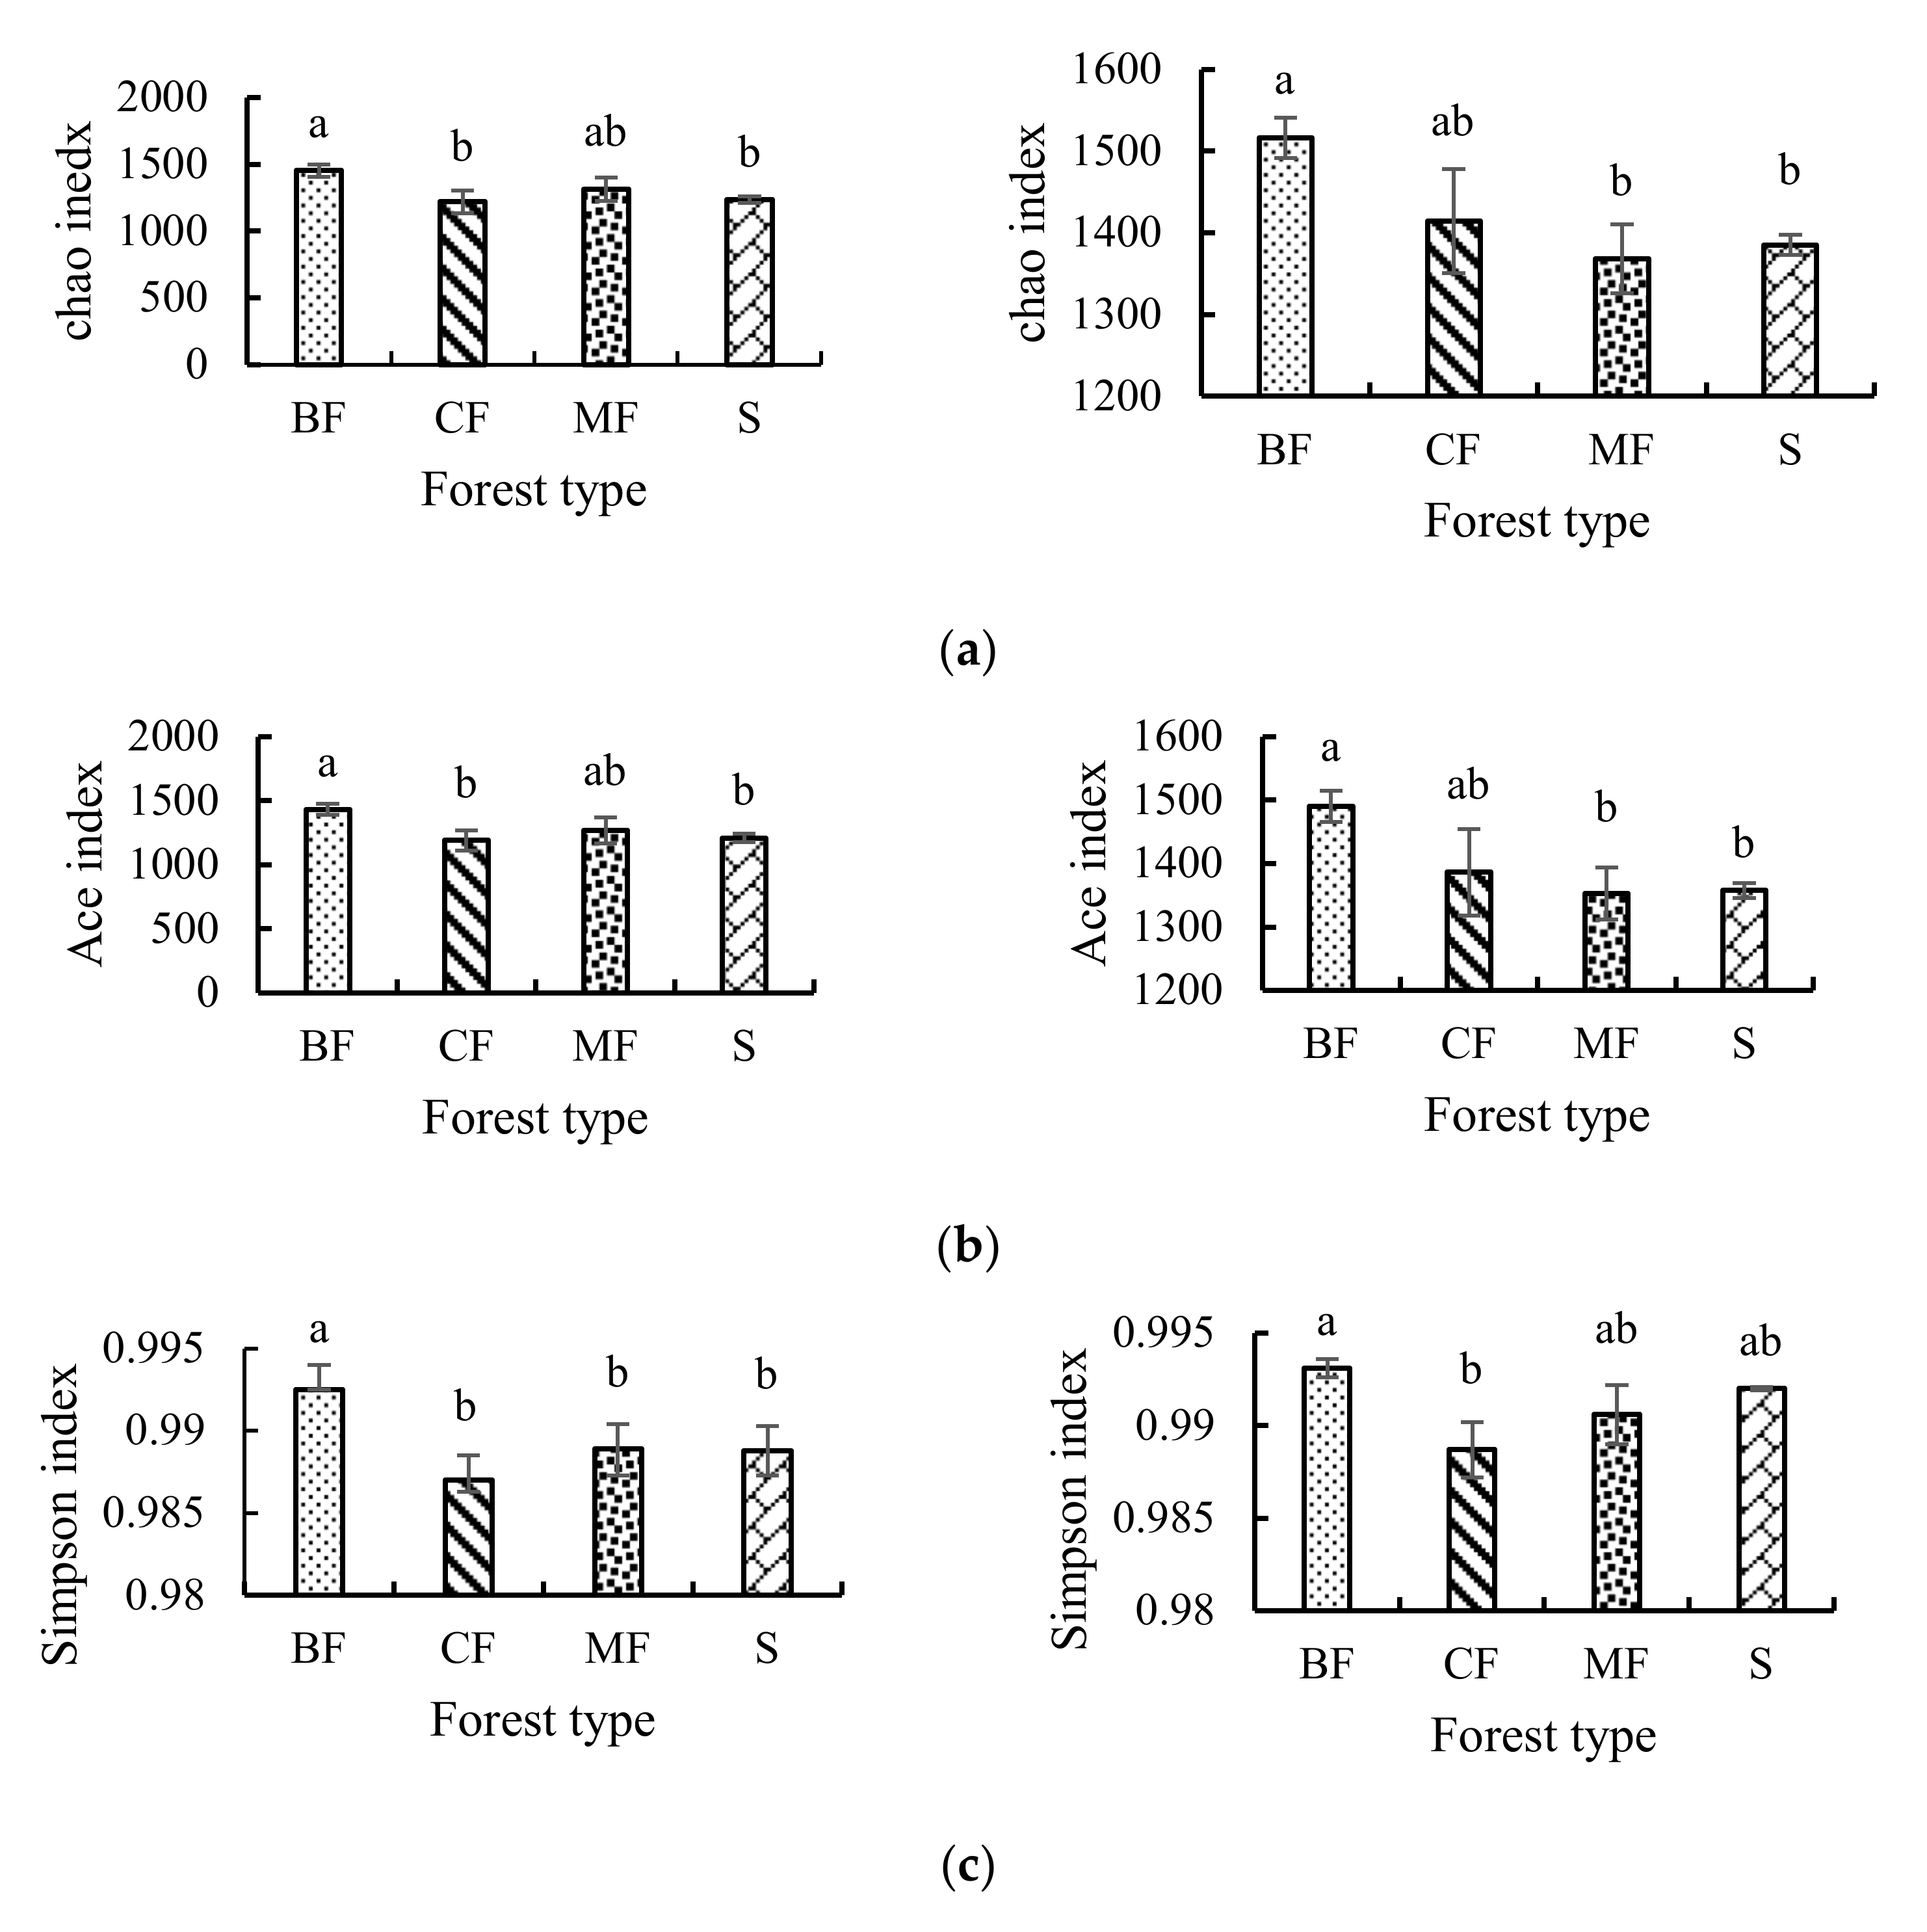
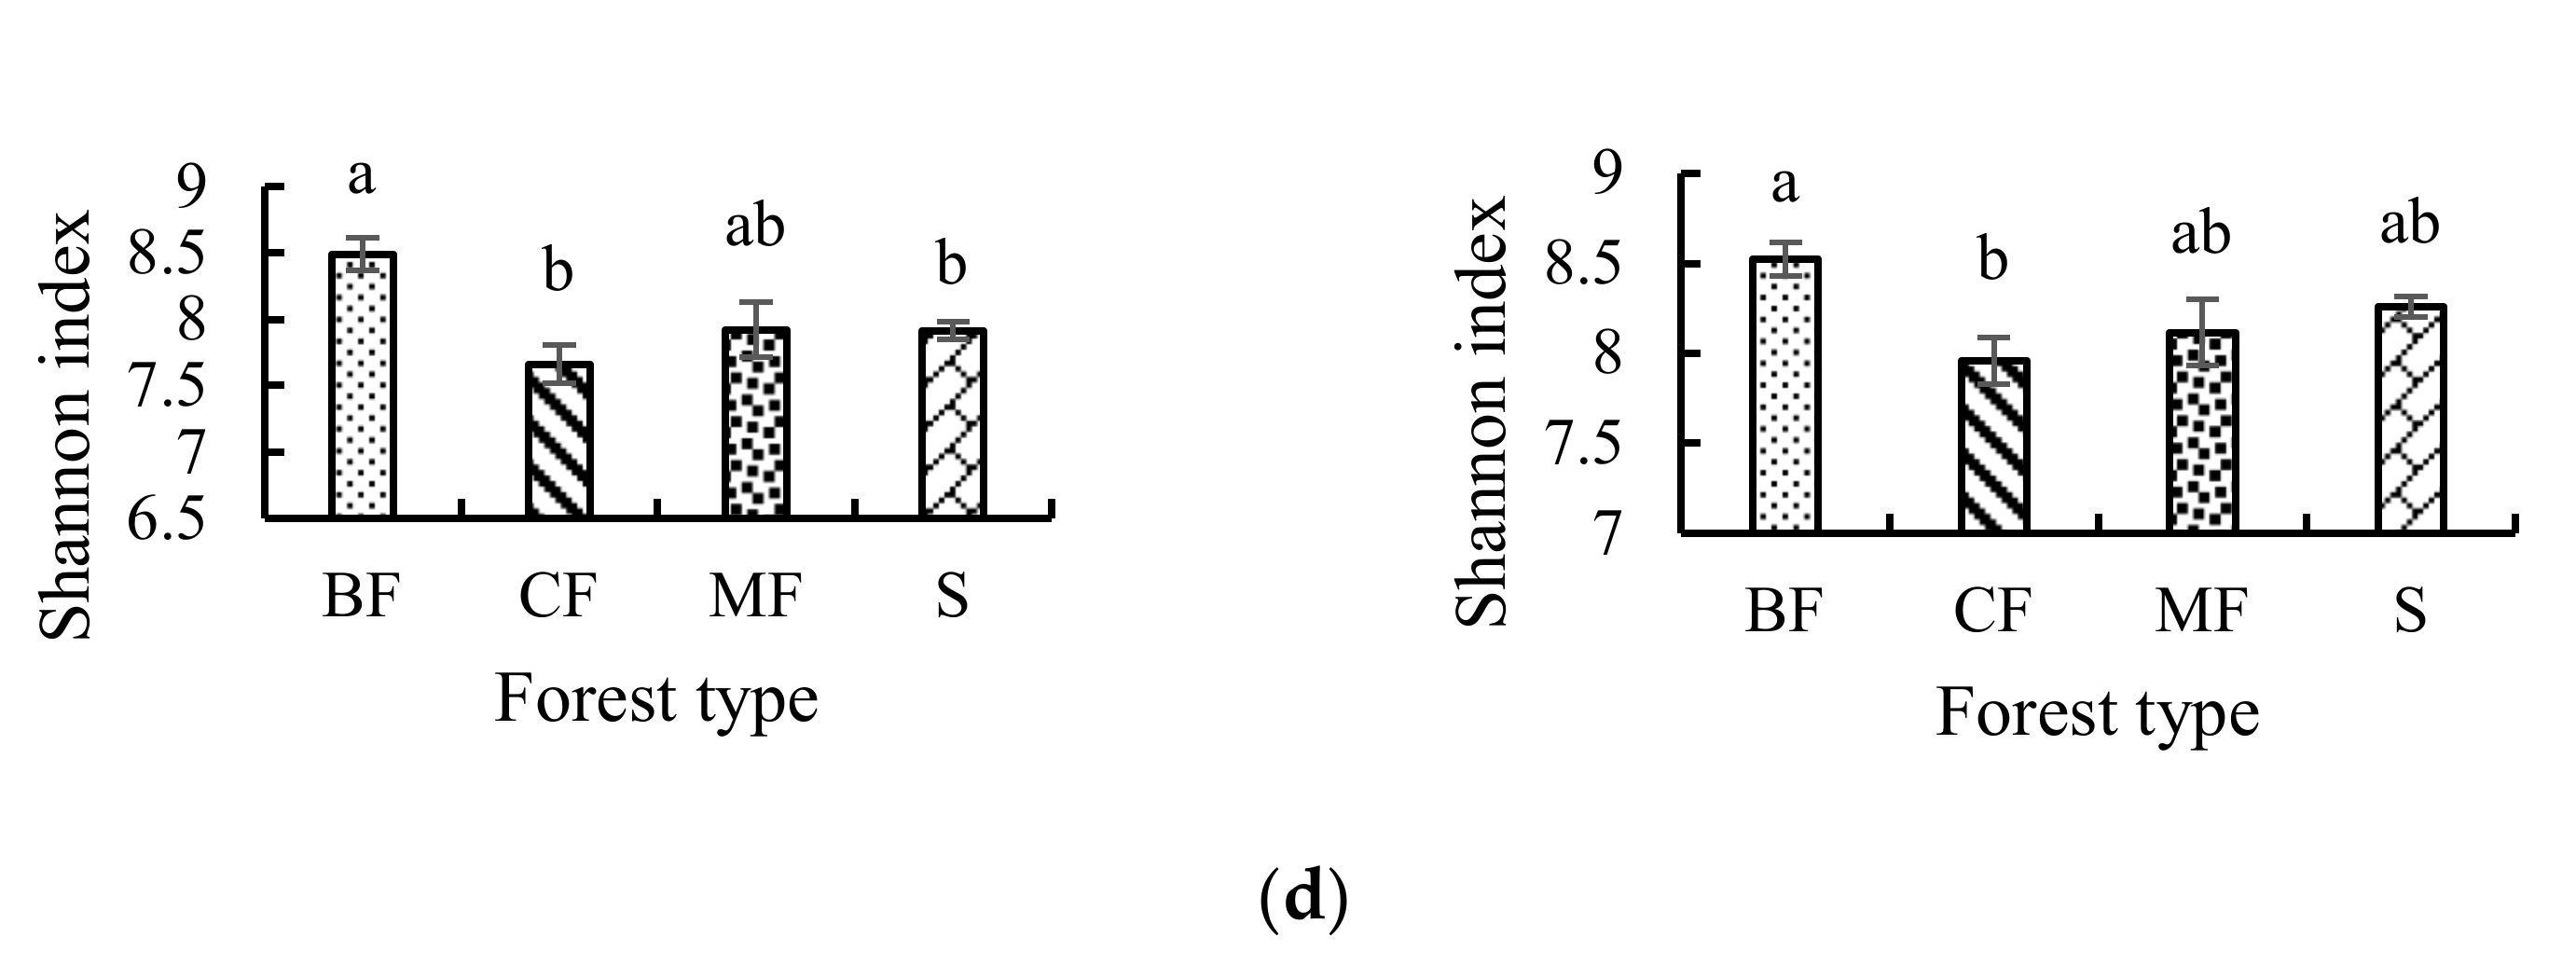
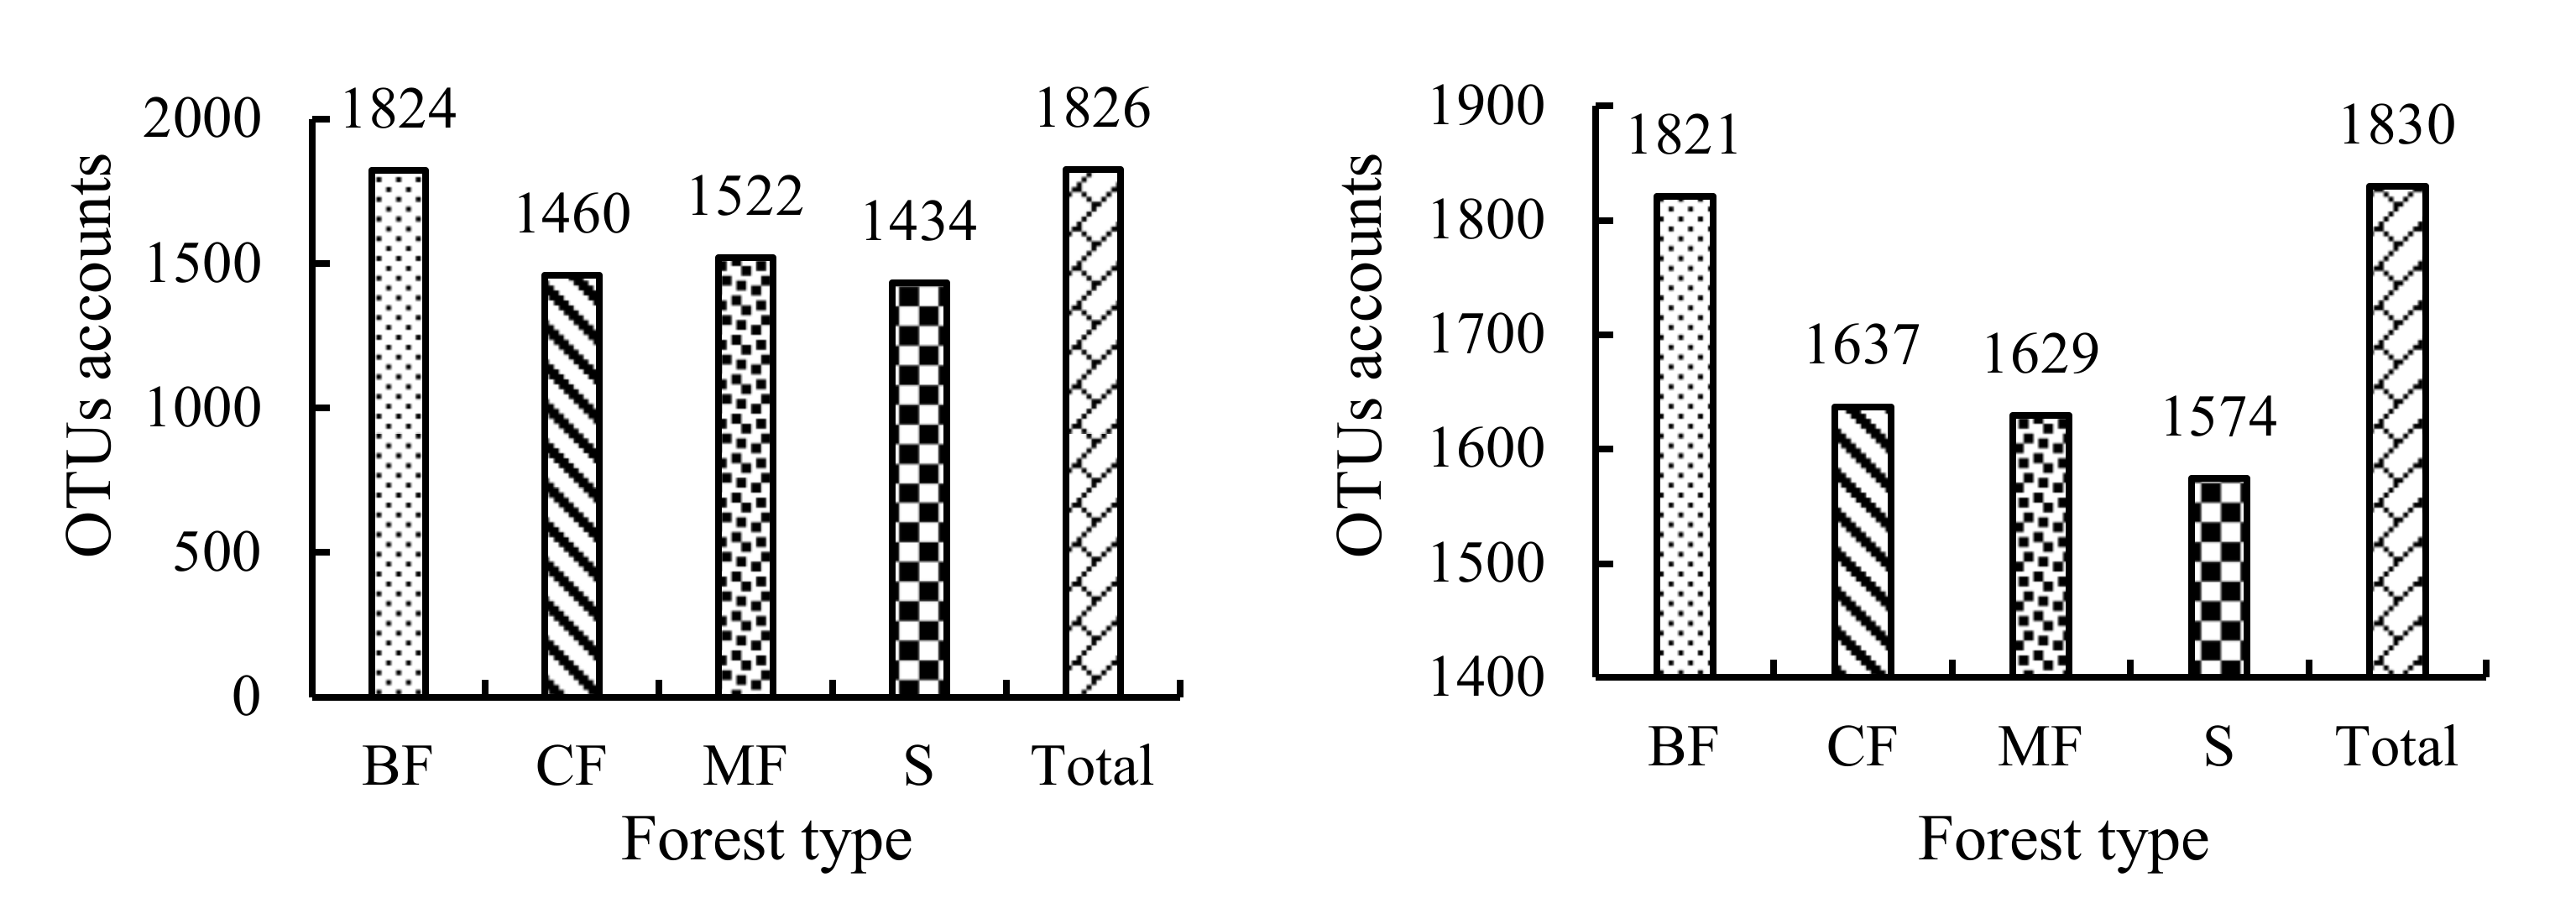
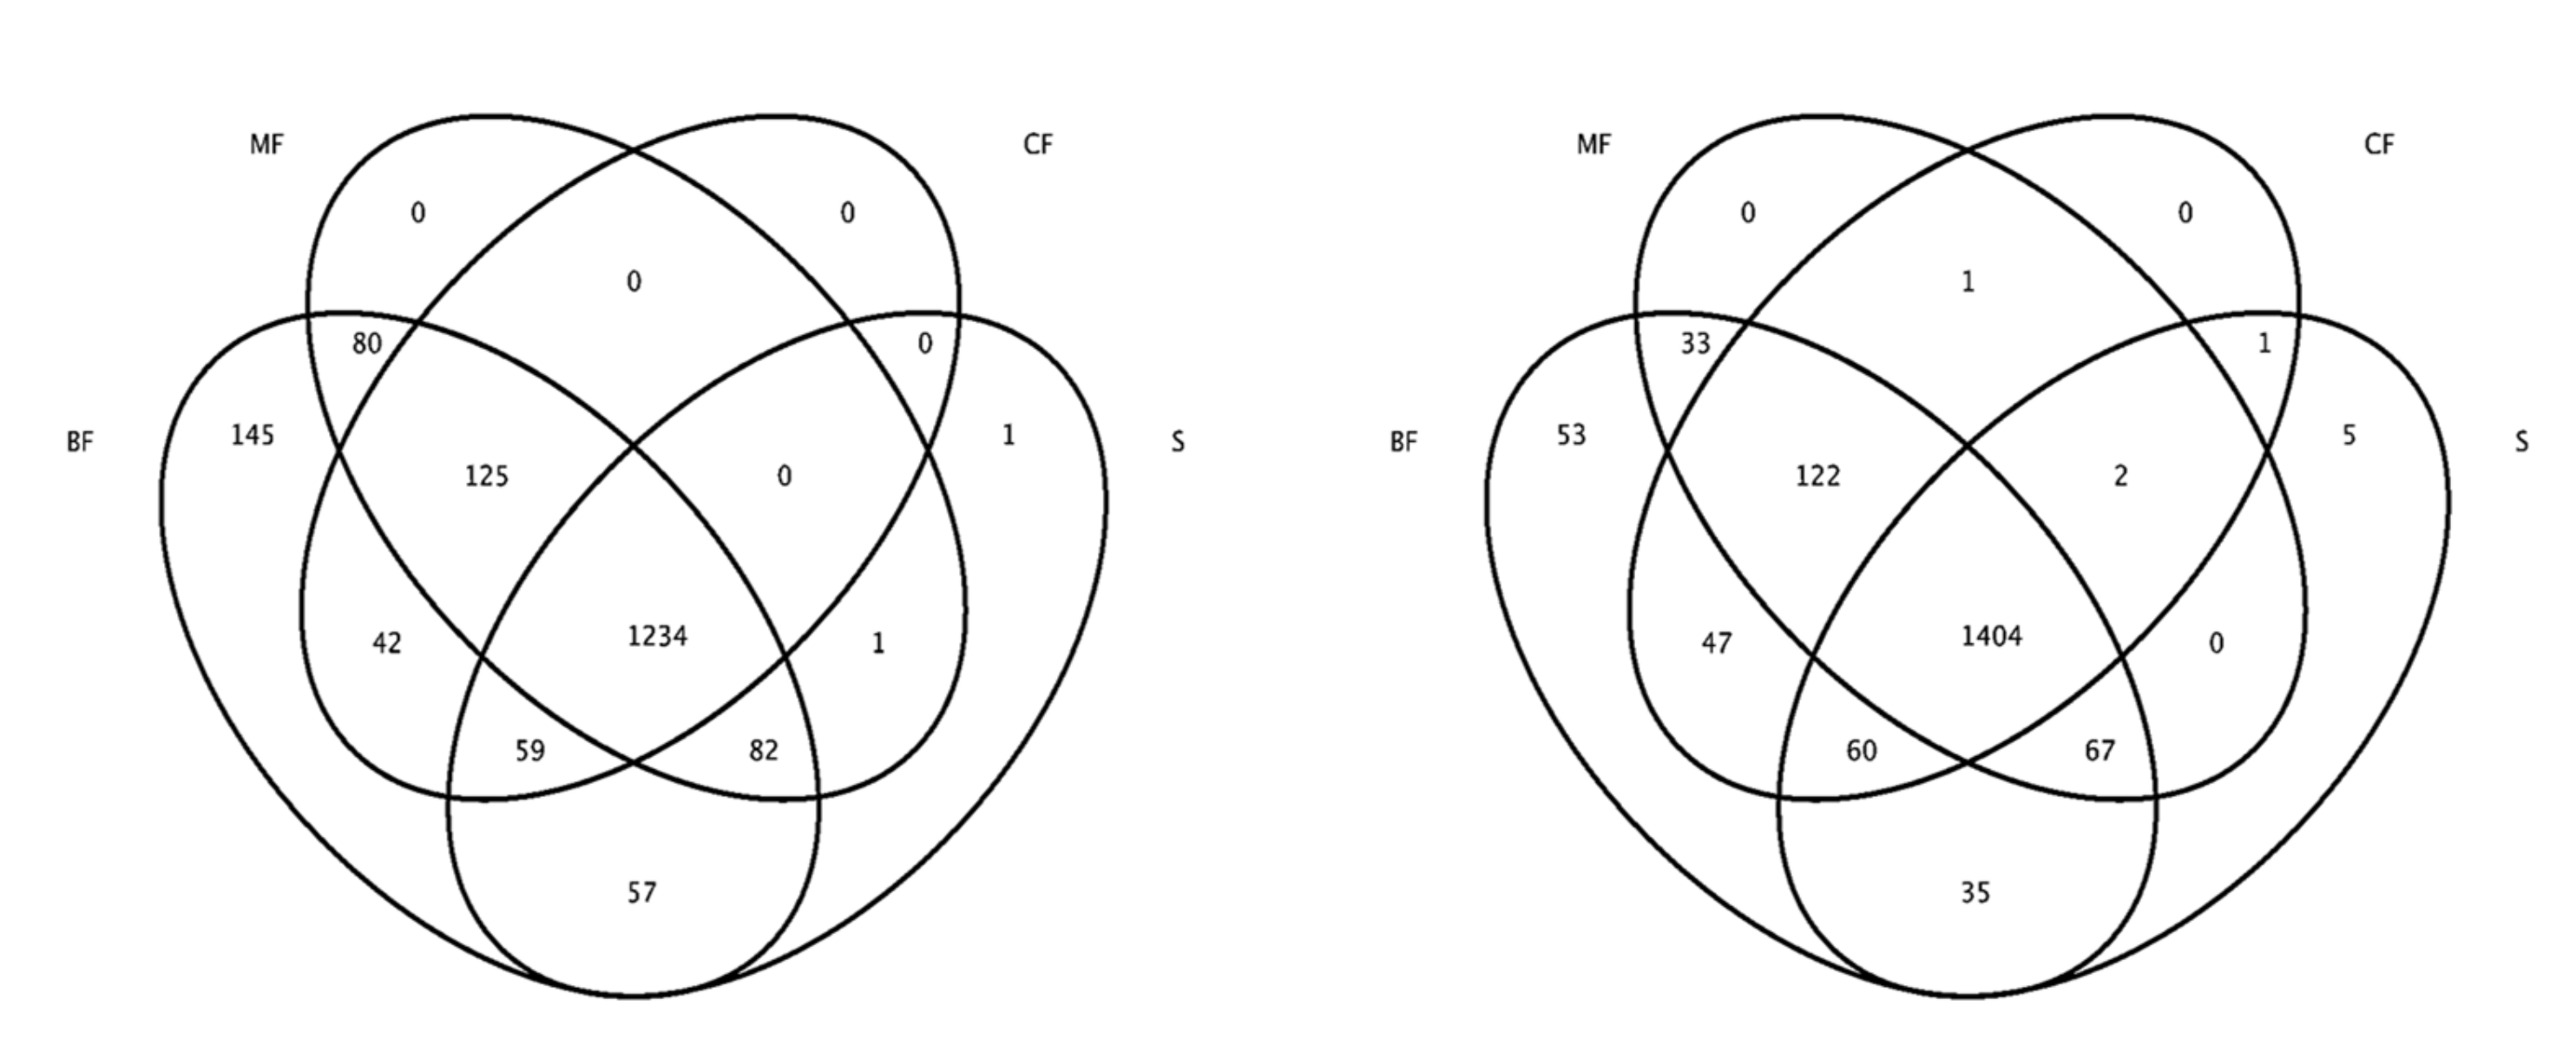
3.3.1. α-Diversity
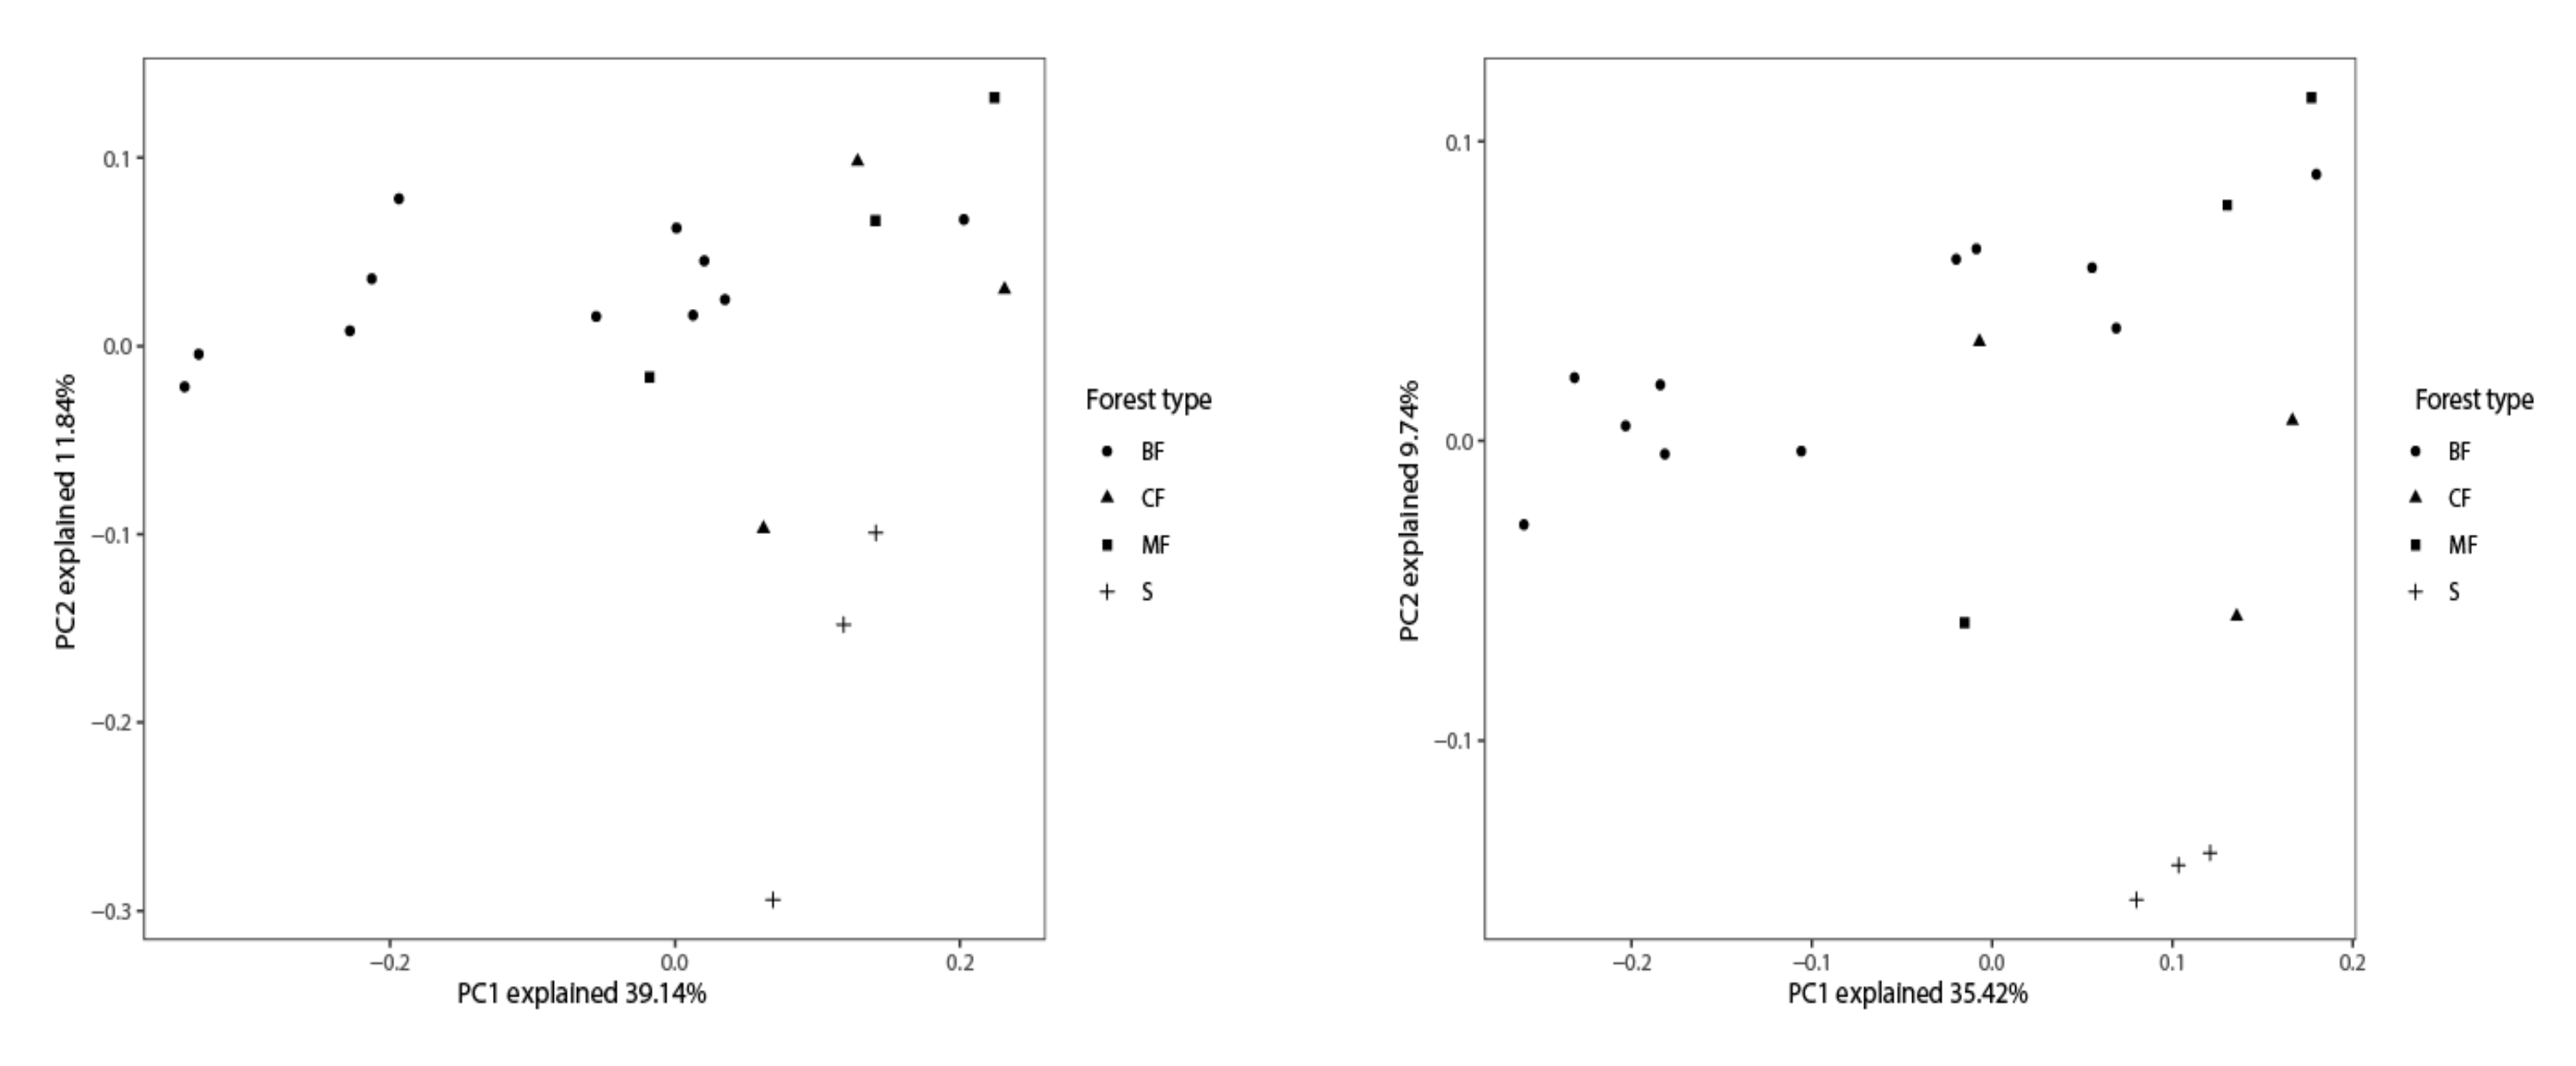
3.3.2. β-Diversity
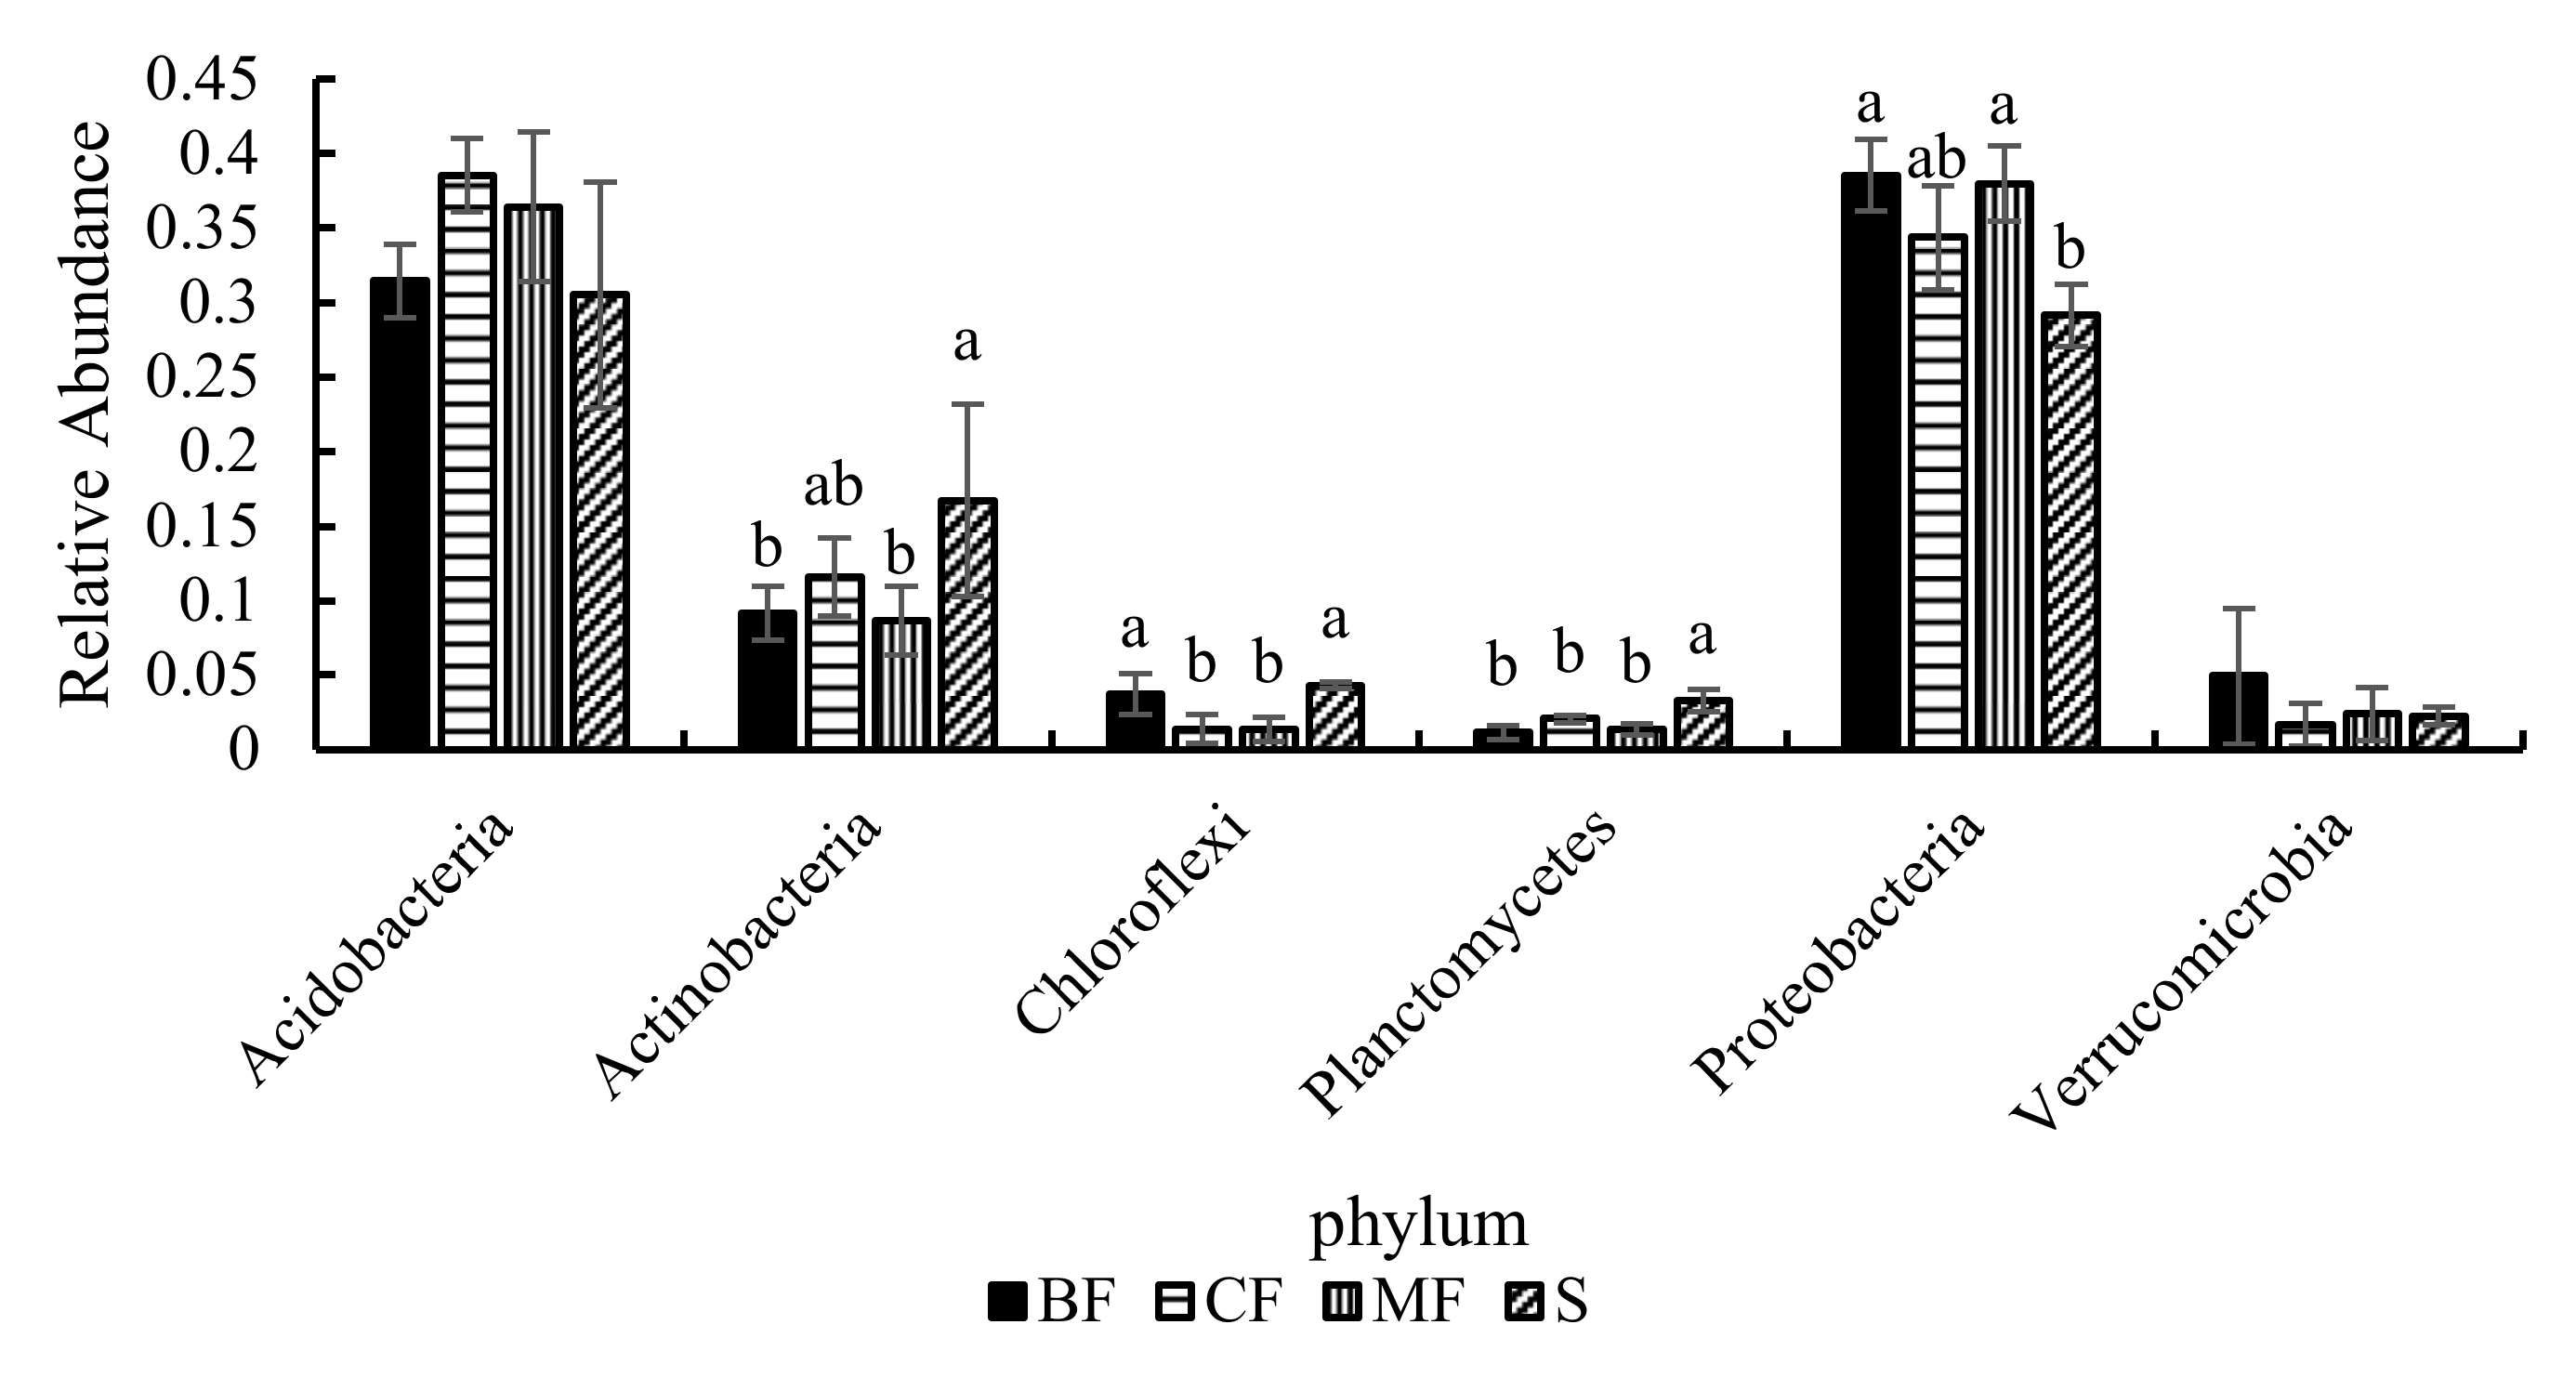
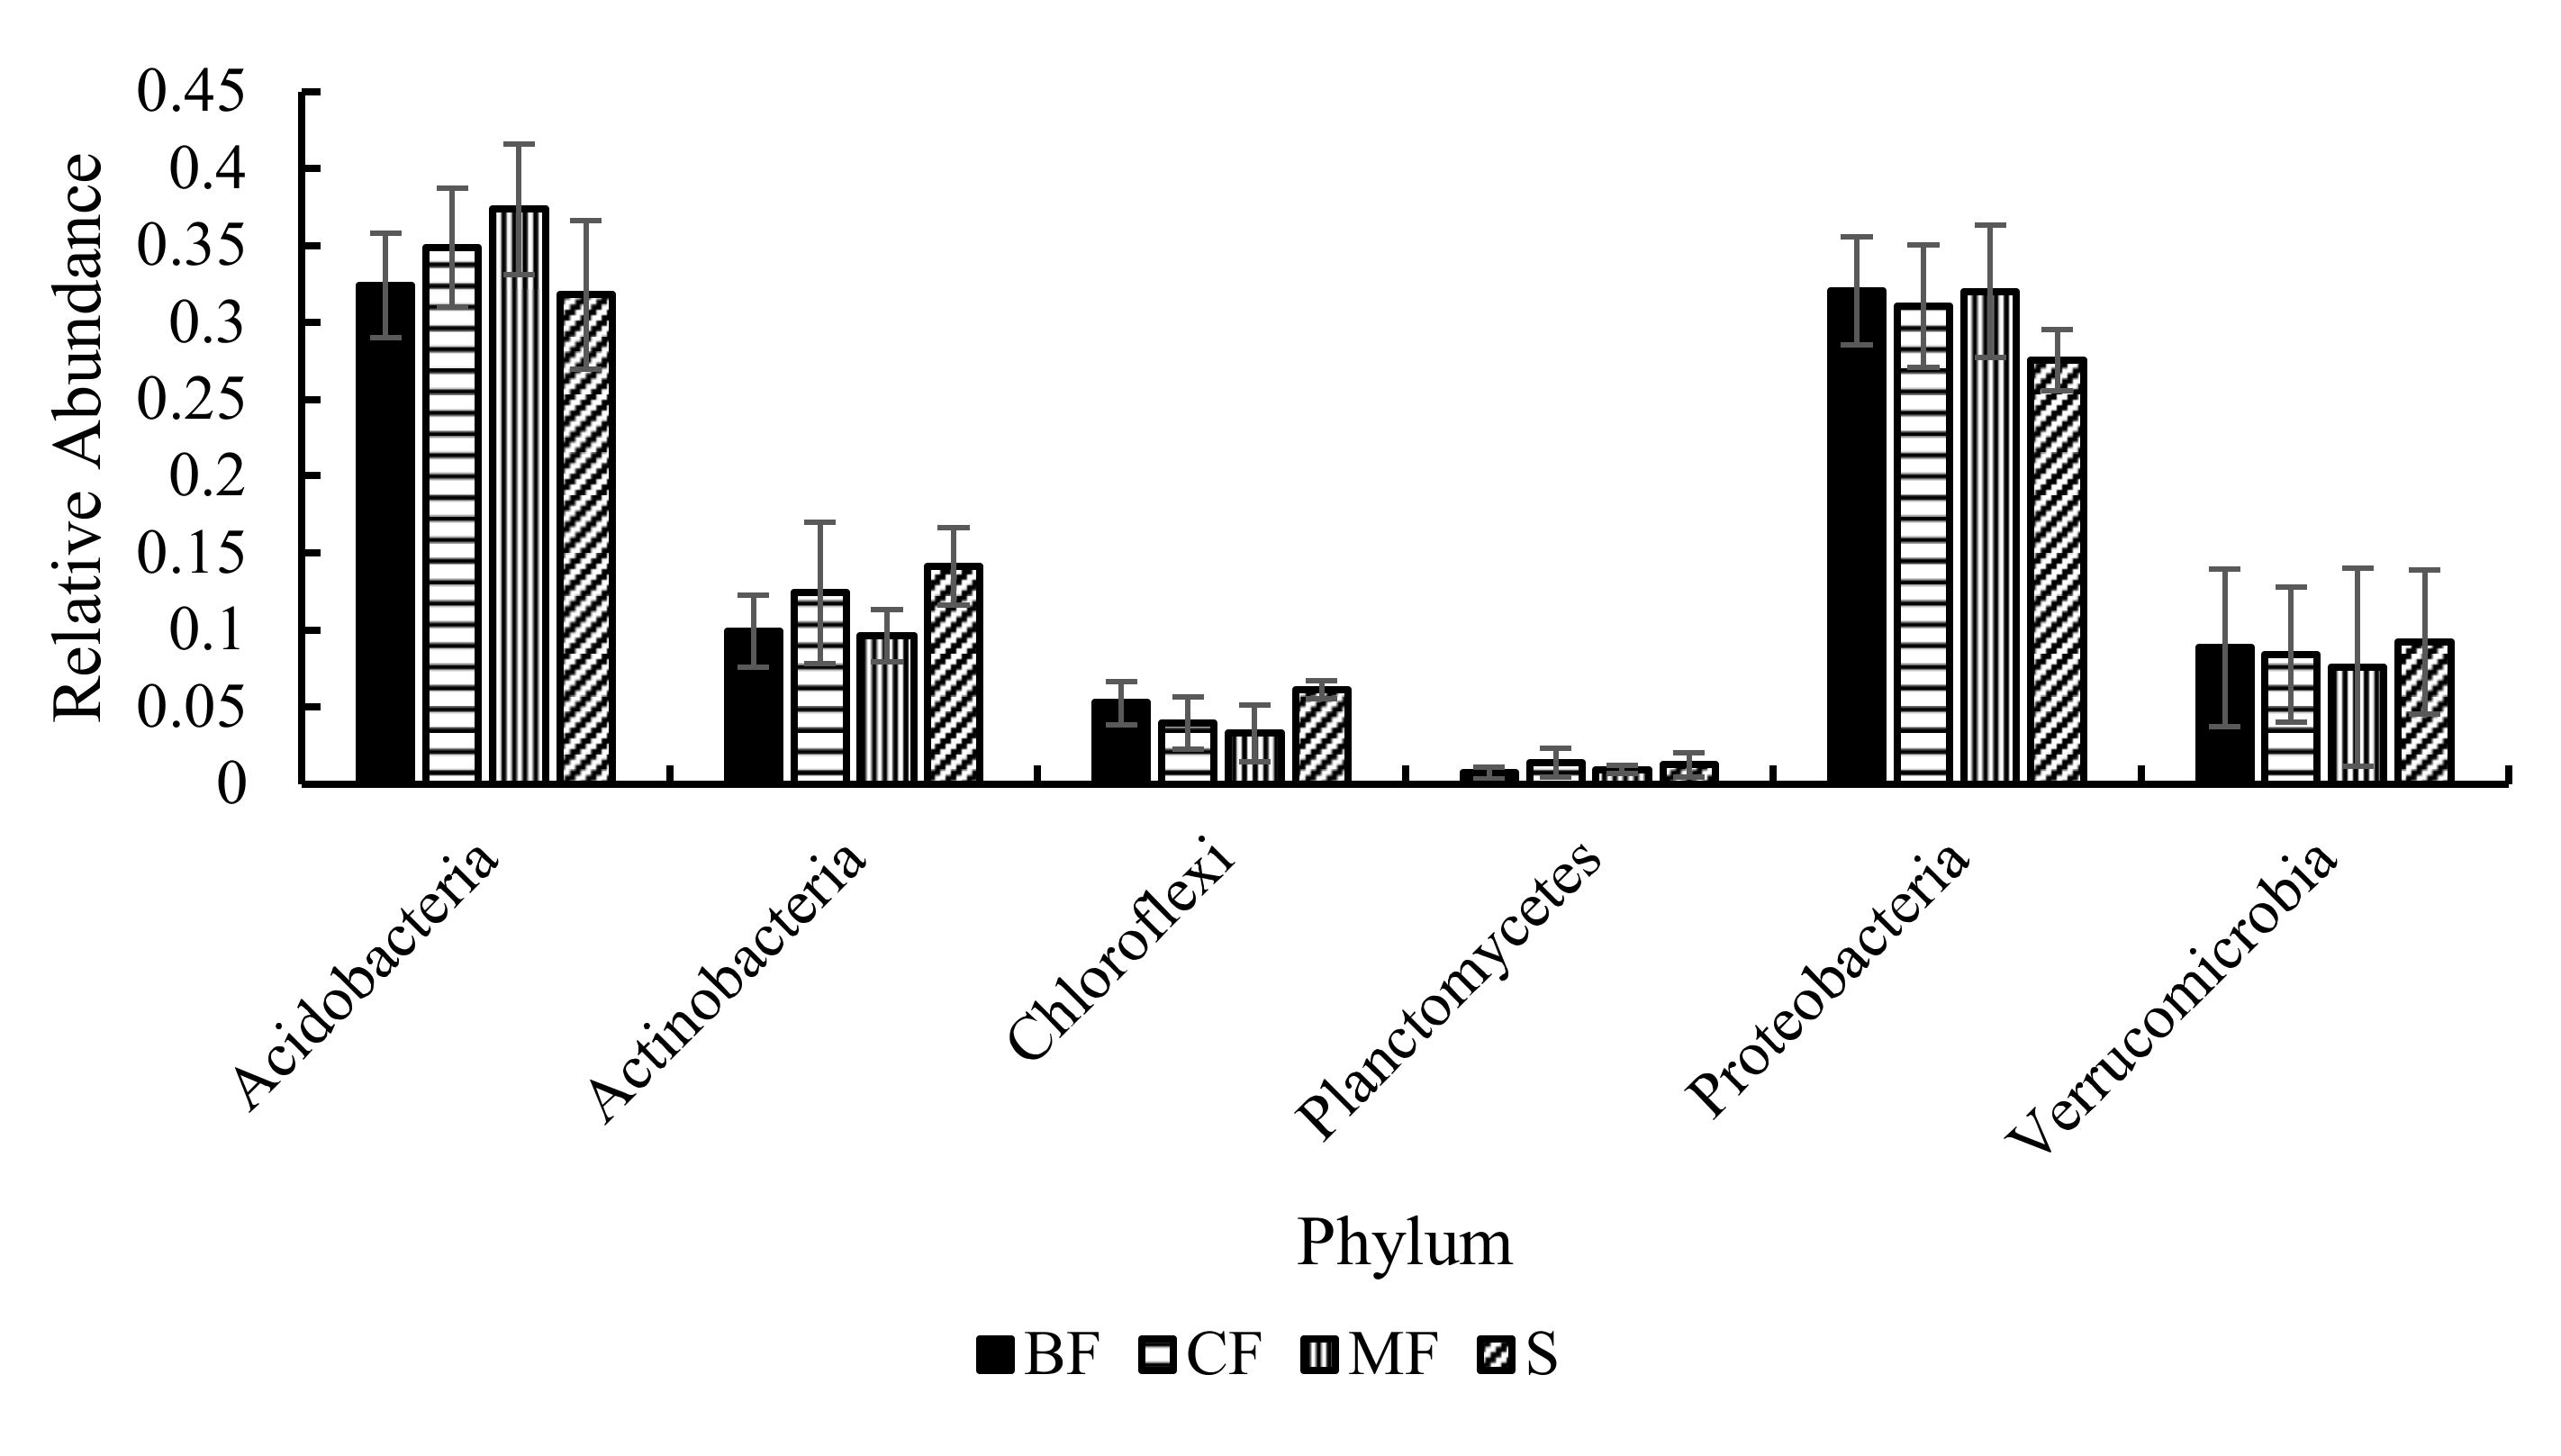
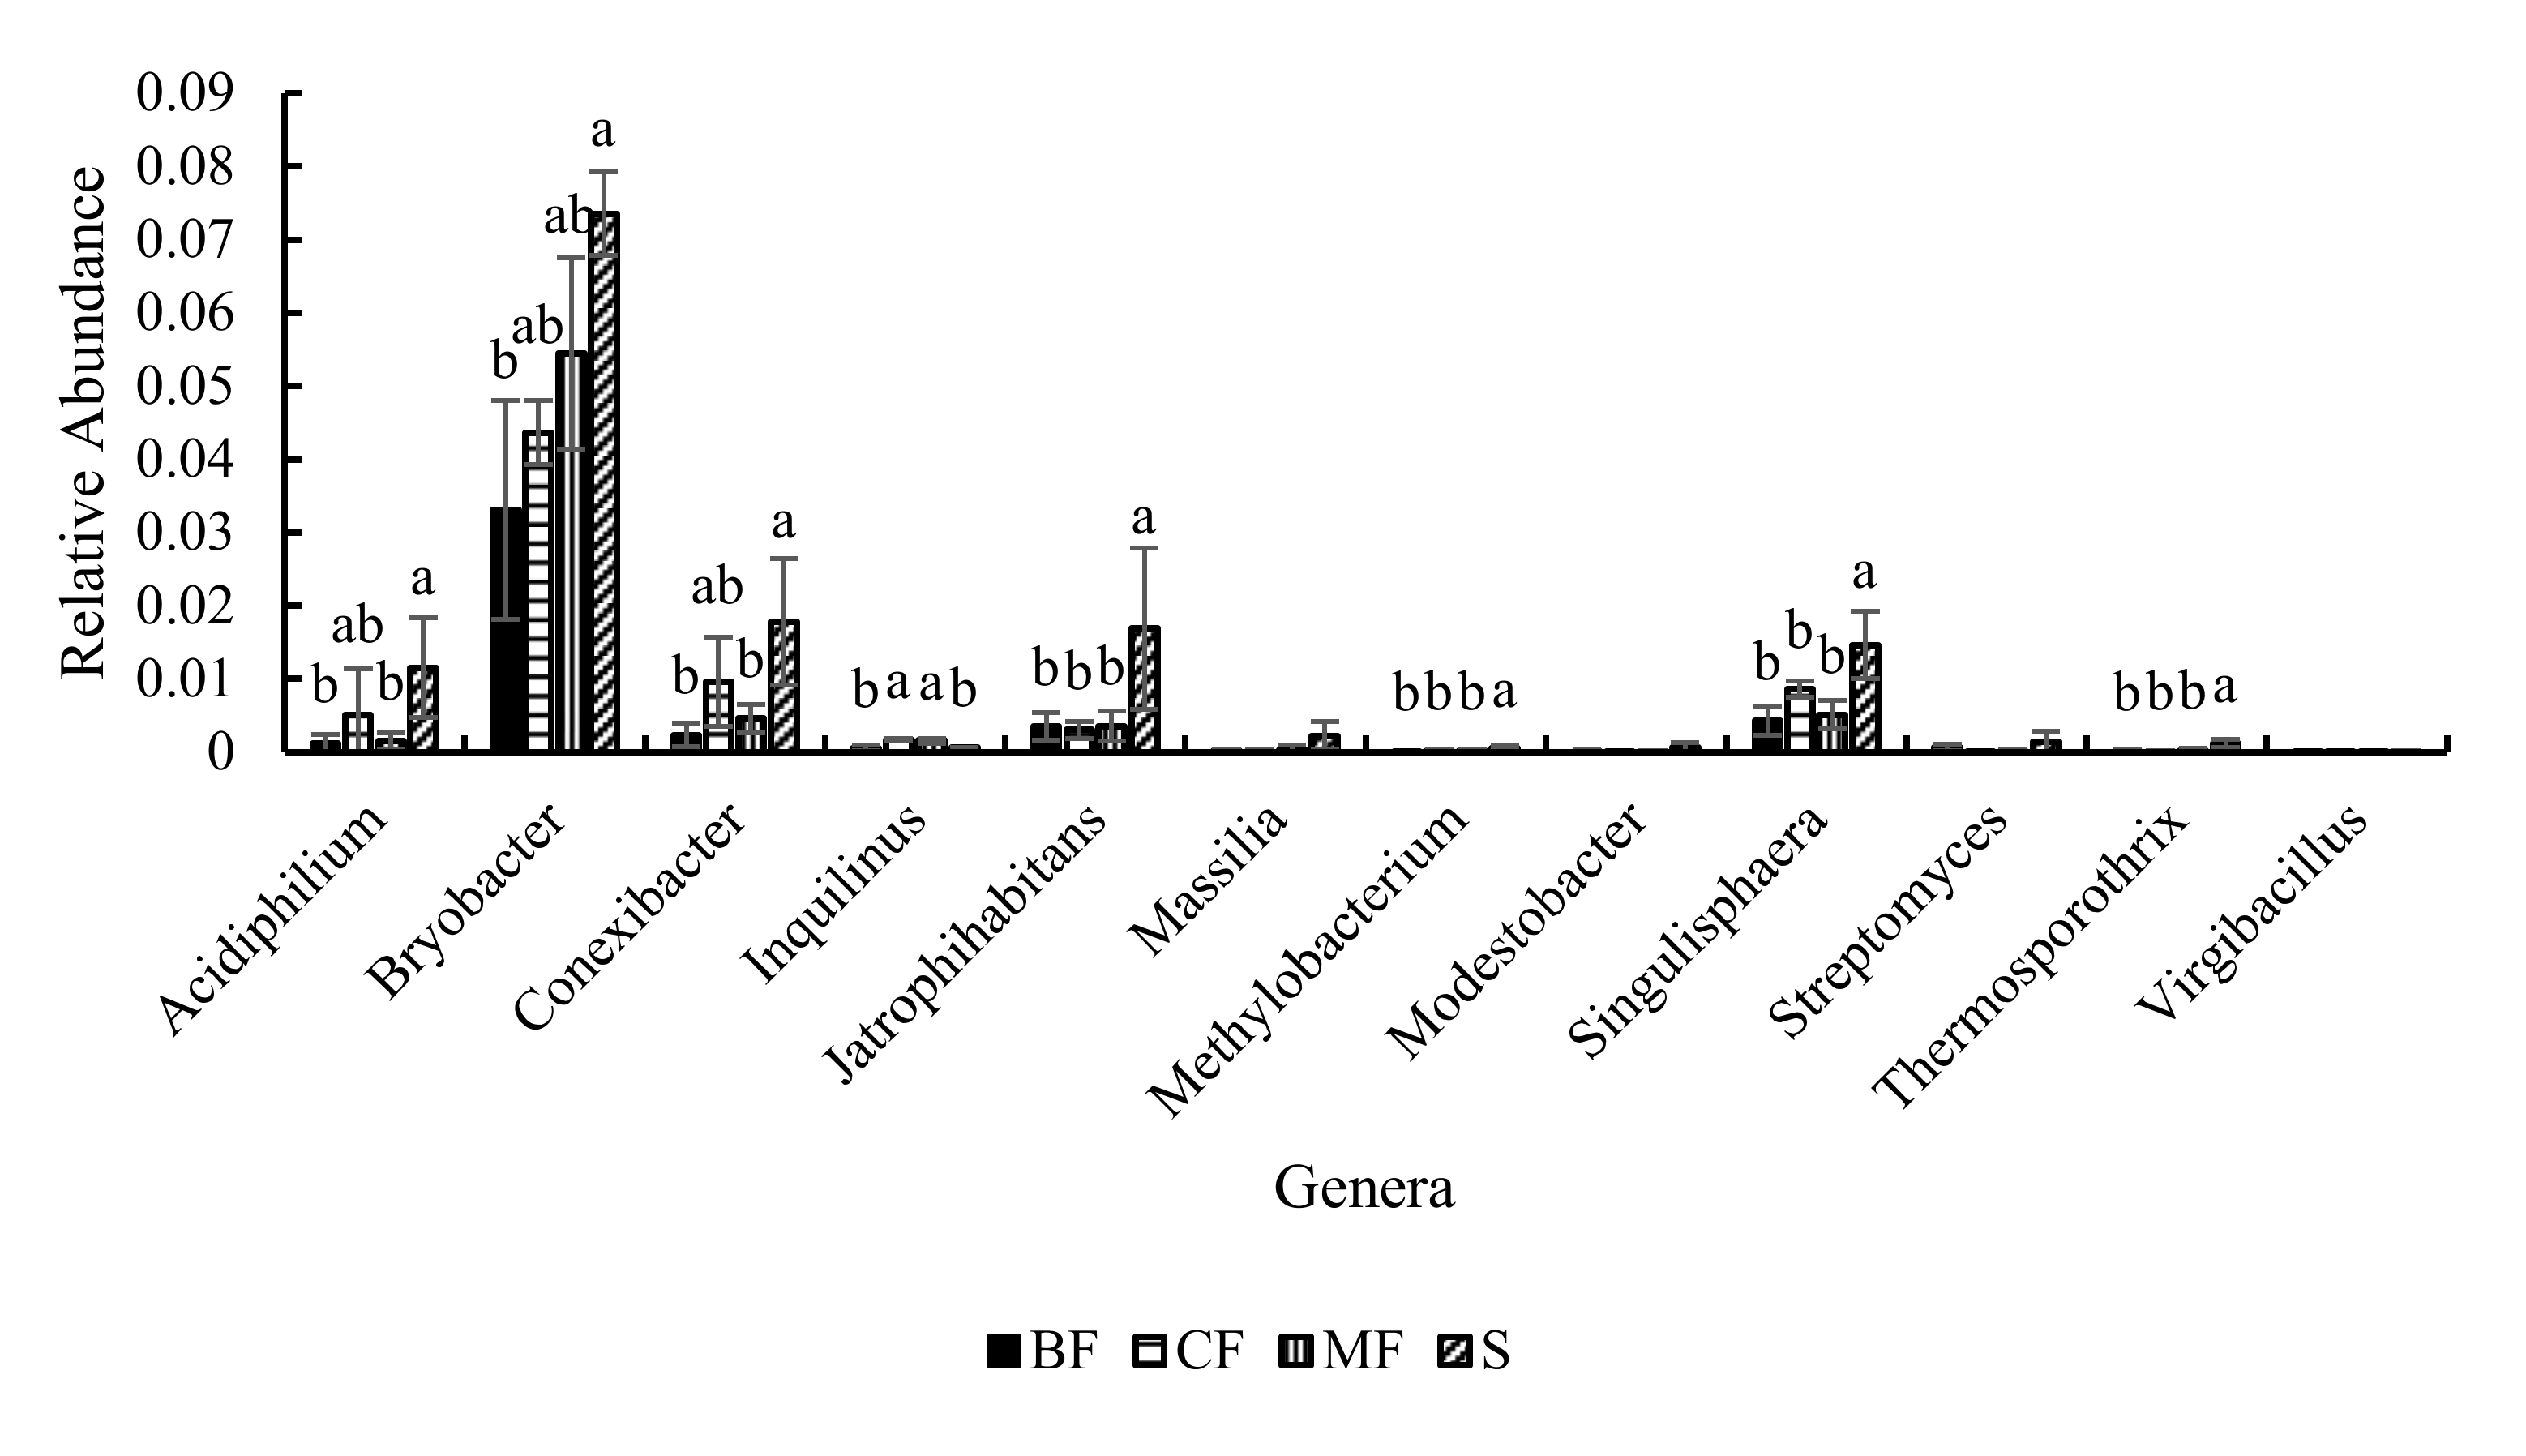
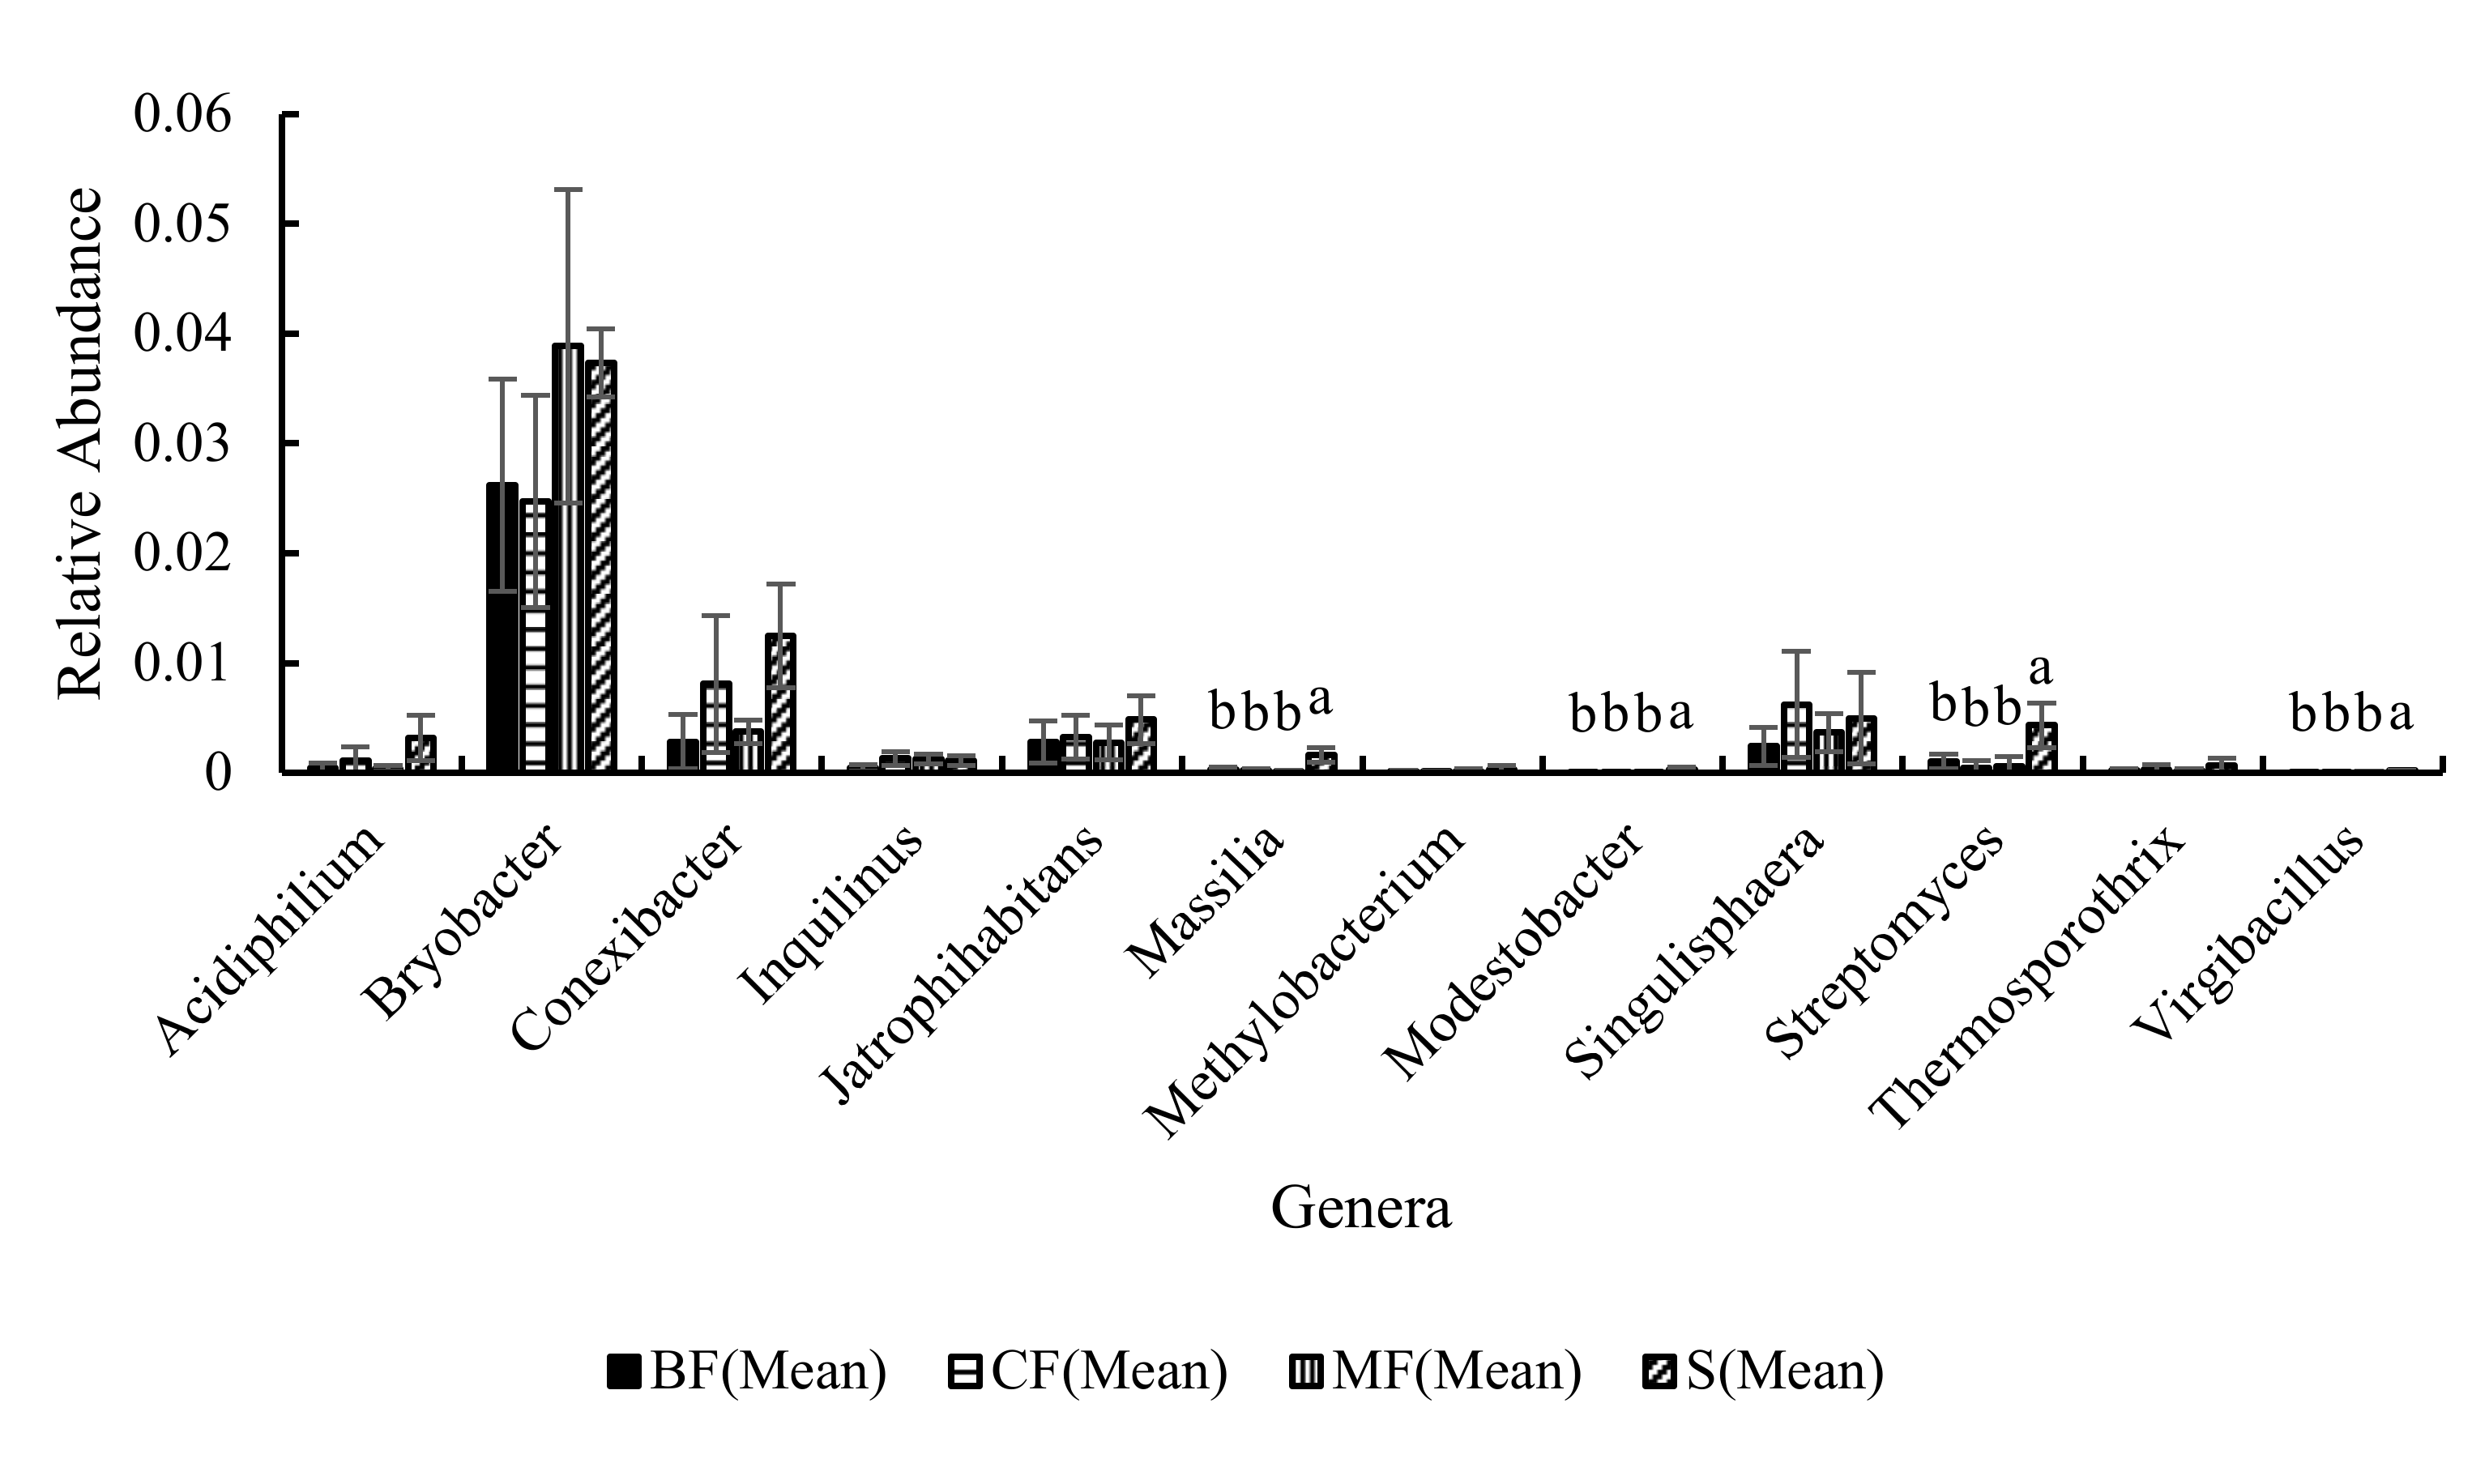
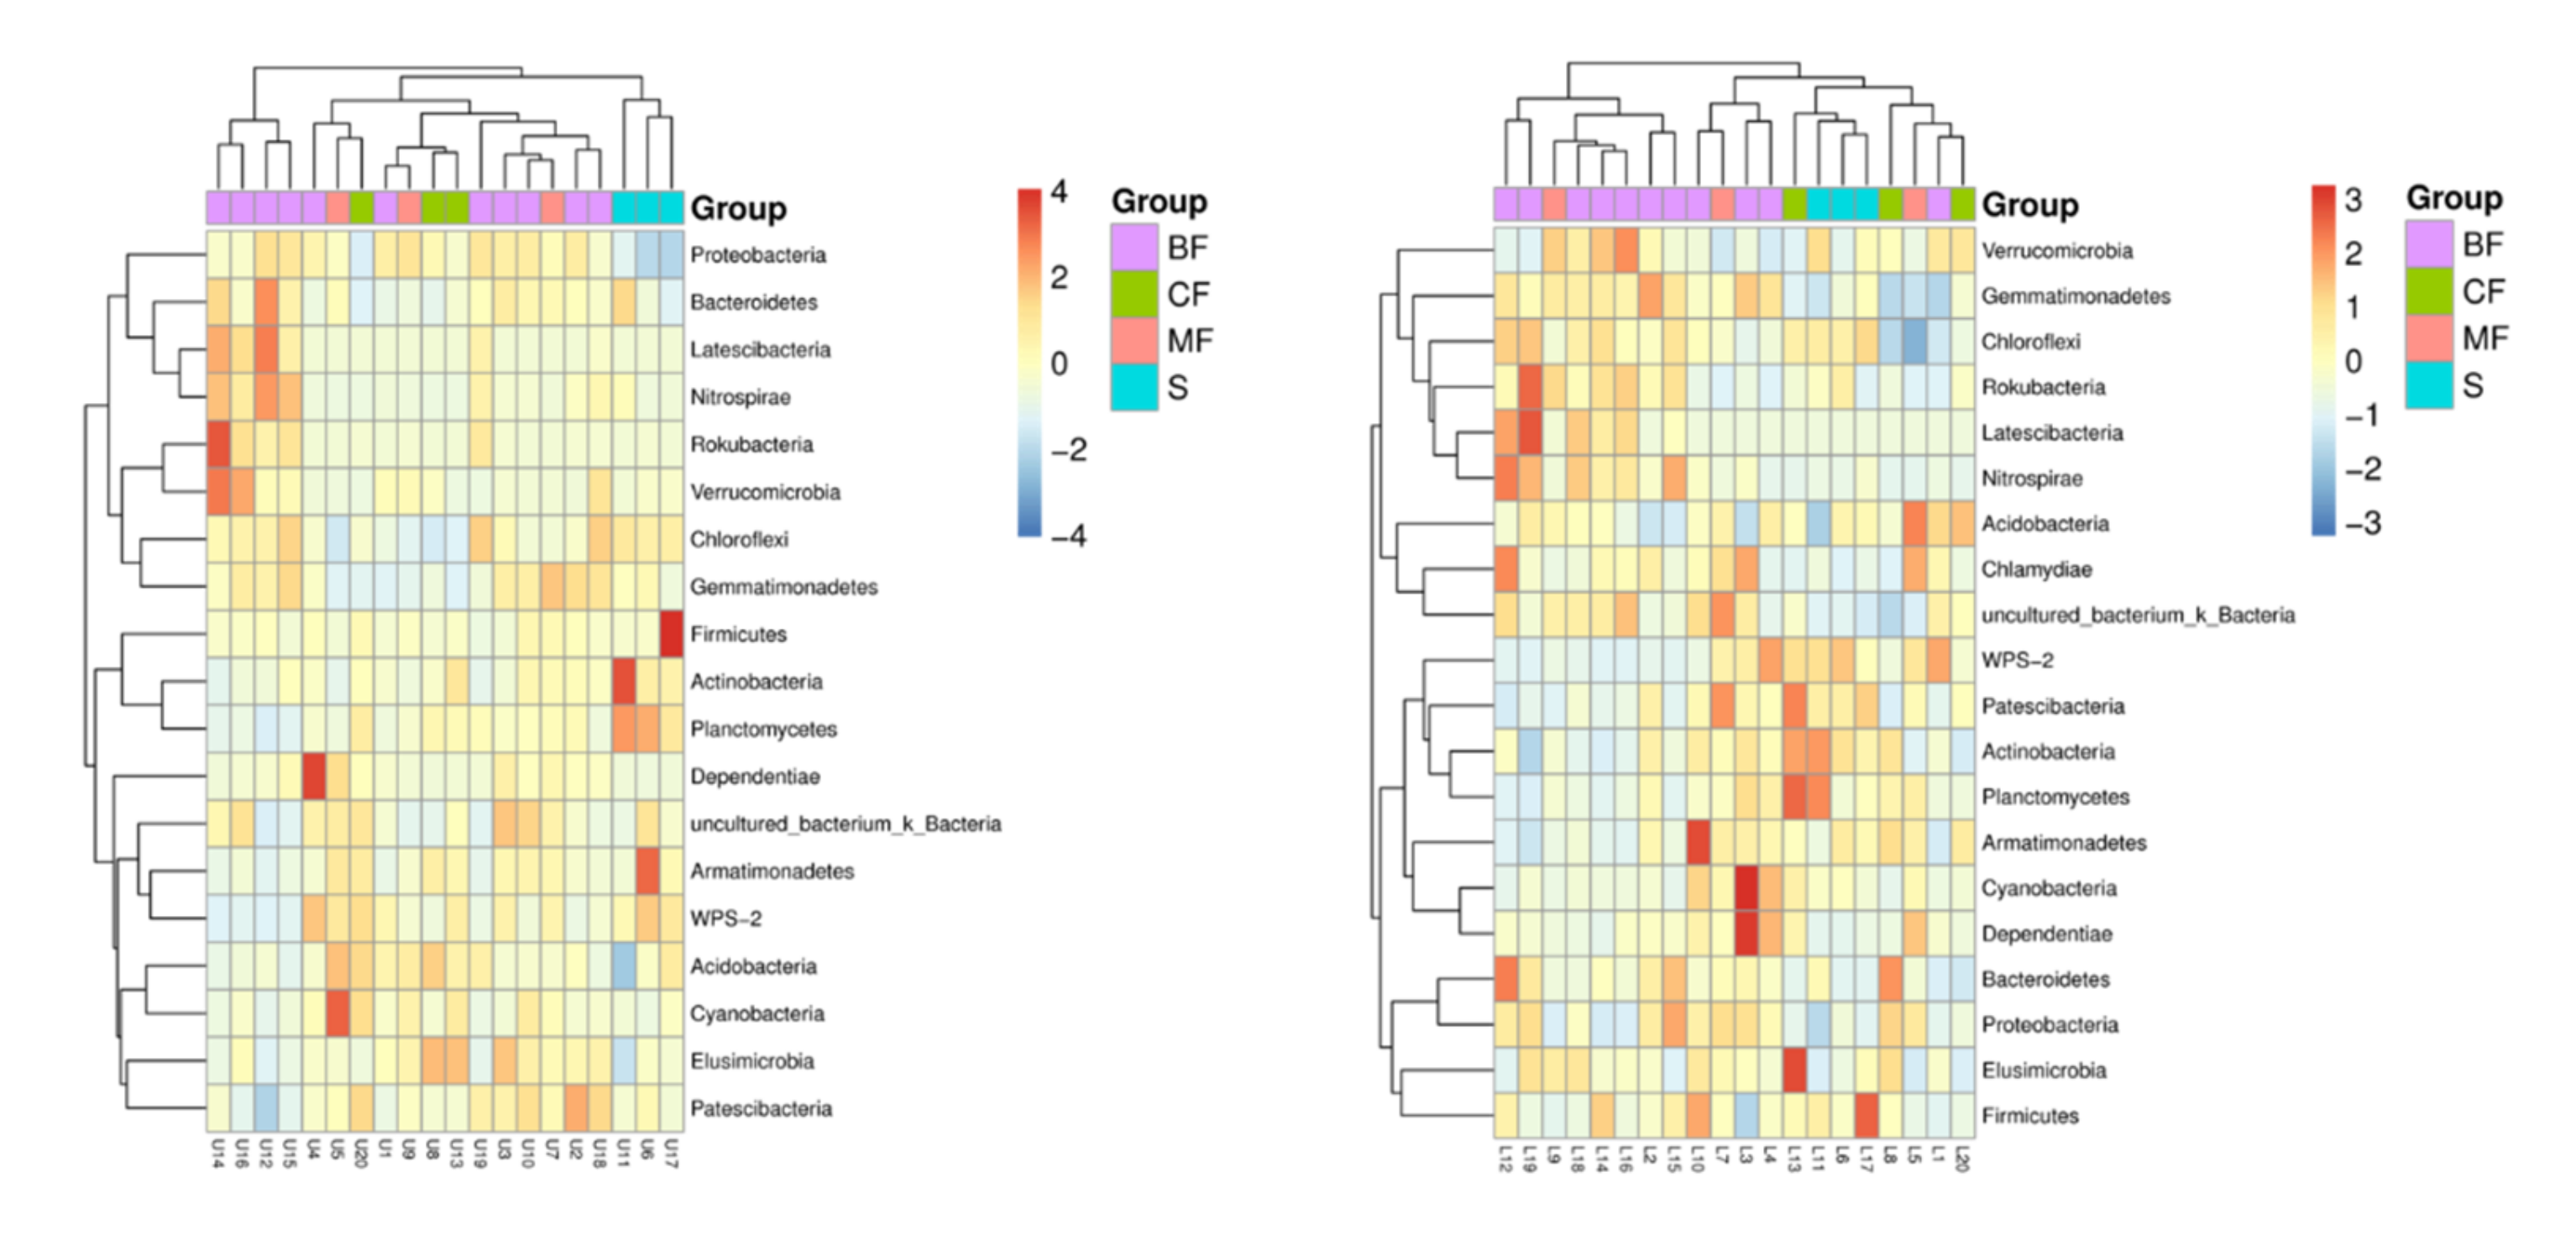
3.3.3. Community Structure
3.4. Soil Microbial Network
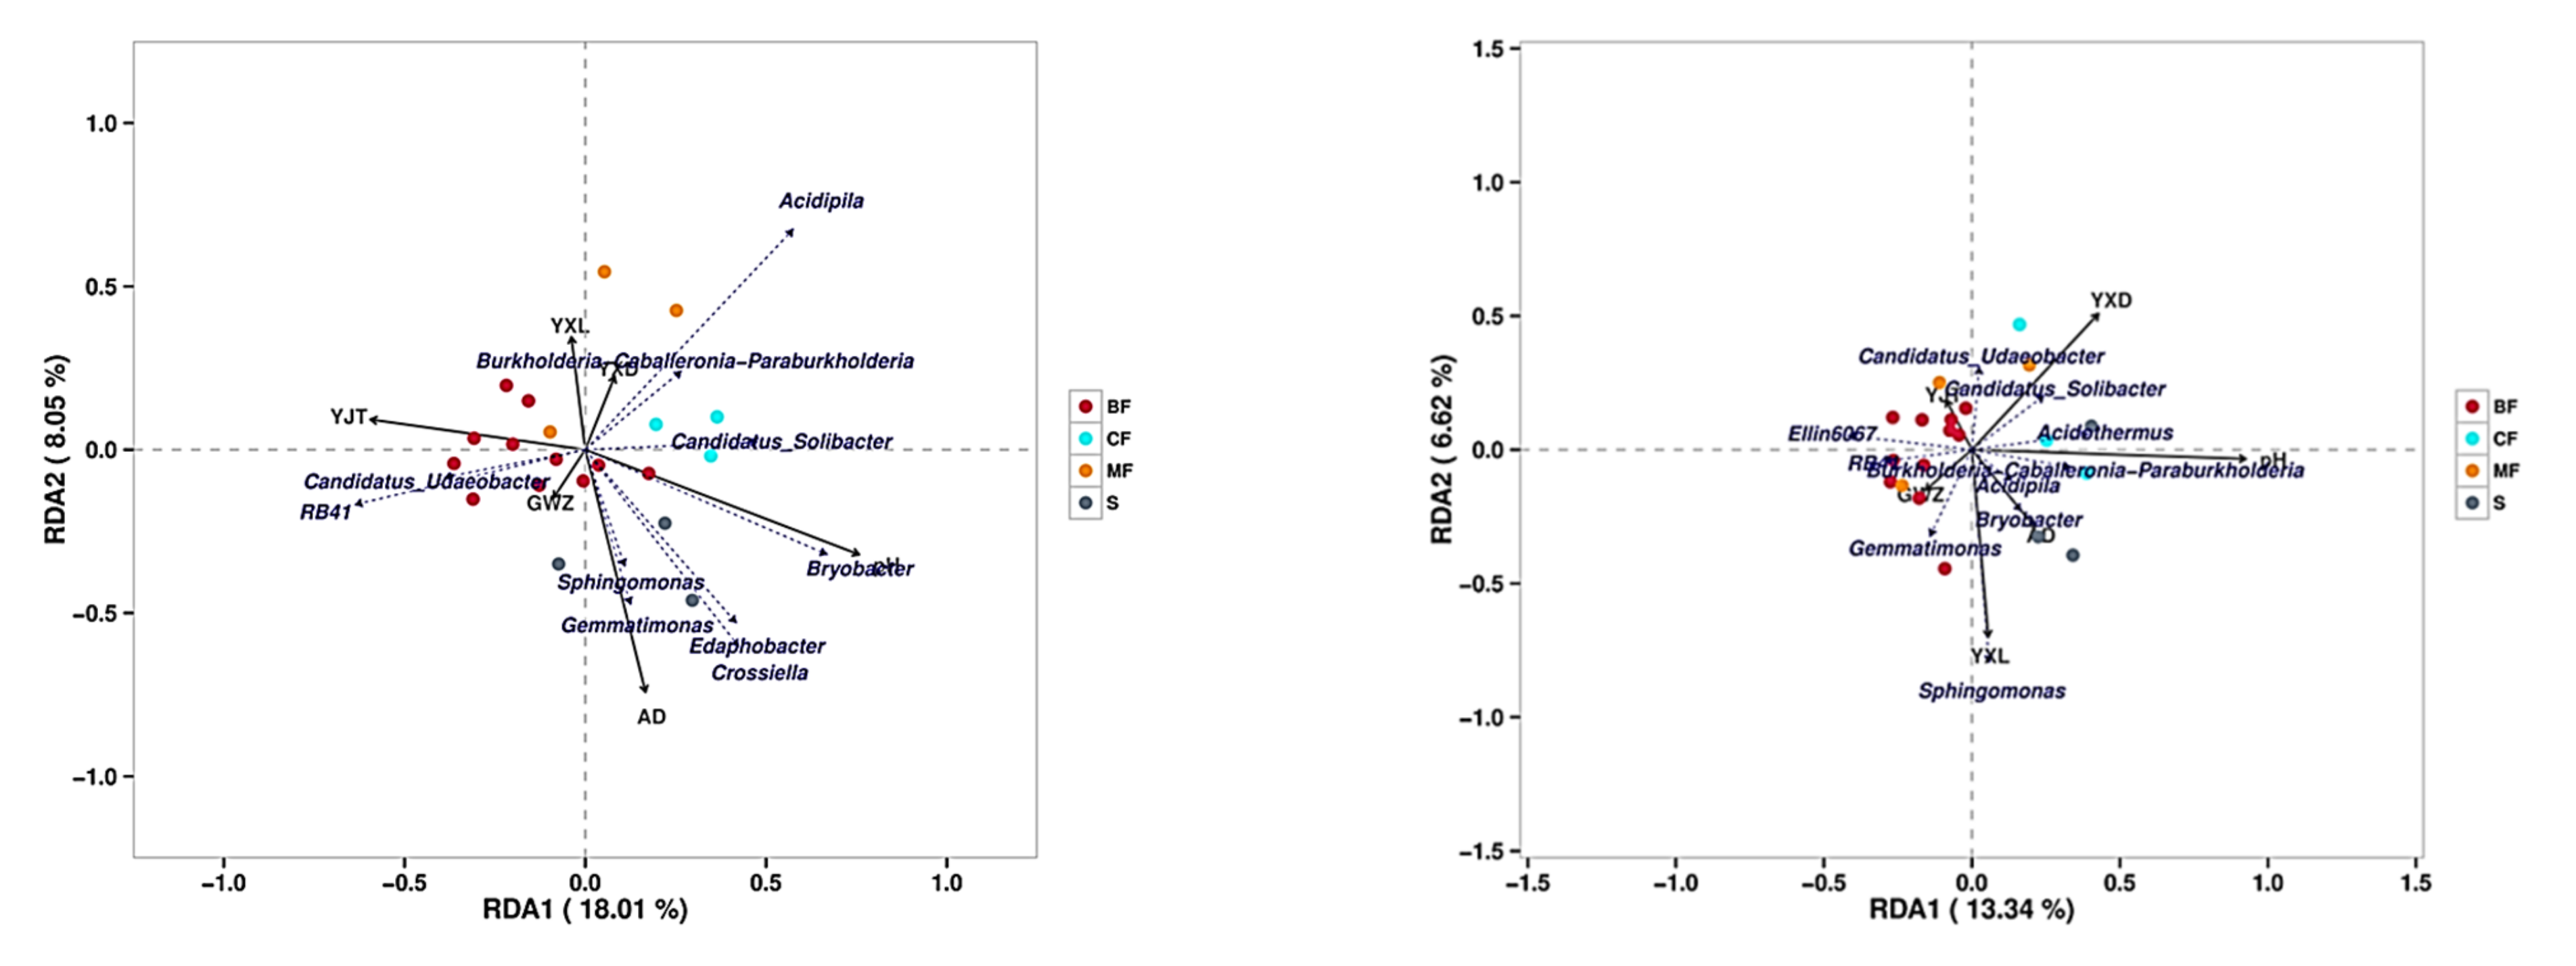
3.5. Relationship between Soil Properties and Bacterial Communities
4. Disscussion
4.1. Effects of Afforestation with Different Forest Types on Soil Nutrients
4.2. Effects of Different Forest Types Restoration on Soil Bacterial Community Structure
4.3. Changes of Intergeneric Association of Soil Bacterial Communities during Afforestation Restoration
4.4. Interpretation of Soil Nutrients Characteristics on the Change of Bacterial Community in Different Forest Types
5. Conclusions
Supplementary Materials
Author Contributions
Funding
Institutional Review Board Statement
Informed Consent Statement
Data Availability Statement
Conflicts of Interest
References
- Wang, Y.Q.; Jiang, M.Y.; Huang, Y.S.; Sheng, Z.Y.; Huang, X.; Lin, W.; Chen, Q.B.; Li, X.; Luo, Z.H.; Lv, B.Y. Physiological and Psychological Effects of Watching Videos of Different Durations Showing Urban Bamboo Forests with Varied Structures. Int. J. Environ. Res. Public Health 2020, 17, 3434. [Google Scholar] [CrossRef] [PubMed]
- Xue, C.Y.; Shao, C.F.; Gao, J.L. Ecological Compensation Strategy for SDG-Based Basin-Type National Parks: A Case Study of the Baoxing Giant Panda National Park. Int. J. Environ. Res. Public Health 2020, 17, 3908. [Google Scholar] [CrossRef] [PubMed]
- Fang, H.Y.; Fan, Z.M. Assessment of Soil Erosion at Multiple Spatial Scales Following Land Use Changes in 1980–2017 in the Black Soil Region, (NE) China. Int. J. Environ. Res. Public Health 2020, 17, 7378. [Google Scholar] [CrossRef] [PubMed]
- Phesheya, D.; Pauline, C.; Vincent, C. Overgrazing decreases soil organic carbon stocks the most under dry climates and low soil pH: A meta-analysis shows. Agric. Ecosyst. Environ. 2016, 221, 258–269. [Google Scholar] [CrossRef]
- Lal, R. Soil carbon sequestration impacts on global climate change and food security. Science 2004, 11, 1623–1627. [Google Scholar] [CrossRef] [Green Version]
- Vincent, C. Evidences of plants’ impact on land degradation and climate change: An urgent call for new multidisciplinary research. Geoderma 2021, 392, 114984. [Google Scholar] [CrossRef]
- Jobbágy, E.G.; Jackson, R.B. Patterns and mechanisms of soil acidification in the conversion of grasslands to forests. Biogeochemistry 2003, 64, 205–229. [Google Scholar] [CrossRef]
- Zhang, Y.; Yang, Q.S.; Ling, J.; Long, L.J.; Huang, H.; Yin, J.P.; Wu, M.L.; Tang, X.Y.; Lin, X.C.; Zhang, Y.Y.; et al. Shifting the microbiome of a coral holobiont and improving host physiology by inoculation with a potentially beneficial bacterial consortium. BMC Microbiol. 2021, 21, 130. [Google Scholar] [CrossRef]
- Zhang, B.H.; Hong, J.P.; Zhang, Q.; Jin, D.S.; Gao, C.H. Contrast in soil microbial metabolic functional diversity to fertilization and crop rotation under rhizosphere and non-rhizosphere in the coal gangue landfill reclamation area of Loess Hills. PLoS ONE 2020, 15, e0229341. [Google Scholar] [CrossRef]
- Zhao, D.; Xu, M.; Liu, G.; Ma, L.; Zhang, S.; Xiao, T.; Peng, G. Effect of vegetation type on microstructure of soil aggregates on the Loess Plateau, China. Agric. Ecosyst. Environ. 2017, 242, 1–8. [Google Scholar] [CrossRef]
- Hortal, S.; Lozano, Y.M.; Bastida, F.; Armas, C.; Moreno, J.L.; Garcia, C.; Pugnaire, F.I. Plant-plant competition outcomes are modulated by plant effects on the soil bacterial community. Sci. Rep. 2017, 7, 17756. [Google Scholar] [CrossRef]
- Yang, M.; Yang, D.; Yu, X. Soil microbial communities and enzyme activities in sea-buckthorn (Hippophae rhamnoides) plantation at different ages. PLoS ONE 2018, 13, e0190959. [Google Scholar] [CrossRef]
- Zhang, H.; Chu, L. Plant community structure, soil properties and microbial characteristics in revegetated quarries. Ecol. Eng. 2011, 37, 1104–1111. [Google Scholar] [CrossRef]
- Ma, R.T.; Hu, F.N.; Liu, J.F.; Wang, C.L.; Wang, Z.L.; Liu, G.; Zhao, S.W. Shifts in soil nutrient concentrations and C:N:P stoichiometry during long-term natural vegetation restoration. PeerJ 2020, 8, e8382, eCollection 2020. [Google Scholar] [CrossRef]
- Raiesi, F.; Kabiri, V. Identification of soil quality indicators for assessing the effect of different tillage practices through a soil quality index in a semi-arid environment. Ecol. Indic. 2016, 71, 198–207. [Google Scholar] [CrossRef]
- Bouffaud, M.L.; Kyselková, M.; Gouesnard, B.; Grundmann, G.; Muller, D.; Moënne-Loccoz, Y. Is diversification history of maize influencing selection of soil bacteria by roots? Mol. Ecol. 2012, 21, 195–206. [Google Scholar] [CrossRef]
- Tang, A.; Haruna, A.O.; Majid, N.M.A.; Jallo, M.B. Potential PGPR Properties of Cellulolytic, Nitrogen-Fixing, Phosphate-Solubilizing Bacteria in Rehabilitated Tropical Forest Soil. Microorganisms 2020, 8, 442. [Google Scholar] [CrossRef] [Green Version]
- Albornoz, F.E.; Teste, F.P.; Lambers, H.; Bunce, M.; Murray, D.C.; White, N.E.; Laliberte, E. Changes in ectomycorrhizal fungal community composition and declining diversity along a million years soil chronosequence. Mol. Ecol. 2016, 25, 4919–4929. [Google Scholar] [CrossRef]
- Wu, S.H.; Huang, B.H.; Gao, J.; Wang, S.Q.; Liao, P.C. The effects of afforestation on soil bacterial communities in temperate grassland are modulated by soil chemical properties. PeerJ 2019, 7, e6147. [Google Scholar] [CrossRef]
- Lauber, C.L.; Hamady, M.; Knight, R.; Fierer, N. Pyrosequencing-based assessment of soil pH as a predictor of soil bacterial community structure at the continental scale. Appl. Environ. Microbiol. 2009, 75, 5111–5120. [Google Scholar] [CrossRef] [Green Version]
- Guo, S.J.; Han, X.H.; Li, H.; Wang, T.; Tong, X.G.; Ren, G.X.; Feng, Y.Z.; Yang, G.H. Evaluation of soil quality along two revegetation chronosequences on the Loess Hilly Region of China. Sci. Total Environ. 2018, 633, 808–815. [Google Scholar] [CrossRef] [PubMed]
- Zong, M.J.; Han, X.M.; Zhang, Z.G.; Zhang, X.Q.; Wang, R.Q. DNA recovery from soil in restoration area and indicated biodiversity. Ekológia 2007, 26, 381–389. [Google Scholar]
- Zhou, J.; Guo, W.H.; Zong, M.J.; Han, X.M.; Wang, R.Q. Analysis of the soil cultivable bacterial diversities under different vegetations of Fanggan villlege. J. Shandon Univ. 2006, 41, 161–167. (In Chinese) [Google Scholar]
- Ministry of Agriculture, PRC. Soil Testing-Method for Determination of Available Phosphorus in Soil; NY/T 1121.7-2014; Ministry of Agriculture, PRC: Beijing, China, 2012. (In Chinese)
- Ministry of Environmental Protection, PRC. Soil Determination of Organic Carbon-Potassium Dichromate Oxidation Spectrophotometric Method; HJ615-2011; Ministry of Environmental Protection, PRC: Beijing, China, 2011. (In Chinese)
- Ministry of Environmental Protection, PRC. Soil-Determination of Dry Matter and Water Content-Gravimetric Method; HJ613-2011; Ministry of Environmental Protection, PRC: Beijing, China, 2011. (In Chinese)
- Ministry of Environmental Protection, PRC. Soil-Determination of Ammonium, Nitrite and Nitrate by Extraction with Potassium Chloride Solution-Spectrophotometric Methods; HJ634-2012; Ministry of Environmental Protection, PRC: Beijing, China, 2012. (In Chinese)
- GB/T 32737-2016; Determination of Nitrate Nitrogen in Soil-Ultraviolet Spectrophotometry Method. Standardization Administration of China: Beijing, China, 2016. (In Chinese)
- Zhang, X.; Li, Z.; Tang, Z.; Zeng, G.; Huang, J.; Guo, W.; Chen, X.; Hirsh, A. Effects of water erosion on the redistribution of soil organic carbon in the hilly red soil region of southern China. Geomorphology 2013, 197, 137–144. [Google Scholar] [CrossRef]
- Bichel, A.; Oelbermann, M.; Voroney, P.; Echarte, L. Sequestration of native soil organic carbon and residue carbon in complex agroecosystems. Carbon Manag. 2016, 7, 10. [Google Scholar] [CrossRef]
- Liu, Y.L.; Zhu, G.Y.; Deng, L.; Chen, L.; Shangguan, Z.P. Effects of natural vegetation restoration and afforestation on soil carbon and nitrogen storage in the Loess Plateau, China. Chin. J. Appl. Ecol. 2018, 29, 2163–2172. (In Chinese) [Google Scholar] [CrossRef]
- Tian, Q.; He, H.; Cheng, W.; Bai, Z.; Wang, Y.; Zhang, X. Factors controlling soil organic carbon stability along a temperate forest altitudinal gradient. Sci. Rep. 2016, 6, 18783. [Google Scholar] [CrossRef] [Green Version]
- Suwal, A.L.; Bhuju, D.R.; Måren, I.E. Assessment of Forest Carbon Stocks in the Himalayas: Does Legal Protection Matter? Small-Scale For. 2018, 14, 103–120. [Google Scholar] [CrossRef]
- Llorente, M.; Glaser, B.; Turrion, M.B. Anthropogenic disturbance of natural forest vegetation on calcareous soils alters soil organic matter composition and natural abundance of C-13and N-15 density fractions. Eur. J. For. Res. 2010, 129, 1143–1153. [Google Scholar] [CrossRef]
- Yang, K.; Zhu, J.J.; Yan, Q.L.; Sun, O.J. Changes in soil P chemistry as affected by conversion of natural secondary forests to larch plantations. For. Ecol. Manag. 2010, 260, 422–428. [Google Scholar] [CrossRef]
- Zhou, J.; Wu, Y.; Bing, H.; Yang, Z.; Wang, J.; Sun, H.; Sun, S.; Luo, J. Variations in soil phosphorus biogeochemistry across six vegetation types along an altitudinal gradient in SW China. Catena 2016, 142, 102–111. [Google Scholar] [CrossRef]
- Hou, E.Q.; Chen, C.G.; Wen, D.Z.; Liu, X. Relationships of phosphorus fractions to organic carbon content in surface soils in mature subtropical forests, Dinghushan, China. Soil Res. 2014, 52, 55–63. [Google Scholar] [CrossRef] [Green Version]
- Ren, C.; Zhao, F.; Kang, D.; Yang, G.; Han, X.; Tong, X.; Feng, Y.; Ren, G.X. Linkages of C:N:P stoichiometry and bacterial community in soil following afforestation of former farmland. For. Ecol. Manag. 2016, 376, 59–66. [Google Scholar] [CrossRef]
- Xu, M.P.; Wang, J.Y.; Zhu, F.Y.; Han, X.H.; Ren, C.J.; Yang, G.H. Plant Biomass and Soil Nutrients Mainly Explain the Variation of Soil Microbial Communities During Secondary Succession on the Loess Plateau. Microb. Ecol. 2021, 1–13, Online ahead of print. [Google Scholar] [CrossRef]
- Li, S.F.; Huang, X.B.; Lang, X.D.; Shen, J.; Su, J. Cumulative effects of multiple biodiversity attributes and abiotic factors on ecosystem multifunctionality in the Jinsha river valley of southwestern China. For. Ecol. Manag. 2020, 472, 118281. [Google Scholar] [CrossRef]
- Chu, H.Y.; Neufeld, J.D.; Walker, V.K.; Grogan, P. The influence of vegetation type on the dominant soil bacteria, archaea, and fungi in a low arctic tundra landscape. Soil Sci. Soc. Am. J. 2011, 75, 1756–1765. [Google Scholar] [CrossRef] [Green Version]
- Goldfarb, K.C.; Karaoz, U.; Hanson, C.A.; Santee, C.A.; Bradford, M.A.; Treseder, K.K. Differential growth responses of soil bacterial taxa to carbon substrates of varying chemical recalcitrance. Front. Microbiol. 2011, 2, e00094. [Google Scholar] [CrossRef] [Green Version]
- Li, X.Z.; Rui, J.P.; Mao, Y.J.; Yannarell, A.; Mackie, R. Dynamics of the bacterial community structure in the rhizosphere of a maize cultivar. Soil Biol. Biochem. 2014, 68, 392–401. [Google Scholar] [CrossRef]
- Oberhofer, M.; Hess, J.; Leutgeb, M.; Gössnitzer, F.; Rattei, T.; Wawrosch, C.; Zotchev, S.B. Exploring Actinobacteria associated with rhizosphere and endosphere of the native alpine medicinal plant Leontopodium nivale subspecies alpinum. Front. Microbiol. 2019, 10, 2531, Article 2531. [Google Scholar] [CrossRef]
- Banerjee, S.; Walder, F.; Büchi, L.; Meyer, M.; Held, A.Y.; Gattinger, A.; Keller, T.; Charles, R.; van der Heijden, M.G.A. Agricultural intensification reduces microbial network complexity and the abundance of keystone taxa in roots. ISME J. 2019, 13, 1722–1736. [Google Scholar] [CrossRef] [Green Version]
- De Vries, F.T.; Griffiths, R.I.; Bailey, M.; Craig, H.; Girlanda, M.; Gweon, H.S.; Hallin, S.; Kaisermann, A.; Keith, A.M.; Kretzschmar, M.; et al. Soil bacterial networks are less stable under drought than fungal networks. Nat. Commun. 2018, 9, 3033. [Google Scholar] [CrossRef] [PubMed] [Green Version]
- Che, R.; Wang, Y.; Li, K.; Xu, Z.; Hu, J.; Wang, F.; Ruie, Y.; Li, L.; Pang, Z.; Cui, X. Degraded patch formation significantly changed microbial community composition in alpine meadow soil. Soil Tillage Res. 2019, 195, 104426. [Google Scholar] [CrossRef]
- Liu, X.; Wang, Y.Z.; Liu, Y.H.; Chen, H.; Hu, Y.L. Response of Bacterial and Fungal Soil Communities to Chinese Fir (Cunninghamia lanceolate) Long-Term Monoculture Plantations. Front. Microbiol. 2020, 11, 181. [Google Scholar] [CrossRef] [PubMed] [Green Version]
- Huhe; Chen, X.; Hou, F.; Wu, Y.; Cheng, Y. Bacterial and Fungal Community Structures in Loess Plateau Grasslands with Different Grazing Intensities. Front. Microbiol. 2017, 8, 606. [Google Scholar] [CrossRef]

| Quadrat | Elevation (m) | Longitude (°) | Latitude (°) | Slope (°) | Aspect (°) | Coverage | Dominant Species |
|---|---|---|---|---|---|---|---|
| Shrub (S) | 400 | 117.55062 | 36.45683 | 6.2 | S189 | 65% | Vitex negundo var. heterophylla |
| 381 | 117.43693 | 36.40997 | 21.1 | SE131 | 95% | V. negundo var. heterophylla | |
| 301 | 117.56891 | 36.48426 | 2.3 | W270 | 70% | V. negundo var. heterophylla | |
| Coniferous Forests (CF) | 758 | 117.42622 | 36.42059 | 28.7 | E81 | 45% | P. tabuliformis, P.densiflora |
| 484 | 117.45266 | 36.45675 | 16.7 | W269 | 60% | Pinus tabuliformis, P.densiflora | |
| 458 | 117.56334 | 36.42401 | 38.8 | NE47 | 60% | P. tabuliformis, P.densiflora | |
| Mixed Forest (MF) | 526 | 117.44411 | 36.42148 | 13.5 | NW303 | 60% | P.densiflora, Populus davidiana |
| 469 | 117.45251 | 36.45733 | 19.8 | W256 | 40% | P.densiflora, Quercus acutissima | |
| 448 | 117.45253 | 36.45747 | 22.8 | N18 | 70% | Pinus densiflora, Robinia pseudoacacia | |
| Broad-leaved Forest (BF) | 542 | 117.44382 | 36.42024 | 16 | W248 | 80% | R. pseudoacacia |
| 540 | 117.43137 | 36.42351 | 15.8 | NE28 | 55% | Q. acutissima,D. lotus, Salix matsudana | |
| 447 | 117.48876 | 36.42349 | 2.5 | N338 | 70% | P. davidiana | |
| 396 | 117.44651 | 36.44243 | 8.2 | E69 | 85% | R. pseudoacacia | |
| 390 | 117.44973 | 36.456 | 1.4 | NW327 | 85% | Poplus davidiana | |
| 390 | 117.43558 | 36.41352 | 2.5 | S170 | 65% | Pterocarya stenoptera, Diospyros lotus, Amygdalus persica | |
| 388 | 117.43705 | 36.41067 | 25.4 | E82 | 95% | R. pseudoacacia, Koelreuteria paniculata | |
| 380 | 117.46176 | 36.42259 | 22.3 | E111 | 75% | R. pseudoacacia | |
| 339 | 117.44869 | 36.4427 | 3.3 | S167 | 60% | R. pseudoacacia, Q. acutissima, Platycladus orientalis | |
| 324 | 117.44886 | 36.44234 | 6.4 | SE142 | 80% | Q. acutissima | |
| 317 | 117.4665 | 36.46934 | 12.7 | NW297 | 70% | Poplus davidiana |
| Surface | Dry Matter | Available Phosphorus (g·kg−1) | Organic Carbon (mg·kg−1) | NH4+-N (mg·kg−1) | NO2−-N (mg·kg−1) | NO3−-N (mg·kg−1) | pH |
|---|---|---|---|---|---|---|---|
| S | 0.987 ± 0.002a | 8.341 ± 1.069a | 2.641 ± 0.688c | 11.637 ± 1.212b | 7.614 ± 0.934b | 4.628 ± 3.044a | 5.01 ± 0.157ab |
| CF | 0.982 ± 0.005a | 3.273 ± 1.627b | 4.032 ± 0.757a | 11.551 ± 0.703b | 8.443 ± 2.375a | 4.221 ± 0.919a | 4.693 ± 0.257b |
| MF | 0.983 ± 0.003a | 3.923 ± 2.370b | 3.943 ± 0.576b | 12.692 ± 0.514b | 7.240 ± 1.709b | 4.561 ± 1.276a | 4.727 ± 0.340b |
| BF | 0.978 ± 0.009b | 2.614 ± 1.535c | 3.496 ± 1.065b | 14.121 ± 4.760a | 7.304 ± 1.848b | 3.970 ± 1.008b | 5.274 ± 0.492a |
| Lower | Dry matter | Available phosphorus (g·kg−1) | Organic Carbon (mg·kg−1) | NH4+-N (mg·kg−1) | NO2−-N (mg·kg−1) | NO3−-N (g·kg−1) | pH |
| S | 0.988 ± 0.001a | 2.523 ± 1.887b | 1.539 ± 0.779b | 8.986 ± 1.076b | 5.655 ± 1.747b | 2.874 ± 0.464b | 5.017 ± 0.068a |
| CF | 0.986 ± 0.003a | 3.005 ± 2.564b | 2.568 ± 0.680a | 11.970 ± 3.779a | 7.101 ± 1.729a | 3.683 ± 0.252a | 4.767 ± 0.328a |
| MF | 0.986 ± 0.003a | 1.903 ± 0.662c | 1.778 ± 0.505b | 10.633 ± 1.320a | 5.767 ± 0.363b | 3.292 ± 0.800a | 4.837 ± 0.188a |
| BF | 0.984 ± 0.005a | 3.294 ± 1.314a | 2.060 ± 0.789ab | 11.658 ± 3.992a | 7.136 ± 2.916a | 3.928 ± 2.020a | 5.285 ± 0.416a |
Publisher’s Note: MDPI stays neutral with regard to jurisdictional claims in published maps and institutional affiliations. |
© 2022 by the authors. Licensee MDPI, Basel, Switzerland. This article is an open access article distributed under the terms and conditions of the Creative Commons Attribution (CC BY) license (https://creativecommons.org/licenses/by/4.0/).
Share and Cite
Qiu, Z.; Shi, C.; Zhao, M.; Wang, K.; Zhang, M.; Wang, T.; Shi, F. Improving Effects of Afforestation with Different Forest Types on Soil Nutrients and Bacterial Community in Barren Hills of North China. Sustainability 2022, 14, 1202. https://doi.org/10.3390/su14031202
Qiu Z, Shi C, Zhao M, Wang K, Zhang M, Wang T, Shi F. Improving Effects of Afforestation with Different Forest Types on Soil Nutrients and Bacterial Community in Barren Hills of North China. Sustainability. 2022; 14(3):1202. https://doi.org/10.3390/su14031202
Chicago/Turabian StyleQiu, Zhenlu, Cong Shi, Mingyuan Zhao, Kefan Wang, Mei Zhang, Tongtong Wang, and Fuchen Shi. 2022. "Improving Effects of Afforestation with Different Forest Types on Soil Nutrients and Bacterial Community in Barren Hills of North China" Sustainability 14, no. 3: 1202. https://doi.org/10.3390/su14031202
APA StyleQiu, Z., Shi, C., Zhao, M., Wang, K., Zhang, M., Wang, T., & Shi, F. (2022). Improving Effects of Afforestation with Different Forest Types on Soil Nutrients and Bacterial Community in Barren Hills of North China. Sustainability, 14(3), 1202. https://doi.org/10.3390/su14031202