1. Introduction
The great demands of stakeholders and the high importance of private social solidarity institutions (IPSS) (acronym in Portuguese, standing for Instituições Particulares de Solidariedade Social) in the Portuguese socio-economic panorama make the transparency and increased accountability (social, financial and economic) of these institutions imperative [
1]. In the same sense, Tomé, Bandeira, Azevedo and Costa [
2] reinforced that it is necessary to promote the evaluation of results and their disclosure to help to increase their accountability. Decree-Law no.172-A/2014 [
3] established a financial supervision model, applicable to IPSS, based on demanding imperative rules, with the view to increasing the accountability of the management of these entities, placing strong pressure for greater accountability (social and corporate responsibility of IPSS’ managers) for their members, funders, users and citizens in general.
There is also a growing need to disseminate good practices and the social impact these institutions have on the community. In Portugal in 2018, more than 90% of social economy entities did not measure their social impact [
4].
Despite the various frameworks that has being developed [
5,
6,
7,
8,
9,
10], we still do not have a framework with widespread acceptance. Although the bodies with responsibilities in the sector, such as António Sérgio Cooperative for the Social Economy in Portugal, are carrying out an assessment of the sector’s contribution, they are still very attached to quantitative indicators. However, whether the mission, vision and values of these entities play a significant part of their contributions is difficult to measure.
In that context, the project named “TheoFrameAccountability” (Theoretical framework for promotion of accountability in the social economy sector: the IPSS case) (TFA) aims to answer the following research question: how can we promote accountability (social, financial and economic) in the social economy sector, in particular in the case of IPSS? One of its objectives is to conceptualize a framework that allows stakeholders to evaluate the performance of IPSS, and to allow IPSS to make a self-evaluation of their performance and accountability, meeting the growing need for dissemination of good practices and the social impact they have on the community in which they operate.
To this end, a framework of indicators was developed that provides stakeholders with an assessment of the accountability of IPSS in complying with the principles inherent to the guarantee of the sustainability of these organizations [
1].
Considering several authors [
5,
6,
7,
8,
9,
10], it was possible to conclude that the assessment of accountability involves, in addition to economic and financial dimensions, further dimensions that meet the social and environmental aspects, each one presenting several sub-dimensions.
In this study, we propose a framework with the conceived indicators, which resulted from the combination of a literature review with fieldwork and validated through the focus group methodology. This study also aims to identify the main trends of the framework dimensions and sub-dimensions from a pilot test. This test was carried out with seven IPSS which completed the questionnaires made available through the specific platform created by the TFA project and for the years 2018, 2019 and 2020.
In this way, this study contributes, on the one hand, to knowledge by discussing and developing a framework that allows for assessing the accountability of social economy entities, considering various dimensions. On the other hand, it provides entities with a tool that allows them to assess and disclose their accountability. There is also the interest that this evaluation represents for the different stakeholders, namely potential funders, who thus have a better understanding of how their contributions are being used.
This paper is organized as follows: after this first introductory section, the literature review is presented in the second section; the third section presents the research methodology, the framework design is shown in the fourth section, the results of the pilot test are presented and discussed in the fifth section, and the sixth section presents the final considerations.
3. Research Methodology
As we saw in the previous point, several authors have been developing frameworks for the social economy sector, but there is still no framework to be used more generally. Furthermore, the studies present the frameworks, but do not present their application to the reality, except for very specific applications or regarding a specific dimension, as can be concluded from our review of the literature and reinforced with the systematic review carried out by Santos et al. [
31]. This fact may be associated with the difficulty related to obtaining data, largely due to the low use of ICT in this sector. Thus, the TFA project fills this gap by developing a framework and a platform that allows the collection of data necessary for the framework’s indicators, and their respective dissemination answers the research question “How can we promote accountability (social, financial and economic) in the social economy sector, in particular in the case of IPSS?”.
The aim of this paper is to present a framework designed under as well as the preliminary results of a pilot test. Considering this, it was necessary to use a set of methodologies in a 6-stage process (
Figure 1).
The first stage consisted of an extensive literature review which included the themes of the social economy, IPSS, accountability, governance, sustainability and indicators. This literature review enabled the preparation of the fieldwork, which took place between March and July 2019, with the aim of getting to know the IPSS and the environment in which they develop their activity [
36], as well as designing the framework.
The second stage consisted of conducting the fieldwork which was planned as suggested by Feldman [
37] and Jacob and Furgerson [
38]. Since conducting the fieldwork would not be feasible with all the entities in the population, consisting of 5358 IPSS at the time of the study, a representative sample of the study population was defined, adopting a confidence level of 90% and a margin of error of 10%, which resulted in a sample numbering 67 IPSS. The 67 IPSS were randomly selected within each stratum, i.e., legal nature and geographical area. Despite the effort made to contact, visit and conduct the interviews in the IPSS selected for the sample, only 31 interviews were conducted, up to July 2019. Content analysis of the resulting reports served as the basis for the construction of the framework and respective indicators, which was considered as the third stage.
For the validation of the framework and its indicators, in the fourth stage, the focus group methodology was used, which is considered to be the most appropriate methodology for qualitative research studies. Considering the characteristics of this methodology, the focus group took into consideration the type of participants and their particularities, as well as an adequate moderation focused on the objectives to be achieved [
39]. The focus group gathered 49 participants selected according to their involvement in the object of analysis (IPSS), and their practical but also theoretical knowledge. After a detailed assessment of the comments obtained from the focus group, the framework was further refined.
In the fifth stage, the questionnaire was developed to collect the data required to compute the indicators. In May 2020, the questionnaire was finalized and submitted to a pre-test, in which ten experts from the academic and professional field participated. This analysis resulted in the final adjustments that allowed the finished questionnaire to be submitted.
Finally, in the sixth stage, a pilot test was carried out to test the framework’s outputs, allowing, on the one hand, one to adjust some inconsistencies in the indicator calculations and, on the other hand, to analyze the results of the indicators to identify trends and draw conclusions. This process aimed to assess whether the framework met its initially defined objectives. The first 7 IPSS that completed the questionnaires for the years 2018, 2019 and 2020 were considered for the pilot test. The number of entities was small, but being related to 3 years for each entity, this allowed us to obtain greater strength for any trends that can be identified.
3.1. Framework Design
Based on the literature review, we found that the TBL concept [
32,
33] was the base for several authors who presented diversified proposals for the design of appropriate frameworks to evaluate the accountability of non-profit organizations, considering the social and environmental dimensions in addition to the economic result [
5,
6,
7,
8,
9,
10]. However, aspects such as community and governance were emphasized as being of extreme importance to facilitate the alignment with non-profit organization stakeholders, which in the opinion of Ferreira, Santos and Curi [
1] denoted the TBL’s insufficiency to this effect. In their search to find a solution to this deficiency, these authors proceeded in parallel with the analysis of the social economy entities’ production process and arrived at an extension of the dimensions corresponding to the various steps of this process which, completed with views of the organizational architecture, led to a framework organized according to the sextuplet bottom line (SBL) concept with the following dimensions: purpose; partners (extended people concept); profit; proximity; planet and progress (
Figure 2).
Based on what was described above in terms of the dimensions proposed for the IPSS framework, the TFA project proceeded with its subdivision into relevant areas within each dimension, having focused on the literature [
5,
6,
7,
8,
9,
10] and on the results obtained in the previous fieldwork, where information was collected regarding the daily reality and the specific needs of these institutions. This construction resulted in the following framework structure (
Figure 3).
For each dimension/sub-dimension, the indicators considered capable of expressing the relevant information were defined, improving the accountability of the IPSS, whose construction was based on the literature review and on the current practices of these institutions, collected during the fieldwork.
These indicators aim to measure important aspects such as: how the entity defines its mission and strategic objectives, its governance model and transparency; how entities deal with their responsibilities in society, including relationships with stakeholders (beneficiaries, employees, suppliers, State, volunteers, etc.); economic efficiency and the effort to achieve economic balance; how entities relate to the community in which they are inserted (namely through partnerships, employees, suppliers, state, volunteers, etc.); the way entities relate to the community into which they are inserted (namely through the creation of partnerships, social investments and patronage); energy efficiency and relationship with the environment; and the way in which the entity adapts to technological evolution, through the adoption and acceptance of emerging technologies both in the support of its operational activity and in its own promotion to the outside (in
Appendix A, you can see a greater detail of the framework, namely, the detailed description of each indicator and the corresponding objective).
In general, 76 indicators were developed, divided by dimension and sub-dimension, as shown in
Table 2.
It should be noted that, in addition to the 76 primary indicators, agglomerated (average) indicators were also proposed which will provide stakeholders with a broader vision of the generality of these institutions, but which may also help to establish a benchmarking process for them.
3.1.1. Presentation and Discussion of Results
To validate and evaluate the analysis framework, a pilot test was carried out which included 7 IPSS, with data referring to the years 2018, 2019 and 2020. The main objective of this test was to calculate the framework’s indicators in its different dimensions and sub-dimensions. This pilot test aimed to identify the main trends, in an analysis by different dimensions, and to analyze the adequacy of the first results in relation to the expectations formulated based on the literature review. The results obtained in the pilot test and its discussion are presented below, in an analysis regarding each of the six dimensions of the framework.
3.1.2. Dimension Purpose
Figure 4 shows the results for the purpose dimension indicators, considering their sub-dimensions (except for the transparency sub-dimension, which, as explained above, is not collected through the questionnaire).
Legend: The ordinate axis represents the indicators of 2 sub-dimensions of the purpose dimension (strategy and organizational profile; governance). The abscissa axis represents the average of the responses obtained in the pilot test. The average ranges from 0 to 1.
The analysis of
Figure 4, with regard to the strategy and organizational profile sub-dimension, shows that the AP indicator (main activities) remains substantially constant during the 3 years under analysis. Through this indicator, it can be seen that the pilot test entities carry out, primarily, approximately 27% of the main activities that, in view of the legislation in force, they can carry out. These results are indicative that the IPSS in the pilot sample seek to specialize and avoid diversification. The AI indicator (instrumental activities) has a low value, decreasing from 2018 to 2019 and maintaining the same value in 2020, indicating that, in that year, only about 15% of the IPSS carry out other activities besides the main one. The joint analysis of these indicators seems to support what was just mentioned and is related to the search for specialization in the activities carried out. However, the fact that a very small percentage of IPSS carry out other activities besides their main one may also indicate a lack of initiative to pursue activities that allow them to be more financially sustainable.
The EPE indicator (existence of a strategic plan) remained constant in the period under review and demonstrates that approximately 57% of the IPSS in the pilot test defined a strategic plan. An identical percentage is obtained for the MDF (function description manual) and MAD (performance assessment models) indicators, although the latter only for the year 2019. The ESGQ indicator (existence of a quality management system) is approximately 28%, meaning that only 28% of IPSS have a quality management system. The MEE (entity’s strategic maturity) indicator is the one with the highest values and has evolved positively over time, standing at 0.9 in 2020. This indicator allows us to conclude that, in that year, 90% of the IPSS had defined their mission, vision and strategic objectives.
In the governance sub-dimension, the PTOS indicator (participation of non-member employees in governing bodies) shows a slight increase in 2020 compared to 2019, but this still indicates that, on average, corporate bodies only include about 10% of non-member employees. As for the PMHOS indicator (parity between women and men in governing bodies), it shows a very slight increase in the period under analysis and, in 2020, its value is very close to 50%, which reflects that in the IPSS in the pilot test, there is parity between men and women. The PROSRP indicator (weight of remuneration of corporate bodies in personnel remuneration) is zero in all periods under analysis, meaning that in the IPSS in the pilot sample, members of the management bodies are not remunerated.
From the results just presented, it is highlighted that it is still necessary for the IPSS to improve their strategy and their organizational profiles, namely through the introduction of management mechanisms such as strategic plans, quality management systems, job description manuals and performance evaluation models, which will allow for greater professionalization of management. The results also show that the IPSS still have to act strongly in the improvement of governance, either through the participation of employees in the management bodies, or through the professionalization of these same management bodies. The evolution of indicators in this dimension does not seem to have been affected by the pandemic caused by COVD-19.
3.2. Partners Dimension
Figure 5 shows the results for the indicators of the partners dimension, considering the sub-dimensions—beneficiaries, employees, volunteering, suppliers and the state.
Legend: The ordinate axis represents the indicators of the sub-dimensions of the partners dimension (beneficiaries; employees; volunteering; suppliers; state). The abscissa axis represents the average of the responses obtained in the pilot test for the indicators, except for the CV indicator, which represents the variation from the previous year. The average ranges from 0 to 1.
As can be seen in
Figure 5, in the beneficiary sub-dimension, the USE indicator (Users Served by the Entity) shows a slight increase from 2018 to 2020. This year, the value of the indicator indicates that the IPSS in the pilot sample serve about 95% of the population, demonstrating that these IPSS serve a number of users that is very close to demand. The MSU indicator (monitoring user satisfaction) also shows growth from 2018 to 2019, remaining the same in 2020. In these last two years, around 85% of the IPSS in the pilot sample assessed user satisfaction. The MTRSEU indicator (monitoring the handling of complaints/suggestions/compliments from users) had a value of 100% in three years, which informs us that the IPSS which assessed user satisfaction dealt with 100% of complaints/suggestions/compliments received from users.
Regarding the employees sub-dimension, the RRT indicator (holding meetings with employees) and the MST indicator (monitoring employees’ satisfaction) show the same values and the same growth trend from 2018 to 2019, both maintaining the value of 2019 in 2020. In these years, the aforementioned indicators show that approximately 85% of the IPSS hold meetings with employees and have a system to monitor their satisfaction. The MTRSET indicator (monitoring the handling of complaints/suggestions/compliments of employees) indicates that in 2018 and 2020, the IPSS in the pilot test dealt with all the complaints/suggestions/compliments of employees. In 2019, the value is a little lower, standing at around 90%. The TAIF indicator (employees who benefit from information and vocational training actions during year N compared to the total number of employees) fluctuates in the period under analysis and stands at approximately 90% in 2020, meaning that this is the percentage of employees which benefited from information and training actions during the year in question.
Additionally, in the employees sub-dimension, the RE indicator (job turnover) shows a growth trend, although this is more accentuated from 2019 to 2020, indicating that in this year, employment turnover was roughly 33%. This sharper increase in job turnover in 2020 may be related to the pandemic situation due to COVID-19; however, given the low turnover, the employment provided by the IPSS in the pilot test can be considered to be lasting. With regard to the RMEI (recourse to inclusive employment measures) indicator, analyzing its values, it appears that the IPSS made very weak use of inclusive employment measures. In 2020, only around 3% of employees were recruited in this way. Finally, the TFSAF indicator (employees with higher education who work in their training area compared to the total number of workers) shows a growth from 2018 to 2019 and a decrease from 2019 to 2020, but this year, about 25% of employees with training superior worked in their area of training.
In the volunteering sub-dimension, all indicators have very low values, and without expression, the CV (volunteer capture) indicator in 2019 is negative, which indicates that the role of volunteers in the entities belonging to the pilot test is still not very significant. This may be due to the requirement of minimum professionals to obtain state subsidies, combined with the need for integration and training of volunteers, which requires time and resources and the need for volunteers to work for the IPSS through a duly established commitment, allowing the IPSS to schedule their activities and make sure they have the required number of volunteers. In the field work, some institutions stated that “It is more complicated to train volunteers than the benefits they bring, because they tend to be just passing through”.
In the suppliers sub-dimension, the CFL indicator (purchases from local suppliers) slightly decreases from 2018 to 2019, and remains constant in 2020. In this year, around 39% of purchases are made from local suppliers.
In the state sub-dimension, the APa indicator (partnership agreements) remains practically constant and close to 85%, indicating the percentage of IPSS in the pilot test that have partnership agreements with public sector institutions.
The analysis of the sub-dimensions of users, employees, volunteers, suppliers and the state shows that the performance level of the indicators by sub-dimension is irregular, with the voluntary sub-dimension showing the worst results. This fact is not surprising given the difficulty that entities face in having volunteers available to regularly carry out the activities. With regard to the sub-dimension of employees, it is important to emphasize the need to adjust the functions performed to the training of employees, making the best use of their skills, as well as devoting more attention to monitoring and addressing the employees’ opinions.
3.3. Dimension Performance
Figure 6 presents the results for the indicators of the performance dimension, considering their activity, profitability and finance sub-dimensions and, in
Table 1, the results for the VAB (gross added value) indicators of the profitability sub-dimension, LG (general liquidity), SOL (solvency) and FM (working capital) of the finance sub-dimension.
Legend: The ordinate axis represents the indicators of the sub-dimensions of the performance dimension (activity; profitability; finance). The abscissa axis represents the average of the responses obtained in the pilot test entities for the remaining indicators. All averages vary between 0 and 1, except for the ROI indicator.
The analysis of
Figure 6, for the activity sub-dimension, and with regard to the FE financing indicators (state financing compared to total financing), FPS (service provision financing compared to total financing), FIS (social investment financing compared to total funding), FMD (funding of patronage and donations compared to total funding) and FDE (financing of donations in kind compared to total funding), it appears that the fluctuations in temporal terms are very small and that the state funding (which represents between 38 and 44% of the funding) in addition to the financing from the provision of services (amount paid by the user, represents between 38 and 40% of the funding) are the ones that have greater expression, representing, together, approximately 80% of the financing of the IPSS in the pilot sample. Funding from social investors also has some impact (approximately 18% in 2020, the year with the highest value), but that which comes from donors (including in-kind donations) is very small, at approximately 4%. Although our results refer to a very small set of IPSS, when compared with those obtained in a study published by the Confederação Nacional das Instituições de Solidariedade (CNIS) [
41], these ratios were situated, respectively, at approximately 39% (state financing), 32% (provision of services), 7% (social investment) and 4% (donations, including in kind), which reveals that, with the exception of funding through patronage, there was some growth in funding through the different channels.
Still in terms of the activity sub-dimension, but now in an analysis of the cost structure, it appears that personnel costs are clearly those that have a greater weight in operating costs (GP indicator), representing about 62% of operating costs in the years 2019 and 2020. This is followed by expenses relating to external supplies and services, which represent approximately 18% of operating expenses (GFSE indicator) in the same years and, finally, expenses relating to goods sold and materials consumed, which represent, in the same period, around 12% of the operating expenses (indicator GMVMC). In the CNIS study [
41], personnel expenses represented 58% of the total expenses, with expenses regarding external supplies and services representing approximately 20% of the total expenses and expenses relating to goods sold and materials consumed representing approximately 10% of the total expenses. The comparison with our study cannot be directly analyzed, as our study analyzes the structure of expenses in relation to operating expenses and the CNIS study [
41] uses total expenses. However, it is clear that the distribution follows roughly the same proportion. The Instituto Nacional de Estatística (INE) study [
4] carried out for the entire sector of the social economy in Portugal found lower indicators, but even so it confirmed that the main sources of funding come from the state and the amount paid by users.
The analysis carried out indicates that the IPSS should invest more in attracting funders, namely in terms of social investment and donors, and the path of transparency and accountability should be an option. It also demonstrates that the expenditure structure, assuming the character of IPSS service providers, is adequate, since they are heavily dependent on labor.
Regarding the profitability sub-dimension, it appears that the ROI (return on investment (social investment, State, patronage and donations)) is strongly negative in 2019, slightly improving in 2020, but remaining negative, while the return on equity (RFP indicator), although very low, is positive. The year with the worst performance is 2019. In the CNIS study [
41], the return on equity was approximately 1%, which is lower than what we obtained. With regard to the VAB (gross added value) (see
Table 1), its value grows in the period under analysis. In global terms, although the ROI is very low and even negative in 2019 and 2020, the VAL makes an interesting contribution from the IPSS to the community in which they operate and to the economy in general.
In the finance sub-dimension, it can be seen that the indicator AF (financial autonomy) rises slightly during the period under analysis and stands at approximately 49% in 2020. The END (indebtedness) indicator displays the opposite behavior and, in 2020, stands at approximately 50%. To complete the analysis, and observing
Table 3, it appears that both the LG indicator (general liquidity) and the SOL indicator (solvency) have very high values and do not undergo significant variation over the period under analysis. The FM (working capital) indicator has values that, given the general liquidity, can be considered excessive. Considering these results, it is understood that the financial management of entities needs some attention, indicating that the IPSS in the pilot sample could, with more adequate financial management, take advantage of excess short-term funding, improving their financial function.
When compared to the CNIS study [
41] (2018), we found that financial autonomy (approximately 72%), solvency (approximately 2.78) and general liquidity (approximately 5.38) are greater than those obtained in this pilot test.
3.4. Dimension Proximity
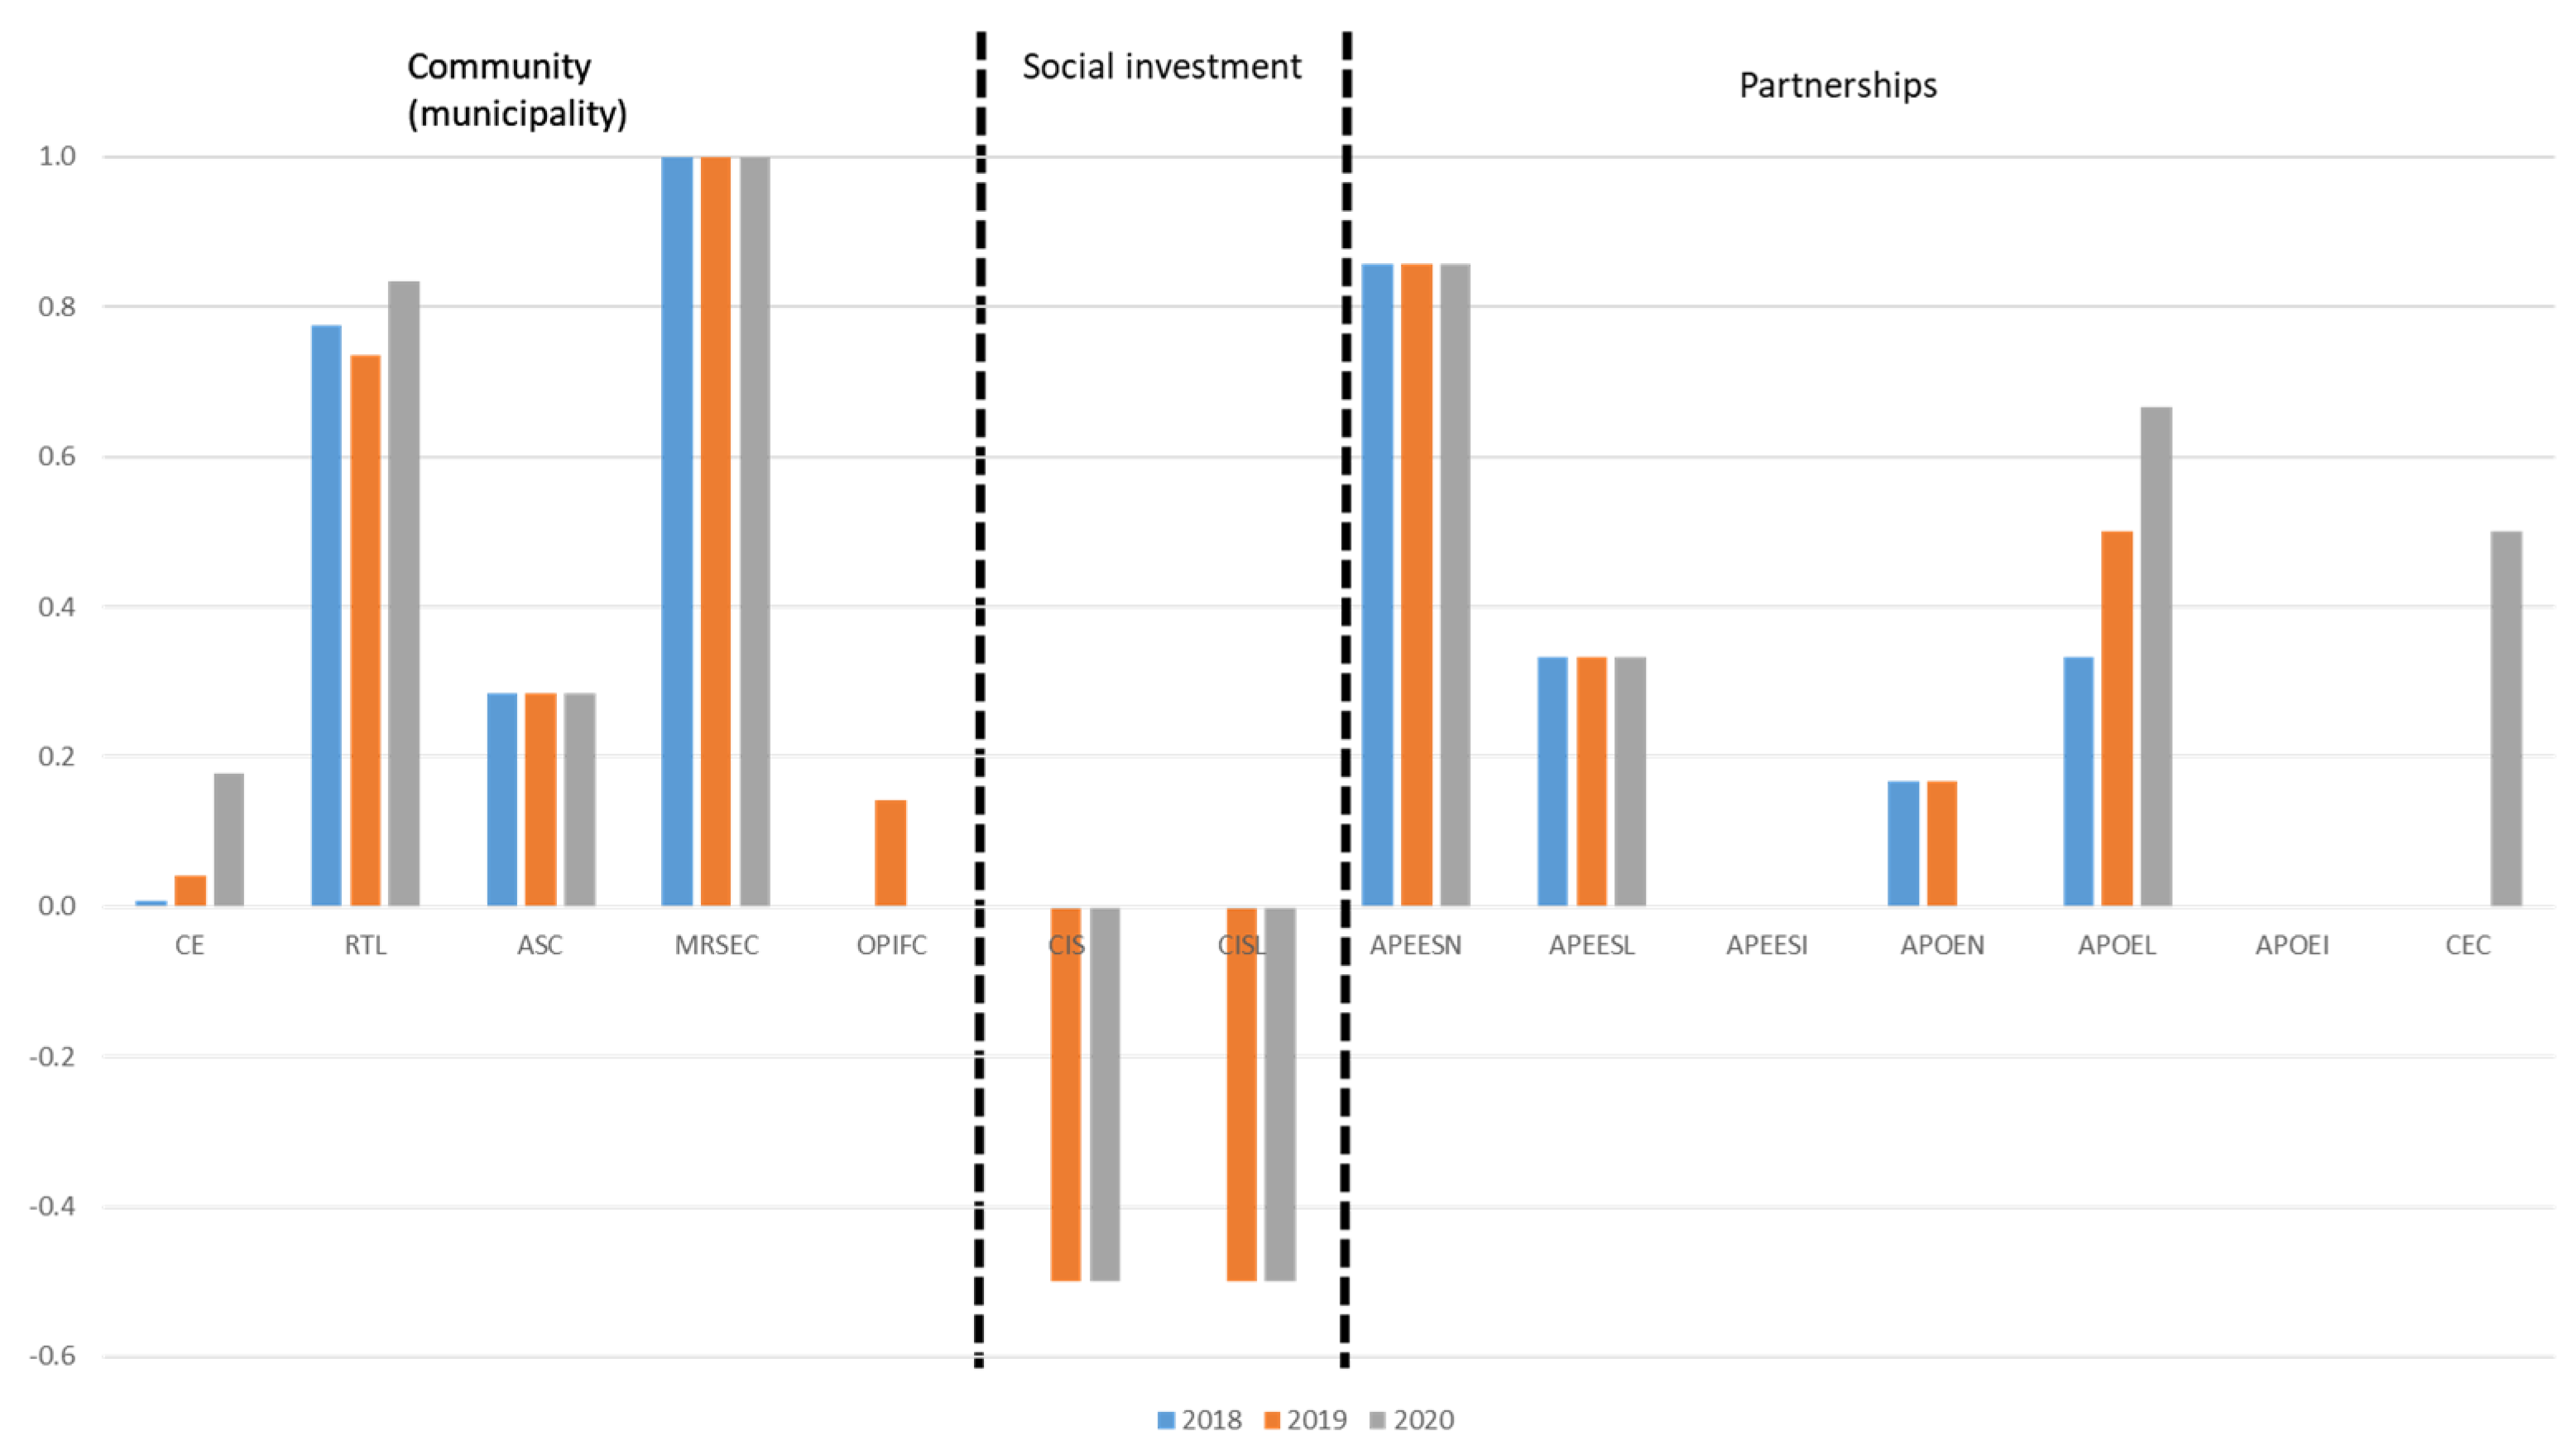
Figure 7 shows the results for the indicators of the proximity dimension in its community, social investment and partnerships sub-dimensions.
Table 4 presents the results for the indicators of the social investment, donors and patronage sub-dimensions.
Legend: The ordinate axis represents the indicators of the sub-dimensions of the proximity dimension (community; social investment; partnerships). The abscissa axis represents the variation from the previous year for the indicators of the sub-dimension social investment and the average of the responses obtained in the pilot test entities for the remaining indicators. The average ranges from 0 to 1.
As can be seen in
Figure 7, in the community sub-dimension, the EC indicator (Job Creation) remained low, showing an increase in 2020, but even so the percentage of job creation in 2020 is below 20%. These values may mean that the IPSS in the sample are in a phase of stability compared to the personnel structure recommended by the state bodies, or that they are unable to increase their staff due to financial constraints. The increase in 2020 may result from the necessary responses to the COVID-19 pandemic. The RTL (representation of local employees) indicator presents a small variation in the period under analysis and, in 2020, it is around 83%. This indicator is relevant, showing that the IPSS in the pilot sample essentially attract local employees. The entity’s concern with community satisfaction is still at low levels, since less than 30% of the IPSS in the sample indicate that they assess community satisfaction, as can be seen from the ASC indicator (community satisfaction assessment). Nevertheless, the MRSEC indicator (monitoring the handling of complaints/suggestions/compliments from the community) indicates that the IPSS that assess satisfaction and monitor the complaints/suggestions/compliments of the community handled, throughout the period under review, all complaints/ suggestions/compliments from the community they received. The interaction of the IPSS with the community through the provision of information and training programs to the community, represented by the OPIFC indicator, is also of little significance, since it only presents a value in the year 2019, and only about 15% of the IPSS in the sample indicated that they had provided this offering to the community.
With regard to the partnership sub-dimension, the APEESN (partnership agreements with entities of social economy national counterparts) and APEESL (partnership agreements with entities of social economy local) indicators remain constant during the period under review and are located, respectively, in 86% and 33%. There are no partnership agreements with international social economy entities, represented by the APEESI indicator, and partnerships with other social economy entities, represented by the APOEN indicator, are low in 2018 and 2019, and, in 2020, this value is zero. The APOEL indicator (partnership agreements with local social economy entities) shows an increase in the period under analysis, reaching its maximum value in 2020 at approximately 67%, revealing a strong connection to the community in which the IPSS are located. The CEC (curricular internships) indicator only shows a value in 2020 and is 50%, revealing that the IPSS are managing to attract young people for social economy activity.
With regard to the social investment sub-dimension, the CIS (attracting social investors) and CISL (attracting local social investors) indicators are negative in 2019 and 2020, indicating that the number of social investors decreased compared to 2018. In the same dimension, and as can be seen in
Table 4, the indicators CMD (capture of sponsors and/or donors) and CISL (capture of local social investors) rise a lot in 2019, decreasing in 2020 to the levels of 2018. These indicators are variations—the rise in 2019 may be due to COVID-19, which mobilized solidarity and, possibly, the increase in donors also to the IPSS.
From the analysis of this dimension, it can be seen that the contribution of the IPSS to the community is significant, contributing to the dynamization of the community in which they operate, namely in terms of employment and partnerships.
3.5. Dimension Planet
In an analysis of
Figure 8, where the results for the indicators of the planet dimension are presented, considering their energy efficiency (MEEe and MECA), waste (RSR, RR and MR) and environment (CA) sub-dimensions, we can assess the planet dimension. It appears that the waste and environment indicators show the strong concern of the IPSS with regard to environmental aspects. In a more detailed analysis, it can be observed that the RSR (selective waste collection), RR (waste reuse) and MR (waste mitigation) indicators, although fluctuating during the period under analysis, present higher values, in most cases (85%), which shows that the entities in the pilot sample use measures to treat or reuse waste. The CA (environmental awareness) indicator also presents values above 50%, in line with what has just been exposed.
Legend: The ordinate axis represents the indicators of the sub-dimensions of the planet dimension (energy efficiency; waste; environment). The abscissa axis represents the average of the responses obtained in the pilot test entities for the remaining indicators. The average ranges from 0 to 1.
The greatest weakness found in this dimension is the energy efficiency sub-dimension, in which the indicators are still low, meaning, in the case of the MEEE (energy efficiency measures) indicator, that only approximately 43% of the IPSS in the pilot sample carried out the implementation of energy efficiency measures. In the case of the MECA (water consumption efficiency measures) indicator, the percentage of IPSS that implemented water consumption efficiency measures is lower, although it rose significantly in 2020, standing at approximately 29%.
From a time perspective, it should be noted that most indicators stagnated between 2019 and 2020, and two indicators (MR and CA) showed a slight decrease in that period. These results are in line with the study by Liu, Bunditsakulchai and Zhuo [
42], which showed a substantial change in the pattern of waste generated during the pandemic. Thus, in the case of the entities analyzed, this drop can be justified by the occurrence of the COVID-19 pandemic, which relegated environmental aspects to the background in light of health concerns.
In global terms, it is understood that, from the analysis of the results for this dimension, the IPSS are aware of the need to preserve the environment. However, there is still room for improvement, especially in the energy efficiency sub-dimension, which needs more attention. Occasionally, the fact that less than 50% of the entities in the pilot sample do not have efficiency measures is related to issues of a financial nature.
3.6. Dimension Progress
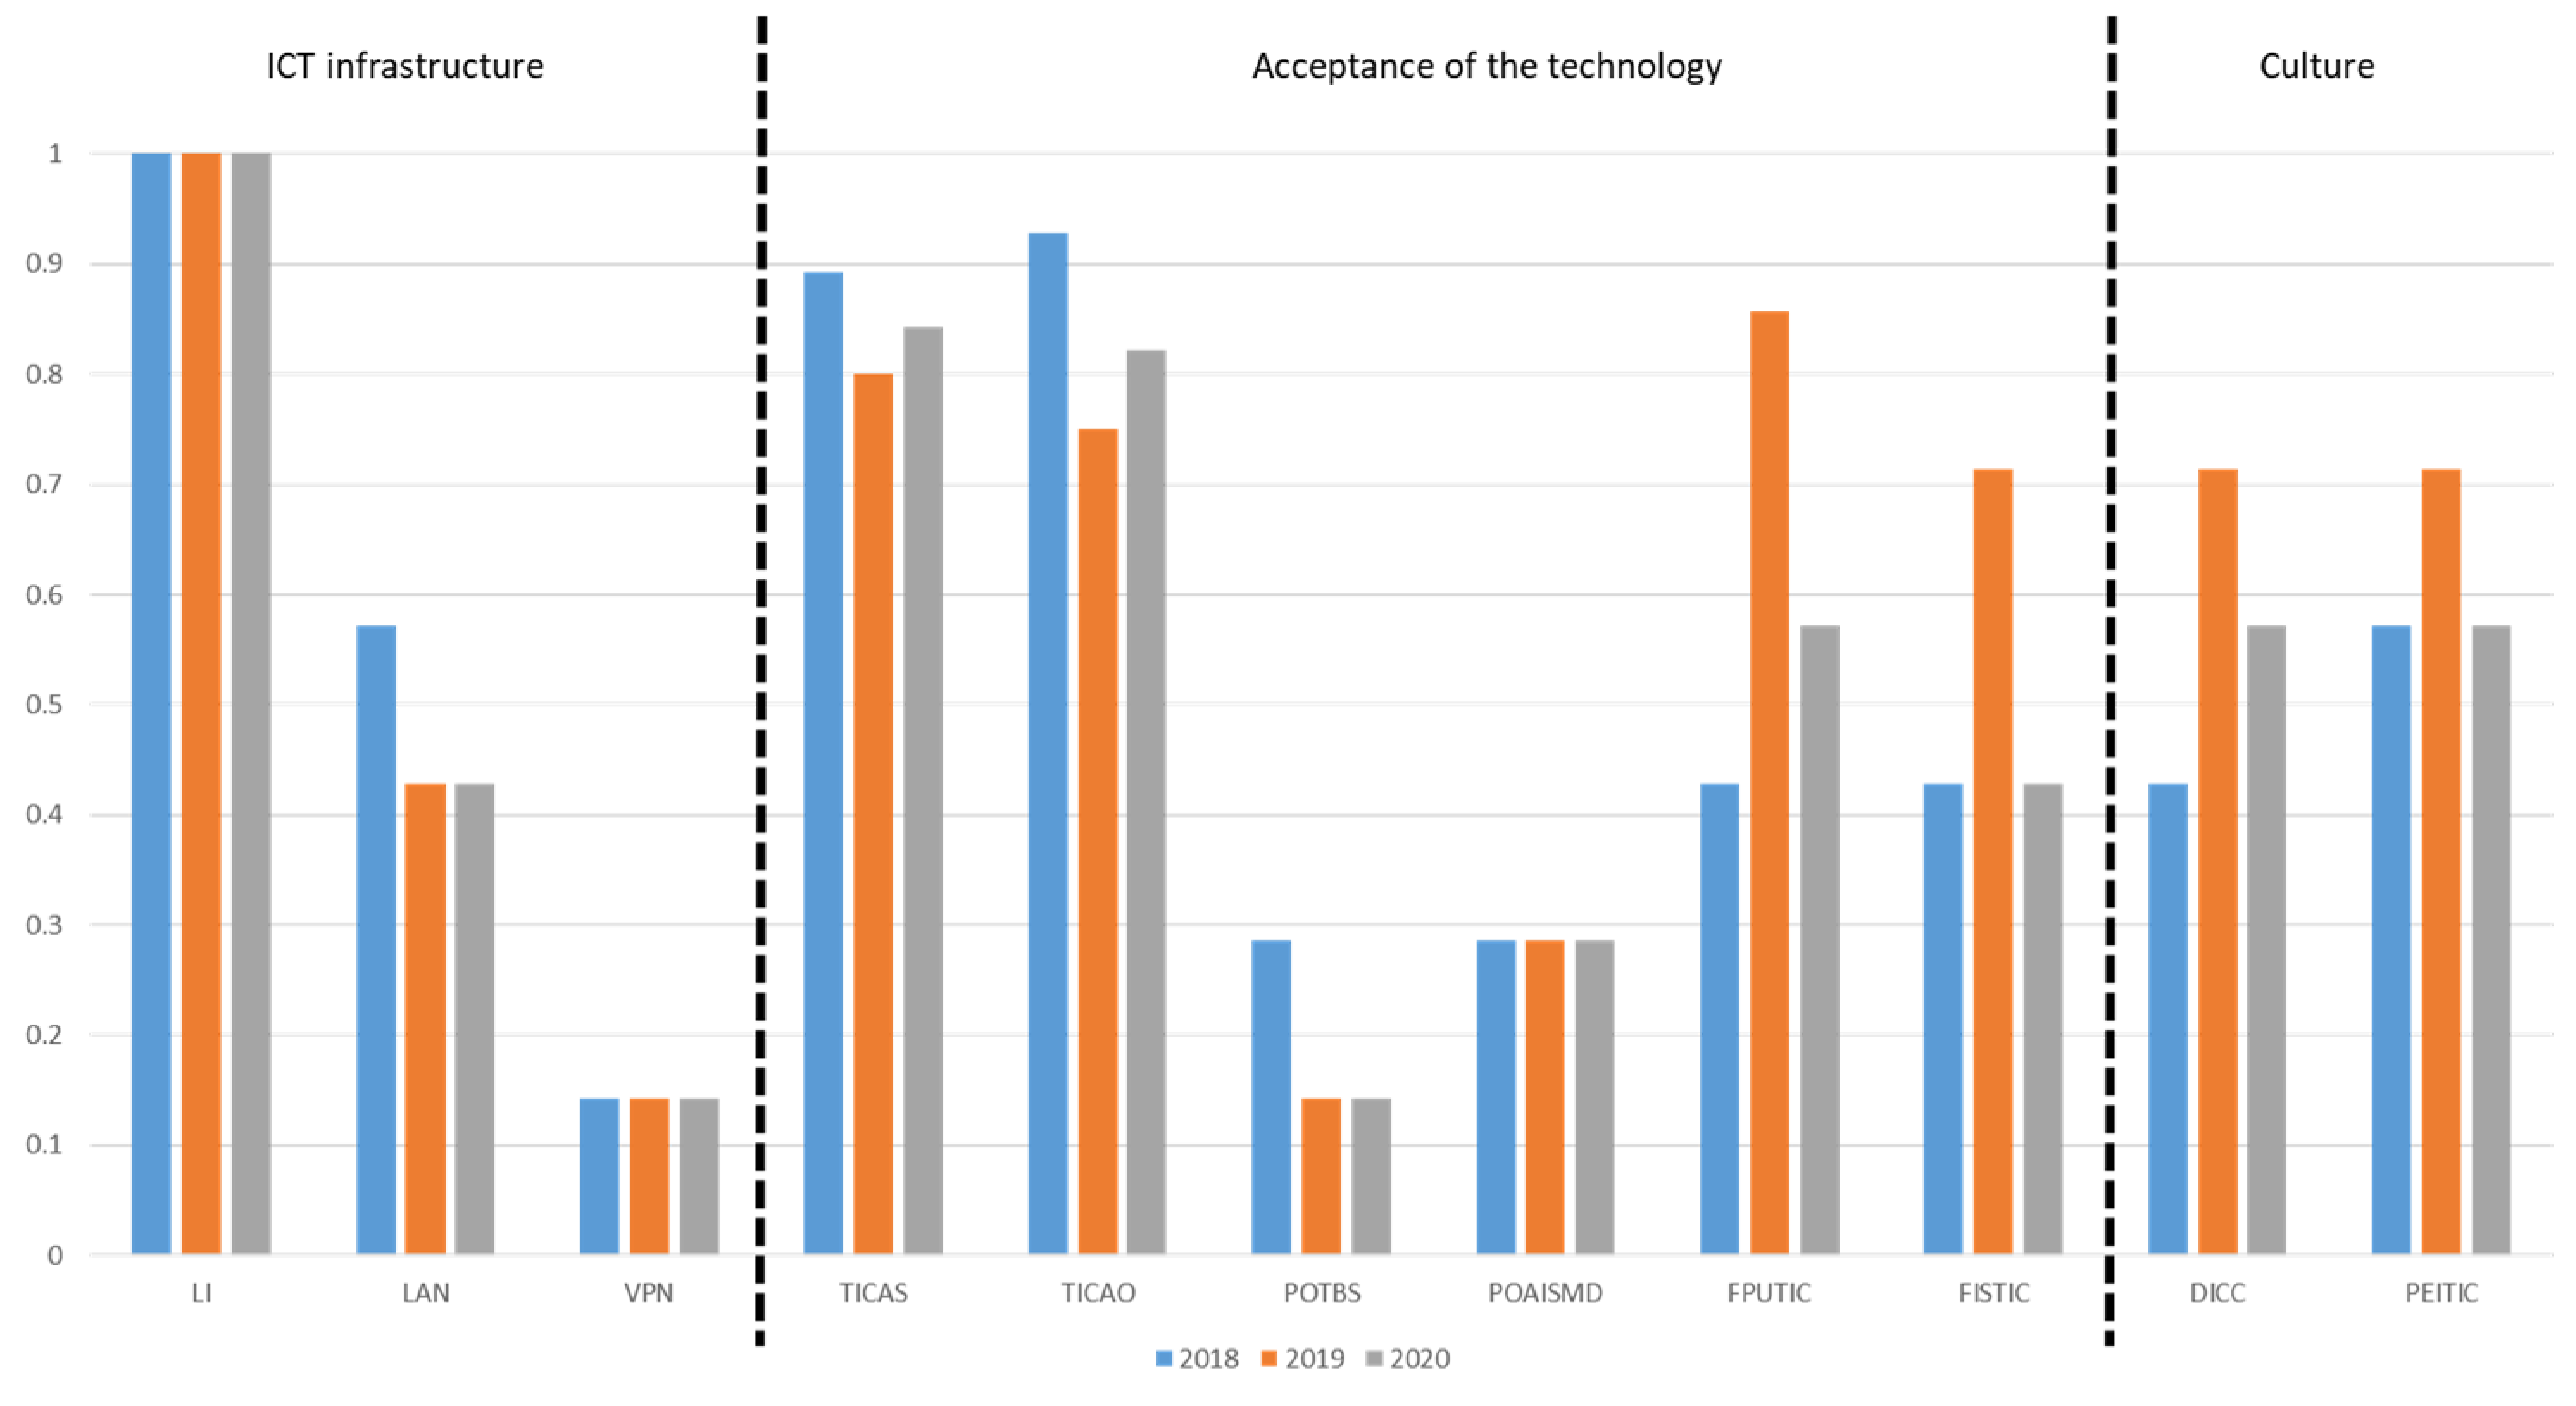
Figure 9 shows the results of the indicators of the progress dimension over the study period, considering the sub-dimensions ICT infrastructure, acceptance of the technology and culture.
From its analysis and with regard to the ICT infrastructure sub-dimension, a great disparity in behaviors can be verified regarding the adoption of new technologies, with insignificant values being found for the VPN (virtual private network) indicator, which indicates that only about 14% of the IPSS in the pilot test give access via a virtual private network. The percentage of IPSS that own local area network (LAN), although it decreased in 2019 and maintained the same level in 2020, is, for those years, 43%. As for the LI (connection to the internet) indicator, it appears that all IPSS had this connection in the three years studied.
Legend: The ordinate axis represents the indicators of the sub-dimensions of the progress dimension (ICT infrastructure; acceptance of the technology; culture). The abscissa axis represents the average of the responses obtained in the pilot test entities for the remaining indicators. The average ranges from 0 to 1.
When the results of the acceptance of the technology sub-dimension are observed, it is verified through the indicators TICAS (ICT in support activities) and TICAO (ICT in operational activities) that the IPSS in the pilot test already use ICT in the development of their activities, although, from a time point of view, these indicators have decreased slightly compared to 2018. In line with these results are also the results for the FPUTIC (facilitator in the promotion of the use of ICT) and FISTIC (facilitator of interaction with stakeholders through ICT) indicators, in which the IPSS are assumed as facilitators of ICT, and these indicators had the highest value in 2019, at 86 and 71%, respectively. The decrease in this indicator could mean that there was not the expected adhesion by the stakeholders, or even that the IPSS were unable to maintain the same position. In this sub-dimension, the indicators POTBS (online platform for trading goods and/or services) and POAISMD (online platform for attracting social investors) reveal that the IPSS in the pilot test still use these platforms very little. Regarding the presence of these entities on the Internet, according to INE [
4], in 2018, 49.7% of the entities in the social economy sector did not have a website or electronic page.
Finally, in the culture sub-dimension, the indicators DICC (dissemination of the cultural identity of the community) and PPEITIC (promotion of intergenerational experiences through ICT) reveal an interesting level of involvement and show that the IPSS in the pilot sample promote the dissemination of experiences through of ICTs, with 2019 being the year in which the highest percentage of IPSS do so (about 71%). From our point of view, the fact that there is a decline in 2020 may be related to the pandemic, which may be due to the lack of conditions required to carry out activities in this forum, given the great demands placed on this type of entity.
In summary, there are no major disparities in the indicators by sub-dimension, but the most accepted sub-dimension is culture, which uses technology to promote the organization’s cultural identity in the community. From a time perspective, the general trend is for improvement until 2019, but there is a significant setback in the year 2020, with most indicators regressing or stagnating, which suggests that despite this dimension being a major concern of the IPSS, they were unable to maintain the effort made in 2019. Given the pandemic context, an increase in the use of new technologies would be expected. The fact that this did not happen may reflect the specificity of the sector under analysis, which privileges other dimensions.
4. Final Considerations
Based on the literature review carried out, we may verify a diversity of approaches to accountability, which impact the various dimensions of the activity of organizations in general and of the IPSS in particular. In this sense, and based on the literature review, a framework was proposed that seeks to contemplate these different dimensions of accountability and which ranges from the concern with the correct definition of the main object of an IPSS (Mission, Vision, Values), evident through the entity’s strategy and organizational profile, to its capacity to incorporate new technologies in favor of adapting to the demands arising from the digital era.
It should be noted that in the accountability assessment process, the relationship that the IPSS maintains with stakeholders, both internally and externally, is extremely relevant, fostering strong and close relationships for the benefit of the community and the sustainable development of the entity itself. Additionally, worthy of reference is the disclosure of its operation and performance, with reports of a social, economic and financial and even environmental nature. The IPSS practice in all these dimensions should be assessed and disclosed, as they are intrinsic factors of the institution and relevant to the improvement of its accountability.
With a view to creating a tool to promote accountability among entities in the social economy sector, we presented a framework with six dimensions: purpose, partners, performance, proximity, planet and progress. Each dimension was subdivided into sub-dimensions and for each one a set of indicators was created, totaling 76 indicators.
In order to assess the framework’s ability to provide information that allows the IPSS to assess their accountability individually and compared with the other IPSS, a pilot test was carried out with seven IPSS and data for the years 2018, 2019 and 2020. From the analysis of the results, it was possible to perform a diagnosis of these IPSS in the various dimensions and sub-dimensions of the framework, with the exception of the transparency sub-dimension. It was also possible to identify trends in the indicators that allow us to perceive the weaknesses and where greater intervention and effort are needed.
In terms of the purpose dimension, the need for the IPSS to improve the strategy and organizational profile was identified, through the introduction of management mechanisms that allow for greater professionalization of management, as well as the need to improve governance or through the participation of workers in the management bodies or through the professionalization of these same management bodies.
With regard to the partners dimension, the low values of the indicators of the voluntary sub-dimension are highlighted, demonstrating the low attractiveness of these entities for attracting volunteers. It was also possible to identify the need to adjust the functions performed by workers to their respective training, as well as devoting more attention to monitoring and treating the workers’ opinions.
With regard to the performance dimension, the low representation of funding via donors and social investors stands out, alerting us to the need for these entities to invest in attracting this type of funding. It was also possible to identify an excess of short-term financing that requires improvement in the financial function of these entities.
Regarding the proximity dimension, it was possible to identify a significant contribution of the IPSS to the community in which they operate, namely through employment and partnerships.
In terms of the planet dimension, it was possible to identify the concern of the entities involved in the pilot test with respect to the preservation of the environment, but that still does not take place in terms of energy efficiency measures, possibly due to the financial restrictions to which they are subject.
Finally, with regard to the progress dimension, it was possible, in general terms, to identify an improvement from 2018 to 2019, but which stagnated or regressed in 2020. Therefore, in this field, there is a significant way to go.
Considering that the years under analysis include the beginning of the pandemic, some of the variations identified can be explained by this condition. In this context, variations were identified in the partners dimension in terms of worker turnover, which could represent a possible negative effect of COVID-19. This result crosses with the job creation indicator, in the proximity dimension, which may have increased in 2020 due to the necessary responses to the pandemic. It is also possible that the setback of indicators related to the progress dimension is linked to the COVID-19 effect, which forced these entities to focus on other aspects that became more urgent during the pandemic period.
On the other hand, the performance dimension does not seem to have suffered significant effects from COVID-19, possibly because support was granted by the State that allowed, in this period, to alleviate the difficulties felt in the context of a pandemic. Additionally, in the evolution of the purpose and planet dimension indicators, it does not seem to have been affected by the pandemic caused by COVID-19.
The framework designed can enable, beyond the diagnosis based on the results obtained from the indicators, the modernization of the social economy sector. This is because, after the diagnosis phase, it is possible for each institution to introduce the necessary improvements to make accountability feasible, which is imperatively required, with the ultimate goal of fulfilling its mission and individual and collective sustainability.
From the pilot test carried out to test the framework’s output, it was possible to perform a diagnosis of the different dimensions, identifying trends even in non-financial aspects, such as low attractiveness to volunteers or strong connection to the local community. Thus, the conclusions that could be drawn even from this small sample allow us to argue that the framework designed answers the research question: how can we promote accountability (social, financial and economic) in the social economy sector, in particular in the case of IPSS? However, as this is an exploratory article, it incorporates the limitation that this is a pilot test with only seven entities (even though 3 years of data were collected and processed in each of the pilot test entities). In this sense, future work proposes the collection of data from a larger number of entities to calculate the indicators with the objective of assessing whether the framework fulfils its objective—the assessment of the accountability of entities in the social economy sector, particularly IPSS. Additionally, it will be interesting to question the entities to know if individually the framework fulfils their needs to evaluate their accountability.


 ,
, 


