1. Introduction
The longitudinal connectivity of river flows is essential for fish survival and dispersal [
1]. However, with more hydropower dams and river regulation sluices constructed, river fragmentation has become an environmental issue in many countries. This concerns not only large rivers, but also small streams. If not properly managed, it would lead to a drastic descending trend in population, or even extinction, of riverine species [
2,
3]. A fishway is conventionally utilised to mitigate the adverse impacts of these in-stream structures and to restore the habitat connectivity [
4].
A fishway is an artificial structure facilitating fishes to pass the barriers and migrate up- and downstream. There are different types of fishways, such as vertical slot, rock-ramp, and climbing passes [
5]. For a given project, the choice of fishway type usually depends on a number of factors, inclusive of water head, space available for construction, and fish species. A pool and weir fish pass is an old, yet commonly adopted, structure in low-head hydropower projects [
6]. It consists of multiple pools segmented by cross-walls, referred to as weirs [
7]. Pools and weirs contribute to significant flow mixing and resistance, thus creating suitable hydraulic conditions for both passage and rest [
8]. Easy in construction and maintenance, this type of fishway draws attention in both research and practice [
4]. Even its modified versions are seen in engineering practice.
For a pool and weir fishway with orifice, Rajaratnam et al. [
9] present experimental results of its hydraulic features, with a weir-type flow analysis to characterize the plunging flow regime. The streaming flow behaviour is elucidated through a surface-stream analysis; a criterion is established to describe the transition from plunging to streaming flow. Guiny et al. [
10] modify the conventional layout and incorporate vertical slots, orifices, and weirs in a fish pass. They find that the submerged orifices and vertical slots exhibit higher fish attraction efficiency than the overflow weirs. Yagci [
11] perform laboratory experiments of a pool-weir fishway combined with orifice and notch, in which its three-dimensional (3D) mean flow and turbulence structure are explored. It is shown that the energy dissipation per unit volume is linearly correlated with the flow discharge. Considering the swimming ability of different fish species, whether or not the given design conditions provide suitable flow patterns is checked. Silva et al. [
12] compare straight orifices with and without a deflector and find that the offset-orifice layout gives rise to the highest passage rate among the examined layouts.
Studies of nature-like fish passes indicate the possibility to improve the passage efficiency by prolong the weir crest [
13,
14,
15]. This is achieved by folding the crest in plan view, resulting in a configuration referred to as labyrinth weir. In this context, the piano key weir, developed from the labyrinth version and with a rectangular planform, is also included. The overflow weir length thus becomes 3–4 times that of the linear weir. Used as a spillway option for flood discharge and regulation of reservoir water stages, such a weir is superior to traditional gated spillways. Being a cost-effective solution, labyrinth weirs are adopted in many dam projects, both new and existing [
16,
17]. The labyrinth weir even finds its applications in land drainage and urban sewage systems. As an alternative arrangement in a fishway, its use is, however, limited, particularly in a pool-weir type.
Bearing in mind the advantageous features of the labyrinth weir, the present study incorporates this type of weir into a pool-type fishway, thus introducing an alternative design. The main contribution of this work is to explore the effectiveness of new weir configurations in pool-type fishways, which is limited in the literature. Previous studies mainly focus on straight weirs, while this paper examines the feasibility of labyrinth weirs, aiming to improve the flow conditions for fish migration. In a spillway, a labyrinth weir is usually long in the dam axis direction, comprising a number of identical units. For a fishway, one or two units will suffice. Based on previous laboratory experiments of the conventional design, CFD modelling is performed to evaluate the proposed weir layouts and make comparisons with reference to the conventional one. The objective of the study is to achieve improvements in the hydraulic conditions of fishway and facilitate upstream fish movement.
2. Labyrinth Weir Layouts
There are studies, though limited, that demonstrate the potential of a labyrinth weir in improving the performance of a pool-weir fishway. Dizabadi and Azimi [
18] find it suitable for a variety of species because of its diversified flow fields. For low-head projects, Savage and Brenchley [
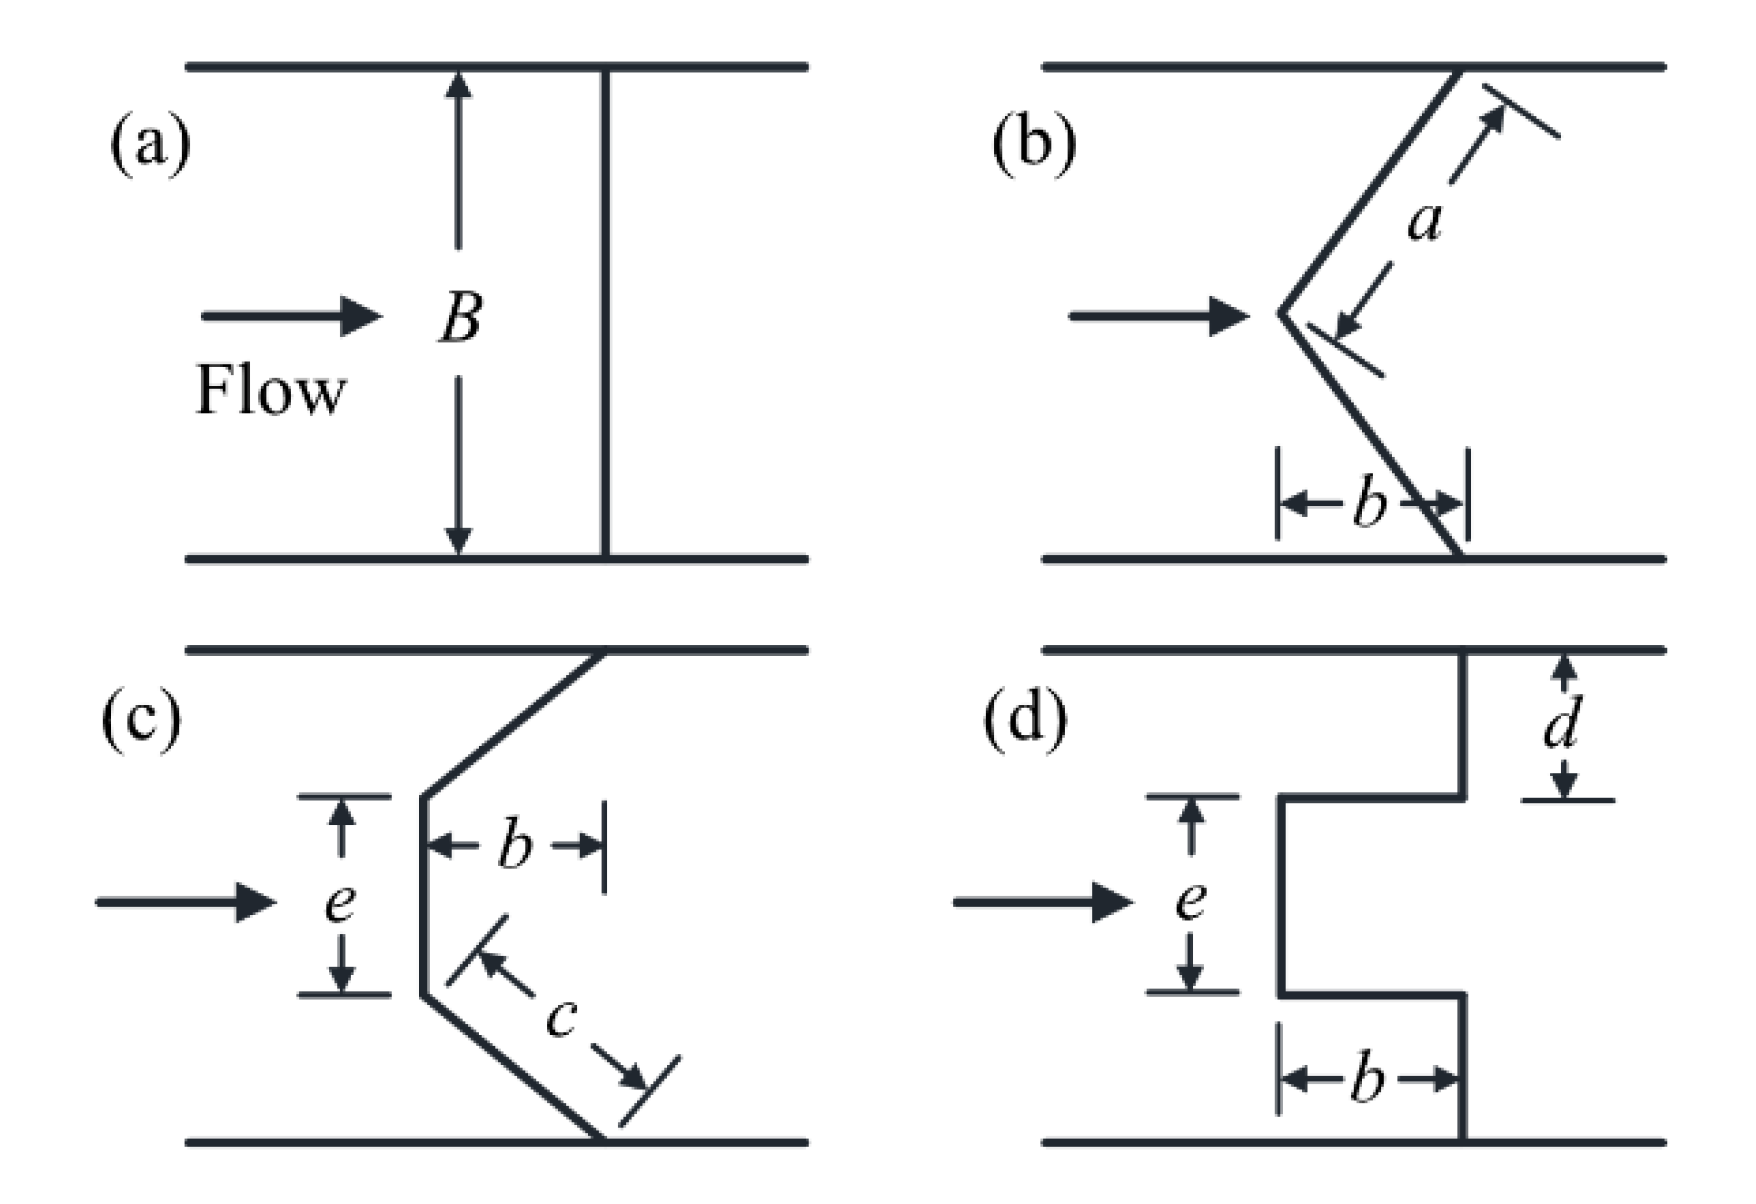
19] conceive a fish pass with a broad-crested labyrinth weir, in which conducive regions for migration are created. Such regions are lacking in the conventional weir. A labyrinth weir is generally classified into three types: triangular, trapezoidal, and rectangular. Based on this, three layouts are devised for incorporation into a pool-weir fishway. Together with the conventional one with straight walls, they are illustrated in
Figure 1. All the weirs are vertically placed.
Ead et al. [
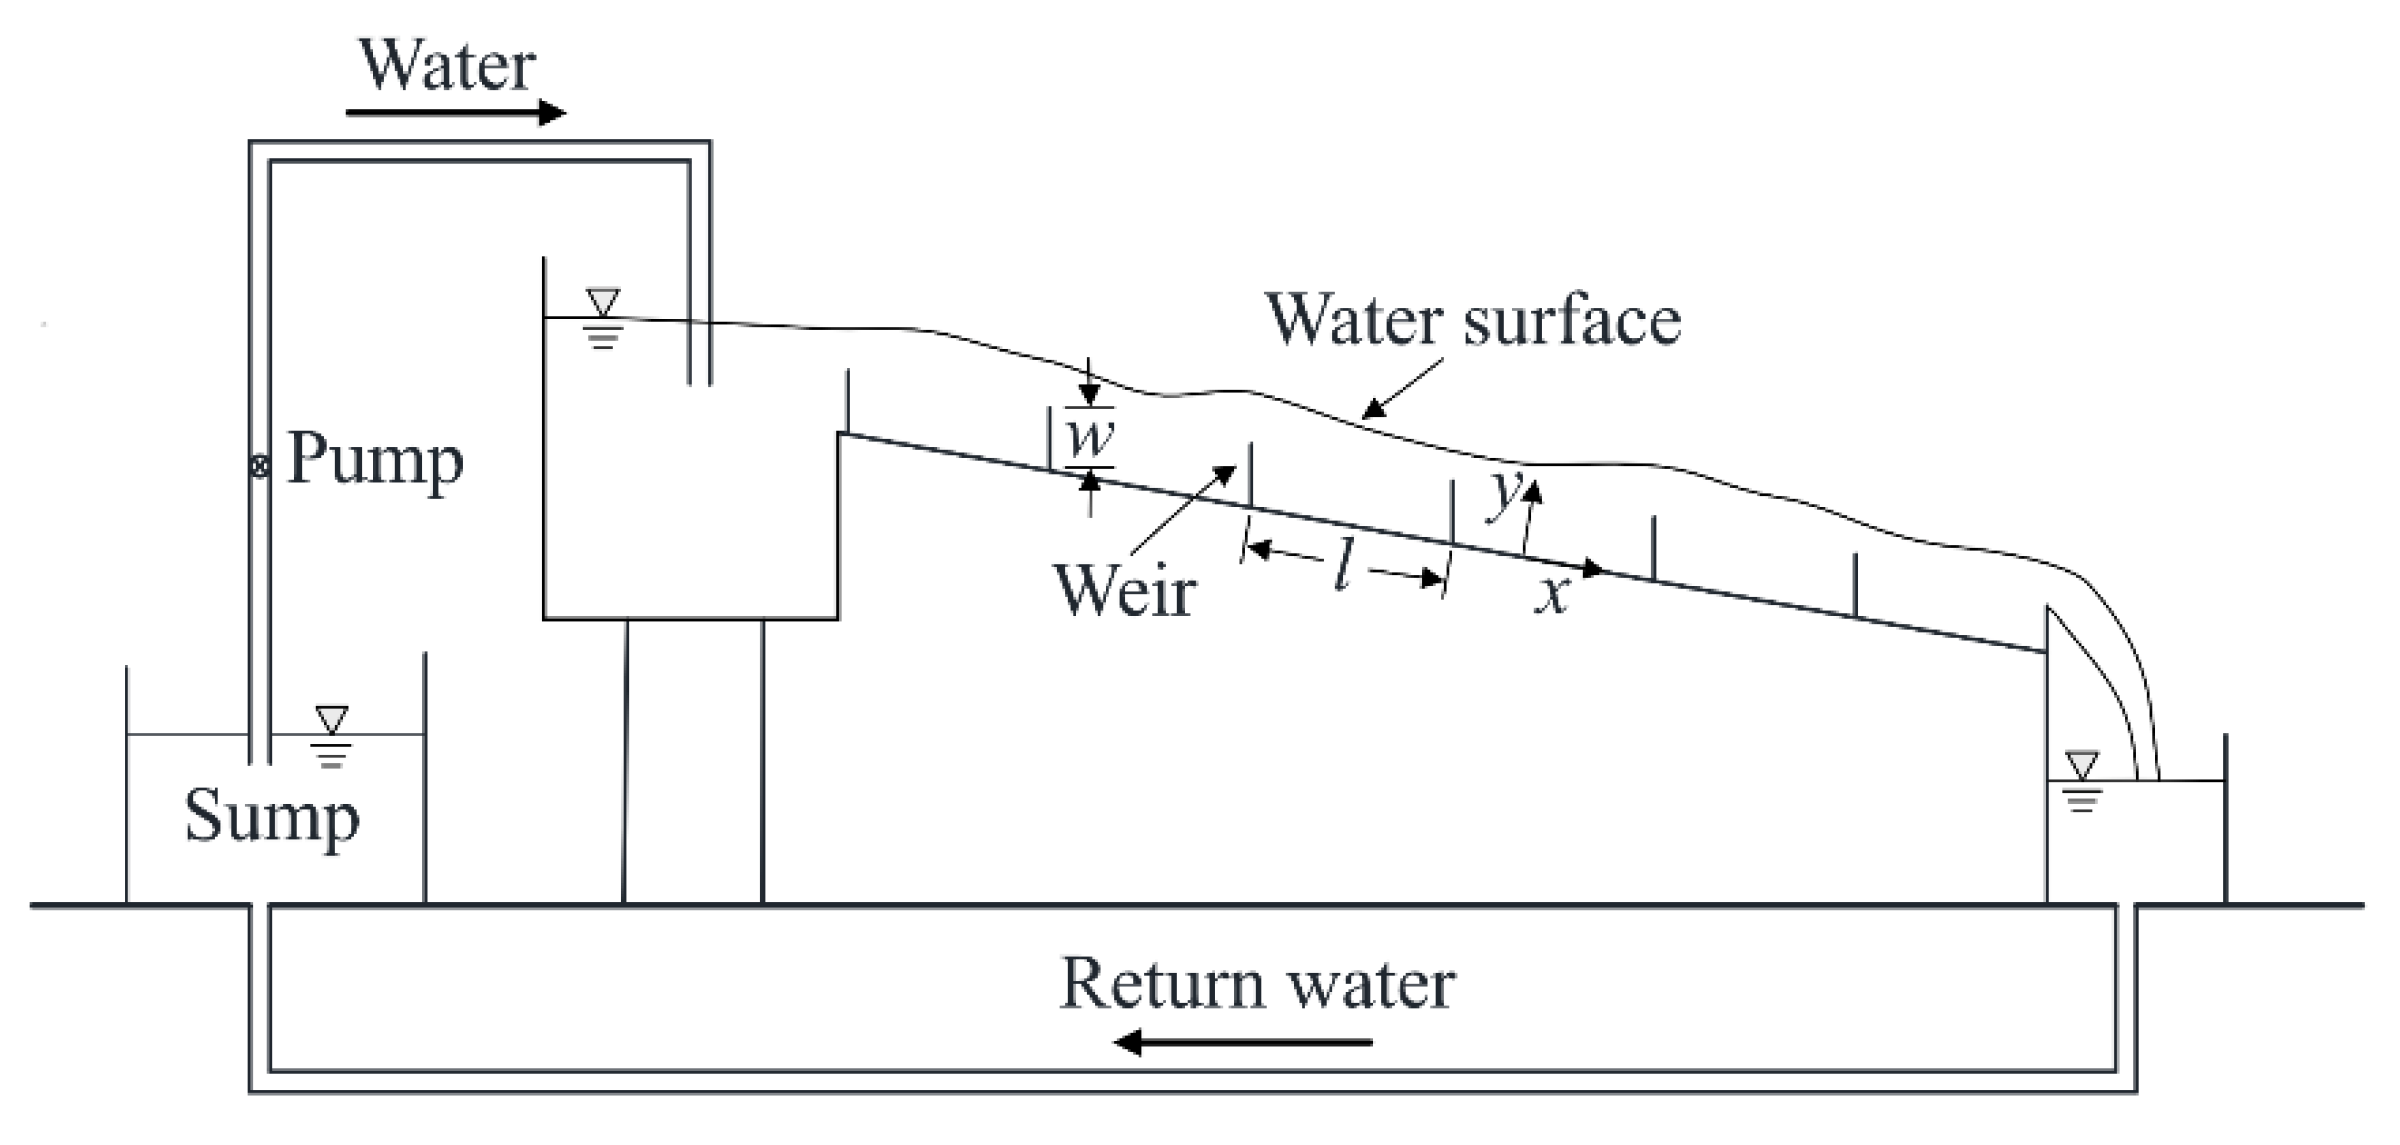
20] performed laboratory experiments with a conventional pool-weir fishway. Its layout is shown in
Figure 2. The test flume was placed between two water tanks, in each of which an overflow side was provided to guarantee constant water stage at a given flow rate. The water was circulated from the underground reservoir into the upper tank. The flume was constructed with aluminum bottom and Plexiglas sidewalls, measuring 600 cm long, 56 cm wide, and 60 cm high. The flow rate in the rig was measured with a magnetic flowmeter of high accuracy, water-surface levels with point gauges and flow velocity with a propeller probe. Documentation of both the experimental arrangement and results are detailed; their study is, therefore, used as a basis for model calibration.
The numerical model is calibrated against the test results of the conventional layout by Ead et al. [
20], in which 10 weirs are tested. With symmetry in cross-section, the proposed labyrinth weirs are dimensioned to fit into the experimental flume, so that their effects on flow behaviours are examined and comparisons are made with the conventional one. The major geometric properties include channel slop
S = 5.0%, weir height
w = 7.4 cm, weir spacing
l = 68.5 cm, and weir width
B = 56.0 cm. In the flow direction, the three labyrinth weirs are assigned the same offset,
b = 20.0 cm. The trapezoidal and rectangular weirs are given the same front width as the offset, i.e.,
e =
b = 20 cm. Each weir covers the whole flume width. The other resulting parameters are
a = 34.4 cm,
c = 26.9 cm, and
d = 18.0 cm. All the weir dimensions are fixed in the simulations.
3. Numerical Simulations
CFD simulations are carried out to examine the effects of the labyrinth weirs in the fishway. The
k-
ε turbulence model is used to produce the flow field; the Volume of Fluid (VOF) method is employed to track the air-water interface. The simulations are performed in 3D, covering the whole flume width. An (
x,
y,
z) coordinate system is set up, with its origin (0, 0, 0) on the flume bottom and along the symmetry plane. The
x coordinate is on the flume bottom, with positive
x pointing downstream in the flow direction; the y coordinate is perpendicular to the bottom, with positive
y pointing upwards (
Figure 2). The governing equations are described as follows.
3.1. Governing Equations
The
k-
ε turbulence model is a robust model in producing key flow features of turbulent flows, such as velocity and turbulence. Previous studies have demonstrated its reliability in investigating fishway hydraulics [
21,
22]. Its governing equations include the turbulence kinetic energy (
k) equation
and the turbulence kinetic energy dissipation rate (ε) equation.
in which
ρ = flow density,
ui = velocity component (
i =
x,
y,
z),
t = time,
μ = dynamic viscosity,
μt = turbulent dynamic viscosity,
Gk = generation of turbulent kinetic energy due to mean velocity gradients,
Gb = generation of turbulent kinetic energy due to buoyancy,
YM = contribution of the fluctuating dilatation in compressible turbulence to the overall dissipation rate,
σk = turbulent Prandtl numbers for
k, and
σε = turbulent Prandtl numbers for
ε.
Sk and
Sε = user-defined source terms. The default model constants are
Cμ = 0.09,
σk = 1.0,
ε = 1.3,
C1ε = 1.44,
C2ε = 1.92, and
C3ε = 1.0.
In the VOF approach, a set of momentum equations is shared by the two phases of water and air. The VOF of each phase is calculated for each cell in the domain. Water is treated as primary phase and the air as secondary phase. Tracking the free surface is achieved using the geometric reconstruction approach,
and the continuity and momentum equations are
in which
αw = volume fraction of water and
P = pressure.
3.2. Model Setup
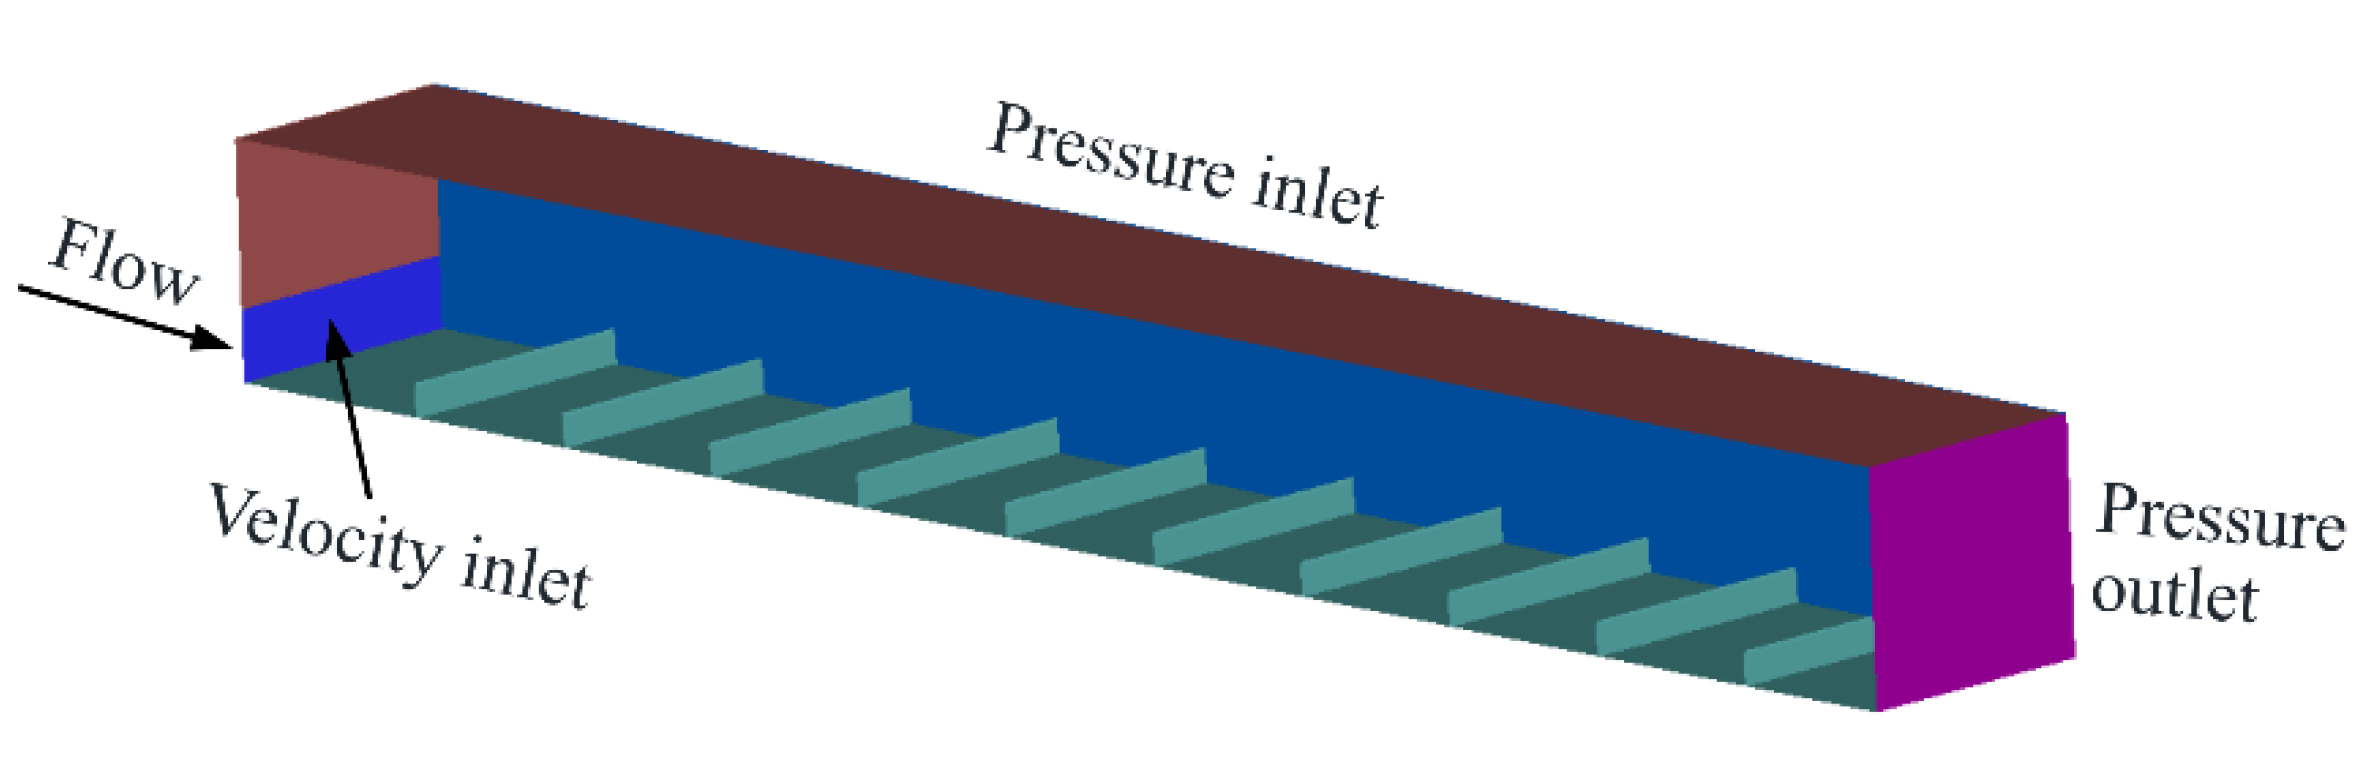
The computational domain starts from the cross-section 1.5 L upstream of the first weir and ends at the cross-section 1.0 L downstream of the last weir (~8 m in total). Its upper boundary is well above the free water surface. To achieve reliable results, it is essential to generate a high-quality grid with minimal discretization errors. The domain is meshed with a structured hexahedral grid. A higher mesh density is given to near-wall regions and areas around the free surface and the weirs.
As illustrated in
Figure 3, the upstream boundary is defined as velocity inlet (for both water and air), its top surface as pressure inlet, its downstream exit as pressure outlet, and the remaining boundaries (sidewalls, bottom and weirs) as wall.
The simulations are performed in ANSYS Fluent. Based on the finite-volume method, the governing equations are, in a given cell, solved with the SIMPLE algorithm for the coupling of pressure and velocity. For solutions of
p and
αw, the PRESTO! and Geo-Reconstruct techniques are used [
21,
22]. The second-order upwind scheme is applied for the momentum. The first-order upwind scheme for the turbulence kinetic energy and dissipation rate. The experimental parameters used for the model verification are presented in
Table 1, where
Q = flow rate in the flume.
3.3. Model Calibration
Based on the conventional pool-weir fishway in Ead et al. [
20], the numerical model is first validated, a necessary procedure, so as to obtain reliable results for other simulations. The calibration comprises both grid independence check and comparison with experimental data. The former is achieved by comparing the CFD results of different mesh densities. Three mesh resolutions are generated: 0.42, 0.75, and 1.30 million cells. The coarse mesh is gradually refined, both globally and locally, to obtain the medium and fine meshes. Counted from upstream, weir no. 4 is in the middle part of the flume, affected in an insignificant manner by the upstream boundary. The latter refers to comparisons of the test and numerical tests for weir no. 4. For the medium-sized grid, its bottom pressure (
p) and streamwise velocity (
ux) along the symmetry show a maximum relative error of 2.6% and 8.6%, respectively. For weirs no. 5 and 6, the grid leads to similar error levels. The medium-sized grid is considered sufficient for the simulations.
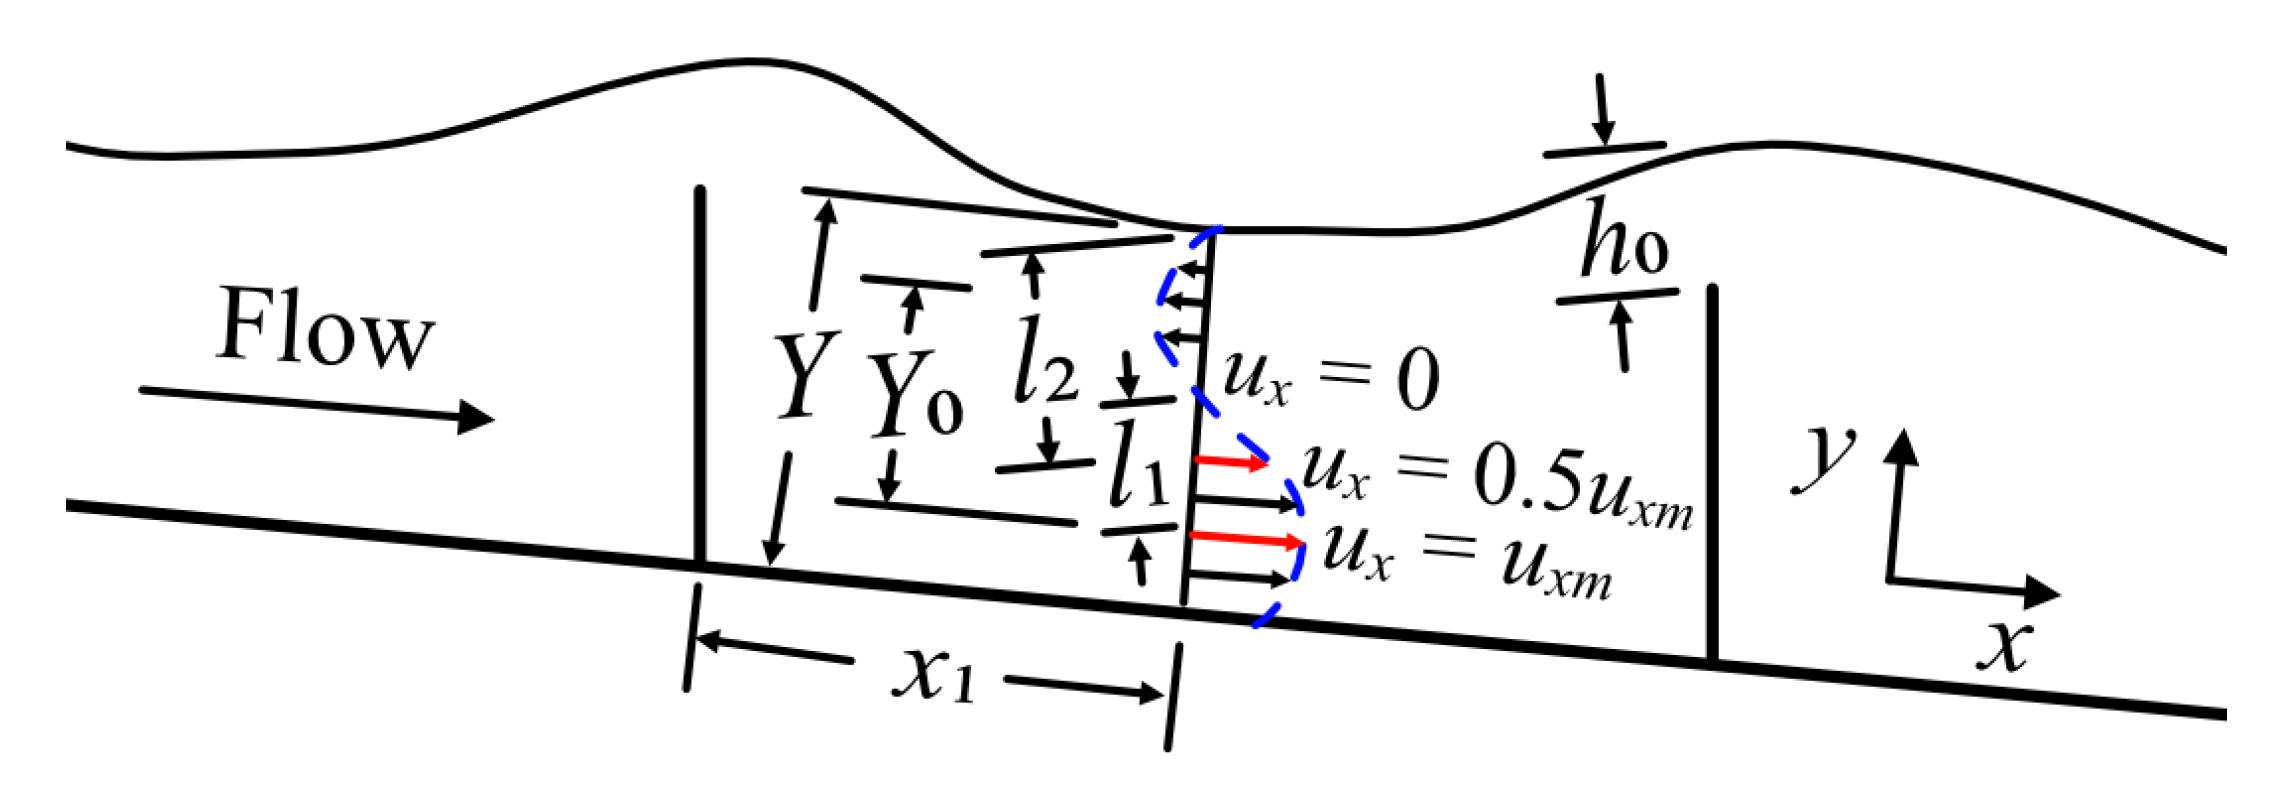
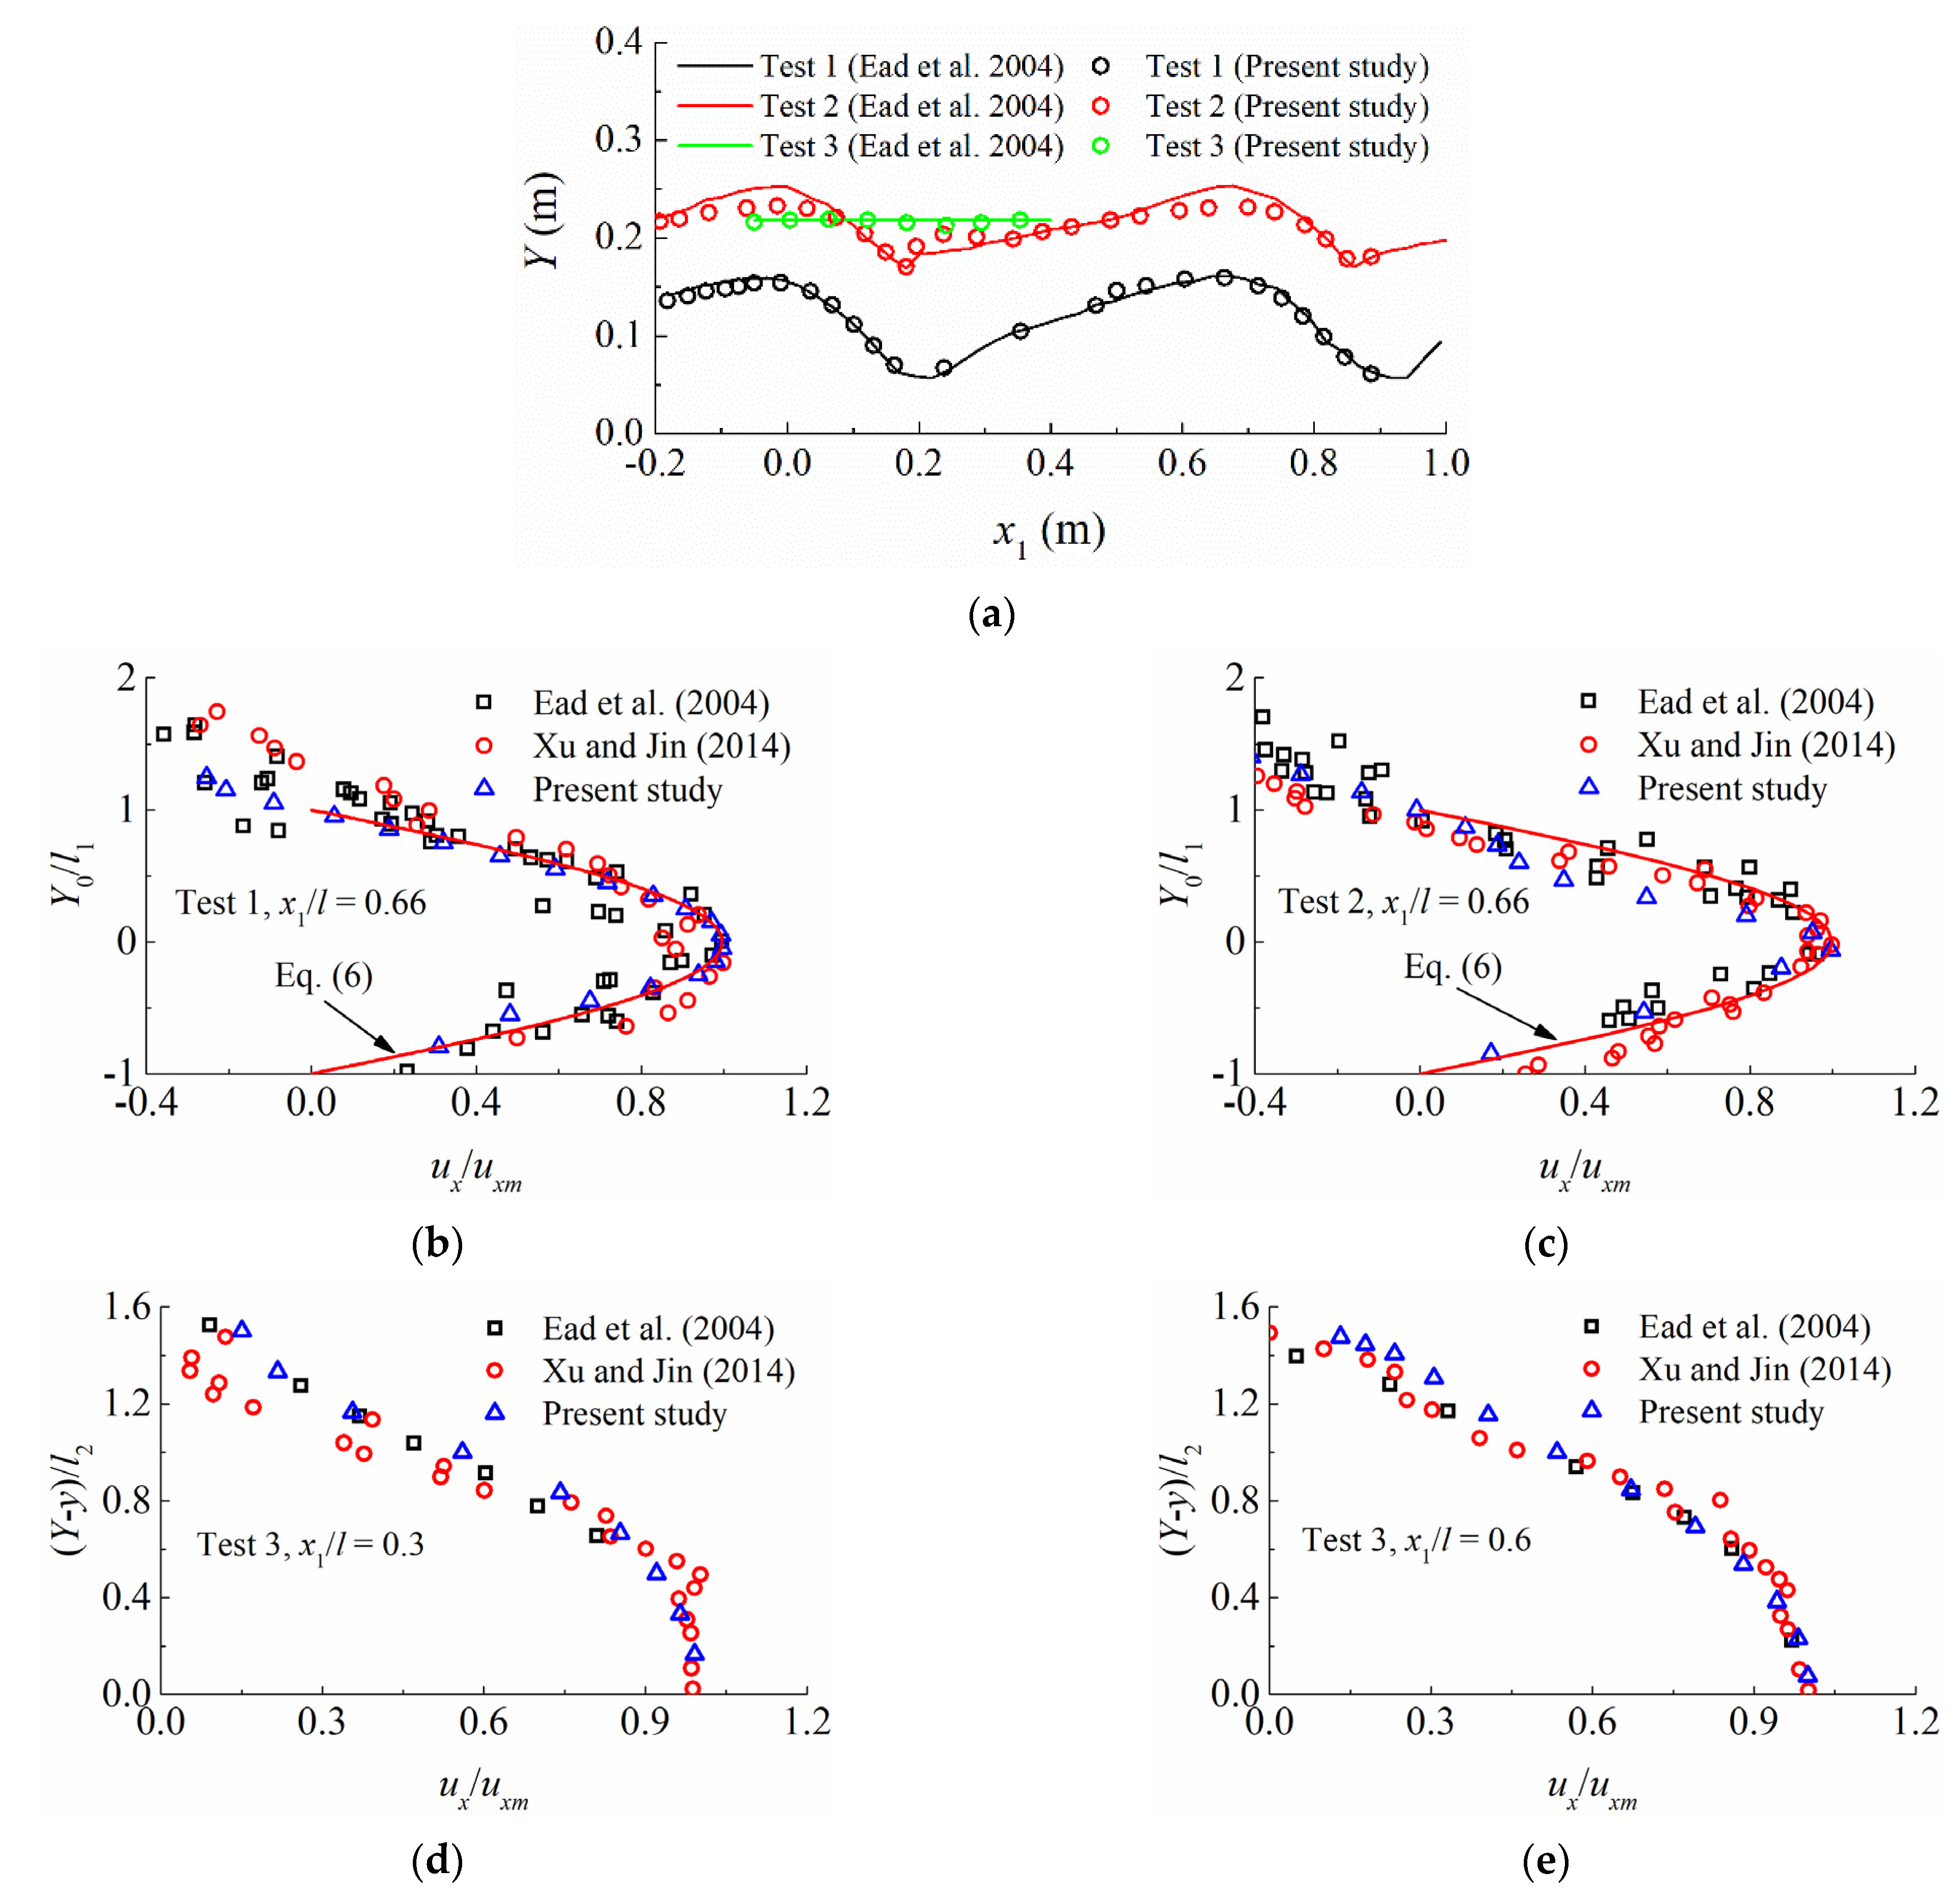
Comparisons are also made of the water depth between the simulations and measurements. As illustrated in
Figure 4, let
x1 = distance from a given weir in the
x direction and
Y = water depth (measured in the
y direction). The
Y-results are plotted in
Figure 5a. The water surfaces are in good agreement with the experimental results and the plunging (Tests 1 and 2) and skimming regimes (Test 3) in Ead et al. [
20] are well reproduced. At most locations, their differences are insignificantly small. In Tests 1, 2, and 3, their relative errors are 7.3, 9.3, and 2.7% at maximum, respectively.
With a meshless particle method, Xu and Jin [
23] performed numerical modeling of the weir flow. The comparisons here include even their results and an empirical formula developed by Ead et al. [
20]. The empirical equation in Ead et al. [
20] is written as
where
uxm = maximum value of
ux,
l1 = vertical distance between
ux =
uxm and
ux = 0 points and
Y0 = distance between a given point and the point where
ux =
uxm (measured in the
y direction) (
Figure 4). The velocity profiles in the tests are plotted in
Figure 5b−e, where
l2 = vertical distance between water surface and the point where
ux = 0.5
uxm. For Tests 1 and 2,
Figure 5b,c compare the
Y0/
l1 results at
x1/
l = 0.66. For Test 3,
Figure 5d,e plot the (
Y−
y)/
l2 results at
x1/
l = 0.30 and 0.60. It is apparent that all four sets of results demonstrate a consistent pattern. Despite the velocity fluctuations in the plunging flow, the CFD modelling is in agreement with both Ead et al. [
20] and Xu and Jin [
23].
4. Results and Discussions
With the verified model, 3D numerical modelling is performed to assess how the weir layouts affect the flows. Comparisons are made, with the purpose to evaluate their performance in terms of flow regime, velocity field, water depth, turbulence level, etc. At a given flow rate, the upstream boundary may affect the flow over the first few weirs. This effect should be negligibly small on the weirs in the central part of the flume. Therefore, if not otherwise specified, the analyses are based on the central weirs.
4.1. Flow Regime
Depending on fishway geometries and flow conditions, the flow in a pool-weir fishway is categorized into a plunging, transitional, and streaming regime [
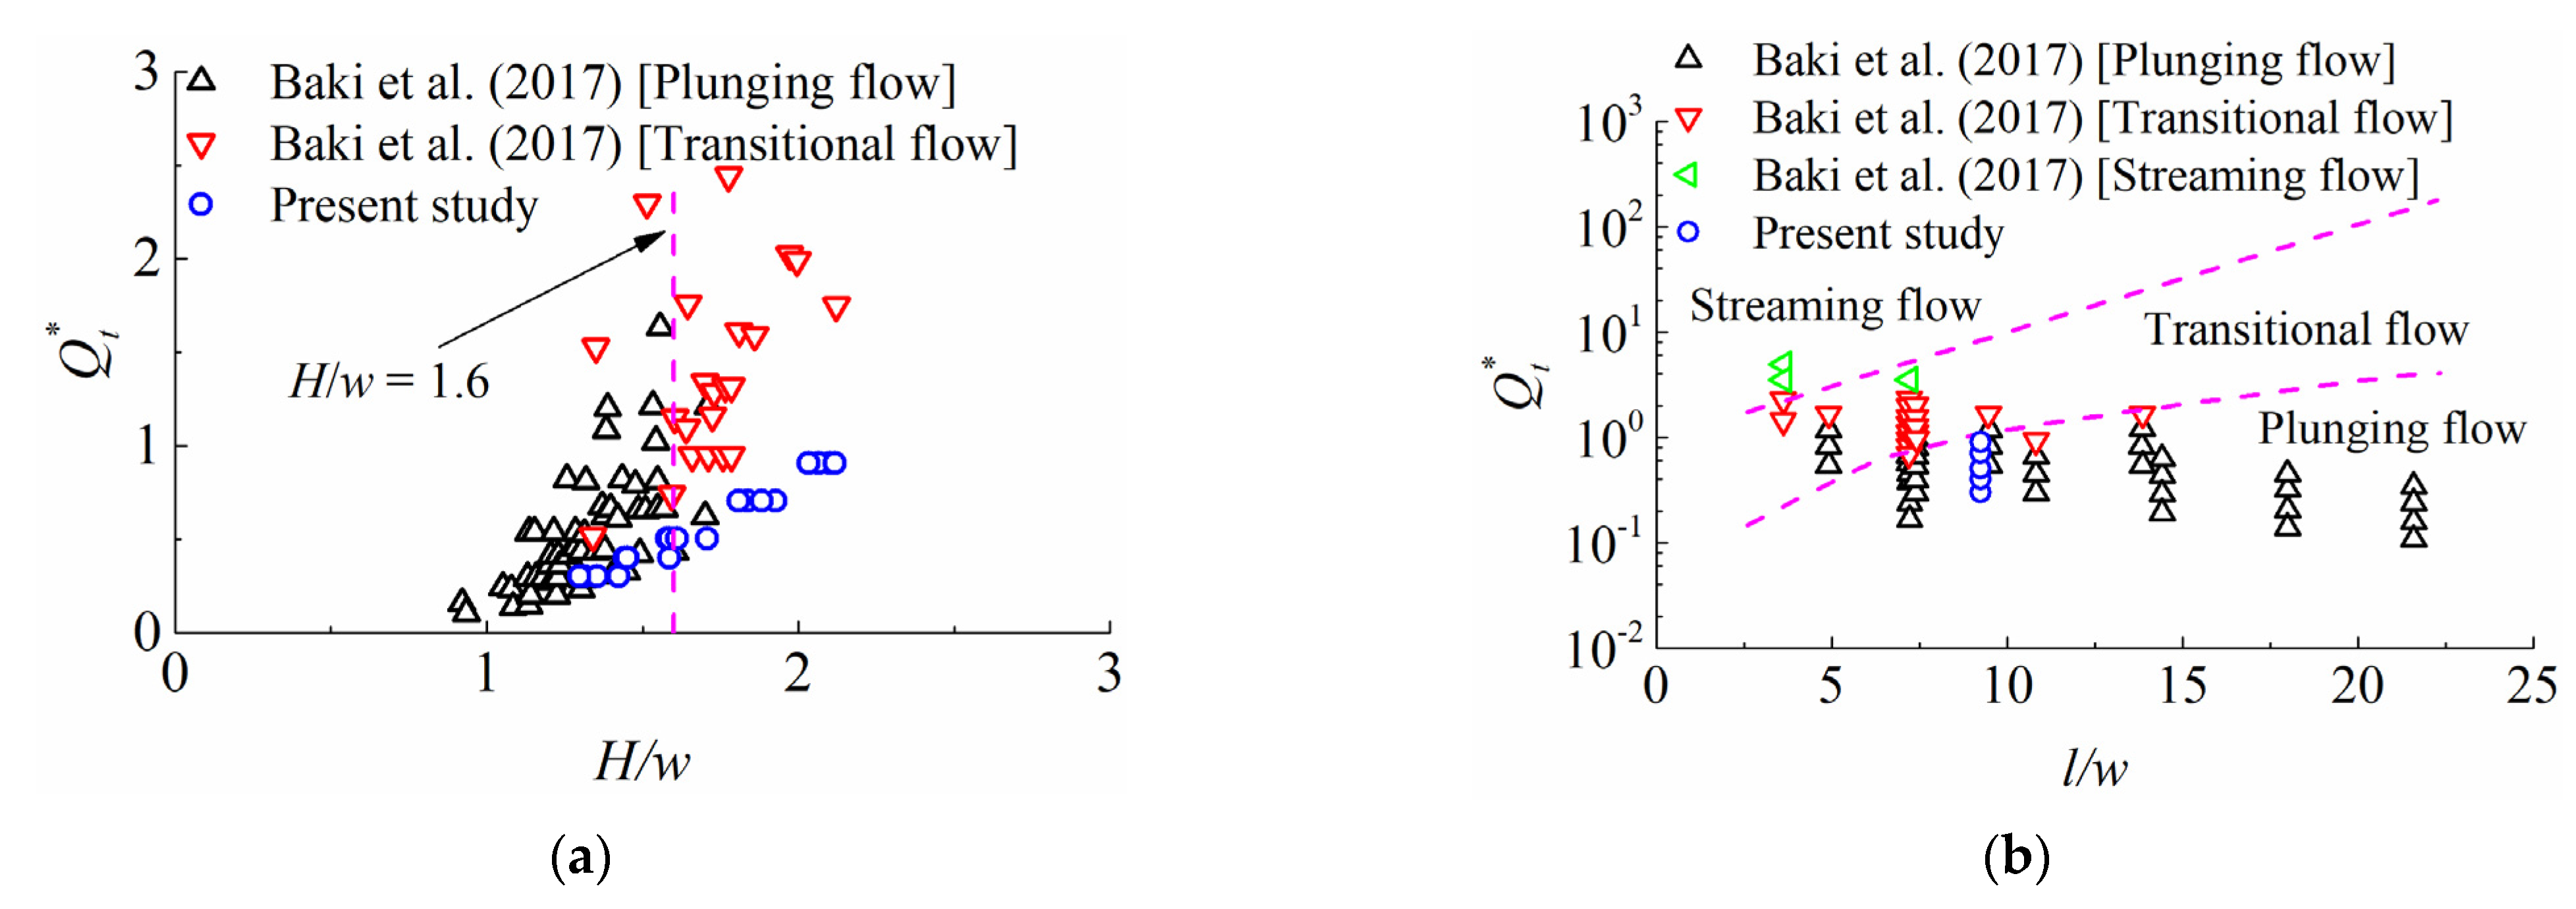
5]. In the plunging regime, the weir crest is generally above the water stage in the pool; the kinetic energy leads to overtopping of and formation of a jet over the weir. In the streaming regime, the pool water surface is above the weir crest and approximately parallel to the channel bottom. To quantify the classification criterion, Rajaratnam et al. [
9] introduce the relative submergence
H/
w and the dimensionless discharge
where
H = average flow depth in the pool and
g = gravitational acceleration. They demonstrate that plunging flow occurs if
H/
w < 1.6, and transitional flow if
H/
w > 1.6.
Figure 6a shows the consolidated regime plot based on
H/
w. The reference data from a nature-like fish pass [
14] are also included.
According to the experiments by Sikora [
24], the flow in the conventional layout in Ead et al. [
20] is in the plunging regime. The simulated water-surface results in the present study confirm their results. However, as shown in
Figure 6a, several cases are classified as transitional flow. Even in Baki et al. [
14], some cases are also misinterpreted in light of the criterion. This indicates the inadequacy of the approach.
Ead et al. [
20] develop another way to determine the flow regimes. It is suggested that the pool aspect ratio
l/
w is a parameter more appropriate than
H/
w. In comparison with the results from Baki et al. [
14], the variation of
with
l/
w is plotted in
Figure 6b. The dashed lines correspond to the boundary curves in Ead et al. [
20]. Apparently, this approach gives a reasonable prediction of flow regimes. All the simulated flows fall within the plunging flow regime.
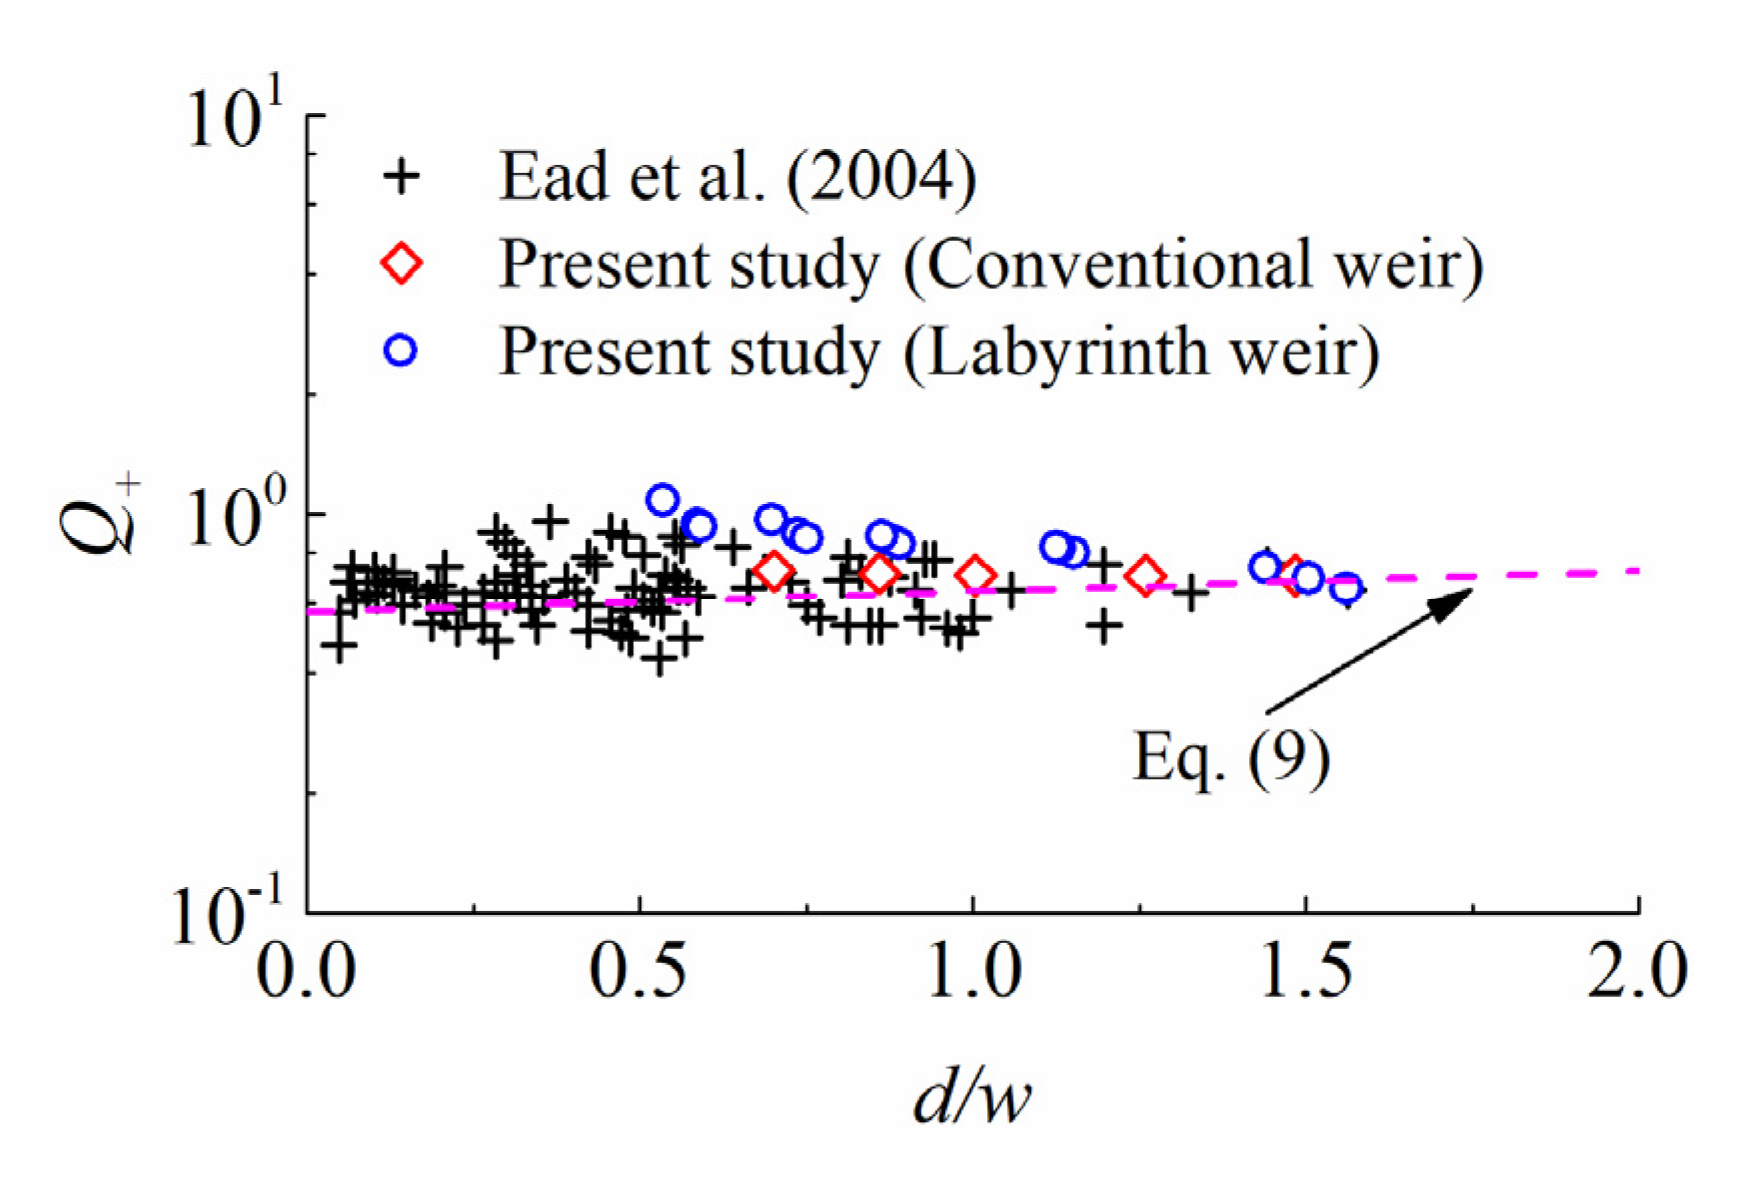
In the plunging flow, another non-dimensional discharge,
Q+, is also used to evaluate the performance of the fishway [
9]. It is a re-formulation of the water stage-discharge relationship for sharp-crested weirs, defined by
in which
d = water head over the weir and
Cd = discharge coefficient. Kandaswamy and Rouse [
25] propose a linear relationship (Rehbock’s empirical equation) between
Cd and
d/
w that reads
Figure 7 presents the relationship between
Q+ and
d/
w. For comparison, the experimental data from Ead et al. [
20] and Equation (9) are plotted in the figure. For the conventional layout, the CFD result is consistent with the experimental ones and Equation (9). If
d/
w < 1.5, the labyrinth layouts show larger
Q+ values than the conventional one. If
d/
w > 1.5, their
Q+ values are close to each other. Similar observations were made in a pool-weir fishway with square pools [
18].
4.2. Flow Field
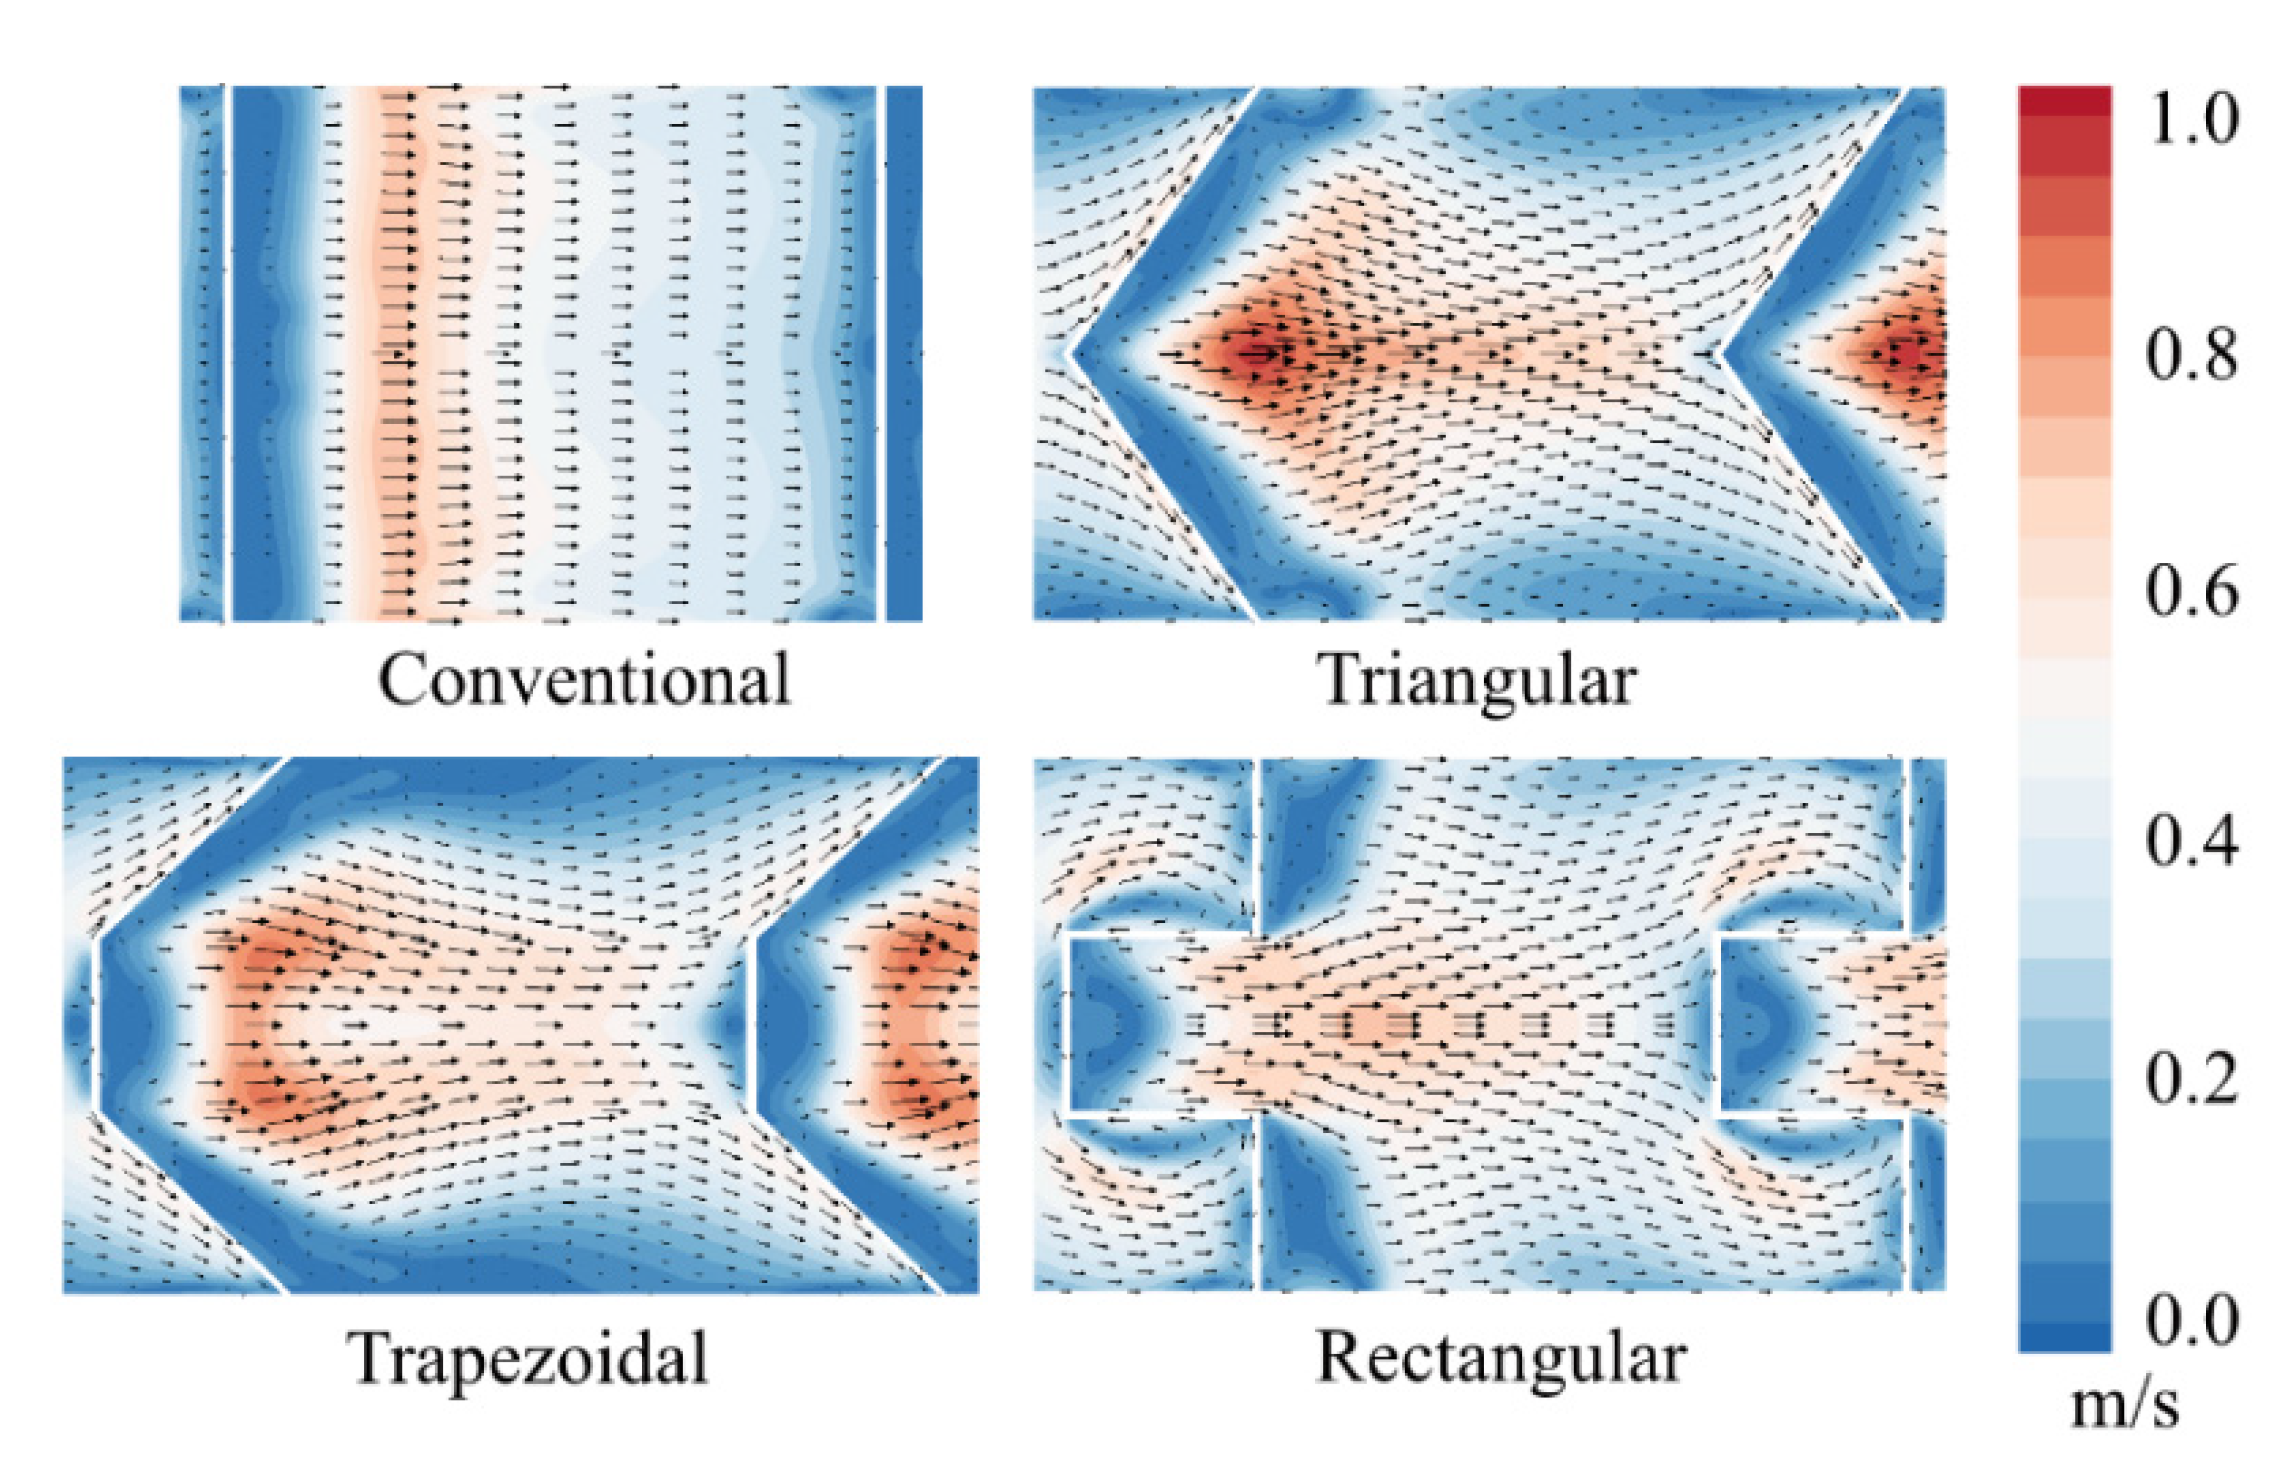
The velocity field in a pool is a proxy in fishway design, which is of close relevance to target fish species to rest and migrate upstream. At
Q = 25 L/s,
Figure 8 illustrates the velocity magnitude and vectors at cross-section
y = 0.5
w. In the conventional layout, the velocity exhibits insignificant differences in the spanwise direction. In the labyrinths, 3D patterns typify the velocity field. From upstream to downstream in a pool, both the triangular and trapezoidal layouts first converge the flow to the centre, then diverge it to the sidewalls upstream of the next weir. They have similar effects in directing flows, which is attributed to the oblique portions of the weirs. For the rectangular layout, the water is gradually directed to the sides and tends to circulate upstream of the next weir. In addition, in the conventional layout, the high-velocity zone is fairly uniform in cross-section and spans the channel width, while in the labyrinth ones it occurs in the middle of the channel. The triangular configuration exhibits the largest maximum velocity, ~1.3 times that of the conventional one. The rectangular configuration leads to the smallest maximum velocity, ~0.96 times that of the conventional.
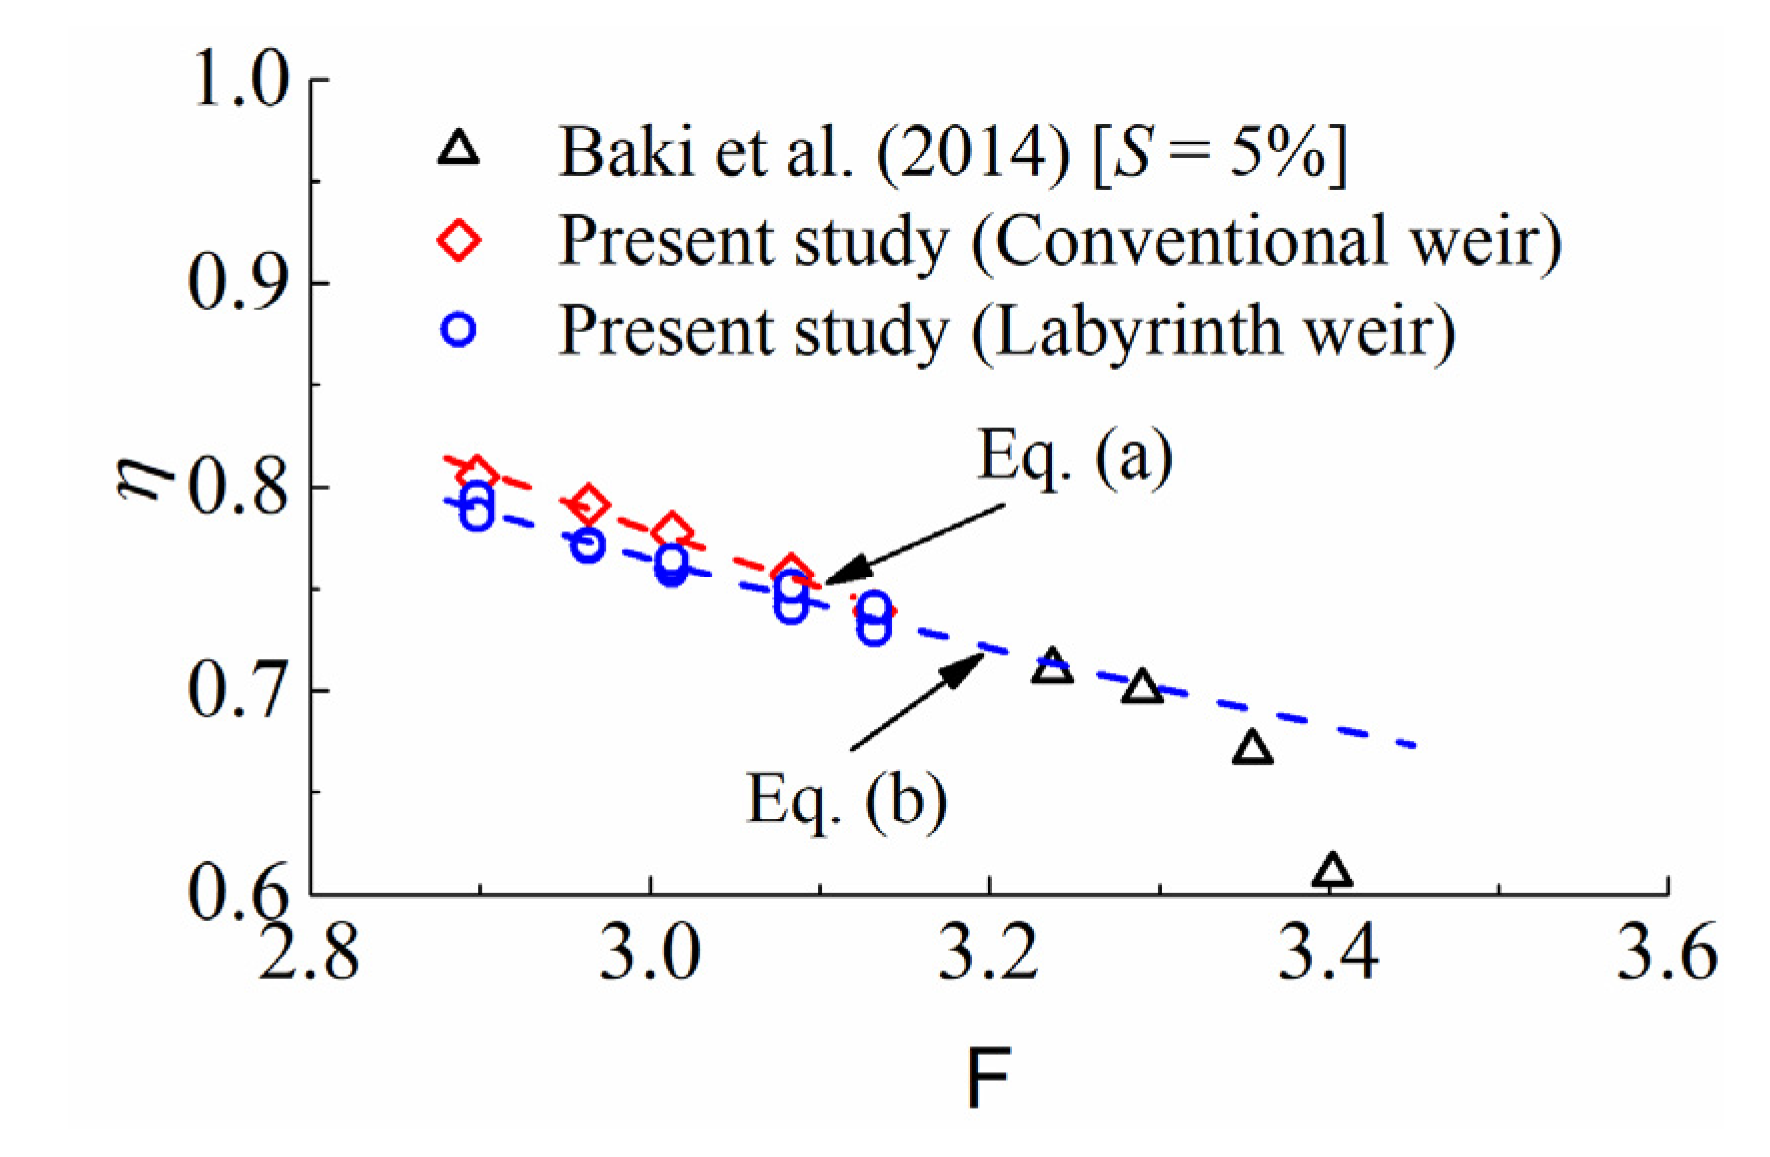
The weirs retard the flow and provide shelters for upstream migrating fish to rest. To evaluate the difference in performance, a velocity reduction factor (
η) is defined, i.e., the reduction of the depth-averaged velocity (
ū) relative to the undisturbed velocity (
u0).
The parameter
u0 is estimated in light of Manning’s equation with the roughness coefficient set
n = 0.012. The normal water depth
h0 =
Q/(
Bu0) and Froude number F =
u0/(
gh0)
0.5. For the conventional and labyrinth weirs,
Figure 9 compares the variation of
η against F. The experimental data from a rock-ramp fish pass with
S = 5% are also included [
26]. Compared with the labyrinth weirs, the traditional one is slightly more effective in reduction of the mean flow velocity. All
η data indicate a declining trend with an increase in F. They are correlated by a power curve,
η =
γF
δ, where
γ and
δ = constants are dependent on weir type. Their values are given in
Table 2 (equations a and b). At some discharges, the equation overestimates the velocity reduction in Baki et al. [
26], which is presumably related to the openings between the boulders of the fish pass.
To migrate upstream, a sufficient flow depth is needed, whereby target species make full use of their swimming capacity. For salmonid and cyprinid species, Baudoin et al. [
27] suggest the threshold values
H = 0.2 and 0.5 m, respectively. In comparison with the experiments [
26],
Figure 10 presents dimensionless water depth
H/
h0 as a function of unit discharge
q (=
Q/
B). It is noted that, at a given
q value, the conventional layout shows a lager
H/
h0 than the labyrinth ones. For example, at
q = 0.03 m
2/s, the former is ~1.08 times the latter. The relationship between
H/
h0 and
q is given by
H/
h0 =
γqδ. The
γ and
δ values are listed in
Table 2 (equations c and d). Obviously,
H/
h0 exhibits a negative correlation with
q. The tests by Baki et al. [
26] show a pattern similar to the present study. However, their
H/
h0 values are lower. Again, this is likely associated with the gaps between the boulders, passing extra water. If the fishway is applied in practice, Ead et al. [
20] suggest a 1:10 conversion scale from model to prototype. This implies that, for the conventional and labyrinth layouts, the minimum water depth is 1.06 and 0.96 m, respectively. Both are over the minimum requirement, and an operating flow rate slightly lower than 0.85 m
2/s is still suitable.
4.3. Turbulence Kinetic Energy and Vorticity
Turbulence kinetic energy (
k) is a factor affecting fish swimming performance. Migration in a more turbulent flow generally dissipates more swimming energy and lowers the fish-swimming capacity [
22]. Therefore, low-level
k is preferred, as it shortens the fish transit time [
21]. The
k is defined as
where
ux′,
uy′, and
uz′ = fluctuating velocity in the
x,
y, and
z directions, respectively.
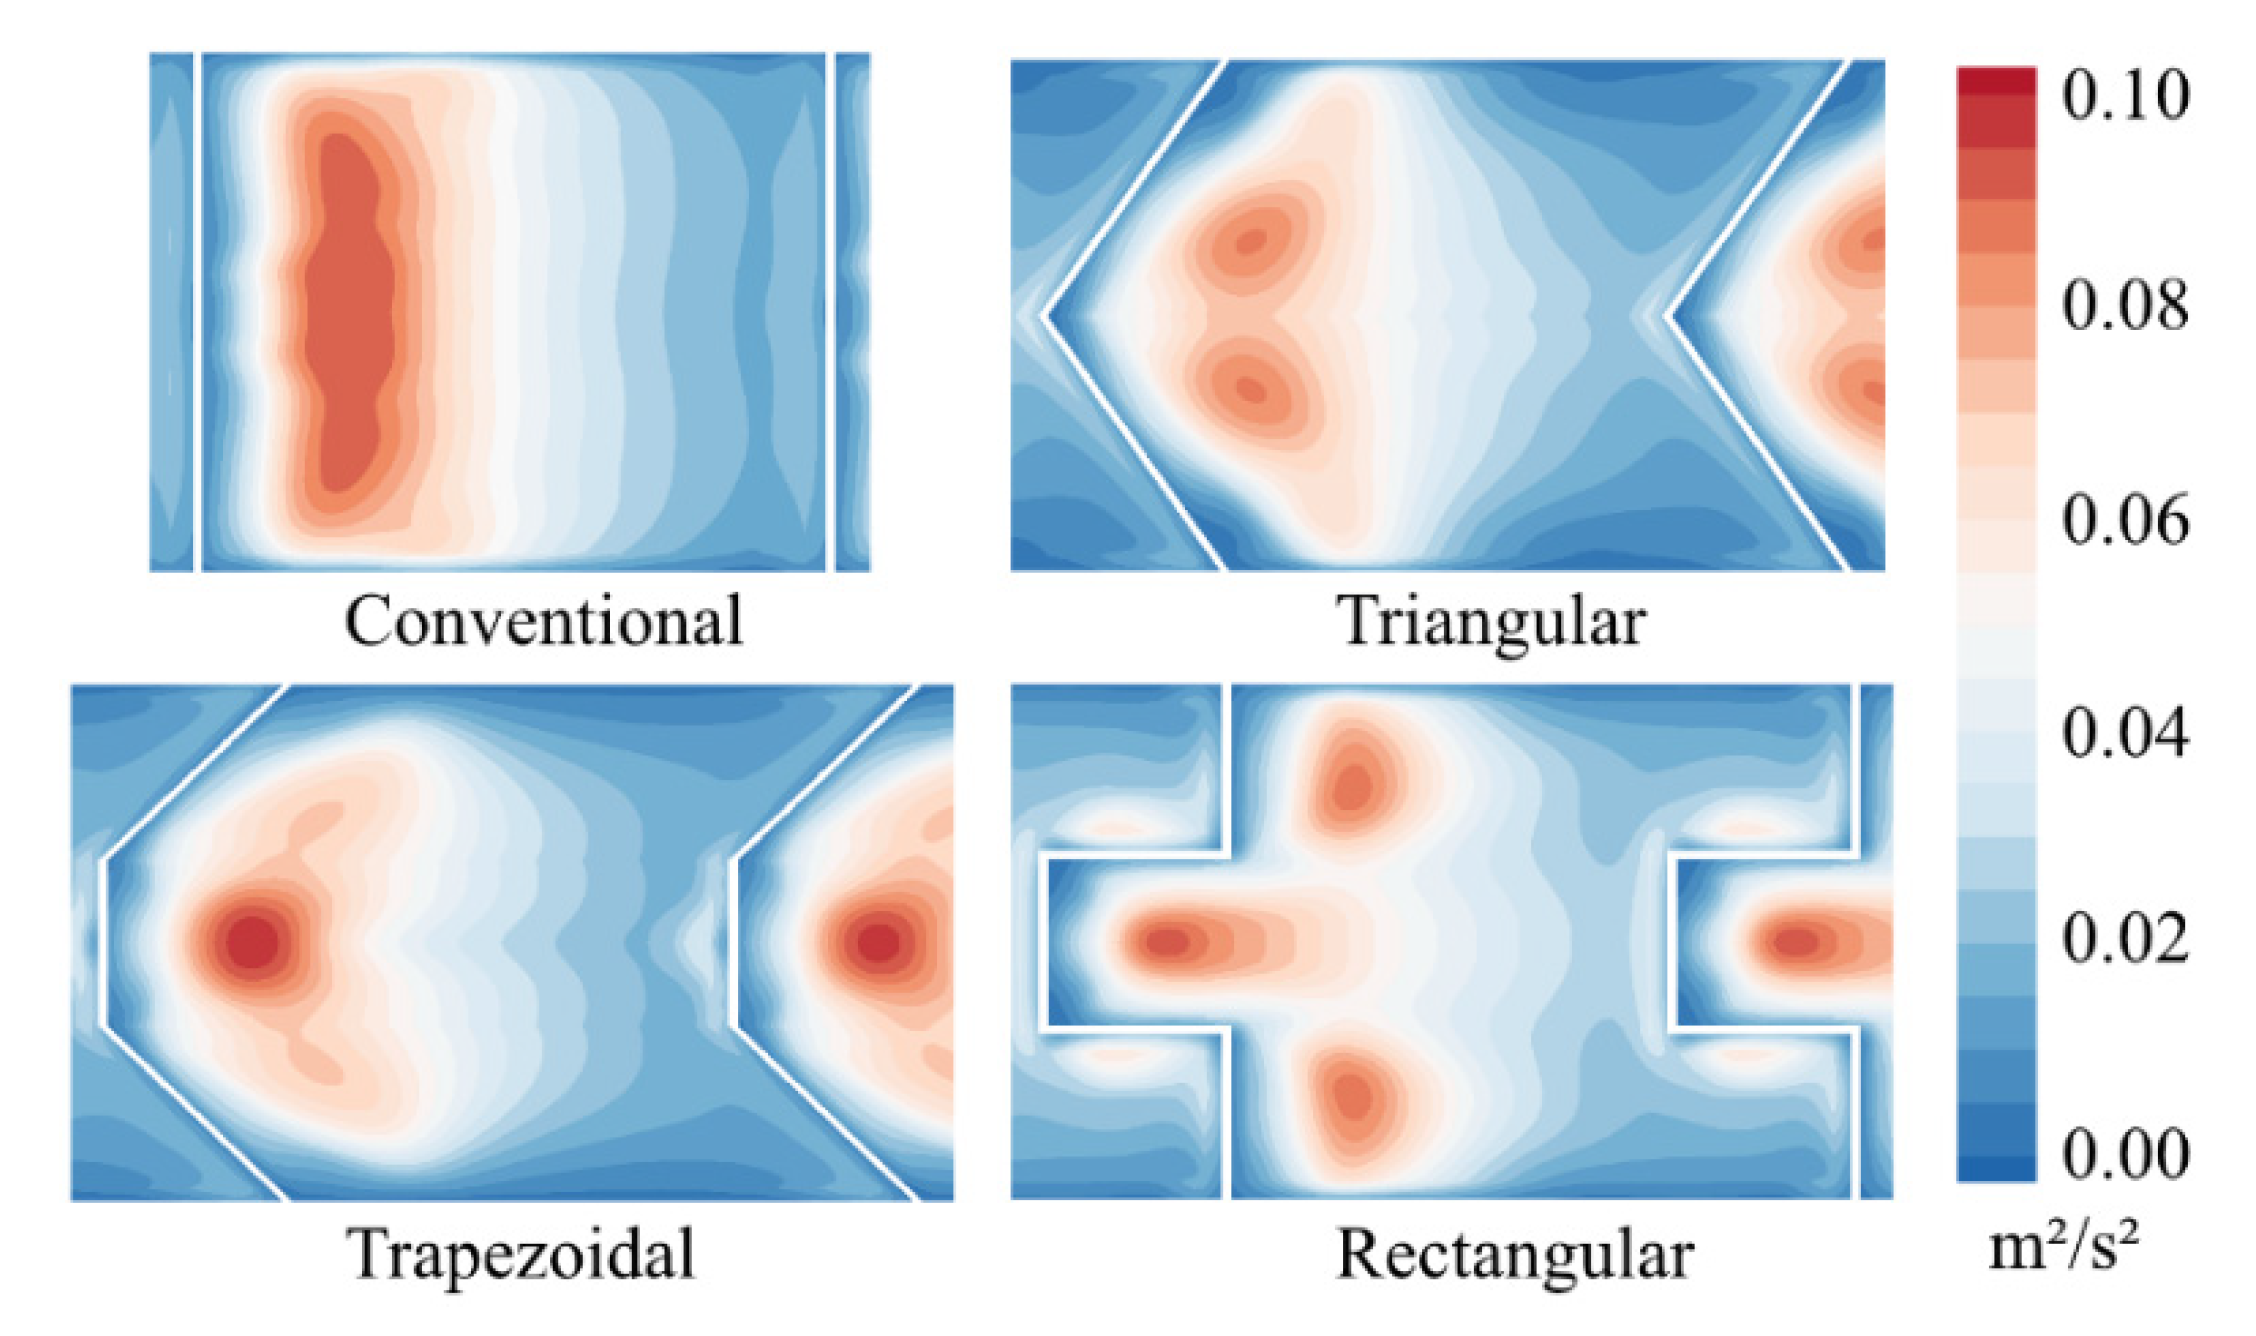
Figure 11 presents, at
Q = 25 L/s, the contour plots of
k at cross-section
y = 0.5
w. For the conventional type,
k distributes almost evenly across the channel. For the three labyrinth types,
k shows a typical 3D pattern. In the triangular and trapezoidal, the low
k zones are along the sidewalls, while the high
k zones are in the channel’s central part downstream of the weirs. Therefore, the paths along the walls are more favorable for fish migration.
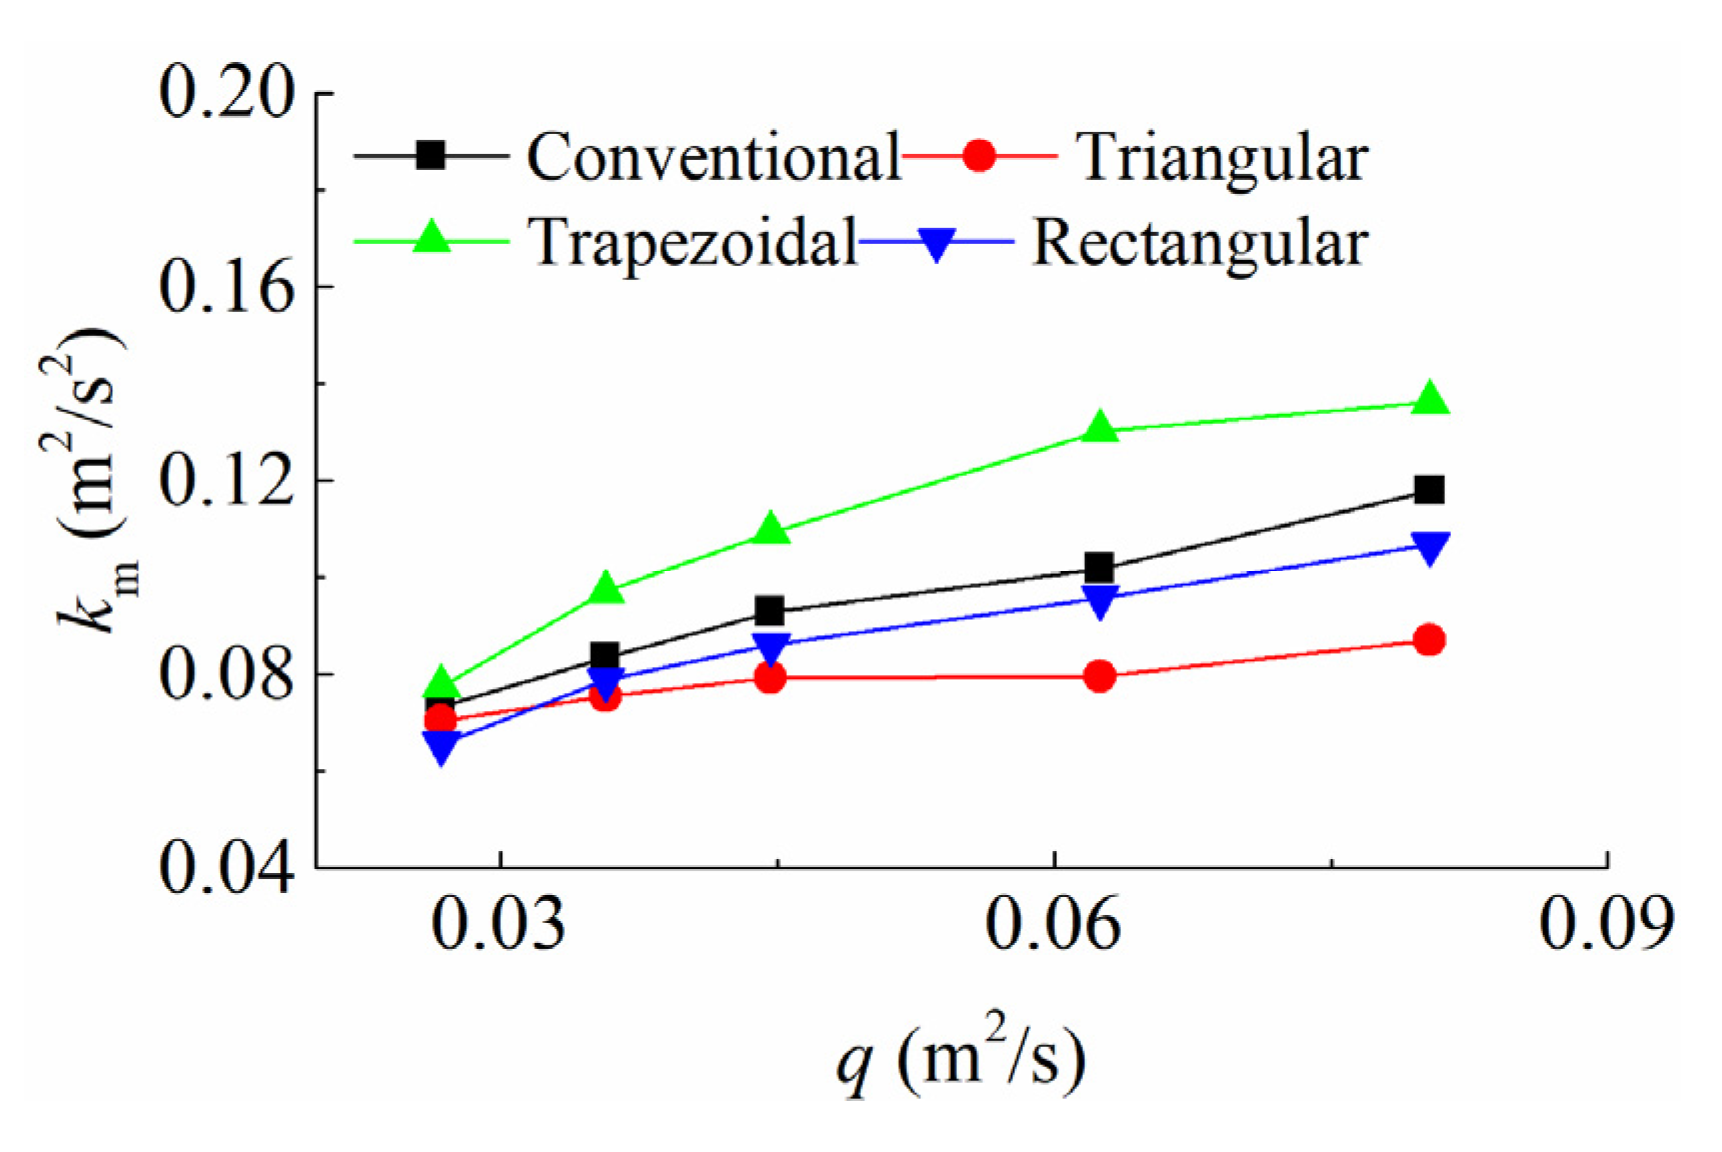
To quantify
k,
Figure 12 plots its maximum value (
km) against
q. For all layouts,
km shows an ascending trend as
q increases. For the conventional layout,
km increases by ~61% from
q = 0.03 to 0.08 m
2/s. At a given
q, the trapezoidal layout shows the largest
km and the triangular one the smallest. For instance, at
q = 0.08 m
2/s, the former is 1.16 times the conventional one, the latter only 0.74 times.
Vortex formation has an incidence on fish swimming capacity [
28]. In the vortex flow, extra energy is required to maintain spatial balance, which makes it difficult to migrate upstream. Vorticity (
ω) is an indicator of vortex intensity. On the
x-
z plane (parallel to the bottom),
ωy is expressed as
in which ∂
ux/∂
z and ∂
uz/∂
x = angular velocity along the
x- and
z-axis, respectively.
Figure 13 presents, at cross-section
y = 0.5
w, its maximum value (
ωym). For all the weirs,
ωym sees a positive correlation with
q. For example, for the conventional weir,
ωym climbs by a factor of ~2.5 from
q = 0.03 to 0.08 m
2/s. Compared with the conventional weir, all the labyrinth ones give rise to larger
ωym values. The rectangular layout results in the largest
ωym, e.g., 2.33 times the conventional at
q = 0.08 m
2/s.
4.4. Energy Dissipation
In the plunging flow, the flow energy is dissipated by turbulent mixing and diffusion. This allows maintaining a low-level velocity in the pool, which facilitates fish migration [
29]. To assess the energy dissipation of a single pool, the volumetric power dissipation
E is introduced as
in which
Vw = pool water volume. For large salmon and sea trout, Larinier [
30] suggests an upper limit of
E = 200 W/m
3. For small shad and riverine, the threshold is
E = 150 W/m
3. Kupferschmidt and Zhu [
13] perform experiments on a nature-like fishway, in which
S = 5% and the triangular weirs are formed with natural rocks and concrete spheres. Let VDS and VUS denote V-shaped (triangular) weirs with vertexes pointing downstream and upstream, respectively. In comparison with their data,
Figure 14 plots
E as a function of
q. Most results are above the 150 W/m
3 limit, with
q < 0.05 m
2/s suitable for large salmon and sea trout. To meet the
E requirement, lowering
S could be a solution [
13]. At a given
q, all the layouts present a similar
E level; the conventional one leads to slightly lower values. In addition,
E increases with an increase in
q, exhibiting a power law correlation,
E =
γqδ.
Table 2 shows the
γ and
δ parameters (equation e). This equation is a reasonable estimate of
E for both the experiments and CFD simulations.
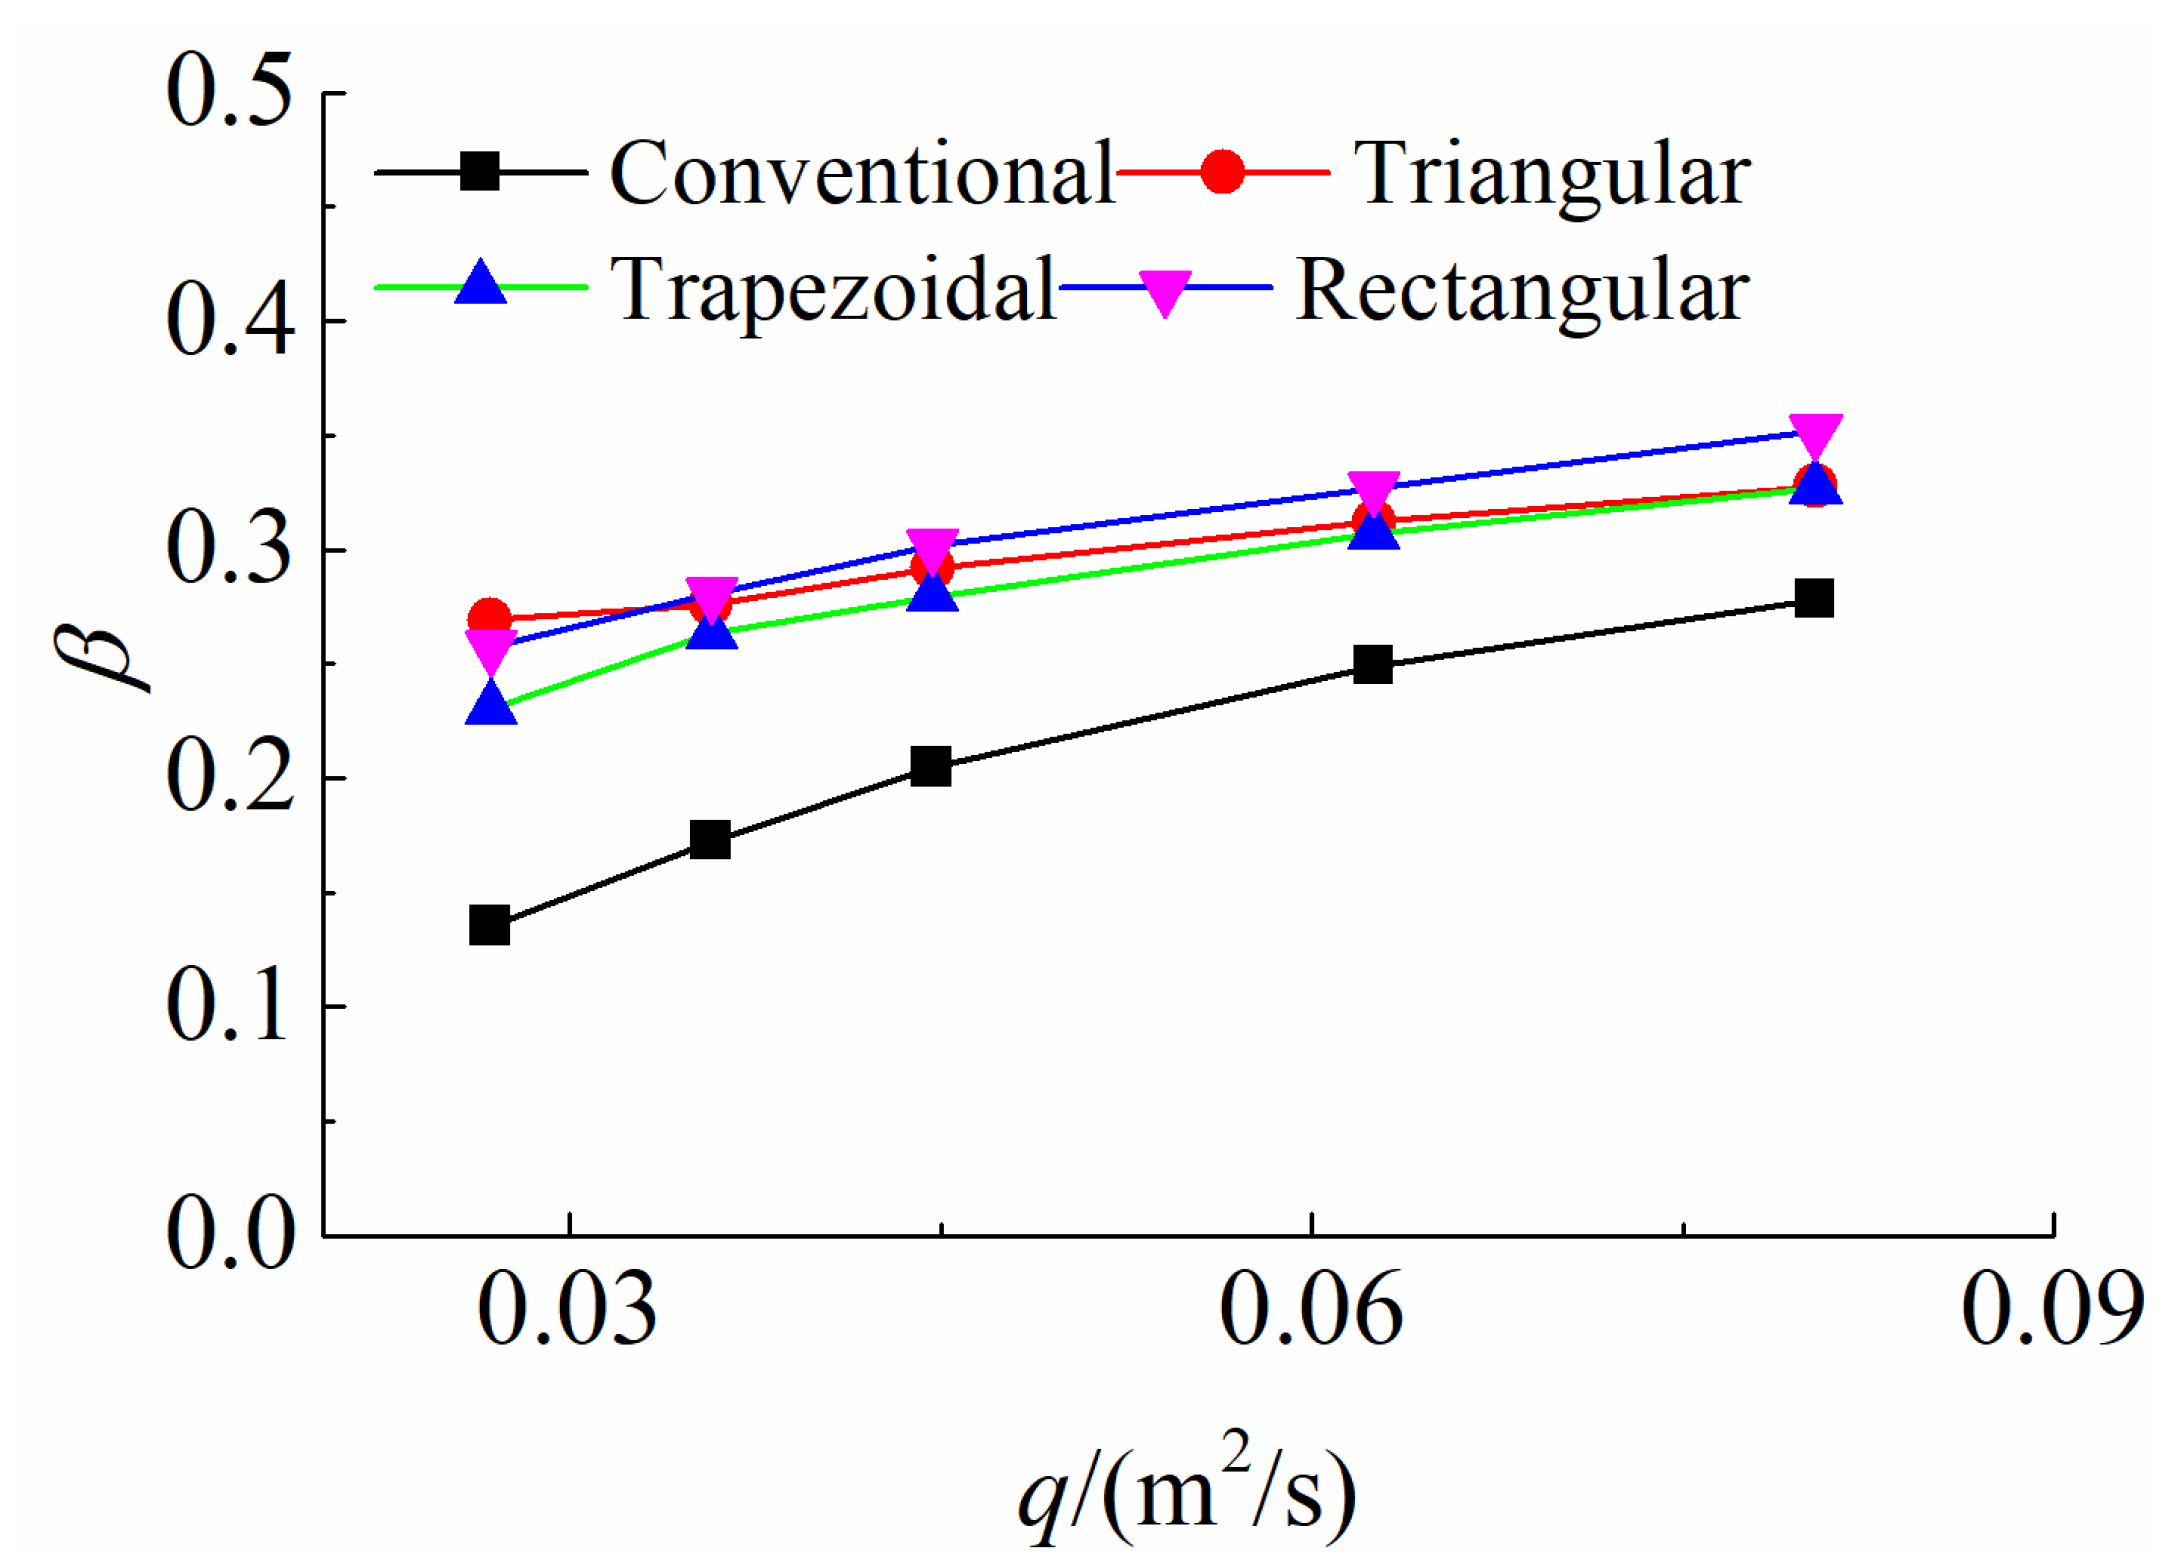
Another approach is also used for assessment of energy dissipation in hydraulic structures [
31,
32]. The energy dissipation rate (
β) reads
where
h1,
h2 = water depth and
ū1,
ū2 = averaged velocity at two cross-sections. In this study, the first cross-section is at a distance
l, upstream of the first weir and the second at the same distance downstream of the last weir.
Figure 15 shows the
β variation with
q. The labyrinth layouts are characterized by typical 3D flow patterns, with more turbulence and mixing than 2D flows. Therefore, they give higher
β values than the conventional one. At
q = 0.08 m
2/s, the former is 1.21 times the latter. Furthermore, at the same flow conditions, the differences in
β among the labyrinth weirs are limited. With an increase in
q,
β shows an upward trend.
5. Conclusions
In-stream hydraulic structures segment river connectivity, thereby creating barriers for fish migration. The use of a fishway mitigates the habitat fragmentation and allows upstream movement. With an aim to heighten the passage efficiency, this study integrates three labyrinth weir layouts into a pooled fishway. Numerical studies are performed to explore the hydraulic conditions, inclusive of velocity field, turbulence, and power dissipation.
All the examined layouts are in the plunging flow regime. At the same water stage, the labyrinth weirs lead to higher discharge capacity than the conventional one. For regime classification, the CFD results confirm the reasonableness of the pool aspect ratio approach. In the labyrinth weirs, a diversified velocity field is produced that differs from that of the conventional one. Depending on the weir formation, the flow in a pool is directed towards either the channel’s central part or its sidewalls. The low-velocity regions are along the sidewalls.
In the conventional layout, both the mean velocity reduction and dimensionless water depth are slightly higher than those in the labyrinth ones. Both are expressed by a power-law relationship, with the former correlated to the Froude number and the latter to unit discharge. In the light of turbulence kinetic energy, the triangular weir is more favourable for fish passage; while based on flow vorticity, the conventional weir is somewhat superior. The volumetric power dissipation presents an ascending trend with an increase in specific discharge, and they are correlated by a power law.
Incorporating labyrinth weirs into a pool-type fish pass provides an alternative to the conventional one. The simulations reveal their hydraulic performance in terms of flow discharge, flow field, kinetic energy, energy dissipation, etc. The findings enhance the understanding of pool-weir fishways and provide reference for engineering applications. The evaluated designs show advantages in certain aspects. However, none of them is superior in all criteria. Considering their overall performance, the labyrinth layouts indicate better results than the conventional one. Among the labyrinth ones, some provide suitable velocity distribution, while others show favourable turbulence. There is no design that satisfies all the criteria. Designing a successful fish passage requires joint efforts from hydraulic engineers and biologists. Migration habits of the target species need to be considered when choosing an optimal design. In addition, parametric studies and field observations are encouraged, so as to determine the optimum design criteria.
Author Contributions
Conceptualization, methodology, software, investigation, writing—original draft preparation: S.L.; writing—review and editing, supervision, project administration, funding acquisition: J.Y. and A.A. All authors have read and agreed to the published version of the manuscript.
Funding
This study is part of the research project “Quality and trust of numerical modeling of water-air flows for safe spillway discharge”, funded by the Swedish Hydropower Centre (SVC).
Institutional Review Board Statement
Not applicable.
Informed Consent Statement
Not applicable.
Acknowledgments
The funding from the Swedish Hydropower Centre (SVC) is acknowledged. SVC has been established by Swedish Energy Agency, Energiforsk and Svenska Kraftnät together with KTH Royal Institute of Technology, Luleå University of Technology (LTU), Chalmers University of Technology (CTH) and Uppsala University (UU). Participating companies and industry associations include AFRY, Andritz Hydro, Boliden, Fortum Generation, Holmen Energi, Jämtkraft, Karlstads Energi, LKAB, Mälarenergi, Norconsult, Rainpower, Skellefteå Kraft, Sollefteåforsens, Statkraft Sverige, Sweco Energuide, Sweco Infrastructure, Tekniska verken i Linköping, Uniper, Vattenfall R&D, Vattenfall Vattenkraft, Voith Hydro, WSP Sverige and Zinkgruvan.
Conflicts of Interest
The authors declare no conflict of interest.
References
- Yamamoto, S.; Morita, K.; Koizumi, I.; Maekawa, K. Genetic differentiation of white-spotted charr (Salvelinus leucomaenis) populations after habitat fragmentation: Spatial-temporal changes in gene frequencies. Conserv. Genet. 2004, 5, 529–538. [Google Scholar] [CrossRef]
- Larinier, M. Environmental issues, dams and fish migration. FAO Fish. Tech. Pap. 2001, 419, 45–89. [Google Scholar]
- Kubečka, J.; Matěna, J.; Hartvich, P. Adverse ecological effects of small hydropower stations in the Czech Republic: 1. Bypass plants. Regul. Rivers Res. Manag. 1997, 13, 101–113. [Google Scholar] [CrossRef]
- Katopodis, C. Developing a toolkit for fish passage, ecological flow management and fish habitat works. J. Hydraul. Res. 2005, 43, 451–467. [Google Scholar] [CrossRef]
- Clay, C.H. Design of Fishways and Other Facilities; CRC Press: Boca Raton, FL, USA, 1961. [Google Scholar]
- Larinier, M. Fish passage experience at small-scale hydro-electric power plants in France. Hydrobiologia 2008, 609, 97–108. [Google Scholar] [CrossRef]
- Katopodis, C. Introduction to Fishway Design; Freshwater Institute, Central and Arctic Region, Department of Fisheries and Oceans: Winnipeg, MB, Canada, 1992. [Google Scholar]
- Katopodis, C.; Gervais, R. Ecohydraulic analysis of fish fatigue data. River Res. Appl. 2012, 28, 444–456. [Google Scholar] [CrossRef]
- Rajaratnam, N.; Katopodis, C.; Mainali, A. Plunging and streaming flows in pool and weir fishways. J. Hydraul. Eng. 1988, 114, 939–944. [Google Scholar] [CrossRef]
- Guiny, E.; Ervine, D.A.; Armstrong, J.D. Hydraulic and biological aspects of fish passes for Atlantic salmon. J. Hydraul. Eng. 2005, 131, 542–553. [Google Scholar] [CrossRef] [Green Version]
- Yagci, O. Hydraulic aspects of pool-weir fishways as ecologically friendly water structure. Ecol. Eng. 2010, 36, 36–46. [Google Scholar] [CrossRef]
- Silva, A.T.; Katopodis, C.; Santos, J.M.; Ferreira, M.T.; Pinheiro, A.N. Cyprinid swimming behaviour in response to turbulent flow. Ecol. Eng. 2012, 44, 314–328. [Google Scholar] [CrossRef] [Green Version]
- Kupferschmidt, C.; Zhu, D.Z. Physical modelling of pool and weir fishways with rock weirs. River Res. Appl. 2017, 33, 1130–1142. [Google Scholar] [CrossRef]
- Baki, A.B.M.; Zhu, D.Z.; Harwood, A.; Lewis, A.; Healey, K. Rock-weir fishway I: Flow regimes and hydraulic characteristics. J. Ecohydraulics 2017, 2, 122–141. [Google Scholar] [CrossRef]
- Baki, A.B.M.; Zhu, D.Z.; Harwood, A.; Lewis, A.; Healey, K. Rock-weir fishway II: Design evaluation and considerations. J. Ecohydraulics 2017, 2, 142–152. [Google Scholar] [CrossRef]
- Tullis, J.P.; Amanian, N.; Waldron, D. Design of labyrinth spillways. J. Hydraul. Eng. 1995, 121, 247–255. [Google Scholar] [CrossRef]
- Khode, B.V.; Tembhurkar, A.R.; Porey, P.D.; Ingle, R.N. Experimental studies on flow over labyrinth weir. J. Irrig. Drain. Eng. 2012, 138, 548–552. [Google Scholar] [CrossRef]
- Dizabadi, S.; Azimi, A.H. Hydraulic and turbulence structure of triangular labyrinth weir-pool fishways. River Res. Appl. 2020, 36, 280–295. [Google Scholar] [CrossRef]
- Savage, B.M.; Brenchley, S. Fish passage using broad-crested labyrinth weirs for low-head dams. Int. J. River Basin Manag. 2013, 11, 277–286. [Google Scholar] [CrossRef]
- Ead, S.A.; Katopodis, C.; Sikora, G.J.; Rajaratnam, N. Flow regimes and structure in pool and weir fishways. J. Environ. Eng. Sci. 2004, 3, 379–390. [Google Scholar] [CrossRef] [Green Version]
- Marriner, B.A.; Baki, A.B.M.; Zhu, D.Z.; Thiem, J.D.; Cooke, S.J.; Katopodis, C. Field and numerical assessment of turning pool hydraulics in a vertical slot fishway. Ecol. Eng. 2014, 63, 88–101. [Google Scholar] [CrossRef]
- Li, Y.; Wang, X.; Xuan, G.; Liang, D. Effect of parameters of pool geometry on flow characteristics in low slope vertical slot fishways. J. Hydraul. Res. 2019, 58, 1–13. [Google Scholar] [CrossRef]
- Xu, T.; Jin, Y.C. Numerical investigation of flow in pool-and-weir fishways using a meshless particle method. J. Hydraul. Res. 2014, 52, 849–861. [Google Scholar] [CrossRef]
- Sikora, G.J. An Experimental Study of Flow Regimes in Pool and Weir Fishways; The University of Alberta: Edmonton, AB, Canada, 1997. [Google Scholar]
- Kandaswamy, P.K.; Rouse, H. Characteristics of flow over terminal weirs and sills. J. Hydraul. Div. 1957, 83, 1–13. [Google Scholar] [CrossRef]
- Baki, A.B.M.; Zhu, D.Z.; Rajaratnam, N. Mean flow characteristics in a rock-ramp-type fish pass. J. Hydraul. Eng. 2014, 140, 156–168. [Google Scholar] [CrossRef]
- Baudoin, J.M.; Burgun, V.; Chanseau, M.; Larinier, M.; Ovidio, M.; Sremski, W.; Voegtle, B. Assessing the Passage of Obstacles by Fish. In Concepts, Design and Application; Onema: Vincennes, France, 2015. [Google Scholar]
- Marriner, B.A.; Baki, A.B.; Zhu, D.Z.; Cooke, S.J.; Katopodis, C. The hydraulics of a vertical slot fishway: A case study on the multi-species Vianney-Legendre fishway in Quebec, Canada. Ecol. Eng. 2016, 90, 190–202. [Google Scholar] [CrossRef]
- Towler, B.; Mulligan, K.; Haro, A. Derivation and application of the energy dissipation factor in the design of fishways. Ecol. Eng. 2015, 83, 208–217. [Google Scholar] [CrossRef]
- Larinier, M. Pool fishways, pre-barages and natural bypass channels. BFPP-Connaiss. Gest. Patrim. Aquat. 2002, 364, 54–82. [Google Scholar]
- Li, S.; Zhang, J. Numerical investigation on the hydraulic properties of the skimming flow over pooled stepped spillway. Water 2018, 10, 1478. [Google Scholar] [CrossRef] [Green Version]
- Li, S.; Yang, J.; Li, Q. Numerical modelling of air-water flows over a stepped spillway with chamfers and cavity blockages. KSCE J. Civ. Eng. 2020, 24, 99–109. [Google Scholar] [CrossRef]
Figure 1.
Sketch of weir configurations: (a) conventional straight weir, (b) triangular labyrinth, (c) trapezoidal labyrinth, and (d) rectangular labyrinth.
Figure 1.
Sketch of weir configurations: (a) conventional straight weir, (b) triangular labyrinth, (c) trapezoidal labyrinth, and (d) rectangular labyrinth.
Figure 2.
Schematics of the experimental model.
Figure 2.
Schematics of the experimental model.
Figure 3.
Computational domain with boundary conditions.
Figure 3.
Computational domain with boundary conditions.
Figure 4.
Definition of variables. The ux profile is cross-sectionally defined, with uxm as its maximum velocity. Y and Y0 are measured in the y direction and l1 and l2 vertically.
Figure 4.
Definition of variables. The ux profile is cross-sectionally defined, with uxm as its maximum velocity. Y and Y0 are measured in the y direction and l1 and l2 vertically.
Figure 5.
Comparisons between simulations and references: (a) Y as function of x1; (b) ux profile at x1/l = 0.66 in Test 1; (c) ux profile at x1/l = 0.66 in Test 2; (d) ux profile at x1/l = 0.30 in Test 3; (e) ux profile at x1/l = 0.60 in Test 3.
Figure 5.
Comparisons between simulations and references: (a) Y as function of x1; (b) ux profile at x1/l = 0.66 in Test 1; (c) ux profile at x1/l = 0.66 in Test 2; (d) ux profile at x1/l = 0.30 in Test 3; (e) ux profile at x1/l = 0.60 in Test 3.
Figure 6.
Flow regime classification: (a) variation of with H/w, and (b) correlation between and l/w.
Figure 6.
Flow regime classification: (a) variation of with H/w, and (b) correlation between and l/w.
Figure 7.
Relationship between Q+ and d/w in the plunging regime.
Figure 7.
Relationship between Q+ and d/w in the plunging regime.
Figure 8.
Velocity magnitude and vectors at y = 0.5 w and Q = 25 L/s.
Figure 8.
Velocity magnitude and vectors at y = 0.5 w and Q = 25 L/s.
Figure 9.
Mean velocity reduction η against Froude number F.
Figure 9.
Mean velocity reduction η against Froude number F.
Figure 10.
Pool averaged water depth H/h0 as a function of q.
Figure 10.
Pool averaged water depth H/h0 as a function of q.
Figure 11.
Contour plots of k at y = 0.5 w and Q = 25 L/s.
Figure 11.
Contour plots of k at y = 0.5 w and Q = 25 L/s.
Figure 12.
Comparison of km in different layouts.
Figure 12.
Comparison of km in different layouts.
Figure 13.
Variations of ωym with q at y = 0.5 w.
Figure 13.
Variations of ωym with q at y = 0.5 w.
Figure 14.
Volumetric power dissipation (
E) in a single pool. VDS and VUS = V-shaped (triangular) weirs with vertexes pointing downstream and upstream, respectively [
13].
Figure 14.
Volumetric power dissipation (
E) in a single pool. VDS and VUS = V-shaped (triangular) weirs with vertexes pointing downstream and upstream, respectively [
13].
Figure 15.
Energy dissipation rate (β) in all layouts.
Figure 15.
Energy dissipation rate (β) in all layouts.
Table 1.
Model calibration using experimental setup.
Table 1.
Model calibration using experimental setup.
| Test No. | w (cm) | l (cm) | B (cm) | S (%) | Q (L/s) |
|---|
| 1 | 7.4 | 68.5 | 56.0 | 10.0 | 35 |
| 2 | 14.1 | 68.5 | 56.0 | 10.0 | 35 |
| 3 | 14.1 | 33.5 | 56.0 | 10.0 | 65 |
Table 2.
Coefficients and exponents for power functions.
Table 2.
Coefficients and exponents for power functions.
| Equation | Expression | Layout | γ | δ | R2 |
|---|
| a | η = γFδ | Conventional | 2.61 | −1.10 | 0.99 |
| b | | Labyrinth | 2.08 | −0.91 | 0.97 |
| c | H/h0 = γqδ | Conventional | 1.96 | −0.27 | 0.99 |
| d | | Labyrinth | 2.23 | −0.21 | 0.96 |
| e | E = γqδ | Conventional and labyrinth | 1195.00 | 0.62 | 0.98 |
| Publisher’s Note: MDPI stays neutral with regard to jurisdictional claims in published maps and institutional affiliations. |
© 2022 by the authors. Licensee MDPI, Basel, Switzerland. This article is an open access article distributed under the terms and conditions of the Creative Commons Attribution (CC BY) license (https://creativecommons.org/licenses/by/4.0/).


