1. Introduction
Roads play a crucial role in the economic growth, development and accessibility of communities. In Africa, road infrastructure networks are the most heavily used form of transport and have a significant bearing on the inclusive and sustainable development of the region [
1].
The reliable performance of roads is crucial for service delivery, and it is a catalyst for domestic and cross-border spatial development [
2], especially considering that paved national roads are expected to carry increasing traffic volumes over time. Selecting the most suitable and durable road construction materials is therefore necessary to ensure a reliable serviceability. Taking the value of paved roads into consideration, a system for quantifying and measuring the in-field performance of the material is imperative. Most countries in Africa still rely on empirical methods for bituminous binder classification in asphalt road construction. However, South Africa has recently moved towards the implementation of a performance-graded (PG) specification founded on principles of pavement performance [
3].
Establishing the climatic conditions that affect pavement temperatures is therefore necessary for characterizing the material’s response to traffic loading and environmental conditions, given the visco-elastic nature of asphalt. The three failure mechanisms of asphalt layers addressed by the PG specification are (i) permanent deformation (rutting at high service temperatures); (ii) fatigue cracking at intermediate service temperatures; and (iii) brittle fracture at low service temperatures [
4]. The in-service temperature and traffic conditions, in conjunction with the ageing effects of bituminous binders, play a pivotal role in selecting bitumen to achieve a given in situ performance within the asphalt layer. Pavement failures due to a poor selection of bituminous binders can be reduced by correctly specifying the appropriate binder for a given climate [
4].
As per the Superpave method, historic air temperature data are required to calculate the maximum and minimum pavement temperatures for PG asphalt bitumen selection [
5]. Using different sources of historical data, pavement temperature maps have been developed for South Africa [
4] and Tanzania [
6].
An appropriate binder selection results in asphalt that will withstand the imposed environmental and traffic loading conditions on roads. Temperature maps are an integral part of the climatic factors of a pavement’s operating environment. These maps assist road engineers to select the most suitable bituminous binders for a given geographical location based on regional climatic conditions. Many influencing factors determine the usage of temperature maps such as the type of pavement temperature model used, prevalent climatic conditions, the effect of urban heat islands for localized planning in metropolitan municipalities, the geospatial mapping procedure and considerations as well as the source of required climate data and weather parameters, as illustrated in
Figure 1.
A consistent approach, that caters for the variability of geographical, environmental and climatic conditions, does not currently exist within the continent. This paper will therefore explore these factors for the development of temperature maps and present an approach based on the previous experience and findings for the African continent.
2. Pavement Temperature Models
Defining the relationship between air and pavement temperatures is the foundation of developing temperature maps. It is also useful for other applications, such as maintenance and early failure detection [
7,
8,
9]. Reliable models for determining the pavement temperatures used for pavement design are therefore important, as well as the methodology adopted for measuring air and road temperatures [
10].
Most pavement temperature models are fundamentally based on the theory of heat transfer, which mathematically accounts for the transfer mechanisms of heat through conduction, convection and radiation. Some models also account for the energy lost through evapotranspiration [
11,
12]. The selection of the most appropriate model will be based on the required application, where the selected model will fall under one of the following categories [
13]:
Analytical models
Numerical models or
Empirical models
Analytical pavement temperature models are concerned with obtaining an exact solution. Ref. [
14] derived a mathematical solution to the partial differential equation governing one-dimensional heat conduction in a semi-infinite medium. This formed the basis of many later developments concerning pavement temperature models. Even though analytical models are focused on obtaining precise results, it should be noted that empirical assumptions are still often used within analytical solutions, and their applicability should be considered before use.
Numerical models use reasonable estimates to arrive at a solution. For South Africa, Williamson and Kirby [
15] used a finite difference approach that relied on the thermal properties of pavement materials to determine pavement temperatures. This was followed by the introduction of a corresponding methodology in the mid-seventies [
16]. The methodology required extensive solar radiation data which was not available in the country at the time, thus limiting its further implementation.
Empirical models are usually based on a regression analysis of the measured results. Although empirical models do not produce precise estimates of pavement temperatures, they are usually preferred because they require less computation and provide a simplified relationship between pavement temperatures and key weather parameters. However, the calibration against other areas within the country is critical in order to obtain representative results, especially considering how climates can vary quite substantially across a national scale, not to mention a continental scale. For this reason, and depending on the required accuracy, caution should be exercised when using empirical models that have been developed for a climate that is different from the one intended without calibration. Local knowledge of the area is also an added advantage in this regard.
The Strategic Research Highway Program (SHRP) developed the first Superpave™ method for asphalt mix design between 1987 and 1993. Considering the differences in climate, amongst other motivators, the method was investigated for use in South Africa by Everitt et al. [
17]. This investigation led to the development of the Viljoen [
18] algorithms in 2001, which were based on the empirical relationship between selected sky parameters and pavement temperatures. The linear regression model was able to predict 80% of the measured results within a 3 °C margin for Everitt’s 1999 dataset. Other researchers in the country using additional data points further verified this model for certain regions in the country [
4,
19].
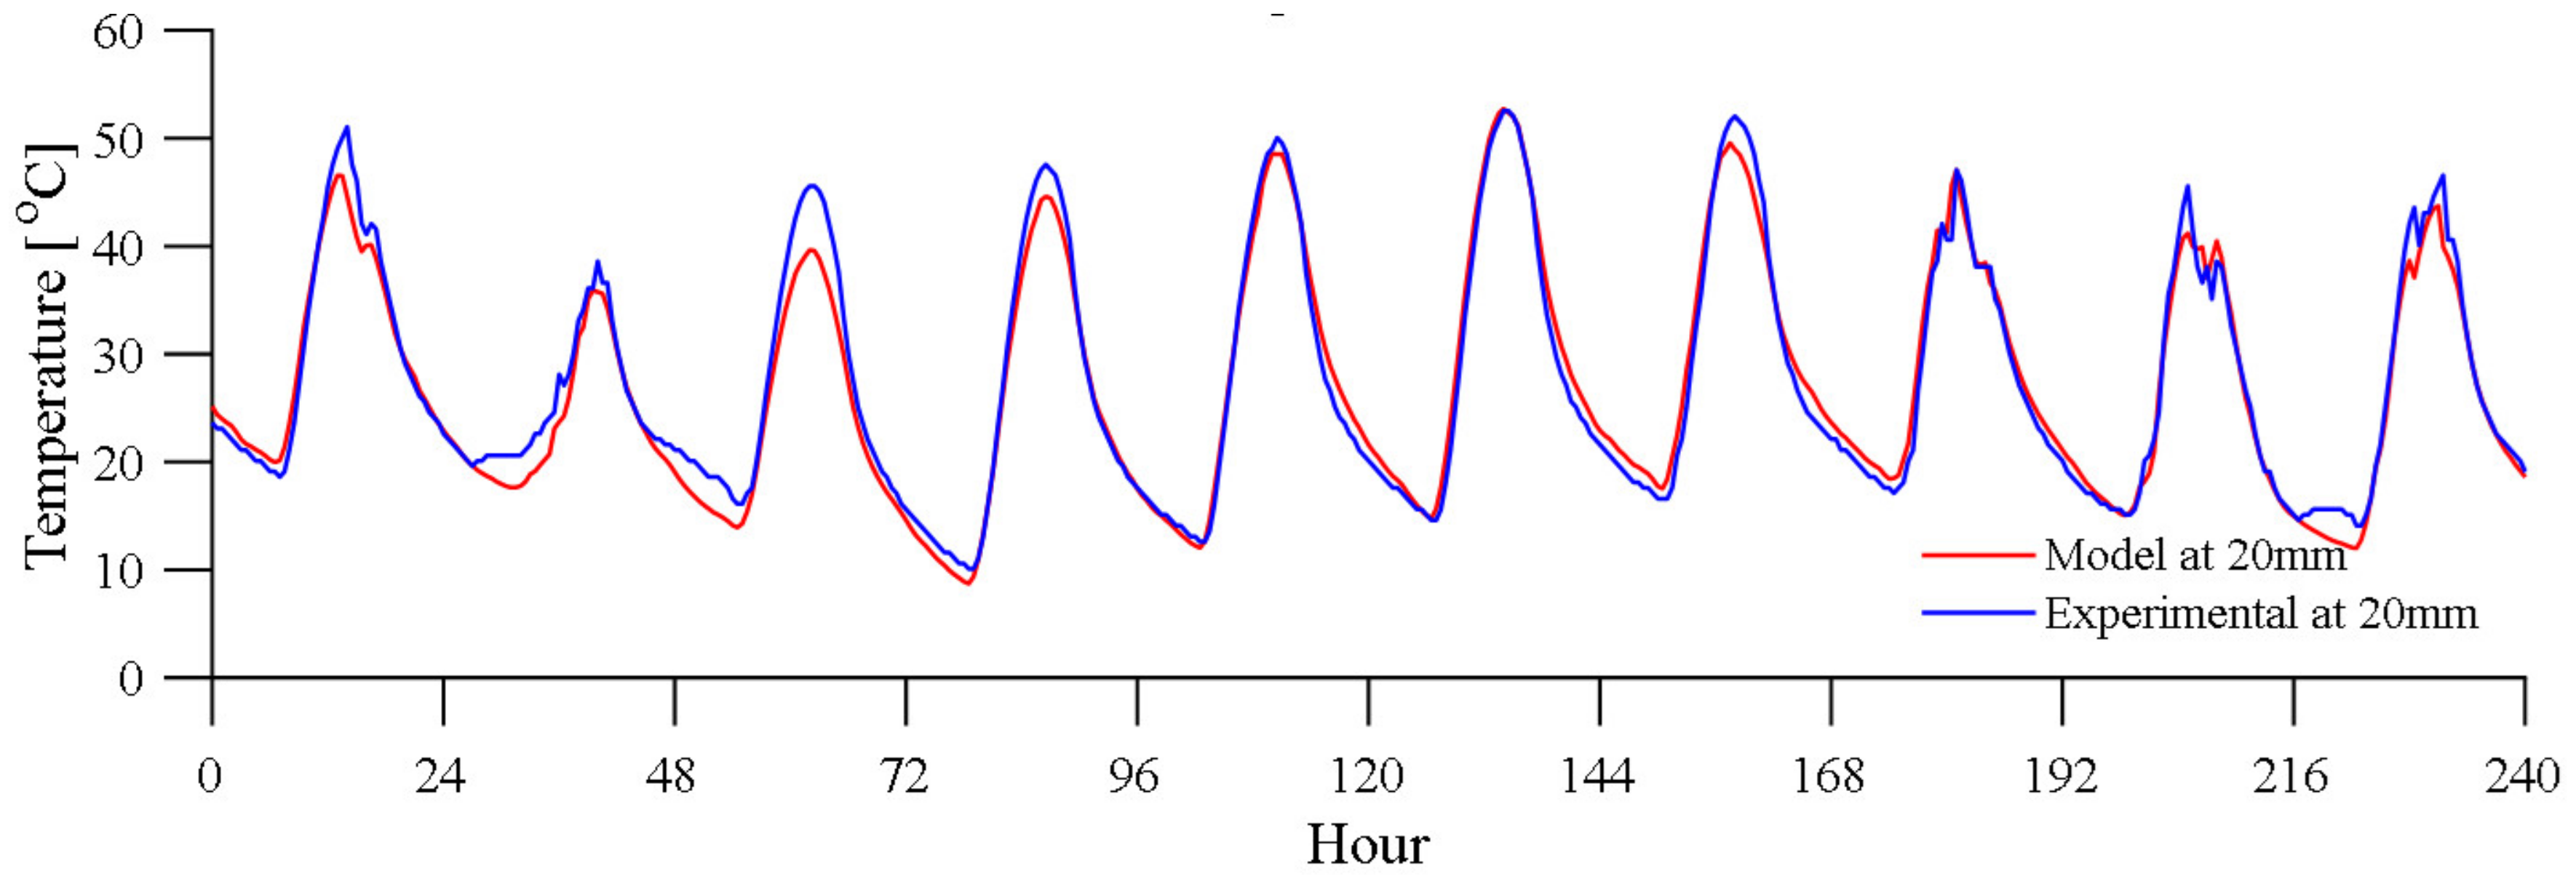
The mean error for the Viljoen [
18] equations showed only a slight improvement when compared to the Superpave predictions. With the availability of a solar radiation dataset, the energy balance concept was reconsidered, and a numerical approach based on the method of Orthogonal Collocation on Finite Elements was employed. The numerical model also incorporated ambient air temperature, wind speed and relative humidity. The model was validated with a selected site in Pretoria, South Africa, and a comparison of predicted to actual road temperatures is shown in
Figure 2 and
Figure 3.
The dataset included both clear days and days with transient cloud cover. The recorded air temperature, solar irradiance and wind speed measurements were incorporated in the energy balance model. The daily recorded values are shown in
Figure 2. As illustrated above, the pavement temperature relies on more than the air temperature. It is determined based on various weather, climatic factors, as well as pavement material properties. Accurate working models for determining pavement temperatures are therefore required to be verified for the different regions in the continent as the basis for road material selection.
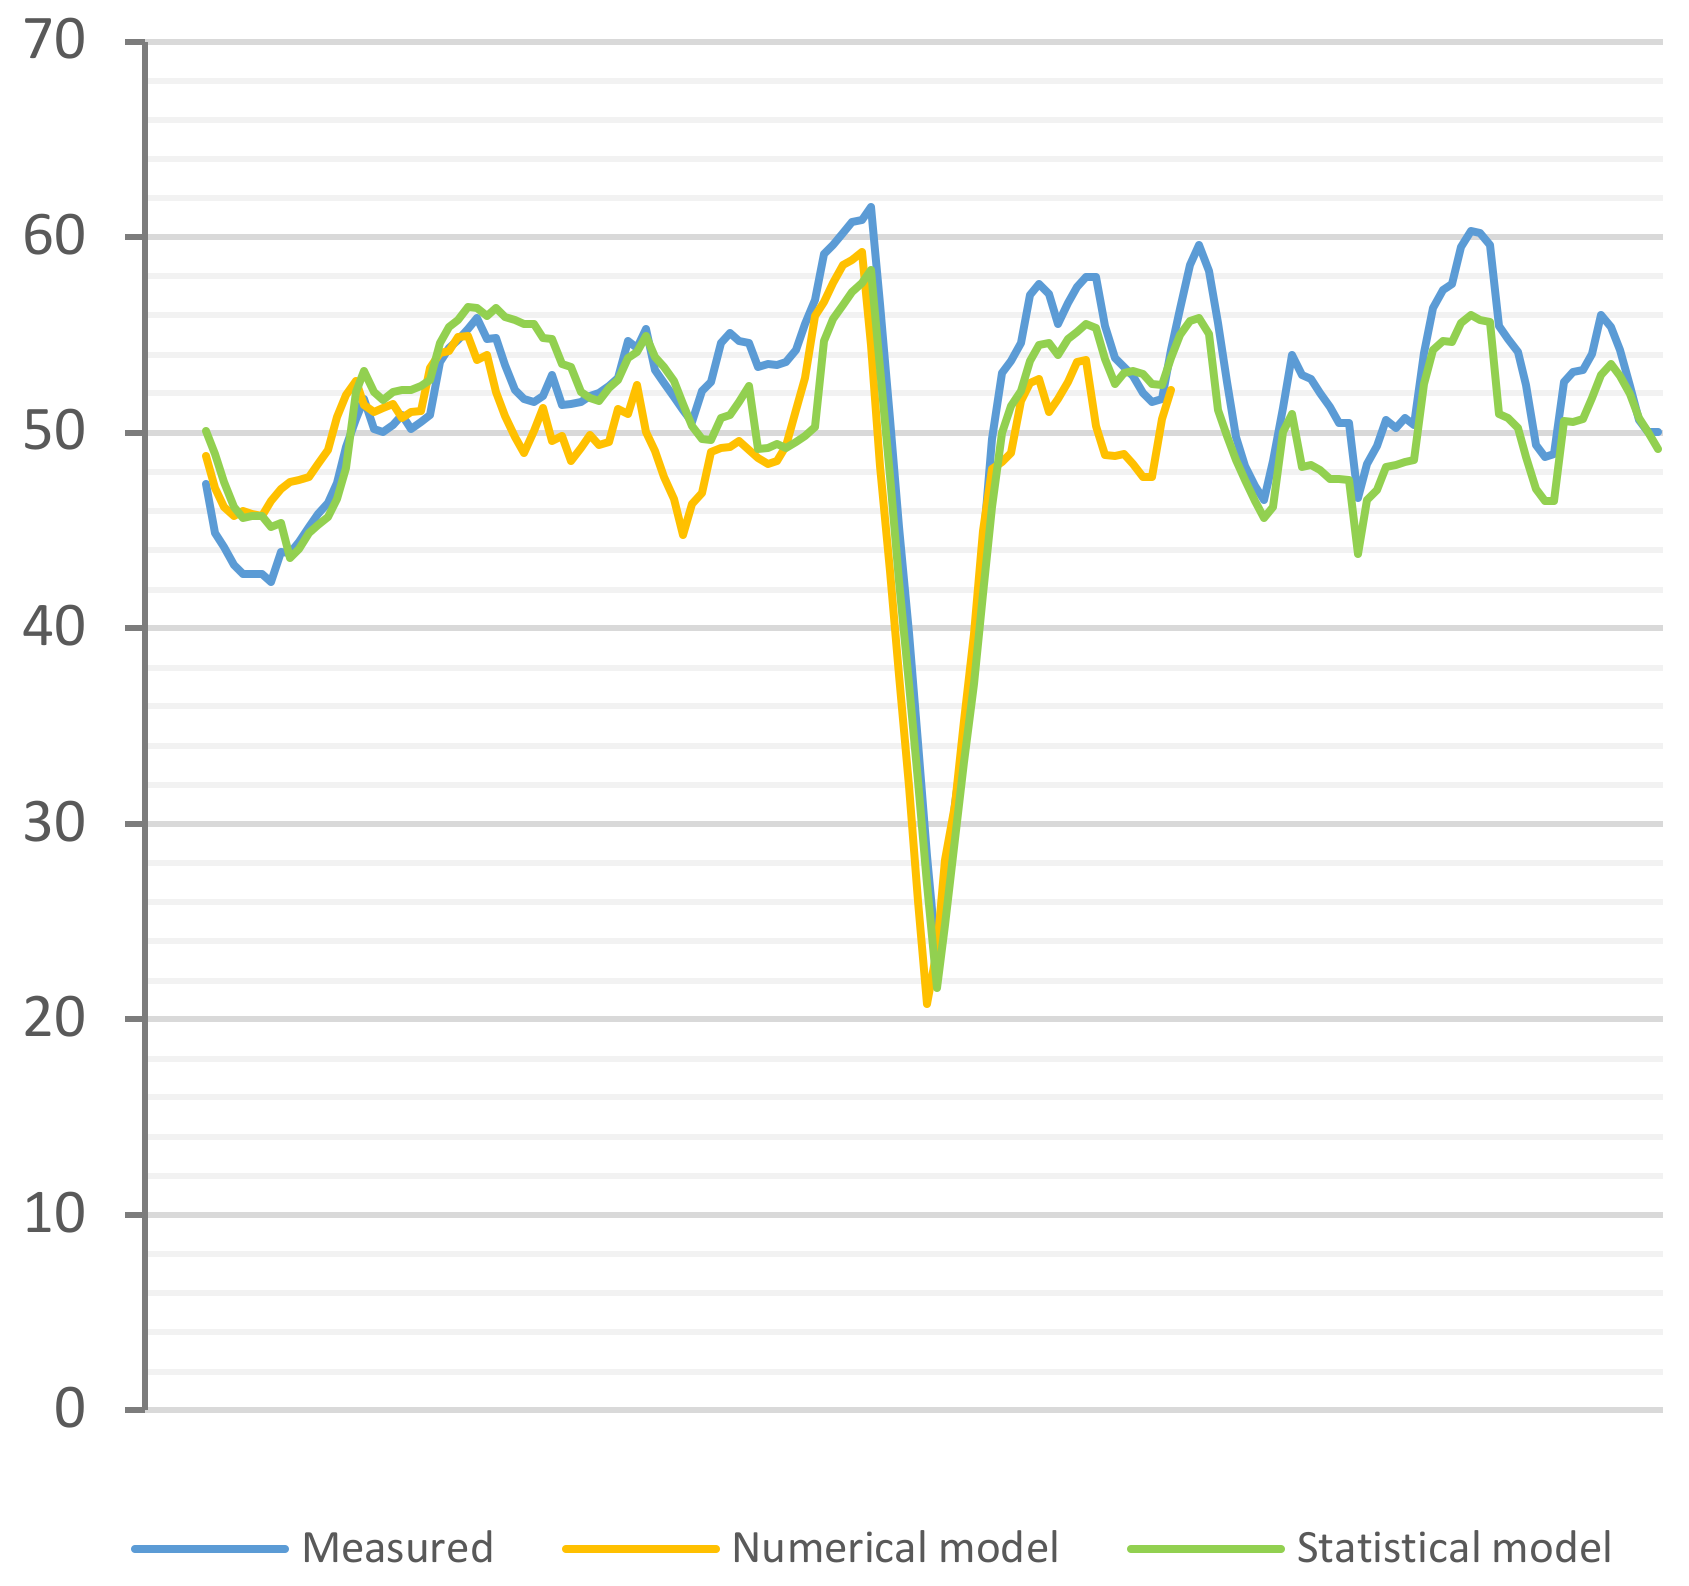
A field experiment was conducted comparing the measured pavement temperature results and the predicted pavement temperatures using (i) a statistical model based on a regression analysis of the historical recorded asphalt temperatures in various locations in South Africa [
18] and (ii) an energy balance numerical model with assumed thermal properties of the pavement materials. The numerical model also takes into consideration ambient weather conditions as well the overall pavement structure. The experiment was conducted in Pretoria, South Africa, over a period of 6 months, between September 2019 and February 2020, for two asphalt sections with depths of 40 mm and 90 mm, respectively. Comparisons of the predicted temperature results against the recorded pavement temperatures revealed that, in general, both models show a general agreement in the diurnal temperature patterns within the asphalt layer with varying daily weather conditions, as seen in
Figure 1 and
Figure 2. However, this was not the case when predicting the daily extreme pavement temperatures necessary for the PG binder selection, as shown in
Figure 4 and
Figure 5.
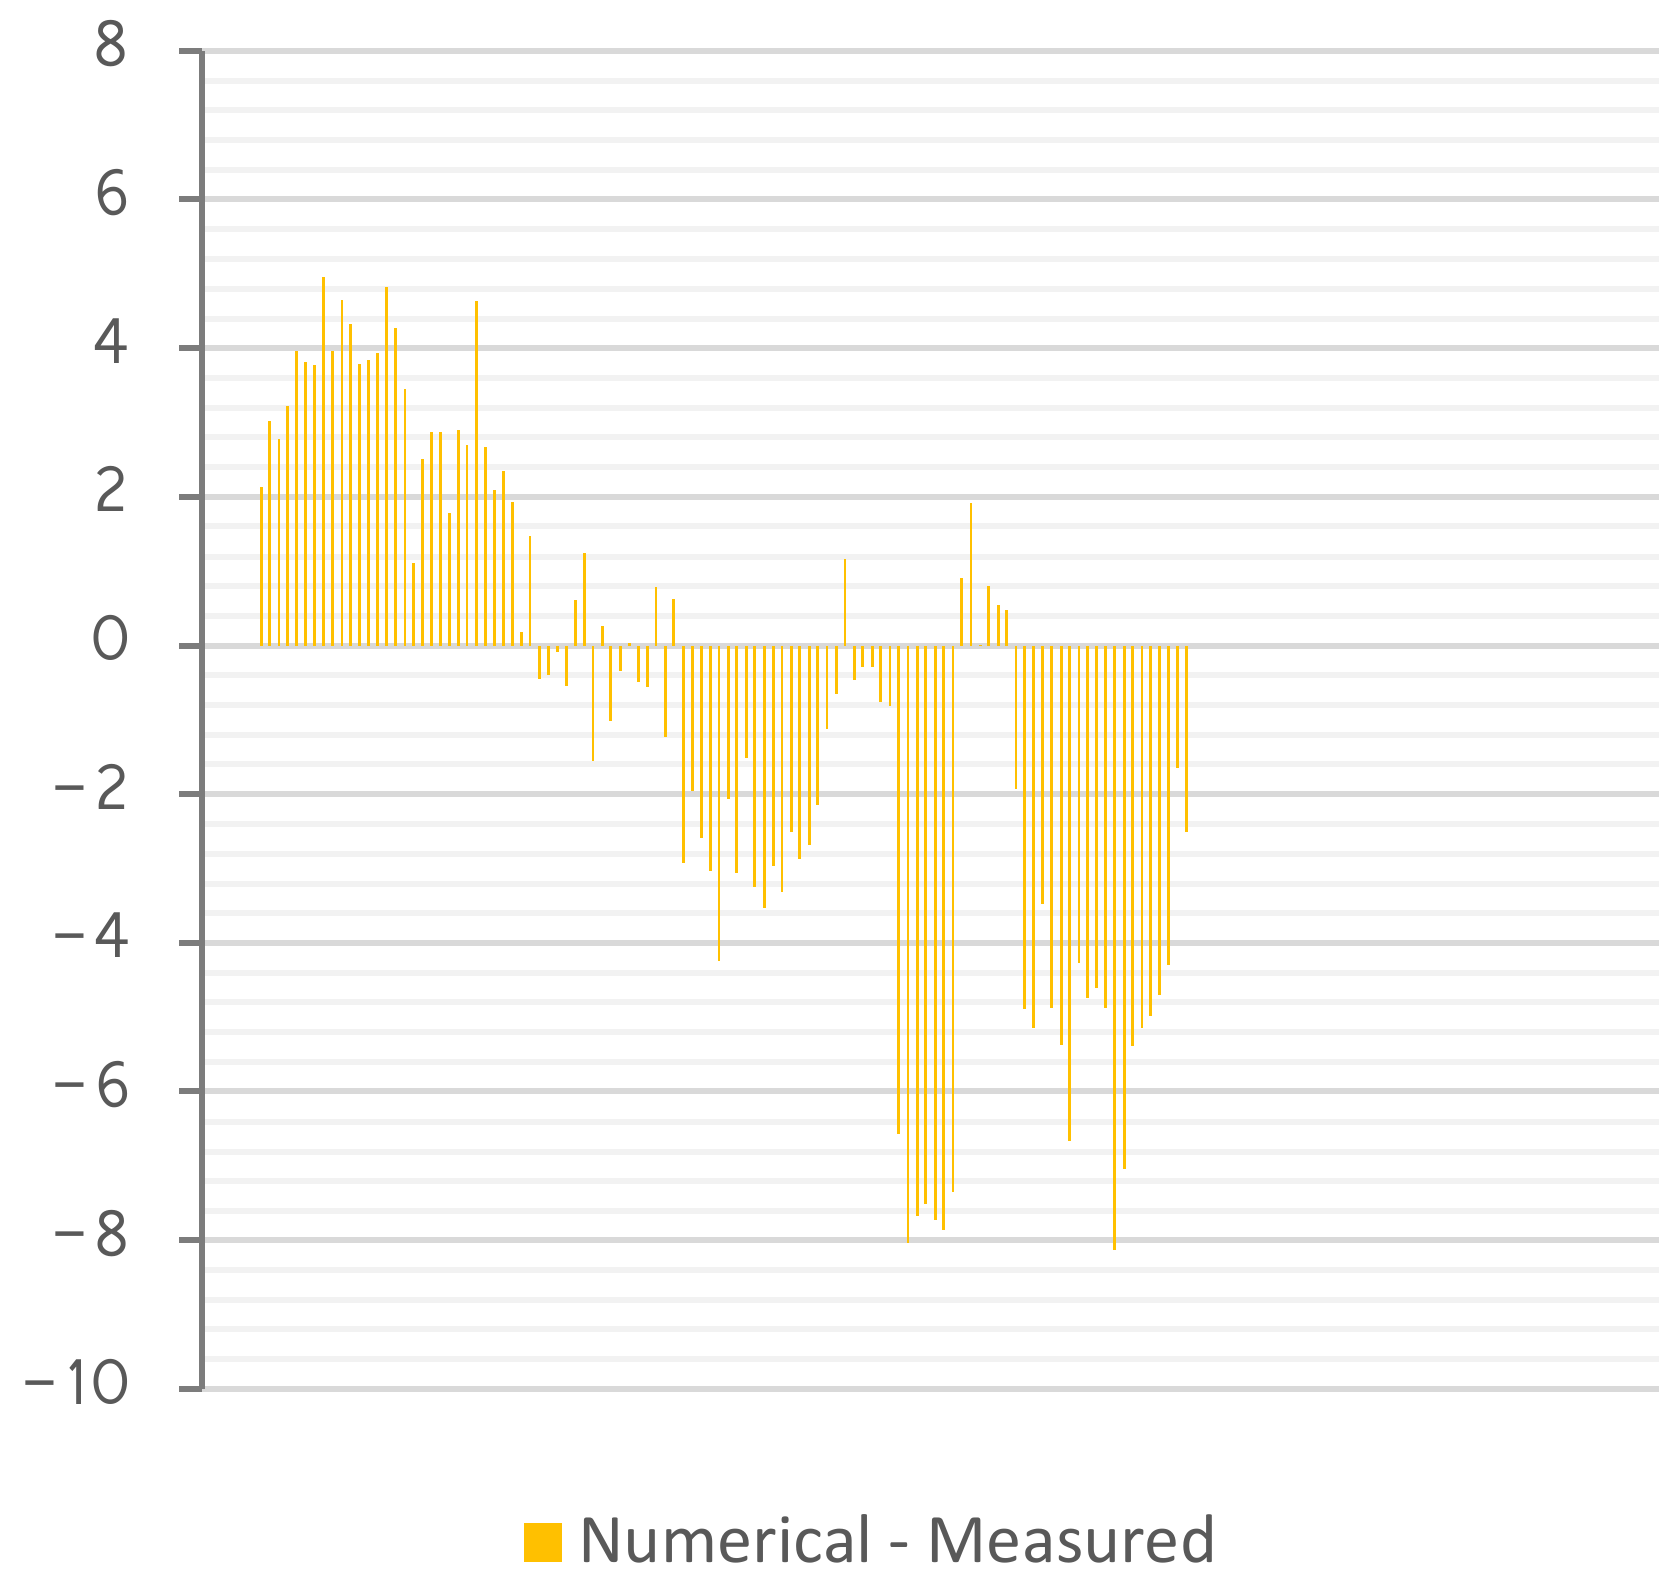
On average, both the statistical model and the numerical model tend to underestimate the daily and 7-day maximum asphalt temperatures for the asphalt layers with both 40 mm and 90 mm (See
Figure 6,
Figure 7,
Figure 8 and
Figure 9), where the majority of the predicted 7-day average pavement temperatures were observed to be less than the recorded pavement temperatures, particularly after a prolonged event of rain and high cloudy cover. However, this trend was observed specifically for the duration of the experiment after the week-long event of rain and high cloud cover, while the opposite was observed before the event. Larger deviations for maximum temperatures were observed using the numerical model, with the assumed thermal properties of the asphalt layer, compared to the statistical model. During the investigation, the maximum error for calculating the 7-day average maximum temperature using the numerical model was 9.5 °C, with a standard deviation of 3.2 °C for the 40 mm asphalt section. The maximum error obtained for the 90 mm asphalt layer was 8.1 °C and a standard deviation of 3.5 °C. The statistical model exhibited a slightly lower discrepancy, with a maximum error of 7.5 °C and a standard deviation of 2.6 °C for the 40 mm asphalt section. A maximum error of 6.0 °C was found for the 90 mm section and a corresponding 2.9 °C standard deviation. However, further research on the material thermal properties is warranted for conclusive results, given that assumed values from the literature were used during the above investigation.
Pavement temperature relies on more than air temperature; it is determined based on various weather, climatic factors, pavement material properties and the overall pavement structure; therefore, algorithms for determining pavement temperatures may need to be verified for the different regions in the continent as the basis for the road material selection.
2.1. Climatic Factors
The main forms of heat transfer at a pavement’s surface are conduction, convection and radiation. These can be modelled mathematically by the heat transfer equation and rely largely on the presiding weather conditions and the road’s material properties.
Empirical models do not provide precise results but assist in developing simplified relationships between weather data and pavement temperatures. Therefore, a representative dataset is required to collect pavement temperature measurements based on the geographical location of the area to be mapped.
Weinert used the N-value, which accounts for the evaporation of the warmest month and the precipitation of an area to develop the map commonly referred to in pavement engineering to categorize South African climates into three primary zones, namely (a) wet, (b) moderate and (c) dry, where the majority of the country is considered as “dry” according to the classification [
20]. However, further research has shown that this needs to be revisited and has suggested an increase in the number of climatic regions, considering the effects of climate change, to better represent the country [
21].
To gain a better global perspective, the Köppen–Geiger climate classification system is one of the methods used to categorize climate regions across the world. This particular system is made of five main climate groups, namely tropical (A), dry (B), temperate (C), continental (D) and polar (E), while sub-categories describe levels of precipitation and heat [
22].
New global climate maps based on data obtained between 1980 and 2016 have been established [
23] where the continent is divided into 22 climatic zones (See
Figure 10), with most of the continent falling under the “hot arid desert” (BWh) as well as the “tropical savannah category” (Aw). Therefore, most parts of the continent can be described either as “tropical” or “dry”.
Sub-Saharan Africa shows the highest climatic variation per unit area in comparison to North Africa, which fits almost exclusively into the “hot arid desert” category. Most parts of East and West Africa show a roughly even split between “hot arid desert” and “tropical savannah”. The majority of Central Africa can be described as a “tropical savannah” climate according to the climatic map.
With respect to pavement temperatures, important climatic factors for modelling pavement temperatures have been determined to be solar radiation, air temperature, cloud cover, humidity, sunshine hours and wind speed [
13,
24,
25]. In order to cater for the location in relation to the position of the sun, the zenith angle [
18,
26,
27,
28,
29], phase of incident solar radiation [
30], solar declination [
31], inclination angle [
12] or solar azimuth [
32] have all been used depending on the selected pavement temperature model. Understandably, these variables can have a significant impact on the pavement temperature calculation and ultimately the selected binder for a given region in Africa.
2.2. Material Properties
Barber recommended that the thermal properties of pavement materials be taken into account for determining accurate temperatures [
14]. According to a sensitivity analysis performed by Viljoen [
18], the calculated pavement temperature was most sensitive to the surface material’s conductivity more than any of the other material properties [
18], as presented in
Table 1. The reported values for asphalt thermal conductivity range from 0.7 to 2.0. Ref. [
33], however, stated that albedo (solar reflectance as a ratio of incoming radiation) is the parameter that has the highest effect on pavement temperature in comparison to emissivity, thermal conductivity and specific heat.
Qin and Hiller [
11] found that the regression coefficients used in their model relied on the surface albedo and the pavement’s thermal inertia. The ageing and weathering of an asphalt pavement have also been shown to have an increasing effect on the surface albedo, thus contributing to the change in the temperature profile within the pavement structure over time [
29,
33,
34].
3. Effect of Urban Heat Islands on Pavement Temperatures
Most temperature models are simplified as a one-dimensional heat transfer problem, which is sufficient for pavements in unobstructed areas. However, other research has suggested that a coupled heat exchange model be developed for the heat transfer between the road and the surrounding environment [
13]. This would better simulate the effect of urban heat islands on pavement temperatures in built-up areas.
Urban heat islands (UHI) could be considered as a form of meso or micro-climate occurring in urban landscapes due to the higher land coverage of paved surfaces. The UHI effect causes increased air temperatures in metropolitan areas in comparison to neighbouring rural areas especially during night-time, while the effect on daytime air temperatures is minimal. This effect tends to be more pronounced in calm, clear weather and during the winter months, and urban-rural temperature differences of up to 5.9 °C have been observed at midnight in Adelaide, Australia [
35]. Air temperatures up to 12 °C warmer in cities have also been observed compared to less built-up surrounding areas on a clear, calm night [
36].
The maximum values used to produce temperature maps typically occur around midday, and UHI effects may not have a significant impact on the daily extremes used for material mix-designs. However, this may cause a reduction in the 7-day-averaged maximum pavement temperature typically used for binder selection as a result of the altered diurnal cycles caused by elevated night-time temperatures. Due to the material thermal properties and the response to the daily cyclic variations of temperature, this would influence the overall structural performance and would require further research.
Most conventional construction materials tend to store heat during the day and release it at night, thus significantly contributing to urban heat islands. A surface material’s absorptivity governs the amount of solar radiation absorbed by the pavement structure and the typical values for asphalt vary from 0.85 to 0.93, which results in a 4 °C difference on the calculated pavement temperatures [
18].
Various studies have been conducted on the UHI phenomenon and its effect on pavement temperatures. There are different strategies to reduce the phenomenon, and the development of cool pavements has been identified as a potential strategy to alleviate the effect. The different methods to achieve a “cool pavement” can fall into one of the following categories [
11]:
Reflective pavements—aim to increase the surface albedo through different techniques in order to reduce pavement temperatures as well as the sensible heat released from the pavement.
Evaporative cooling pavements—pavement systems that are designed to store water within the pavement layers. Latent heat from the pavement surface can be greatly reduced provided the pavement is wet and there is a steep enough humidity gradient to allow sufficient evaporation. These pavements need to be carefully designed to ensure their thermal performance.
Thermally modified pavements—material and structural modifications to alter the thermal conductivity or even to self-regulate pavement temperatures. Although this type of pavement system can be effective in reducing daytime temperatures, it tends to have higher night-time temperatures and should therefore be carefully designed.
An example of a reflective pavement was presented by Qin and Hiller [
11], who investigated how different pavement properties influenced pavement temperatures and the effect on urban heat islands. They used an energy balance method to model the heat exchange at the pavement’s surface. Similar to Williamson’s [
24] model, their model accounts for incoming solar radiation and energy loss through convection, conduction and radiation. However, Qin and Hiller’s [
11] model also accounts for energy loss by means of evaporation. This allowed them to investigate the energy partition in relation to the development of cool pavement systems. They found that most of the absorbed energy is released as latent heat and long-wave radiation, particularly during the summer months, and so concluded that increasing the surface albedo and “enhancing the evaporative flux” was effective in reducing the latent heat and thus creating cool pavements.
An example of a thermally modified pavement was presented by Chen et al., who proposed an analytical approach to evaluate temperature profiles of thermally modified asphalt pavements as well as their effect on urban heat islands [
37]. The proposed model is based on Green’s function to predict temperatures within a multi-layered pavement system and was validated with outdoor field experiments. They were able to reduce pavement temperatures at various depths by increasing the pavement surface albedo, which had the effect of increasing the heat output intensity during the day and reducing it during the night. They found that combining a highly conductive surface material and base course showed the best thermal performance to alleviate the effect of UHI by reducing the pavement’s overall maximum heat output intensity.
Adebayo demonstrated how different land uses generate different microclimates in Nigeria [
38]. This was attributed to the complex interaction of incident solar radiation with surface materials and corresponding thermal properties. It was also argued that the interpolation techniques used for most “heat island” isoline maps are not ideal for modelling urban heat islands because the land use between known points is often overlooked with traditional approaches. This highlights the importance of the local terrain and climate knowledge for producing representative temperature maps.
There are hotspots within urban areas that are more susceptible to heat islands than other regions, as demonstrated through various studies in Africa [
38,
39,
40]. This may need to be taken into consideration during the material selection of the asphalt mix design process, and a 6 °C difference between urban and city air temperatures could warrant a higher PG bitumen for certain metropolitan areas. In order to account for this, the data source needs to be at a high enough resolution and of sufficient quantity to capture the effect of urban heat islands.
Multiple climatic factors and material properties need to be considered for accurate pavement temperature prediction, as demonstrated above. Obtaining an extremely precise output is not always possible and, depending on the application, not necessary. However, certain considerations that significantly affect the pavement temperatures (such as albedo and the transmission co-efficient of unit air mass, which is dependent on the cloud cover and zenith angle) need to be considered for the development of pavement temperature maps. Another aspect that may warrant further investigation is the influence of air pollutants on incoming solar radiation, especially in densely populated urban areas. For instance, Peters et al. found a reduction of about 11.5% for incoming solar radiation for PV panels in Delhi as a result of air pollution [
41]. A similar investigation was conducted in 16 other countries and found insolation reductions between 2.0% and 9.1% depending on the city.
UHI may be detectable from weather data if there are enough active weather stations within a built-up metropolitan area that are used in producing temperature maps. However, this is often not the case, especially when the operating weather stations are limited and few compared to high resolution weather data from satellite or re-analysis models.
Temperature maps showing the spatial distribution of pavement temperatures across the city of Tshwane, South Africa, were produced during this investigation using UHI weather data. The dataset was provided at a 1-km resolution within the city’s boundary. The 7-day hottest pavement temperatures were calculated according to the Viljoen [
18] algorithms for the period between 2007 and 2017, and the 97.5th percentile of the data set is shown in
Figure 11.
The temperature contours are consistent with previous findings for maximum temperatures in the period 2000–2020 [
42], where the spatial temperature distribution in
Figure 11 can now be observed at a higher resolution at a municipal planning scale. It is also observed that the temperature contour for a PG 58 is slowly moving south in comparison to the maximum temperature map used in the national specification for PG bitumen in South Africa [
43]. This is indicative of the city’s warming climate over time, considering that the UHI data used for the study are more recent than those used to develop the specification.
During the analysis, the effect of UHI was more detectable in the minimum pavement temperatures compared to the maximum pavement temperatures. The minimum pavement temperature map is shown in
Figure 12.
From the analysis, relatively high minimum pavement temperatures for the city were noted in comparison to the pavement temperature maps for the period 2000–2020, where a previous study [
42] illustrates a minimum pavement temperature classification of PG 2 for the Tshwane area, whereas the temperatures calculated using the UHI data show that the city is classified as a PG 8 region, with the exception of the hotspots that warrant a PG 12 minimum pavement temperature binder.
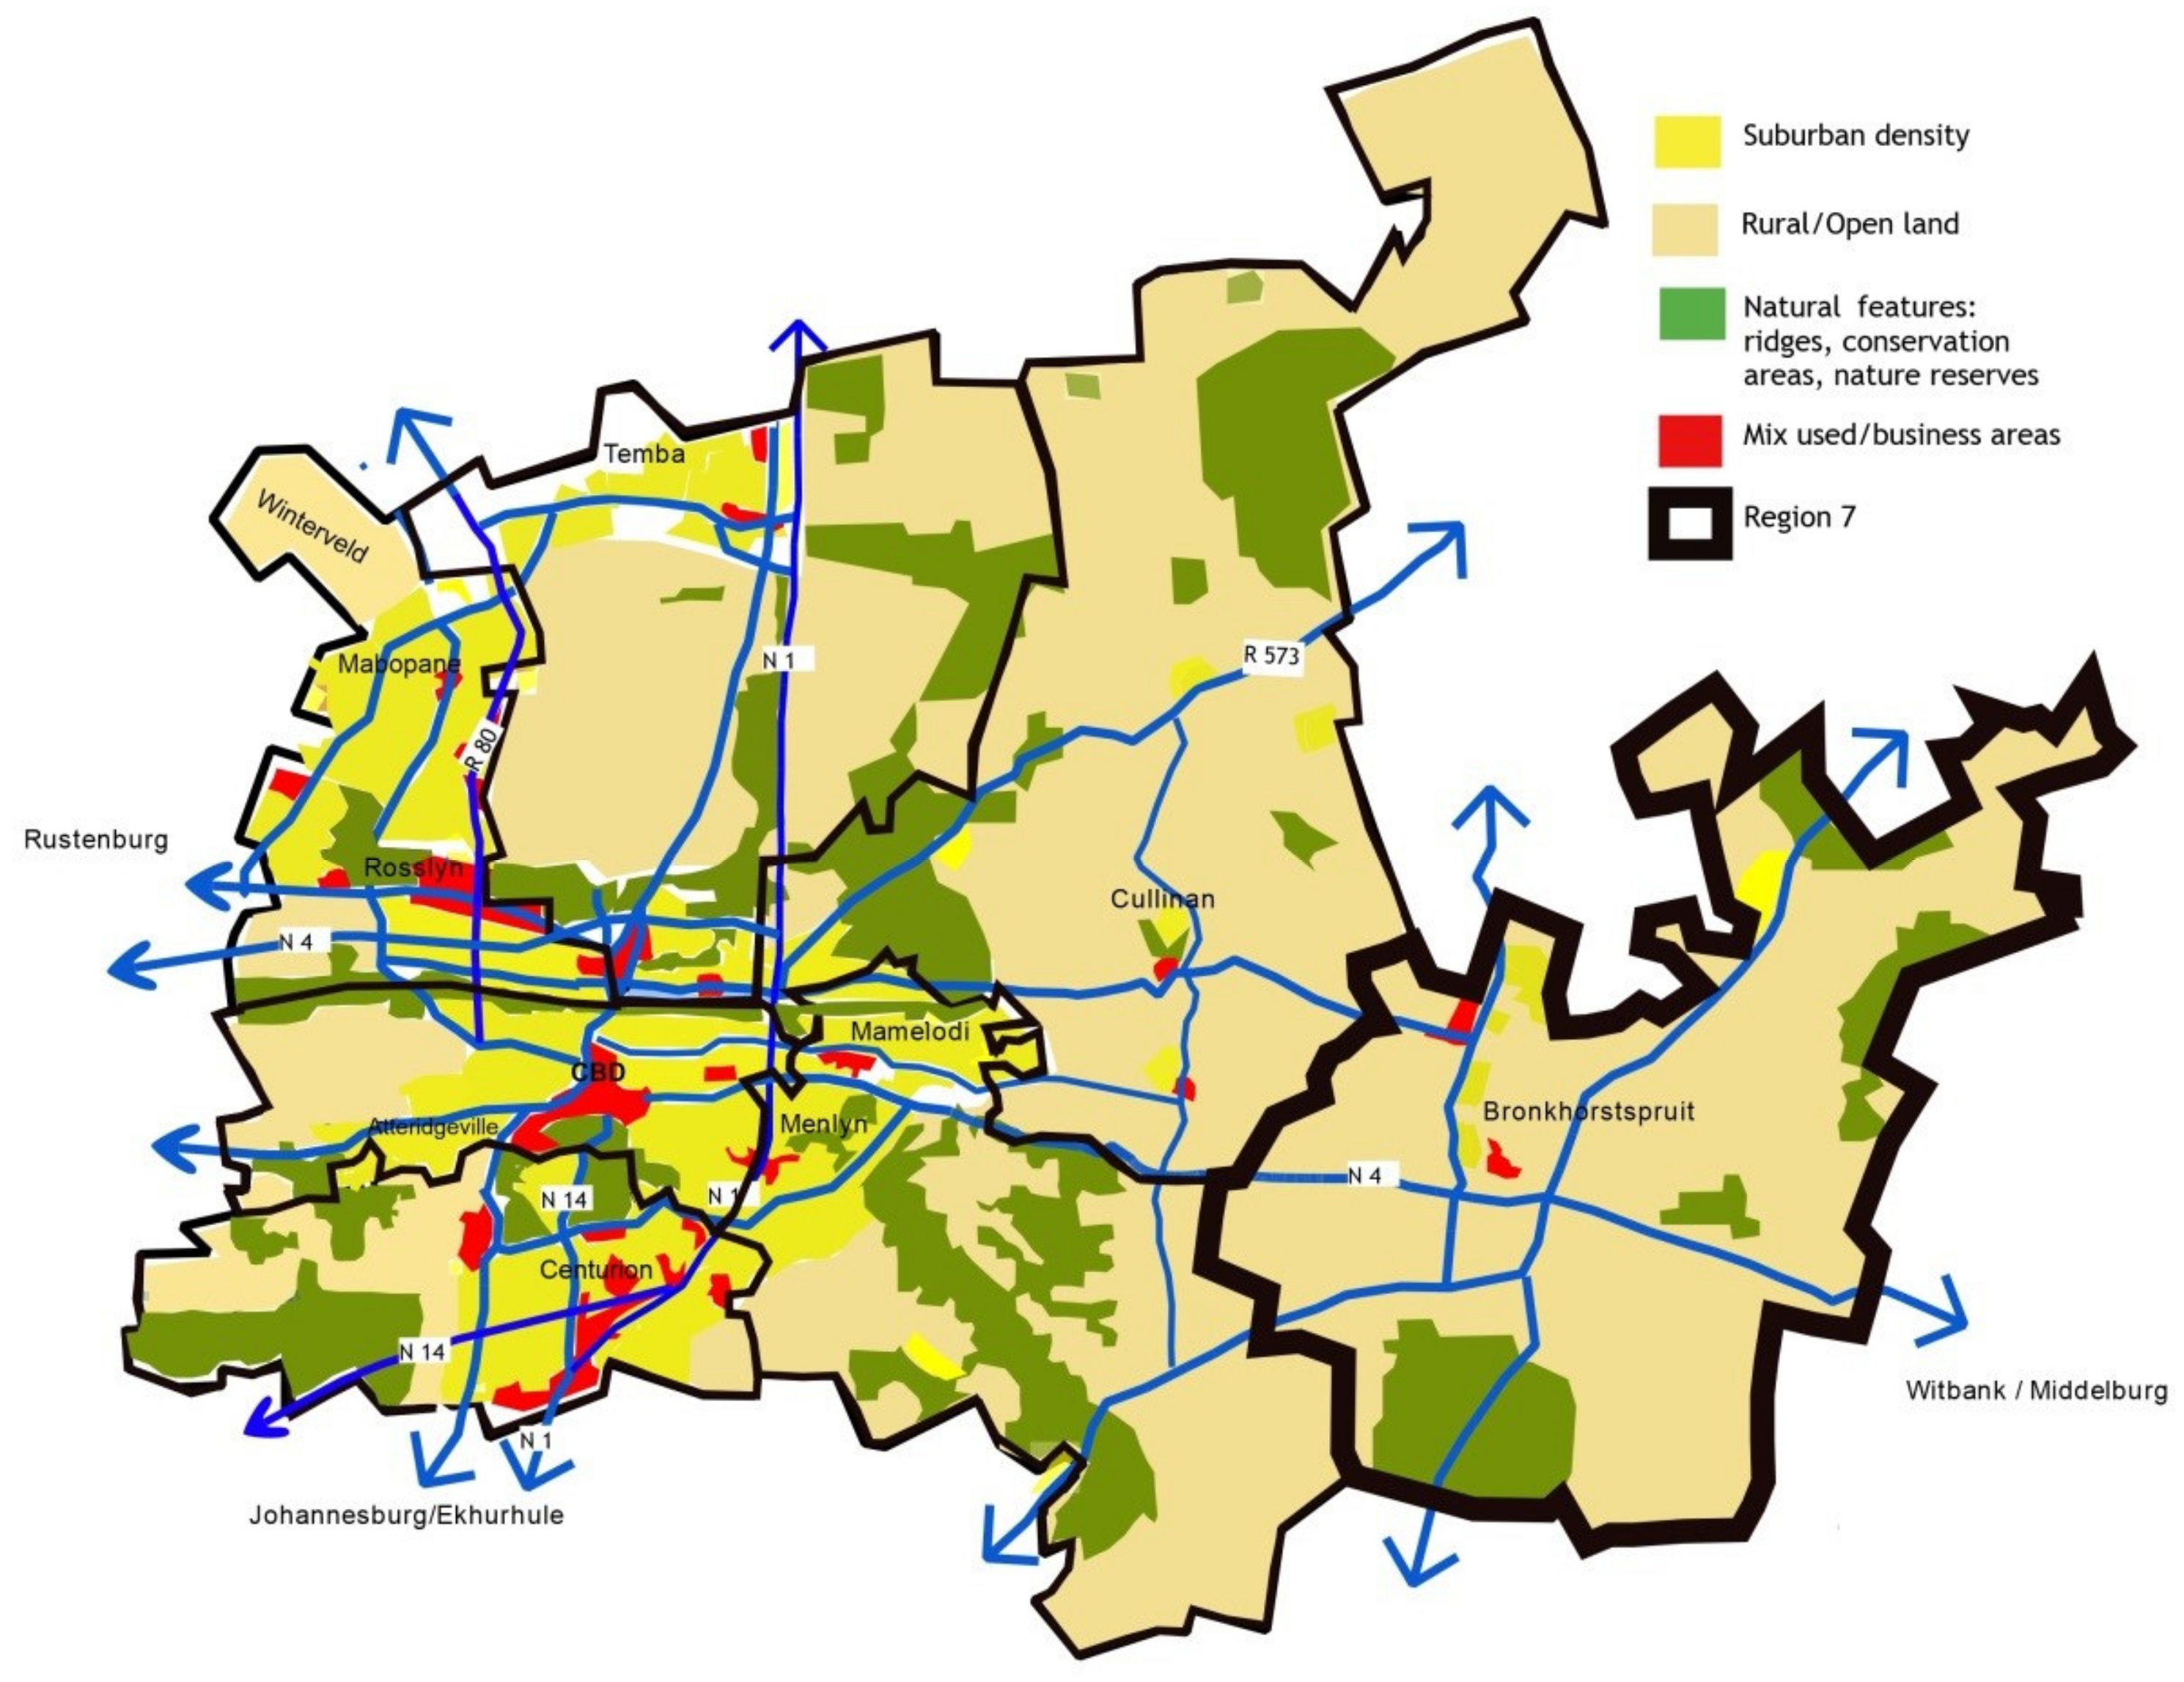
Three hotspots were detected for the city, namely within Planning Regions 1, 2 and 3, which are among the most densely populated regions. The most densely populated region is Region 1, which is situated in the North-West corner of the city’s jurisdiction and accommodates 811,570 (28%) residents out of a population of 2,921,488, according to the 2011 census. The region has 28 wards and includes Soshanguve, Mabopane, Winterveld, Ga-Rankuwa and Pretoria North, as well as a provincial road (R80) which is a Class 1 primary metropolitan distributor for that location.
The higher pavement temperatures were observed to coincide with the built-up areas, according to the locality map which illustrates the various general land uses for the city, as seen in
Figure 13. Lower pavement temperatures were observed for the Southeast areas, which also have a lower population density and more rural land coverage compared to the other planning regions.
The effect of UHI would need to be similarly investigated for other metropolitan cities in the continent to determine the direct effect on bituminous binder selections. While it is acknowledged that the continent primarily consists of natural land cover, i.e., trees, shrubs, cropland, grassland and areas with sparse to no vegetation [
44], there are concentrated areas across the continent, usually in and around metropolitan cities that can have a potentially significant UHI effect. Therefore, this may need to be assessed in order to understand the impact of heat islands, particularly for the high-volume road design and construction in these areas. The projections by [
45] also indicated rapid rates of urbanization and population growth, above 50%, for some of the fastest growing cities in Africa—namely, Dar es Salaam (Tanzania), Nairobi (Kenya), Kinshasa (Democratic Republic of Congo), Luanda (Angola), Addis Ababa (Ethiopia), Abidjan (Côte d’Ivoire) and Dakar (Senegal).
The high urbanization rates can subsequently lead to increased air and road temperatures, and thus facilitate the need to adjust how construction materials are selected. This may be true to maintain the integrity of roads but can also be managed to assist in reducing air temperatures through the implementation of “cool pavements” as a potential strategy.
4. Climate Data
The data source for air temperatures along with their collection method needs to be carefully considered, as each source is associated with a specific set of assumptions that need to be understood before using.
For correlations and comparisons, the method and the location of data collections need to be standardized. The ideal situation would be to compare two 20-year data sets from the same geographical location, i.e., comparing air temperature data and measured pavement temperature data. However, this becomes complicated considering the differences of terrain between the two points and the presence of microclimates, thus making the comparison unrealistic.
The different types of air temperature data sources for the temperature mapping discussed in this chapter include:
Weather station data
Satellite data
Reanalysis data
Global Climate Models
4.1. Weather Station Data
Data from weather stations can be collected from manual or automated weather stations. Spatially distributed and incomplete datasets from weather stations have been encountered, affecting the accuracy of the final output [
6,
46]. Weather stations vary in accuracy because they are prone to human errors, such as data recording and archiving errors. The location and placement of weather stations will also affect the type of data recorded and their relevance in developing pavement temperature maps. In African countries with a handful of weather stations, such data are only useful for calibration purposes. In addition, only a select number of weather stations measure air temperature, as rainfall data are the most recorded.
4.2. Satellite Data
Satellite data are often used where on-site measurements are not possible, unreliable or simply unavailable [
47], or where satellite-based precipitation data and reanalysis data were evaluated in comparison with the observed rain-gauge readings. [
47] found that the satellite data used in their investigation exhibited the highest correlation and the lowest deviation from the observed rain-gauge measurements. The importance of the temporal coverage was also highlighted during their investigation. Satellite-based information is usually subject to calibration errors, but it is usually a relatively accurate source of data [
48].
4.3. Reanalysis Models
Reanalysis models are derived from observed data (either from satellites or weather stations) and are useful for areas where observed data are unavailable. The MERRA (Modern-Era Retrospective Analysis for Research and Applications) database is an example of data obtained from a reanalysis model and is available on the LTPP InfoPave
TM [
49]. It combines computed model fields with ground-based, ocean-based, atmospheric-based and satellite-based observations [
50]. MERRA data were compared to weather station data and reported to be “as good and, in many cases, substantially better than equivalent ground-based weather station data” [
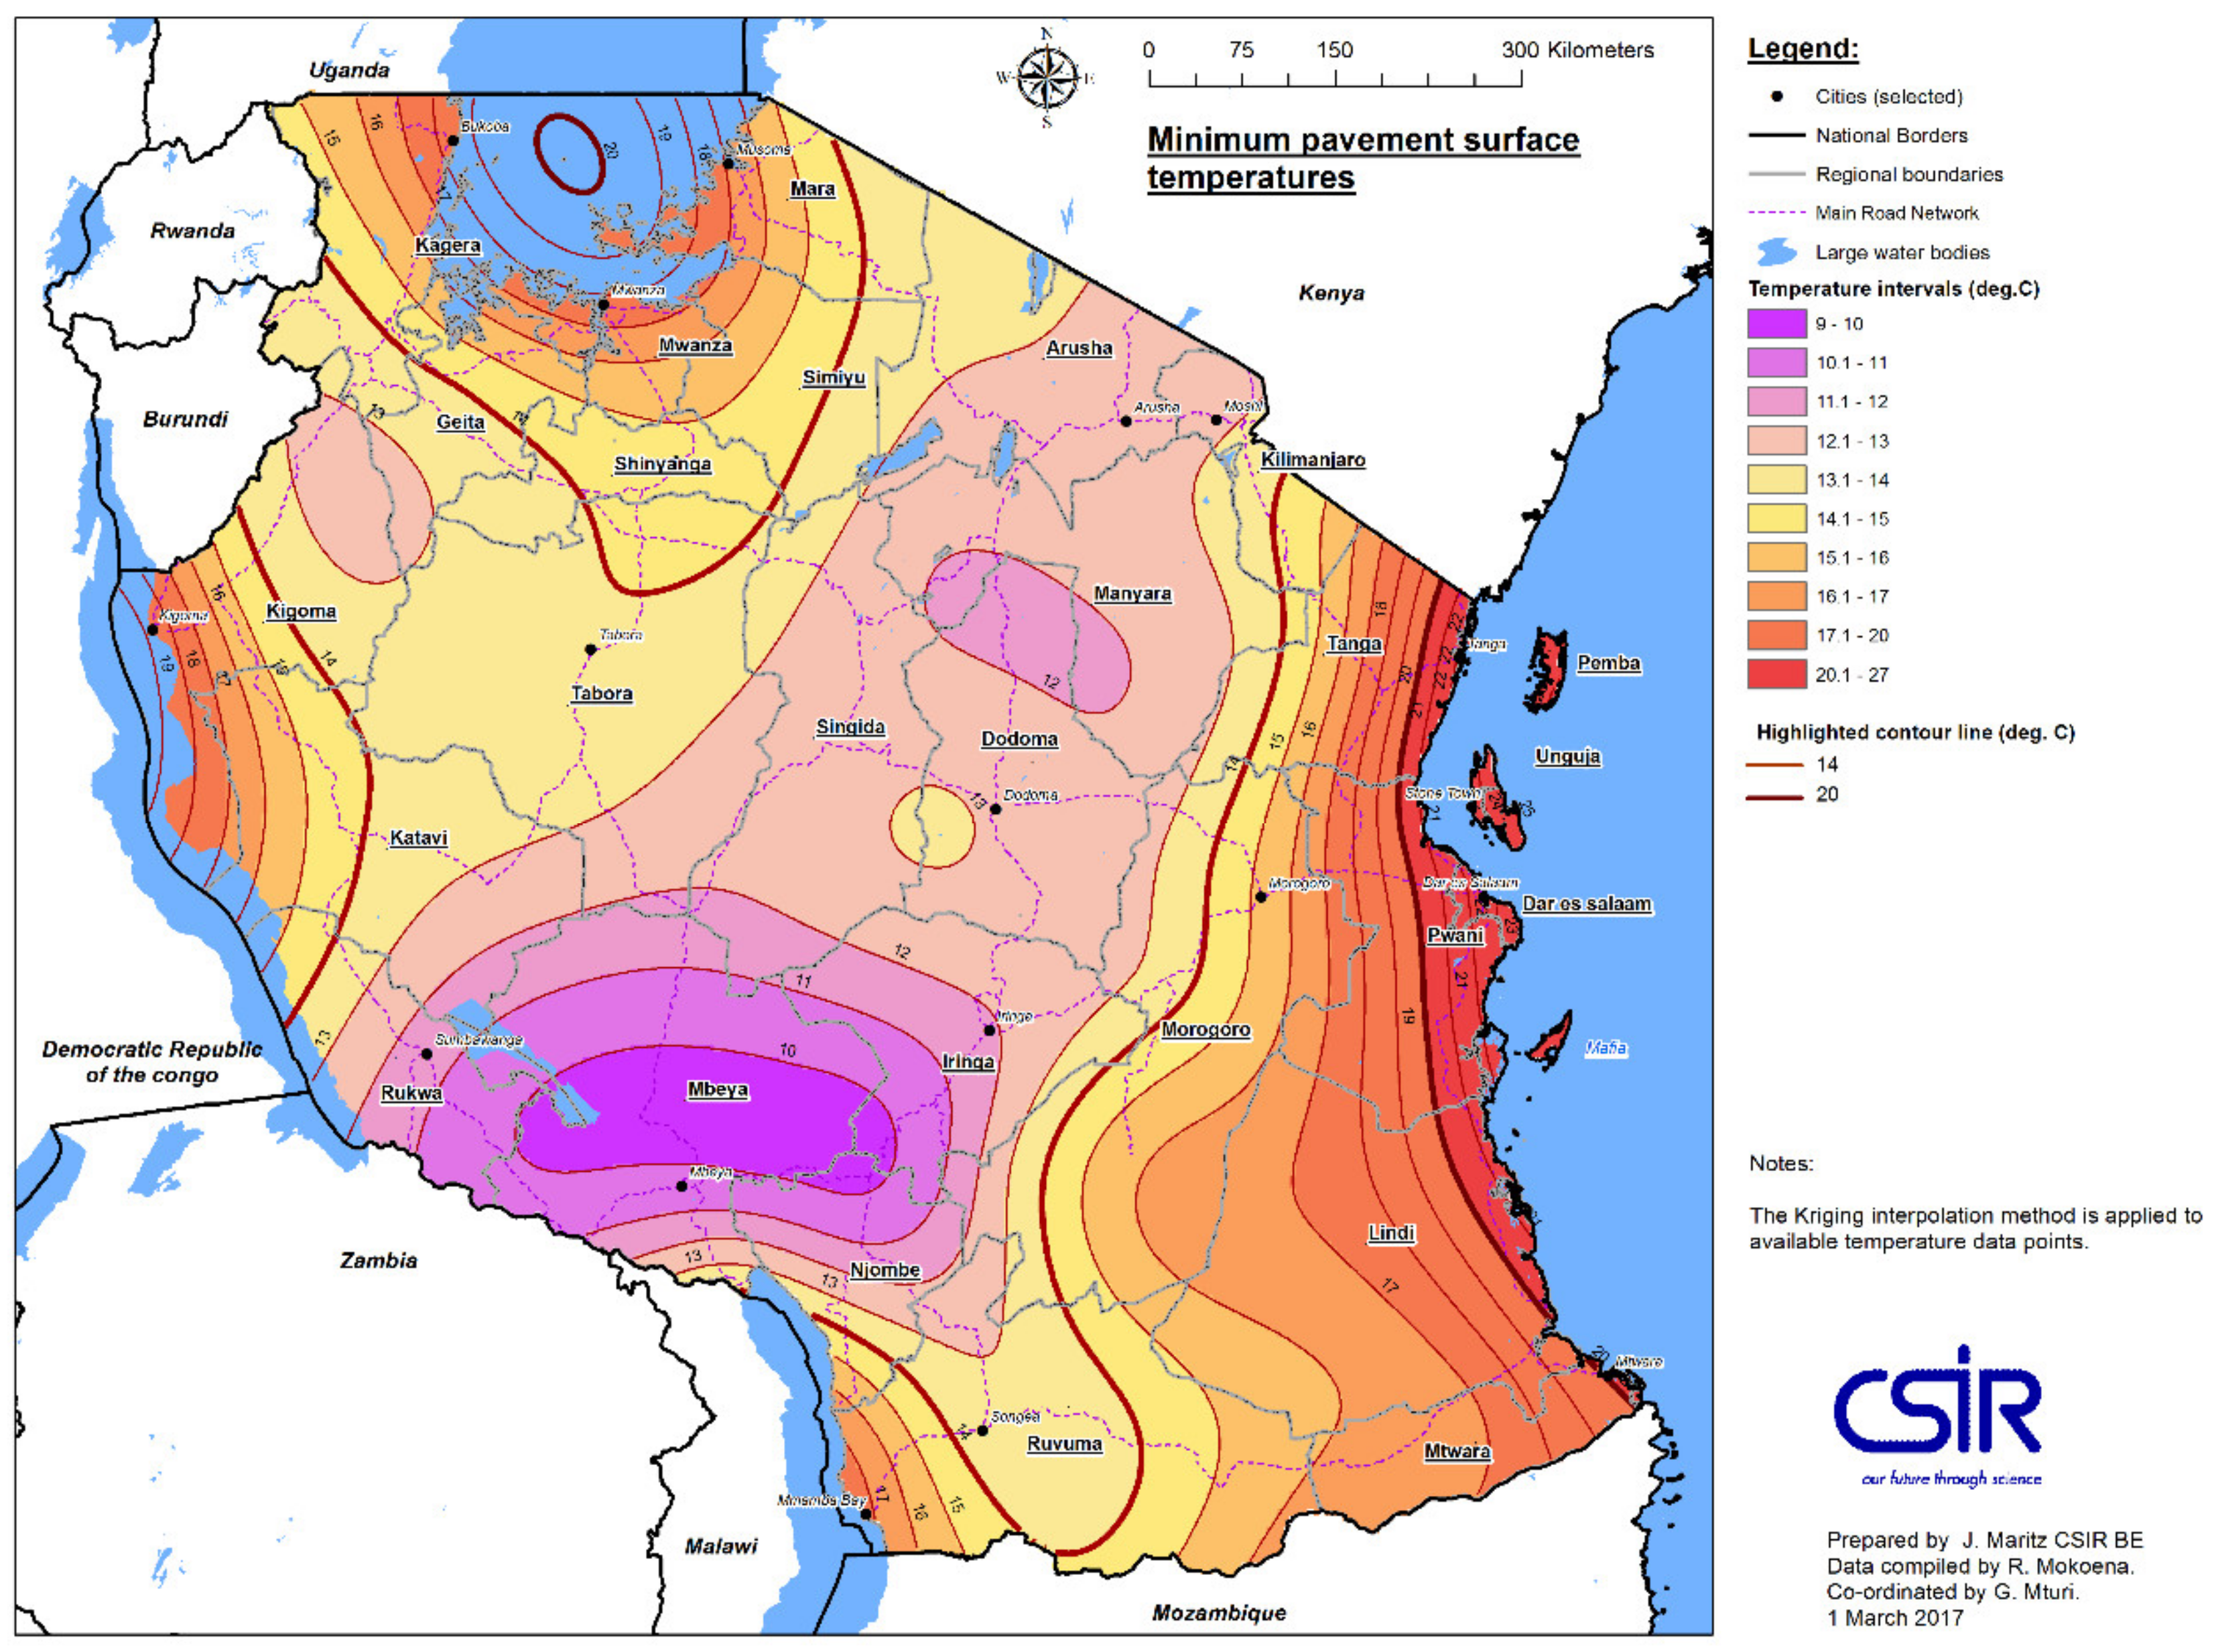
50]. A comparison was also conducted during the development of Tanzanian pavement temperature maps, and a variation ranging from <1 °C to 10.3 °C was observed [
6]. The MERRA database showed relatively higher temperatures and was therefore considered as a conservative option for setting the rutting PG temperature criteria for Tanzania. Given that pavements fail at extreme conditions, the measured historic air temperature data for South Africa and Tanzania were used to quantify the number of days with extreme pavement temperatures over the years. The maps developed for Tanzania used MERRA data and are shown in
Figure 14 and
Figure 15.
Reanalysis data are advised for African countries where missing weather station data is a common occurrence. Due to the nature of reanalysis data, bias correction for daily extreme points is recommended in order to obtain representable temperatures for binder selection.
Unless special precautions have been taken into consideration during the data collection process, the sources do not account either for complex landscapes or their potential effects on air temperatures.
The method used to obtain air temperature data will also affect the quality of the raw data. For instance, weather stations utilize thermometers placed inside Stevenson boxes to measure air temperature, whereas satellites measure radiances in different wavelength bands and mathematically invert them to obtain temperature inferences [
51,
52]. Even sources with common attributes will show differences in the data, as certain formulations and calibrations will differ and alter the data produced [
53]. It is also important to consider the sensitivity of the equipment used by a source, as it could also affect the data produced.
Data from the various sources can vary significantly due to inherent methodical, operator and instrumental errors leading to more pronounced effects on pavement temperature calculations depending on the model used.
4.4. Global Climate Models
Climate models are fundamentally based on the laws of physics and use mathematical equations to simulate global climates. Downscaling techniques are employed to obtain a higher geographical resolution and to better represent the regional climates usually required for road design procedures. Even with downscaling techniques, micro or meso-climates are often not well represented by climate models [
54] and would require a customized approach for specific road sections.
To obtain high-resolution climate data, climate model simulations covering the historic and future climate (1960–2100) were performed at a 50 km horizontal resolution globally, using the conformal-cubic atmospheric model (CCAM). The CCAM model is a variable-resolution global climate model (GCM) developed by the Commonwealth Scientific and Industrial Research Organization (CSIRO) [
55,
56,
57]. The CCAM model is run coupled with a dynamical land-surface model known as the CSIRO Atmosphere Biosphere Land Exchange (CABLE). For the global runs, the two GCM models were used to force CCAM-CABLE with bias-adjusted sea-surface temperatures (SSTs) and sea-ice concentration. The GCMs in this study are the Community Climate and Earth-System Simulator (ACCESS1-0) and the National Centre for Meteorological Research Coupled Global Climate Model, version 5 (CNRM-CM5). Both GCMs’ outputs, used as CCAM-CABLE forcing data, formed part of the Coupled Model Intercomparison Project Phase Five (CMIP5) and the Assessment Report Five (AR5) of the Intergovernmental Panel on Climate Change (IPCC).
The obtained CCCAM-CABLE native model outputs were further downscaled to a high resolution of 8 km (0.08° degrees in latitude and longitude) using a spectral-nudging strategy. Subsequently, the 8 km horizontal was further downscaled to a 1 km resolution using CCAM-CABLE coupled with an urban canopy scheme that is based on the Town Energy Budget approach [
58]. The native CCAM-CABLE data used in this case derived from the proceeding downscaling experiment with CNRM-CM5 model forcing data. All the high-resolution downscaling model experiments were conducted with CCAM-CABLE prescribed with atmospheric CO
2, sulphate and ozone under the Representative Concentration pathway 8.5 (RCP8.5), which is commonly referred to as the low-mitigation scenario for the 21st century. The ability of CCAM-CABLE to simulate climate over Southern Africa has been showcased in several scientific outputs [
59,
60,
61,
62,
63,
64].
The 8-km horizontal downscaling based on ACCESS1-0 forcings is used to demonstrate South Africa’s wide long-term average pavement spatial pattern temperatures, while the spatial features of the urban pavement temperature at 1 km are depicted using CCAM native outputs obtained from the CNRM-CM5 model downscaling.
Depending on the data collection method, data cleaning is required particularly along the coastal regions, as shown in
Figure 16, and within the proximity of other large water bodies prior to processing, so that the road temperatures are accurately represented. This is essential in order to avoid skewed results leading to lower temperature grades of bitumen being allocated to certain regions.
4.5. Designing for Current vs. Future Scenario
Past research has shown that, due to climate change, there is a necessity to plan and design pavements for expected climatic conditions rather than historic climates [
65,
66,
67,
68,
69]. This can be challenging because there are limited standardized procedures to do so. It is also not a simple exercise because climate models are not predictions or forecasts, but rather projections according to the likelihood of future CO
2 emissions. Therefore, using exact outputs from the models for engineering design purposes may not be appropriate. Simulation outputs are best used to allow informed planning that can provide indicators for the development of guidelines.
The importance of considering climate change projections in this process and incorporating the expected future increases in temperatures has been previously demonstrated, due to the potentially adverse effects that climate change may have on bituminous binder selection [
42]. The authors incorporated a high-resolution model simulation of present-day climate as well as future climate projections for South Africa. With coupling and corrections for specific terrains, the conformal-cubic atmospheric model (CCAM) [
55,
56,
57] has a proven ability to realistically simulate the present-day Southern African climate. Although a low-mitigation scenario climate model was used based on average air temperatures, the observed impact appeared significant and prompted the South African pavement industry resolution to research mitigation measures.
They demonstrated an increase of up to 7 °C in maximum pavement temperatures between four 20-year periods spanning between 1980 and 2060.
Figure 17 shows a trend depicting an increase in extreme temperatures.
Given the impacts of climate change on the air and, consequently, on the pavement temperatures, there is a need to develop a customized approach for Africa with projections of extreme pavement temperatures into future scenarios, for incorporation into designs and bitumen selection specifications.
5. Mapping Considerations
To assist during the process of specifying the asphalt bitumen, country pavement temperature maps are generated from calculated pavement temperature points according to the latitude and longitude co-ordinates.
In order to extend these data points across a country, an interpolation process is applied. The selected general interpolation technique is the Kriging method or a Gaussian process of regression [
43,
70]. Kriging assumes that the distance or direction between the sample points reflects a spatial correlation that can be used to explain the variation in the surface. The Kriging tool fits a mathematical function to a specified number of points, or all points within a specified radius, to determine the output value for each location. Like most interpolation techniques, Kriging is built on the basis that things that are close to one another are more alike than those farther away (quantified here as spatial autocorrelation).
The input dataset obtained from weather stations is not always comprehensive but is still considered to be the most representative. Given the limited number of data points from weather stations and the Kriging interpolation used to generate the maps, based on the interpolation technique, the most accurate pavement temperatures are obtained within the proximity of the existing weather stations. This contrasts with temperature maps developed from climate modelling data, where the calculated points are based on grid points obtained from downscaling techniques and not from weather station locations.
The factors to consider, which affect the reliability of pavement temperature maps include the number and distribution of data points as well as the accuracy of the Kriging interpolation method at points between known values.
Therefore, there is a need for a statistical methodology to define the distribution with respect to the road network.
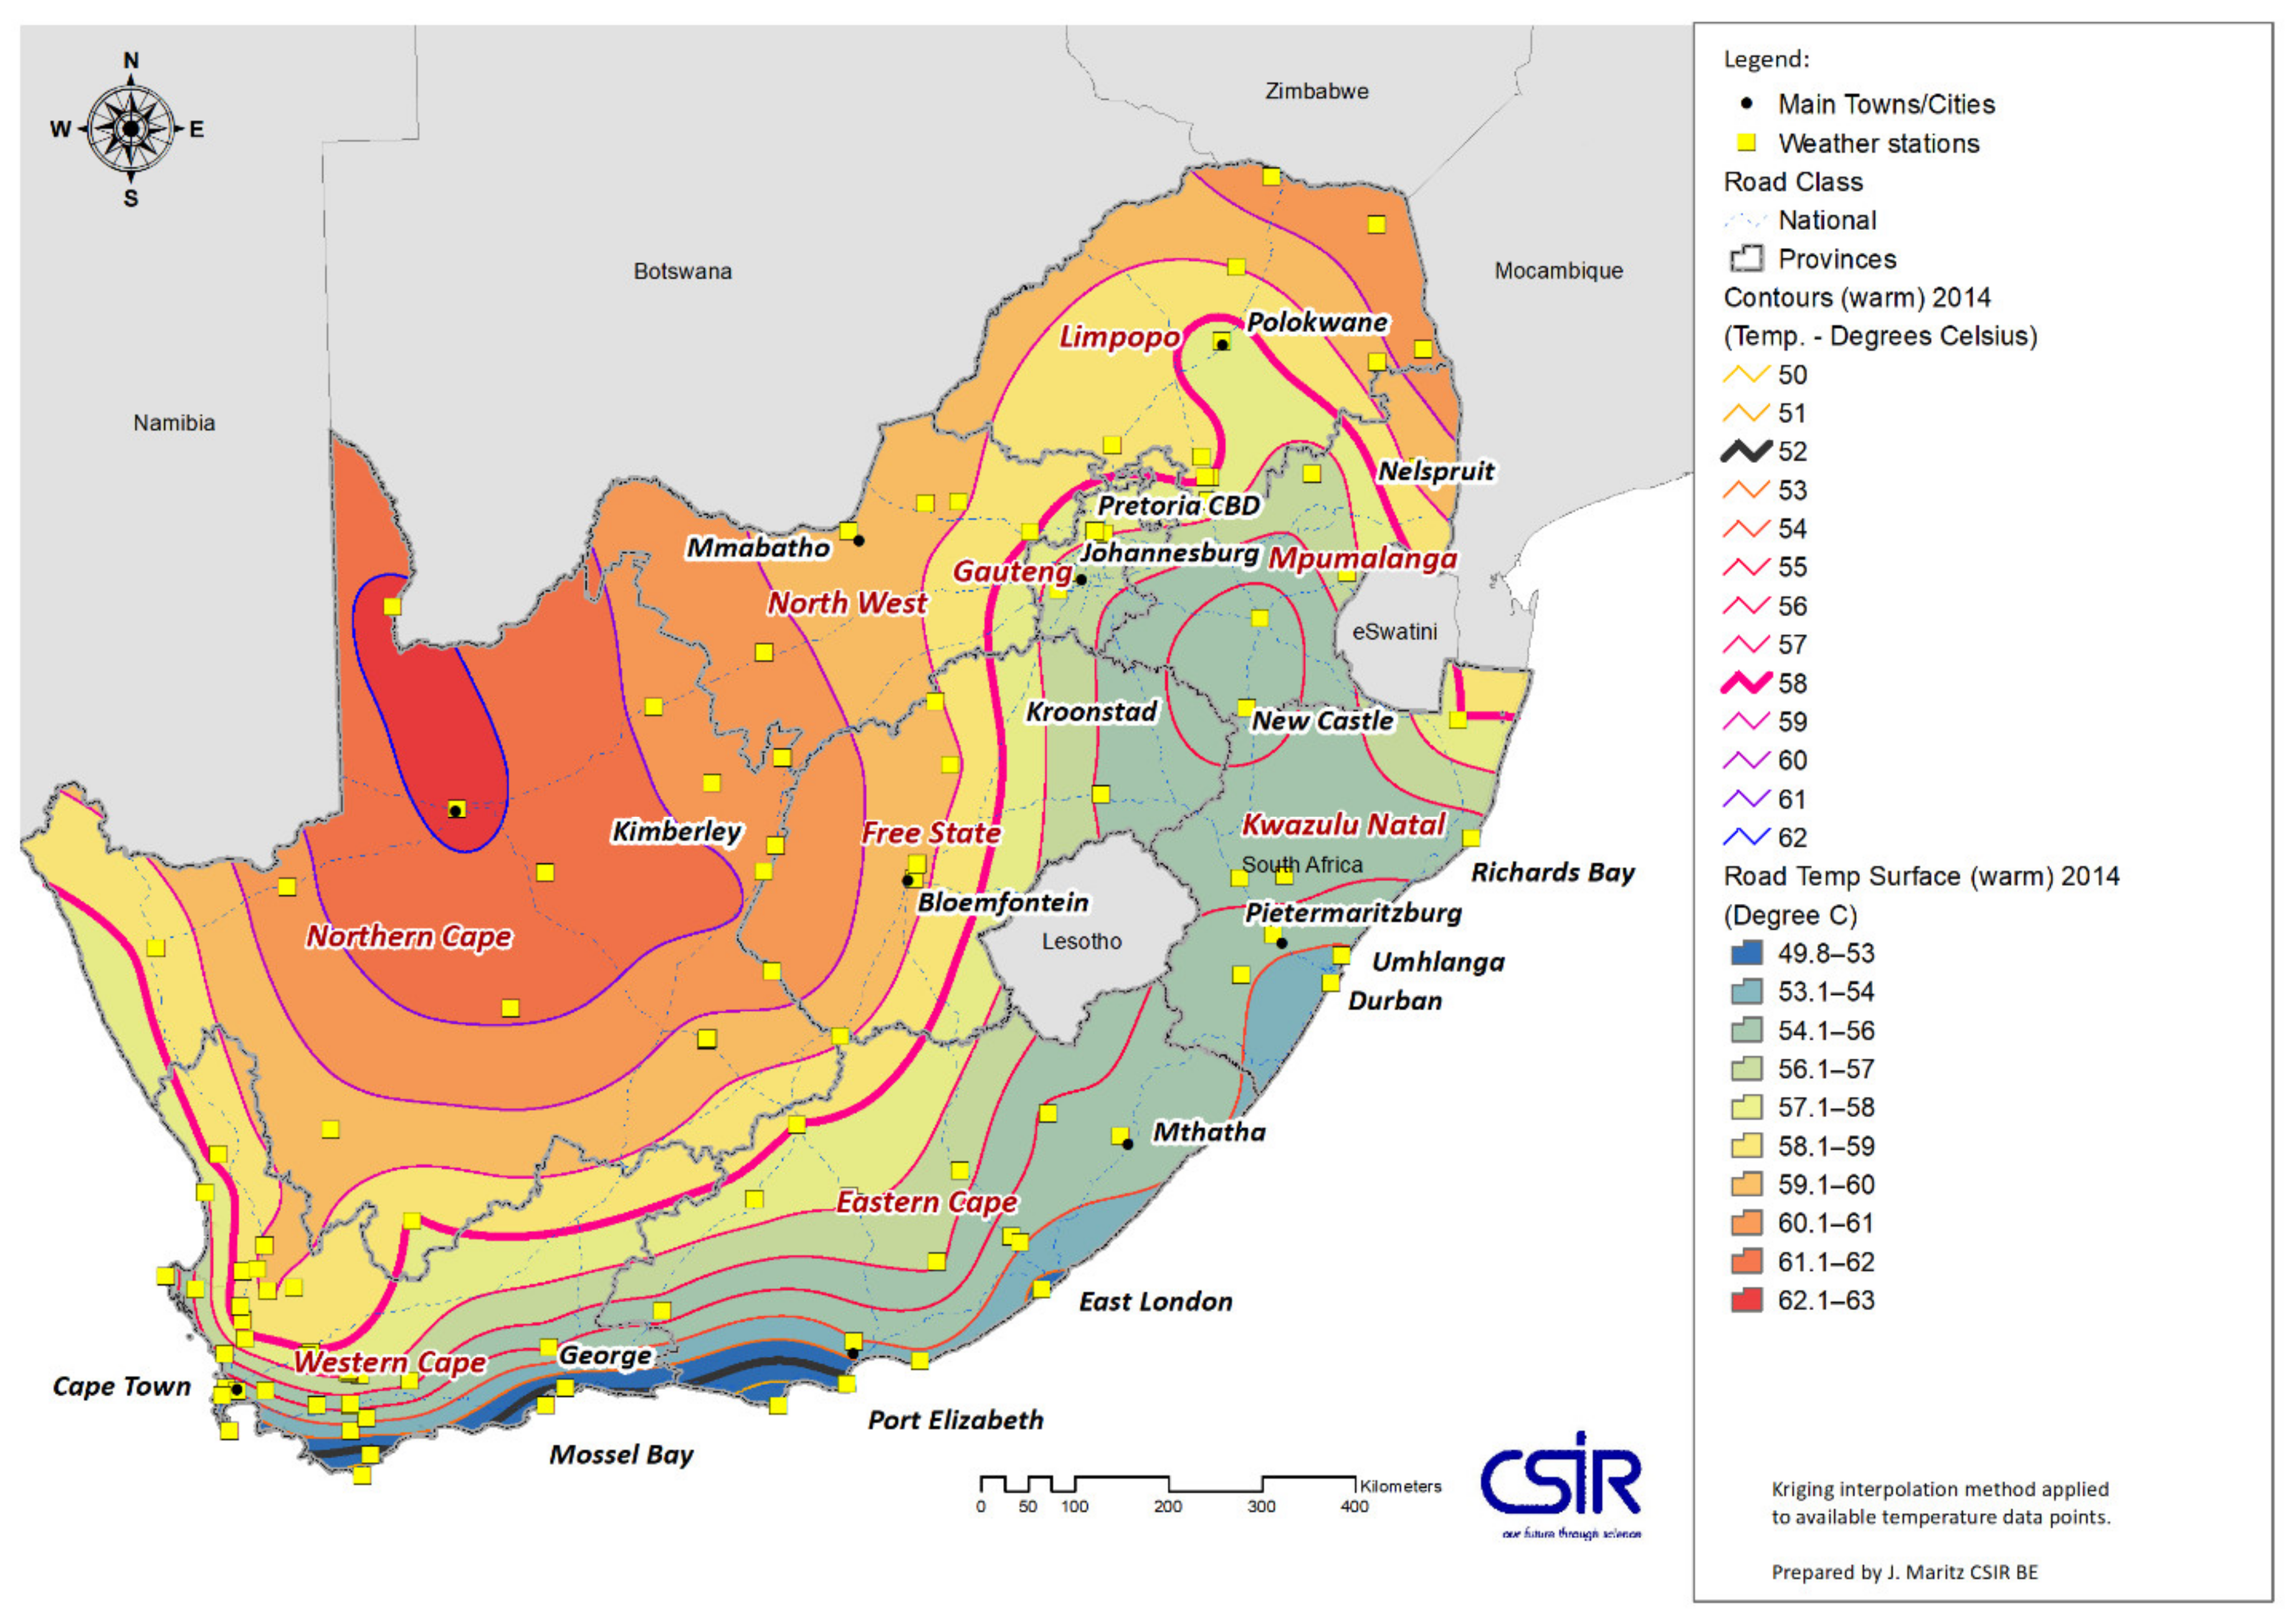
Figure 18 shows the weather stations superimposed onto the current South African temperature map based on the data from 122 weather stations [
43], where the national road network is illustrated in blue. Given the difference in nature of both data sources (weather station vs. climate model), a direct comparison of the spatial distribution between both maps cannot be made.
Figure 19 shows the comparison of the distribution of the weather station points vs. the 8 × 8 km grid acquired from the climate model across South Africa. The current temperature maps [
43] are based on measured data but limited to only a few sites in comparison to the climate model. This results in less accuracy, particularly in areas where weather stations are far from one another.
A comparison was therefore made between the results obtained from an 8 × 8 km grid and selected data points from the same model. The reduced points were located at the same position as the weather stations used for producing the current maps.
Figure 20 and
Figure 21 illustrate the difference in temperature maps depending on the number of points as well as the distribution of those points. It is demonstrated that a change in the number and distribution of points affects the distance between the contour plots and the resolution of the maps, which becomes more important for regional road planning, design and construction. In areas with few and distant spatialized weather station data, the bitumen performance-grading requirement of local roads can be inaccurate. This effect is demonstrated by the steep contour plots observed in the Western Cape region, where there are several weather stations located near each other in comparison to the rest of the country. An increase in the PG binder requirement is observed in Polokwane as well as along the Northern/Western Cape border, with a higher resolution data source. The introduction of a PG 58 zone in the Western/Eastern Cape is also observed for the same reason.
The Kernell Density “interpretation” process, which was used for developing the maps, relies on more points to increase the accuracy of the maps, thus making the modelled data more advantageous due to its higher resolution and regular distribution across the country.
For the foreseeable future, the use of climate models and mapping for material selection presents a promising outlook for engineering design, where expected weather events resulting from a changing climate can be accommodated for in the provision of resilient road infrastructure. The effects of climate change usually affect a region spanning multiple countries, which may also influence the process of using downscaled climate models.
6. Conclusions
The African case studies presented in this paper show the critical factors for the development of the temperature maps that are necessary for the performance-graded bitumen selection used in asphalt pavement design and construction. The findings highlight the influence of the following identified parameters:
The selection of a pavement temperature model
The effect of urban heat islands on bituminous binder selection
Source of climate data
Mapping considerations and scale of use
The calculation of pavement temperatures is the foundation of temperature zoning, and, depending on the model, it must take into consideration the pavement structure and the material’s thermal properties, as well as the weather conditions, which are dependent on the prevailing regional climate. Most pavement temperature models are fundamentally based on the theory of heat transfer and can be categorized based on the method of calculation. For the purpose of producing national temperature maps, empirical models can be used and are usually preferred over analytical and numerical models, since less computation is required and they usually provide a simplified relationship between pavement temperatures and key weather parameters. With the use of empirical models, the calibration against other areas within the country is also recommended in order to obtain pavement temperatures that are representative of the various climatic zones prevalent in the country.
For this paper, an urban heat island model for a local South African municipality was used to develop corresponding pavement temperature maps, and minimal differences were observed in the maximum pavement temperatures. However, the formation of heat island hotspots in the city had a significant effect on the minimum pavement temperatures, where an increase by two performance grades was observed in comparison to the calculated minimum pavement temperatures at the national scale. The findings indicated that a conservative PG allocation for minimum temperatures can be expected in areas where urban heat islands occur.
The ideal air temperature source for pavement temperature calculations is provided by the most recent observed measurements. This paper showed that due to the sparse distribution of weather stations and the sometimes inconsistent datasets produced by the weather stations, parameter outputs from reanalysis or satellite models are a more convenient solution, given that they are based on observed measurements. Engineering designs are often based on historical and extreme weather observations, but this is restricting when infrastructure is designed and built to withstand expected conditions. With a changing global climate, it is necessary to make informed planning and design decisions based on the expected changes in climatic conditions. This paper discussed the usefulness of downscaled Global Climate Models for adaptive engineering design, as they can simulate expected climates for specified emission scenarios.
Finally, the paper also presented and discussed geographical mapping considerations for the purpose of selecting performance-graded bitumen. Pavement temperature visualization in the form of geographical maps is a particularly useful tool for engineers in selecting the most appropriate binder for a particular location. This paper showed that, depending on the specific scale and use required, the choice of data source will affect the resolution and accuracy of the map.


