1. Introduction: Residential Segregation and Housing Insecurity on a European Scale
The recent growth social of inequality has a strong urban dimension, not only because cities are places where such inequality grows quickly, but also because the physical and social characteristics of different urban spaces have a strong influence on different social group’s living conditions and perspectives. Urban segregation—referred to as the tendency of different social and ethnic groups to segregate across space, according to their level of income and other related variables—plays an important role in the reproduction of inequality. Moreover, urban segregation can also be defined as a structural phenomenon, consubstantial to the capitalist urbanization process, that implies a correlation between several variables closely related to income (unemployment, the presence of immigrants, cadastral value of real estate) and the territorial distribution of the population. As social inequalities increase, so does urban segregation [
1].
The root of socio-spatial inequalities are to be found in the political and economic changes that, since the 1970s and the advent of globalization, have generated both rapid economic growth and increasing inequalities [
2,
3,
4]. The economic crisis of 2008 intensified this process, redrawing the global map of inequalities [
4] with serious consequences: in particular, on the housing market both as a financial asset [
5] and as a primary good, with some countries particularly affected, such as Spain [
6]. The consequences of the crisis have been exacerbated by deregulation and privatization policies that have led to cuts in social housing policies [
7,
8]. The social groups that have suffered most from housing insecurity are those who are already in a precarious situation to begin with: low-income households [
8,
9,
10,
11]; ethnic minorities and migrants from third countries [
12,
13]; and those effected by internal displacements that have arisen from urbanization processes, as occurred in China [
14,
15]. These groups are subject to what Clark [
16] described in 1986 as ‘residential segregation’, determined by significant levels of separation between black and white groups in major US cities, caused not only by economic factors, but also by the housing choices of individual groups. This theme of housing choices was investigated by Clark [
11] himself in 2009, in a study in which he highlighted how, on the one hand, African-American families with average incomes sought housing in more integrated areas, and on the other, groups of white families with comparable incomes preferred areas less populated by African-Americans, a phenomenon also observed in the Netherlands by Bolt et al. [
17], although residential segregation is a phenomenon that varies in its characteristics from country to country, and from city to city [
18]. On the whole, we can observe a general tendency of individuals to prefer housing solutions in areas manned by the social groups they belong to [
19]. Residential segregation also has major consequences on the use of services. This issue accentuates the social exclusion of low-income members who are thus cut off from areas where economic growth and the best educational institutions are concentrated [
9,
20,
21]. Thus, this contributes to the limiting of economic growth in the areas where the phenomenon is observed [
22]. Anderson et al. [
23] noted that, in addition to residential segregation, there is a real problem in terms of the supply of adequate housing for low-income families, due to the limited availability of rental properties to individuals or families belonging to ethnic minorities [
12]. Consequently, migrants’ housing choices are also linked to the availability of public housing [
24], because of the ineffectiveness of the remaining social housing policies [
25]. In some cases, such as in the United States, the opposition to the creation of neighborhoods for low-income families has been observed, due to fears of possible increases in crime, and decreases in property values by the inhabitants of neighboring areas [
26]. Indeed, residential segregation has also had negative effects on social cohesion, reducing awareness of economic and social inequalities among middle- and high-income groups [
27].
Although most of the studies on housing issues have focused on the United States and its main urban centers, in recent years, especially following the 2008 crisis, the phenomena related to housing insecurity and residential segregation have also begun to be studied in Europe, becoming topics of institutional debate [
28]. The latest report commissioned by the European Parliament on affordable housing dates back to 2018, and sheds light on the need for a change of pace in terms of investment in social policies, aimed at ensuring the fundamental right to housing. The report refers to an investment gap in the European Union, quantified at around 57 billion euros per year [
29], with significant differences between individual European countries: Northern European countries, such as the Netherlands, Denmark, Ireland, and Finland, have high average levels of social-housing, whereas the Mediterranean and former Soviet countries have a lower stock of social housing [
30]. Overall, despite a general downturn in housing-related social policies in Europe, in times of crisis, those Northern European countries have not only responded to the housing needs of people in difficulty, but have also proven to be a tool for mitigating the negative effects on the economy, particularly in the housing sector, which is particularly vulnerable in the context of a recession [
31]. However, due to the financialization of the housing sector, over the last 30 years before the crisis, the ability of low-income people to access housing has deteriorated [
32].
According to Eurostat data [
33], the increase in housing insecurity has also been exacerbated by the sharp rise in rents, which has affected all EU countries, but in particular those with weaker social housing policies, such as the countries of Eastern Europe, where (
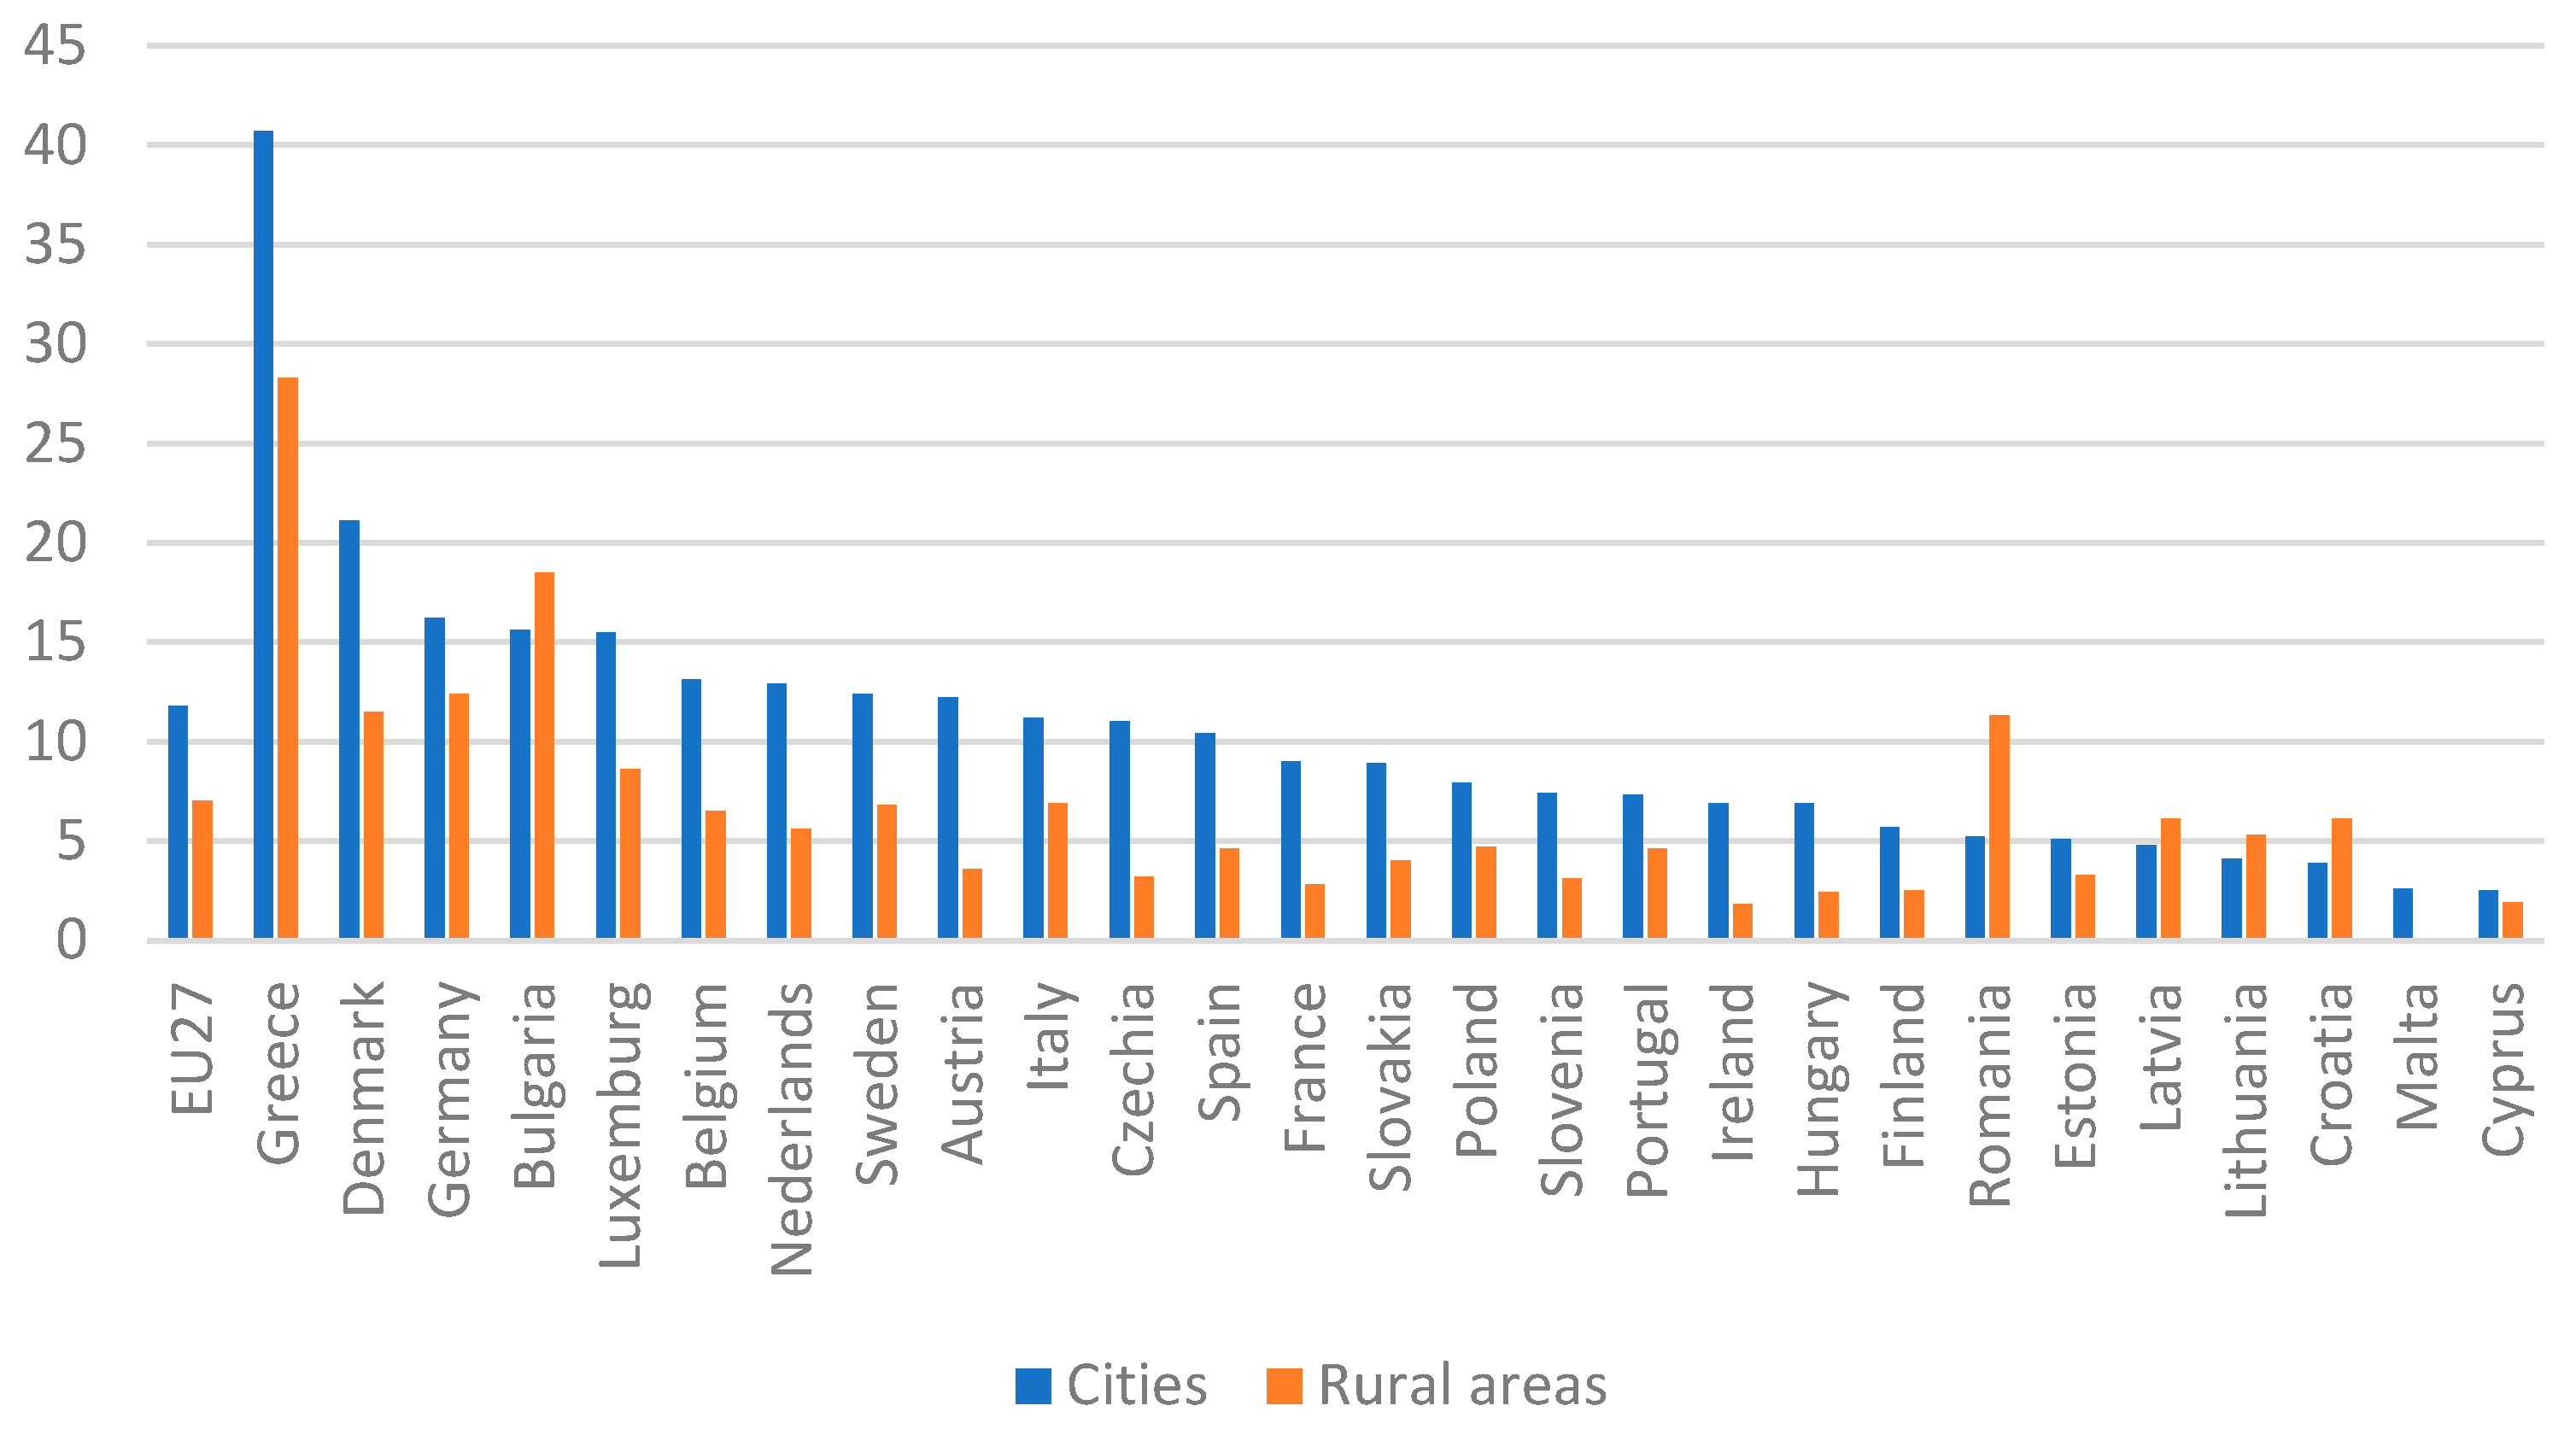
Figure 1) there is a lower rate of people living in rented accommodation. Generally speaking, the cost of maintaining a dwelling has a significant impact on a family’s expenditure. On average in Europe (
Figure 2), 11.8% of the population living in urban areas spend over 40 per cent of their income on housing, whereas in rural areas the rate falls to 7%. In general, the incidence of housing costs is lower in rural areas, with the exceptions of Bulgaria, Romania, Lithuania and Croatia. With the exclusion of Greece—which is more than three times the European average for cities, and more than four times in rural areas—in the rest of Europe, the figure is fairly homogeneous with the northern countries, all recording a higher-than-average figure, especially in urban areas. This is also confirmed by
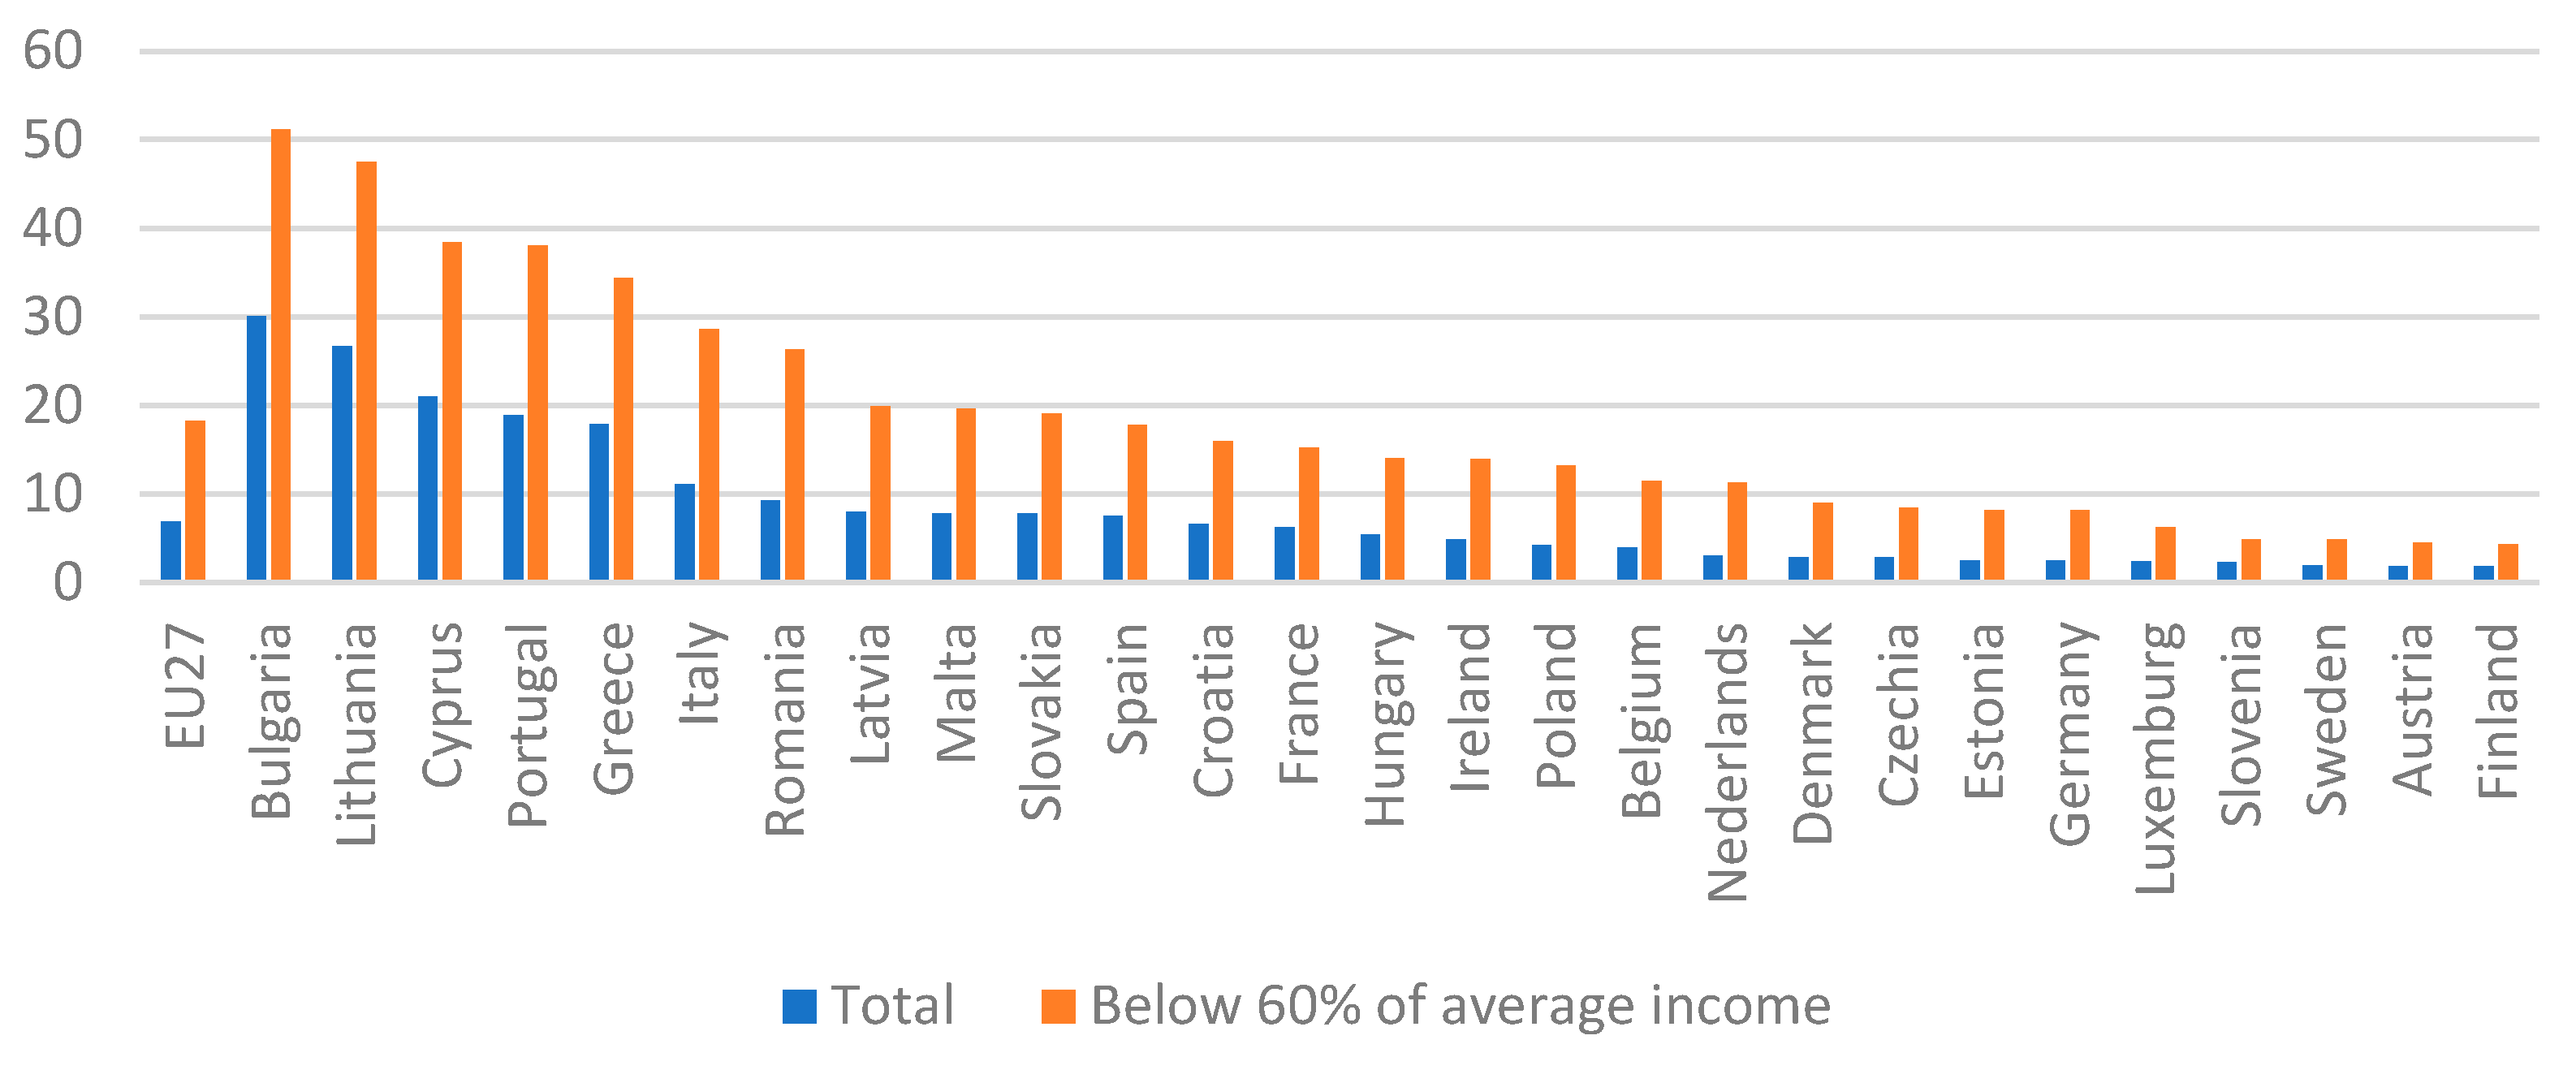
Figure 3, which shows the average percentage of income spent on housing. In the northern countries this is higher than the European average, especially for people whose income is below 60% of the average. In Denmark, for example, 57.7% of the income of this population group is spent on housing, although the figure for Germany (49%), the Netherlands (45.7%) and Sweden (44.8%) is also high. Generally speaking, these countries seem to record higher housing-related costs than the European average. However, at the same time, they can benefit from more solid social housing policies that more effectively mitigate the discomfort linked to the housing insecurity of the weakest groups.
In addition to the issue of whether or not it is possible to have access to housing, there is also the issue of the quality of life within it. Within the European Union, in fact, around 30% of people with an income below 60% of the average live in overcrowded housing (
Figure 4), with peaks of over 50% in Slovakia, Romania and high overall figures throughout Eastern Europe. Taking the overall picture, without differences in income, 17.1% of the population in Europe lives in overcrowded housing. Eastern Europe shows, once more, the highest figures, together with Italy (28.3%) and Greece (28.7%).
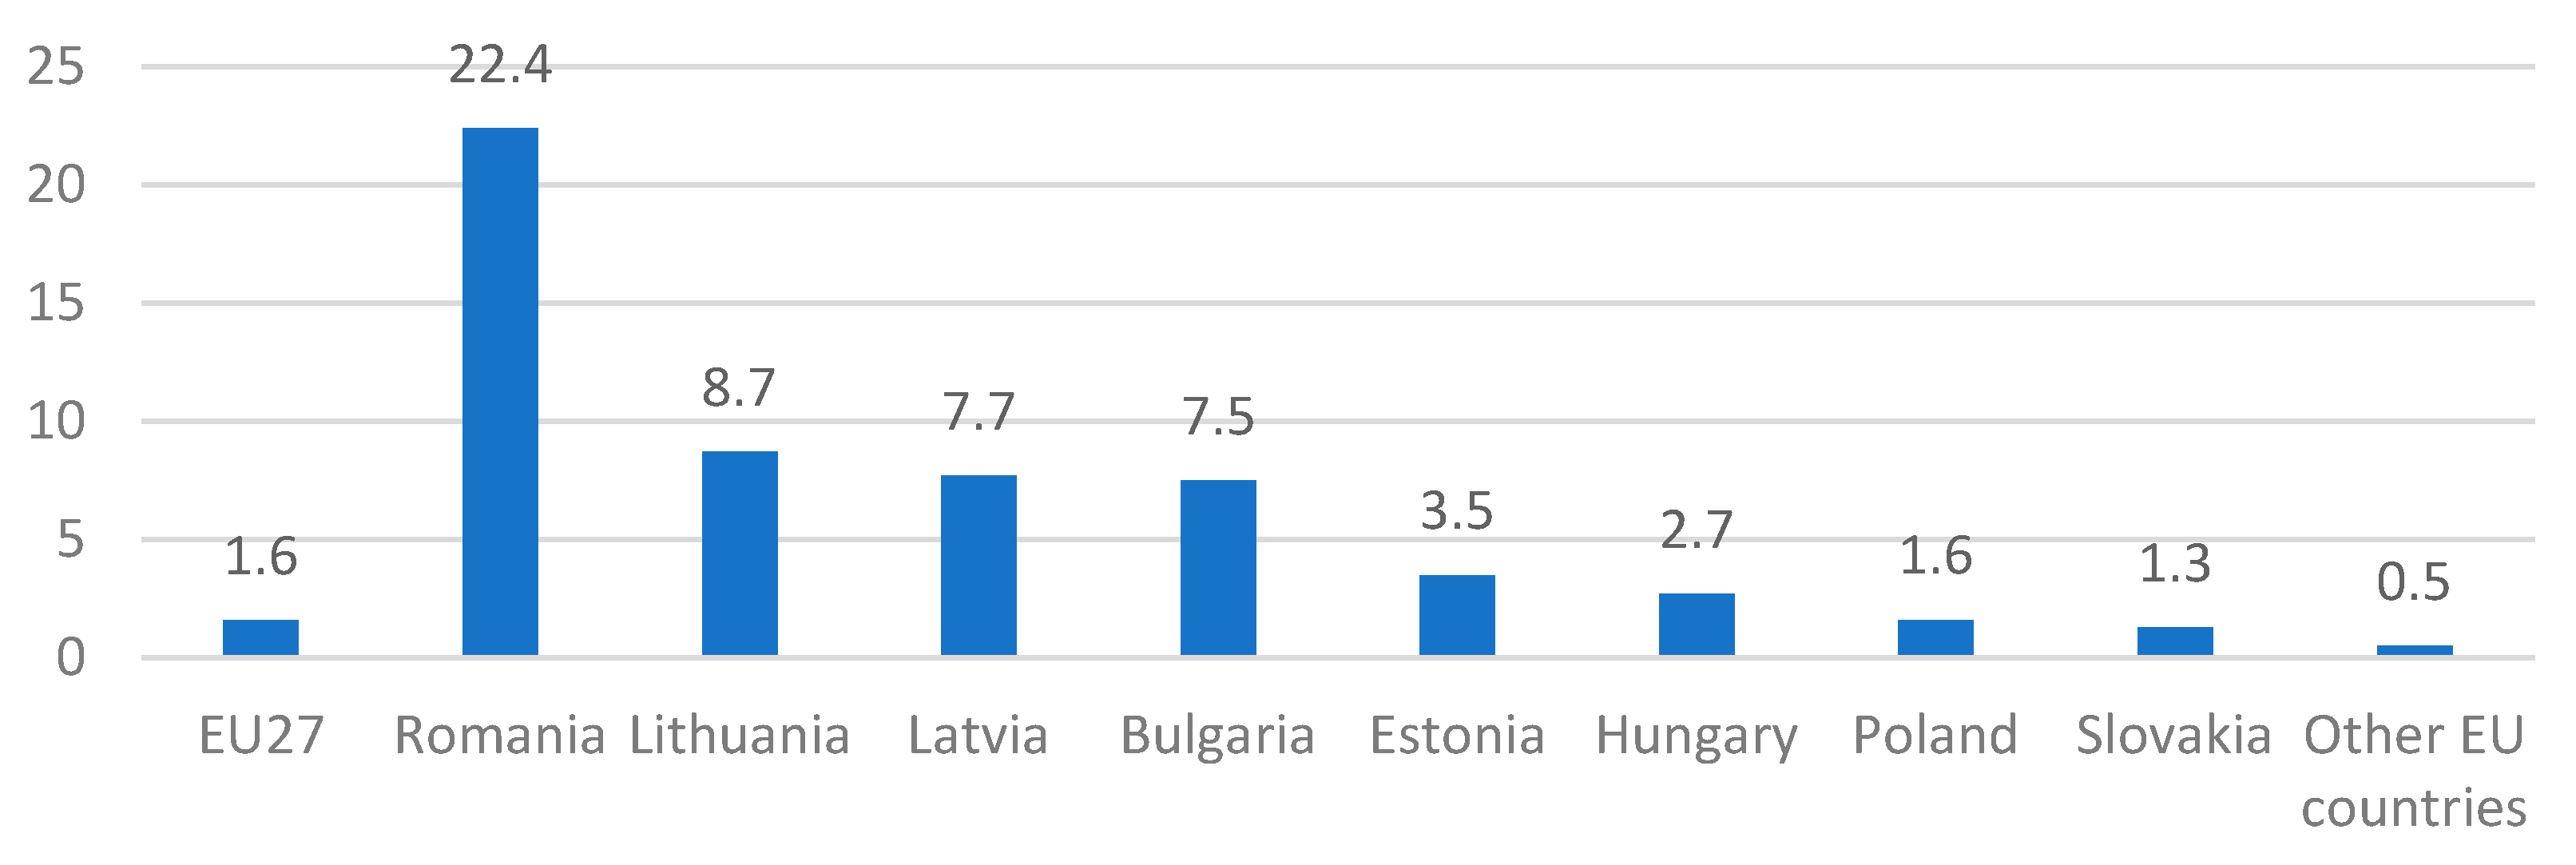
The problem of the quality of dwellings in Eastern Europe comes into even sharper focus when one considers the data on sanitary facilities (
Figure 5), where the countries of Eastern Europe record alarming data: 22.4% of the houses in Romania do not have adequate sanitary facilities; in Lithuania the figure is 8.7%. Overall, the countries of the Soviet bloc all record data above the European average, with the exception of Slovakia, whereas in the rest of Europe these percentages are negligible. The problem of adequate heating of homes is more heterogeneous (
Figure 6) and is widespread both in Eastern Europe and in Mediterranean Europe, with a higher incidence among the lower income groups: 30.1% of the inhabitants of Bulgaria do not benefit from an adequately heated environment. Among lower income groups, the rate rises to 51.1%; this is no better in Lithuania, where 26.7% of the inhabitants live in such a condition. Cyprus, Portugal, Greece, Italy and Spain are 3rd, 4th, 5th, 6th and 11th in this ranking, respectively, which can probably be explained by the fact that winter temperatures are less of an issue in these countries.
Before proceeding with the case study of Naples, it is worth analyzing the European urban context in which the city is situated. In particular, it is useful to explore the issue of urban segregation and social housing policies analyzed in the literature in relation to specific case studies in the European scenario.
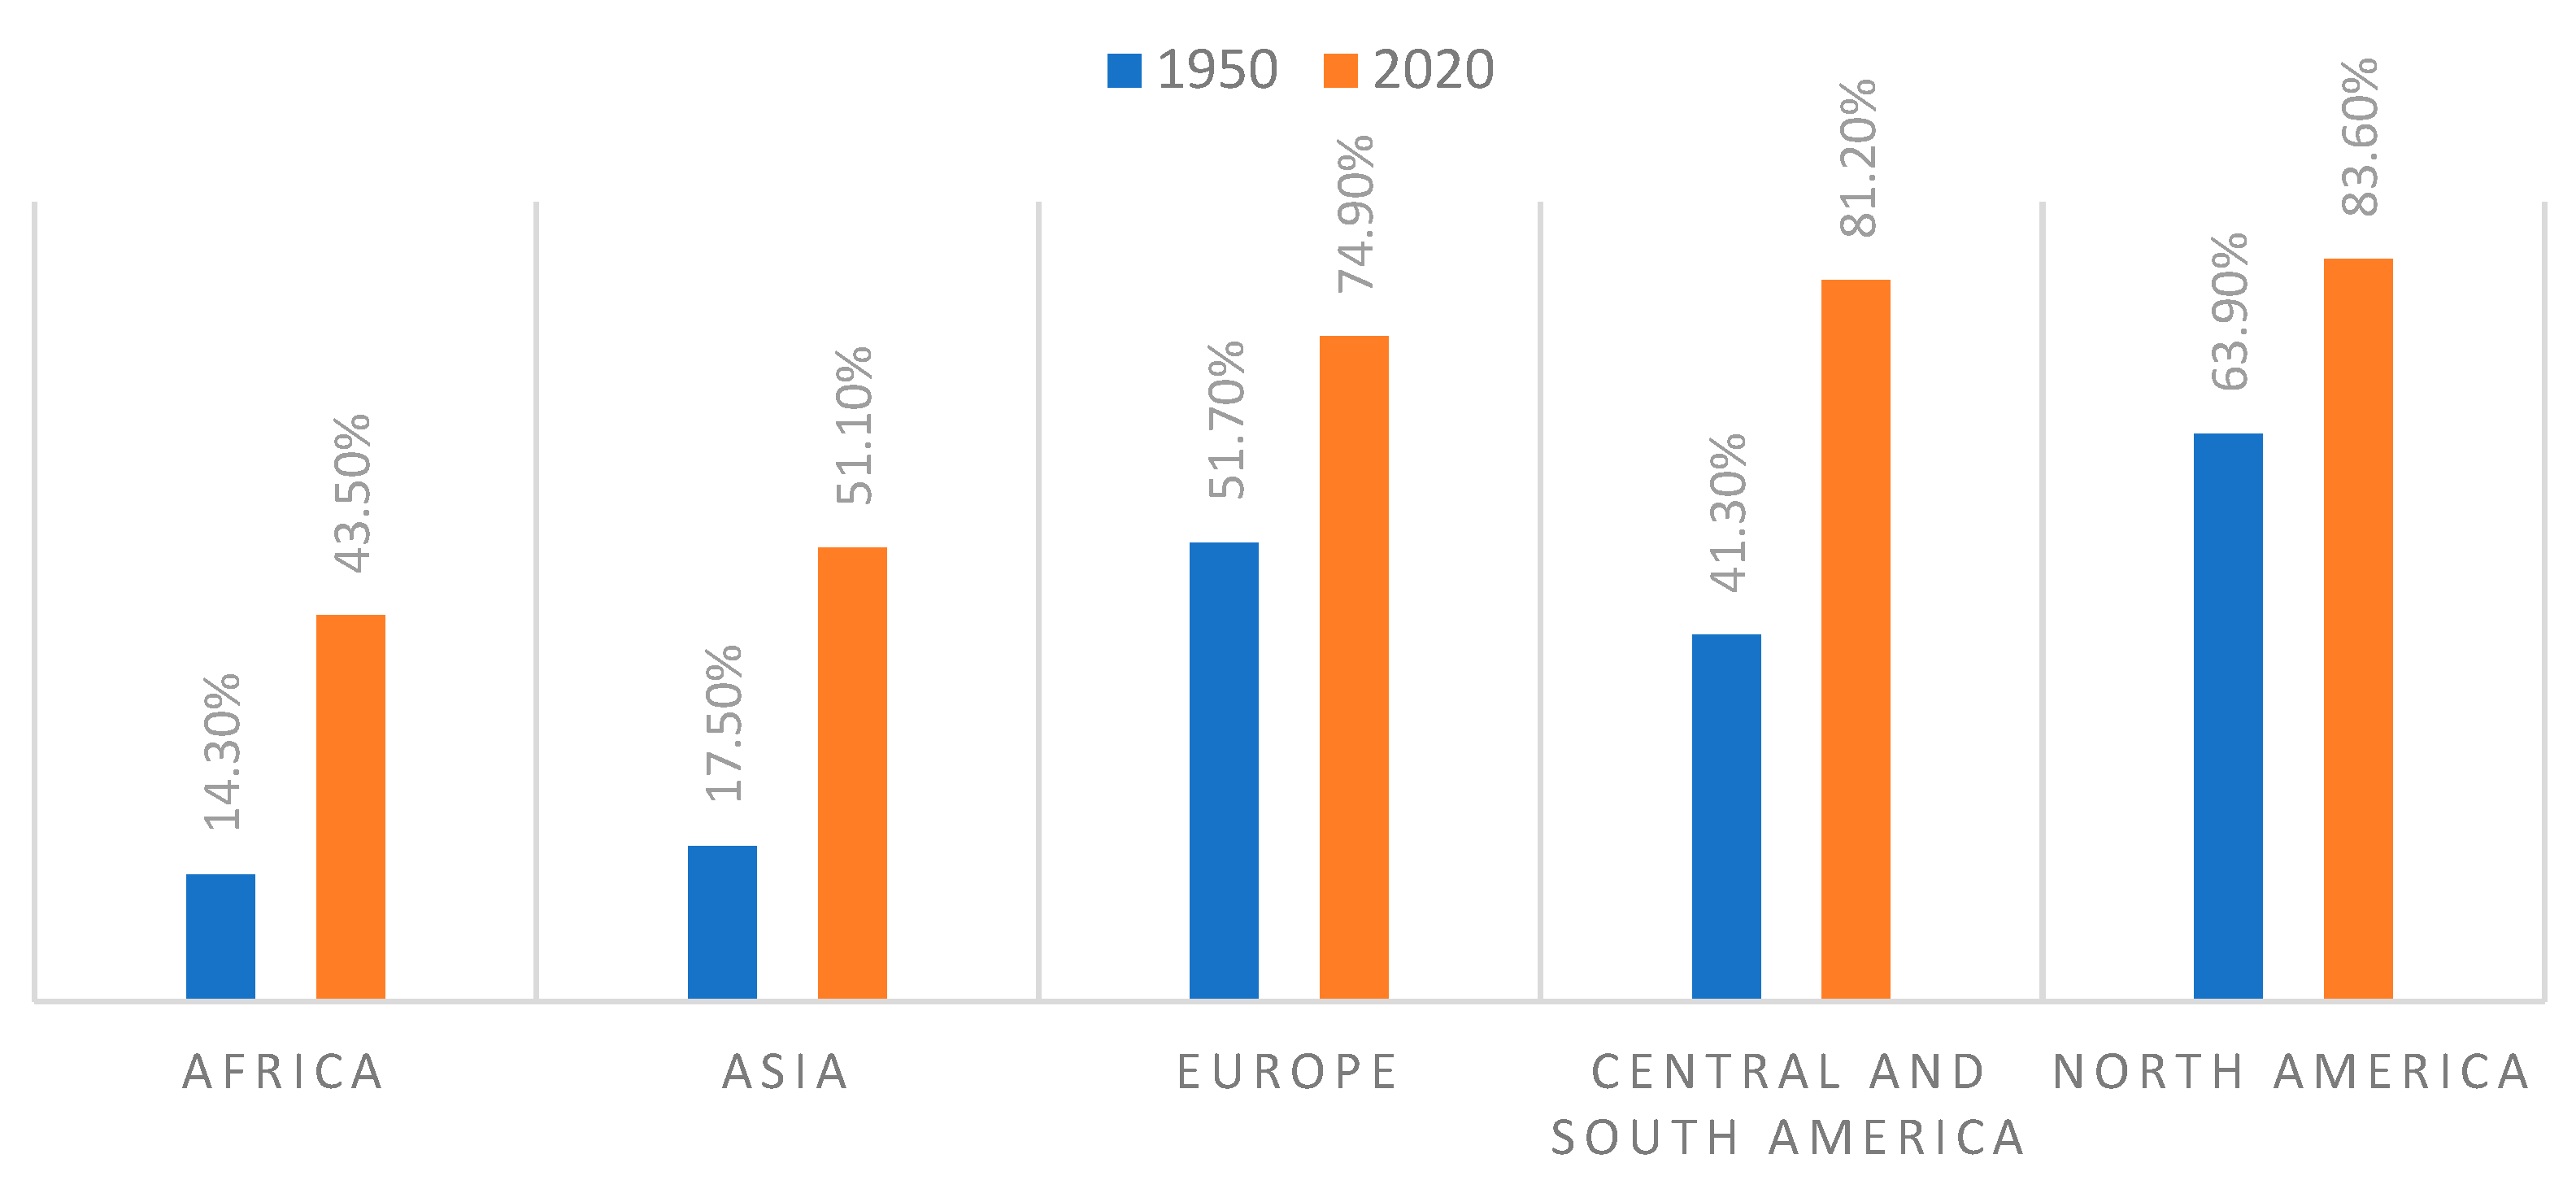
Europe is characterized by a high degree of urbanization (
Figure 7), with 74.9% of the population living in urban areas by 2020, according to data from the U.N. Population Division, reported in a World Economic Forum article [
34].
Population growth causes an increase in demand for housing [
35] in a context where, as we have seen, rental prices are higher than in rural areas (see
Figure 2), and where different levels of urban segregation exist between individual countries and cities. Musterd et al. [
7] present, in the context of a case study on residential segregation, an in-depth study on Tallinn and Riga, which both experienced a rapid transition from socialism to capitalism, and have a comparable context represented by the presence of a Russian-speaking minority in their territory. Over time, the two cities, which had a low level of socio-economic segregation but a high level of ethnic segregation at the end of the 1990s, took different trajectories at the end of the following decade: while Riga became an equal city, Tallinn became one of the most segregated cities in Europe, as the Russian-speaking minority and lower classes tended to prefer Soviet-era tenements abandoned by the emerging middle classes, who preferred the suburban periphery.
Another element influencing the dynamics of urban segregation and housing insecurity is the lack of social housing.
Figure 8 shows that there are disparities in this area, as well between Northern European countries and Mediterranean and Eastern countries. In The Netherlands, there are 12.5 social housing units per 100 inhabitants; in Spain, Slovakia, Bulgaria, Portugal, Estonia and Croatia this figure is less than one. In Romania, for example, which has the lowest rate of social housing per 100 inhabitants, the percentage of public expenditure allocated to social housing fell from 8.7% in 1989 to 0.8% in 2000 [
36]. Nevertheless, in Amsterdam, where 45% of total housing is social housing there are problems related to access to social housing and its management [
37]. Elsewhere, as in Copenhagen, the promotion of gentrification for the sake of economic development and the attraction of investment is a precise political choice, where the presence of the most disadvantaged sections of the population is seen as a threat to the city’s competitiveness. This is what happened in the Vesterbro and Sydhavn areas, whose urban development projects caused an increase in prices, and generated a displacement of the poorer sections of the population that once inhabited these areas [
38]. This was also the case in East Berlin following reunification [
39].
As stated before, those issues were exacerbated by the outbreak of the global crisis in 2008, particularly in the countries most affected by the debt crisis: in Athens the crisis aggravated a pre-existing condition of inequality that had been growing since the 1980s, which was responded to with policies of financial facilitation for the purchase of real estate, rather than with social policies. The bursting of the real estate bubble, and the subsequent banking crisis, affected both the weakest sections of the population and the homeowners who had a mortgage in progress. Even though, initially, the consequences in the Greek capital were mitigated by the preservation of two blocks of social housing in the center and the suburbs, real estate speculation from abroad for tourism purposes led to an increase in prices near the center, in both rents and property, limiting access to the most disadvantaged and causing an unprecedented housing crisis [
40]. A similar dynamic to that of Athens also took place in Spain, especially in Barcelona where, as in the rest of Spain, following the crisis and the consequent difficulty in accessing mortgages, there was a cultural change that led Spaniards to prefer renting to buying a house. In 10 years, the percentage of people renting rose from 7% to 22.7%. As a result, the concomitant increase in the demand for rentals by inhabitants and the purchase of properties for tourism purposes has made Barcelona one of the European cities with the least housing availability, and has led to an explosion in prices. In Barcelona, flats rented for less than 600 euros per month make up less than 1% of the available properties, and those for less than 800 euros, 5% [
41]. Spatial segregation can also be the result of incorrect spatial planning and location of areas intended for social housing, as happened, for example, in Naples, Italy, in the neighborhoods’ of Ponticelli and Scampia, which are the areas of the city with a higher index of social exclusion [
42].
The issue discussed below of the consequences of housing insecurity—caused by the scarcity of cheap housing and social housing amid the general increase in prices—has resulted in the emergence and spread of protest movements for the right to housing all over the world, which, more generally, fit into the framework of protest movements against neoliberal policies [
43].
2. Methodological Note
In the first part of the article, we defined the dimension of the problem at a European level. To this end, Eurostat data relating to the housing situation in the various European countries and, subsequently, in European cities were reported. Next, for the analysis of the case study of the city of Naples, a description of the structure of the city has been presented, specifying the number of Territorial Districts and neighborhoods it consists of. Further on, through the cartographic support, some fundamental dimensions are provided for a better understanding of the phenomena of urban segregation and housing insecurity. These dimensions refer to population density and the distribution of the population within the different neighborhoods, as well as the distribution of income and average real estate values. In order to better understand the housing situation in the districts of the city of Naples, a synthetic index was created, called the “Index of Housing Deprivation in the Neighborhoods of the City of Naples”. The choice to use a synthetic index stems from the assumption that it is reductive to analyze the phenomena of urban segregation and housing insecurity by relying on a single indicator. A variety of methodological purposes to measure social vulnerability and the quality of the life in urban contexts are indicated by the literature: Velazquez and Celamin (2010) constructed and applied an index that contemplates socioeconomic and environmental variables at an urban scale for the regions of Argentina [
44]. Zhang and Pryce (2020) developed a generalized formula for the RCI (Relative Centralization Index), in order to measure the implications of the decentralization of poverty for access to amenities and employment in Wales and England [
45]. Faka et al. (2021) constructed an index to assess the quality of life in urban spaces in the Athens Metropolitan Area, taking into account factors such as social-economic, natural and cultural environments, infrastructures, services, and quality of housing [
46]. However, on the basis of the proximity of the two urban contexts and the methodological approach, the work Davino et al. (2021) has been of particular interest for this research. This work conducted a quantitative analysis to measure social vulnerability in an urban space: the Municipality of Rome [
47]. The Davino et al. analysis, in a similar way to the present work, presented the use of multivariate methods and models to provide an index for every dimension of vulnerability, namely: housing quality, social context, education, employment, urban mobility, social relations, and economic conditions. The database used for the analysis was the census of the Italian housing and the population of the Italian National Statistical Institute (ISTAT) [
48].
Therefore, considering the methodological approaches analyzed in the literature, this research had the purpose of constructing an index highlighting the housing dimensions, together with the socioeconomic and cultural context.
The methodology used in order to elaborate the index of housing deprivation in the districts of Naples included, first of all, the selection of the variables—that is, the measures that make up the elementary indicators according to an approach defined as “training”. According to this approach, the indicators are seen as the “cause” of the phenomenon to be measured, so a change in the latent variable does not always imply a change in all the indicators observed (the indicators are not interchangeable and the correlations between them are not explained by the model). The indicators were selected on the basis of their relevance, validity, timeliness and availability using the Delphi method (the Delphi method is a technique used to obtain answers to a problem from a panel of independent experts over two or three rounds. After each round, an administrator provides an anonymous summary of the experts’ answers and their reasons. When the answers of the experts change slightly between rounds, the process is stopped, and finally a mathematical average is performed between the answers in the final round).
The elementary indicators chosen were: worst housing availability; worst housing condition; worst economic situation; worst social situation. The set of indicators, therefore, will measure the degree of housing insecurity and that of the economic and social situation in each neighborhood.
The first indicator, “worst housing availability”, measured the availability and accessibility of the existing housing, by analyzing both the average real estate value and the incidence of rented and owned housing on the total available housing. The variables making up this indicator were: the percentage of occupied properties in ownership; the percentage of rented accommodation; an estimate of the average real estate value. Using the Delphi method, weights were attributed for each variable as follows: percentage of occupied dwellings in properties, weight 4; percentage of rented accommodation, weight 4; an estimate of the average real estate value, weight 6.
The second indicator, “worst housing condition”, measured the population density in the neighborhood and housing crowding (housing area/number of inhabitants present). It also measured housing exclusion in the various neighborhoods. The variables considered were: population density; housing crowding (housing area/number of inhabitants present); housing exclusion (rate of improper housing, i.e., those real estate units that have characteristics that are incompatible with the destination for housing). Using the Delphi method, weights were attributed for each variable as follows: population density, weight 1; housing crowding, weight 6; housing exclusion, weight 8.
The third indicator, “worst economic situation”, showed the picture of the economic situation of the neighborhood. This was composed of three variables: unemployment rate; employment rate; and incidence of families with potential economic hardship (the variable “incidence of families with potential economic hardship” is calculated by the percentage ratio between the number of families with children with the reference person aged up to 64 years, in which no member is employed or retired from work and the total number of families.Weights were attributed using the Delphi method; in this case the same weight 1 was attributed to each variable considered).
The fourth indicator, “worst social situation”, took into consideration the education level of population by considering the percentage of adults with a university degree and those who, conversely, had not completed the lower secondary school cycle. Furthermore, it took into account the number of resident foreigners. The variables considered were: adults having a university degree; adults who had not completed the lower secondary school cycle; incidence of foreign population. Using the Delphi method, weights were assigned for each variable as follows: adults having a degree, weight 1; adults who not having completed the middle school cycle, weight 4; incidence of foreign population, weight 6.
Since the index must offer a measure of housing deprivation and, therefore, identify which neighborhoods achieved the worst performance in the different dimensions selected (a higher score meant worse performance), not all the selected elementary indicators had a positive correlation with the index. Therefore, during the normalization of the indicators, the polarity was reversed if it was of the opposite sign to the index (the polarity of an elementary indicator is the sign of the relationship between the indicator and the phenomenon to be measured-e.g., in the construction of a synthetic index of development, “life expectancy” has a positive polarity, while “infant mortality” has negative polarity-) To this end, we proceeded with the min-max method, applying the following formulas:
This procedure was carried out for all the variables considered within an indicator. The weighted average (on the weights attributed to the variables) of the results thus obtained in each variable was the score of the indicator (finally the results were multiplied by 10 to transform from decimal to integer).
The data for each variable were those present in the last census of the Italian Statistical Institute (ISTAT) of 2011 [
48].
Subsequently, a weight was attributed to each elementary indicator (worst housing condition, weight 5; worst housing condition, weight 8; worst economic situation, weight 6; worst social situation weight 4). For the aggregation of the normalized indicators, it was decided to use the so-called compensatory approach (Compensatory approach: if the elementary indicators are considered substitutable, elementary indicators are said to be ‘replaceable’ if a deficit in one indicator can be compensated for by a surplus in another-e.g., a low value in “Percentage of people who have participated in spiritual or religious activities” can be compensated for by a high value in “Percentage of people who attended meetings of recreational or cultural associations” and vice versa-. In this case, linear functions are adopted, such as the arithmetic mean [
49]. Therefore, the weighted average of the results obtained in each indicator and the relative weights was the score obtained by each neighborhood (the results have been rounded up or down). In this case, the weights were attributed using the Delphi Method (the results were rounded up or down).
Lastly, the synthetic index was validated, verifying its consistency with the general theoretical framework, through an analysis of the robustness of its discriminating capacity.
Once the whole picture of the phenomena of housing insecurity and urban segregation in the city of Naples was provided, we described the social response that took place in an attempt to tackle the problem. So, we were able to argue that this response was not as effective as that which took place in another reality, that was the city of Barcelona. Once the importance of the social movements for the right to housing was identified, we examined the modalities of action of the social movements for the right to housing in Barcelona. In the Conclusions section we will offer a comparison between the action of the movement for the right to housing in Naples and the one in the Spanish city, in order to understand the weaknesses of Naples’ social responses.
3. Study of the City of Naples: Results and Discussion of the Index of Housing Deprivation in the City’s Neighborhoods and Examination of the Response of Social Movements for the Right to Housing
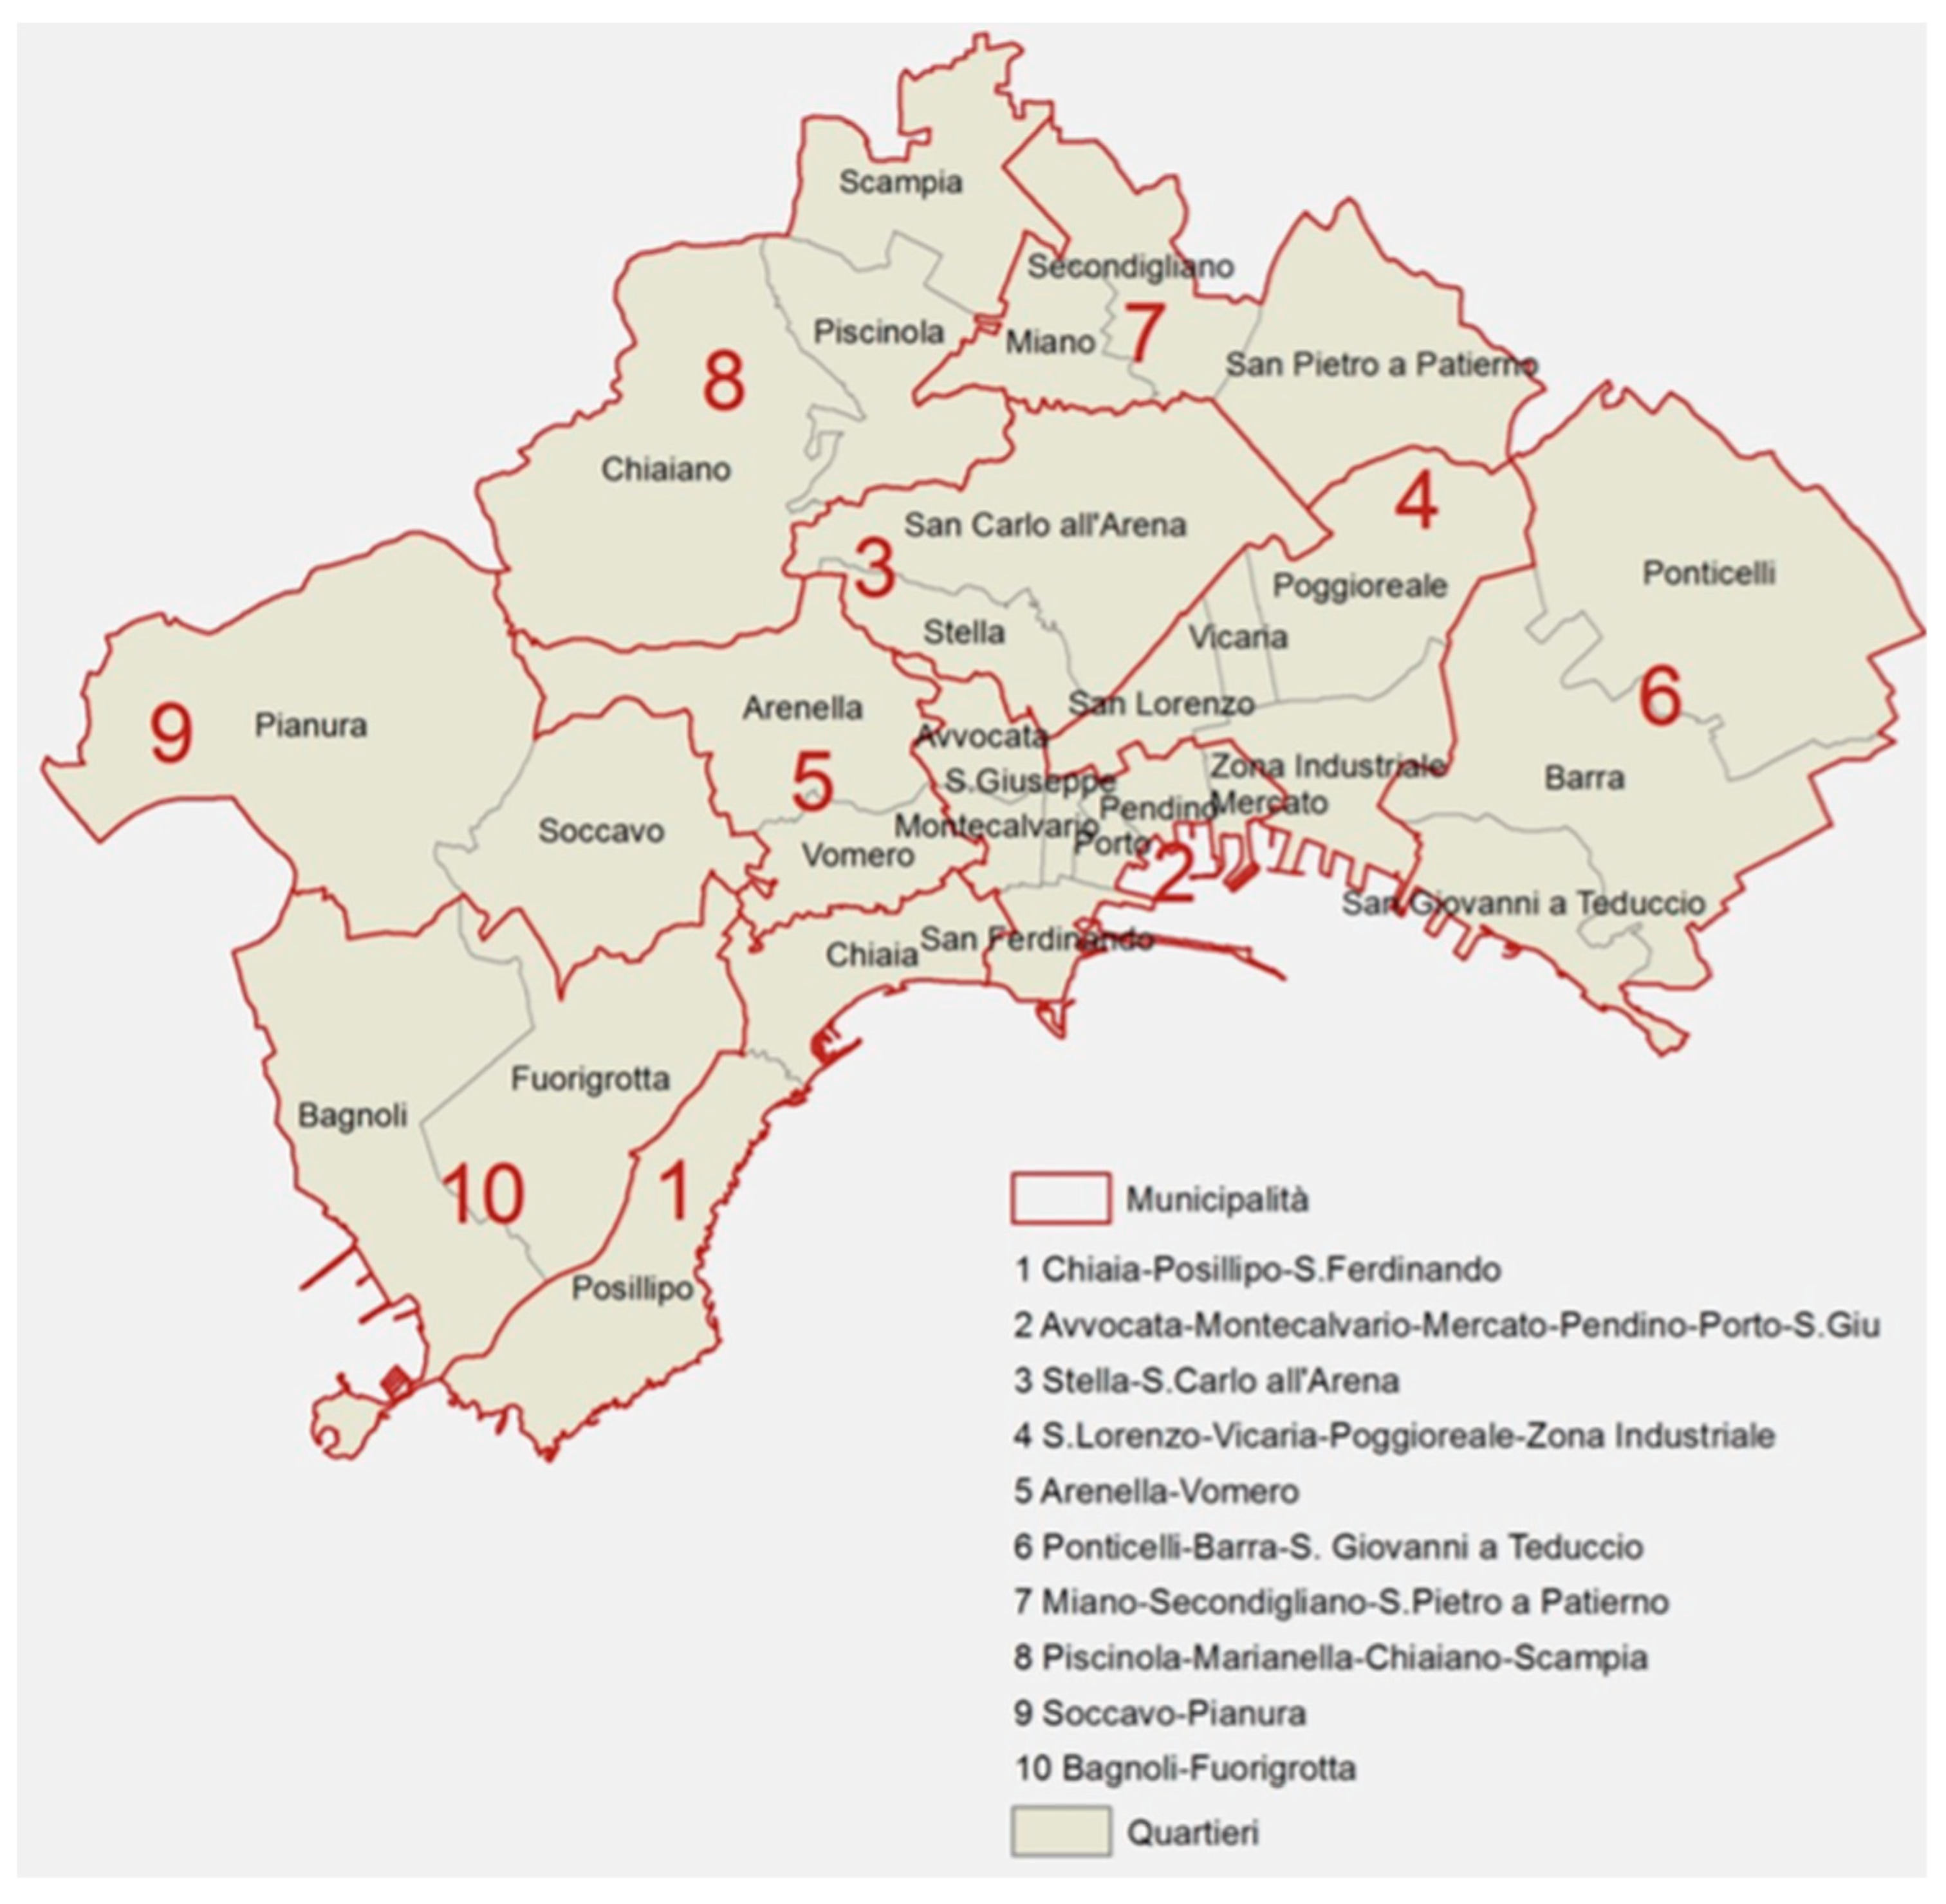
The city of Naples, located in southern Italy, is divided into ten territorial districts (
Figure 9) which include thirty neighborhoods. The first territorial district includes the Chiaia and San Ferdinando neighborhoods located in the south-west of the coastal strip. The second includes the neighborhoods of Avvocata, Montecalvario, Porto, San Giuseppe, Pendino and Mercato located in the center of the coastal strip; the third territorial district includes the neighborhoods of Stella and San Carlo all’Arena, located in the city center. The fourth includes the neighborhoods of Vicaria, San Lorenzo and Poggioreale, located in the central-eastern part of the city; the fifth territorial district includes the neighborhoods of Vomero and Arenella located in the western part. The eastern part of the city is made up of the neighborhoods included in the sixth territorial district, namely Ponticelli, Barra and San Giovanni a Teduccio. The seventh territorial district, with the neighborhoods of Miano, Secondigliano and San Pietro a Patierno, belongs to the northern area of Naples; the eighth includes the neighborhoods of Chiaiano, Piscinola, Marianella and Scampia, and the ninth contains the Pianura and Soccavo districts. Finally, in the western part of Naples, the tenth territorial district includes the neighborhoods of Bagnoli and Fuorigrotta.
Regarding the population density (
Figure 10), although the Municipality as a whole is densely populated—according to the ISTAT data of the last census [
48], it stands at approximately 8566 inhabitants per sq. km (with a total population of 1,004,500 inhabitants for 117.27 sq. km of extension, ISTAT 2011)—differences can be found within the ten territorial districts, as well as in the neighborhoods.
In fact, the southwestern area (with the first, second, fifth and tenth territorial districts) is more densely populated than the rest of the city. This can be said to be a consequence of the change in the distribution of the population which has gradually changed over the decades. In particular, starting from World War II and over the following thirty years, the spaces closest to the center have become saturated; thus, transforming the balance between the populous historic city, the modern neighborhoods of urban expansion, and the banlieu annexed in the 1920s.
The redistribution of the population towards the urban periphery concerns, even if not homogeneous in time and extent, three directions. The first was directed towards the northern suburbs, the second towards the east, and the third towards the bourgeois districts to the west. To the north, the expansion process represented the result of an intensive urbanization of a mostly speculative nature, but also responded to the desire to incorporate ancient and recent structures into the unifying project of the new public city, destined to respond to the housing needs of the more disadvantaged social groups (an example, in this sense, is the settlement of the district 167 of Secondigliano. The district 167 of Secondigliano in Naples is commonly known by the simple toponym of 167. The name comes from the Law of 18 April 1962, n. 167: Provisions to encourage the acquisition of building areas for economic and social housing -GU n.111 of 04.30.1962-. Together with the public housing in the Ponticelli neighborhood, it is a residential concentration of the largest building expansion dated 1972. The whole area affected by Law 167 develops along the north/north-east lines, with the aim of moving the center of gravity of the metropolitan city towards the heart of the province, already radiated by the so-called system of urban centers in the suburbs since 1977. The 167 area extends on about 200 hectares of land settled by huge buildings, on 21 building sectors, which, out of a total of 200, occupy 132, for an overall plan envisaged for 63 thousand people. The 167 of Naples is, above all, an area plan, free, without a guiding volumetric plan, without major constraints, design or shape, structured around a central ring that distributes services and public parks. It is a piece of land substantially affected by mega structures, some of which 26 meters high, respective of 14 floors). The neighborhoods of Secondigliano, Miano, Piscinola, Scampia, San Pietro a Patierno, which now constitute a single and uniform urban fabric, have historically established a privileged relationship, and, at the same time, one of marked dependence, with the center of Naples. Constituting the initial part of the Campania territorial system, they are today in a central position with respect to the recent external urbanization, virtually acting as a trait d’union betweenNaples and the neighboring municipalities.
A second direction of peripheral expansion is the eastern one, in an area that faces the sea to the south and borders the Vesuvian area to the east, while to the west it finds its limit in Piazza Garibaldi, the central station square in the Pendino neighborhood, belonging to the Territorial District 2. The neighborhoods of Ponticelli, Barra, San Giovanni a Teduccio and Poggioreale are part of this area. The Poggioreale neighborhood marks the transition from the historic city to the eastern outskirts, and is particularly interesting for its heterogeneous characteristics. With the exception of some degraded areas on its edges, it hosts a small and medium-sized bourgeoisie and is very well connected, due to its proximity to the Piazza Garibaldi station.
The Ponticelli neighborhood is today home to the large and disputed construction site of the “Ospedale del Mare”—hospital of the sea—a newly conceived structure that integrates health care with hospitality and commercial activities, and which should allow the relocation from the urban center of two old hospitals no longer compatible with the environmental conditions of the city. Numerous controversies have been raised due to its location, straddling the “red zone”, at high risk in the event of the eruption of Vesuvius. The neighborhoods of Ponticelli Barra and San Giovanni a Teduccio were autonomous centers until the 1920s, when they were annexed to the city. Ponticelli originally had an essentially agricultural vocation, but its identity was distorted by reconstruction after World War II, when a large number of public housing was built. Barra and San Giovanni a Teduccio are former workers’ neighborhoods, and seats of important industries. Here, since the 1980s, the demographic decline due to the wave of deindustrialization is very high. San Giovanni a Teduccio, in particular, lost 34% of the population from 1971 to 2011 [
48]. Finally, a third direction of expansion is that to the west of Naples, towards the bourgeois neighborhoods of Fuorigrotta, Vomero and Arenella. It is an area rich in metropolitan-level functions, and enjoys good environmental, settlement and economic-social quality. It is proposed as a place dedicated to tourism, leisure, and functions of excellence. These neighborhoods, as Amato [
51] points out, despite being outside the historic city walls, cannot be defined as peripheral in the strict sense of the term, since, with the exception of some pockets, they do not have the characteristics of marginalization, degradation, and discomfort. According to the author, we can rather speak of a widespread spatial centrality, of a “structured periphery”—well connected and with good socio-economic conditions.
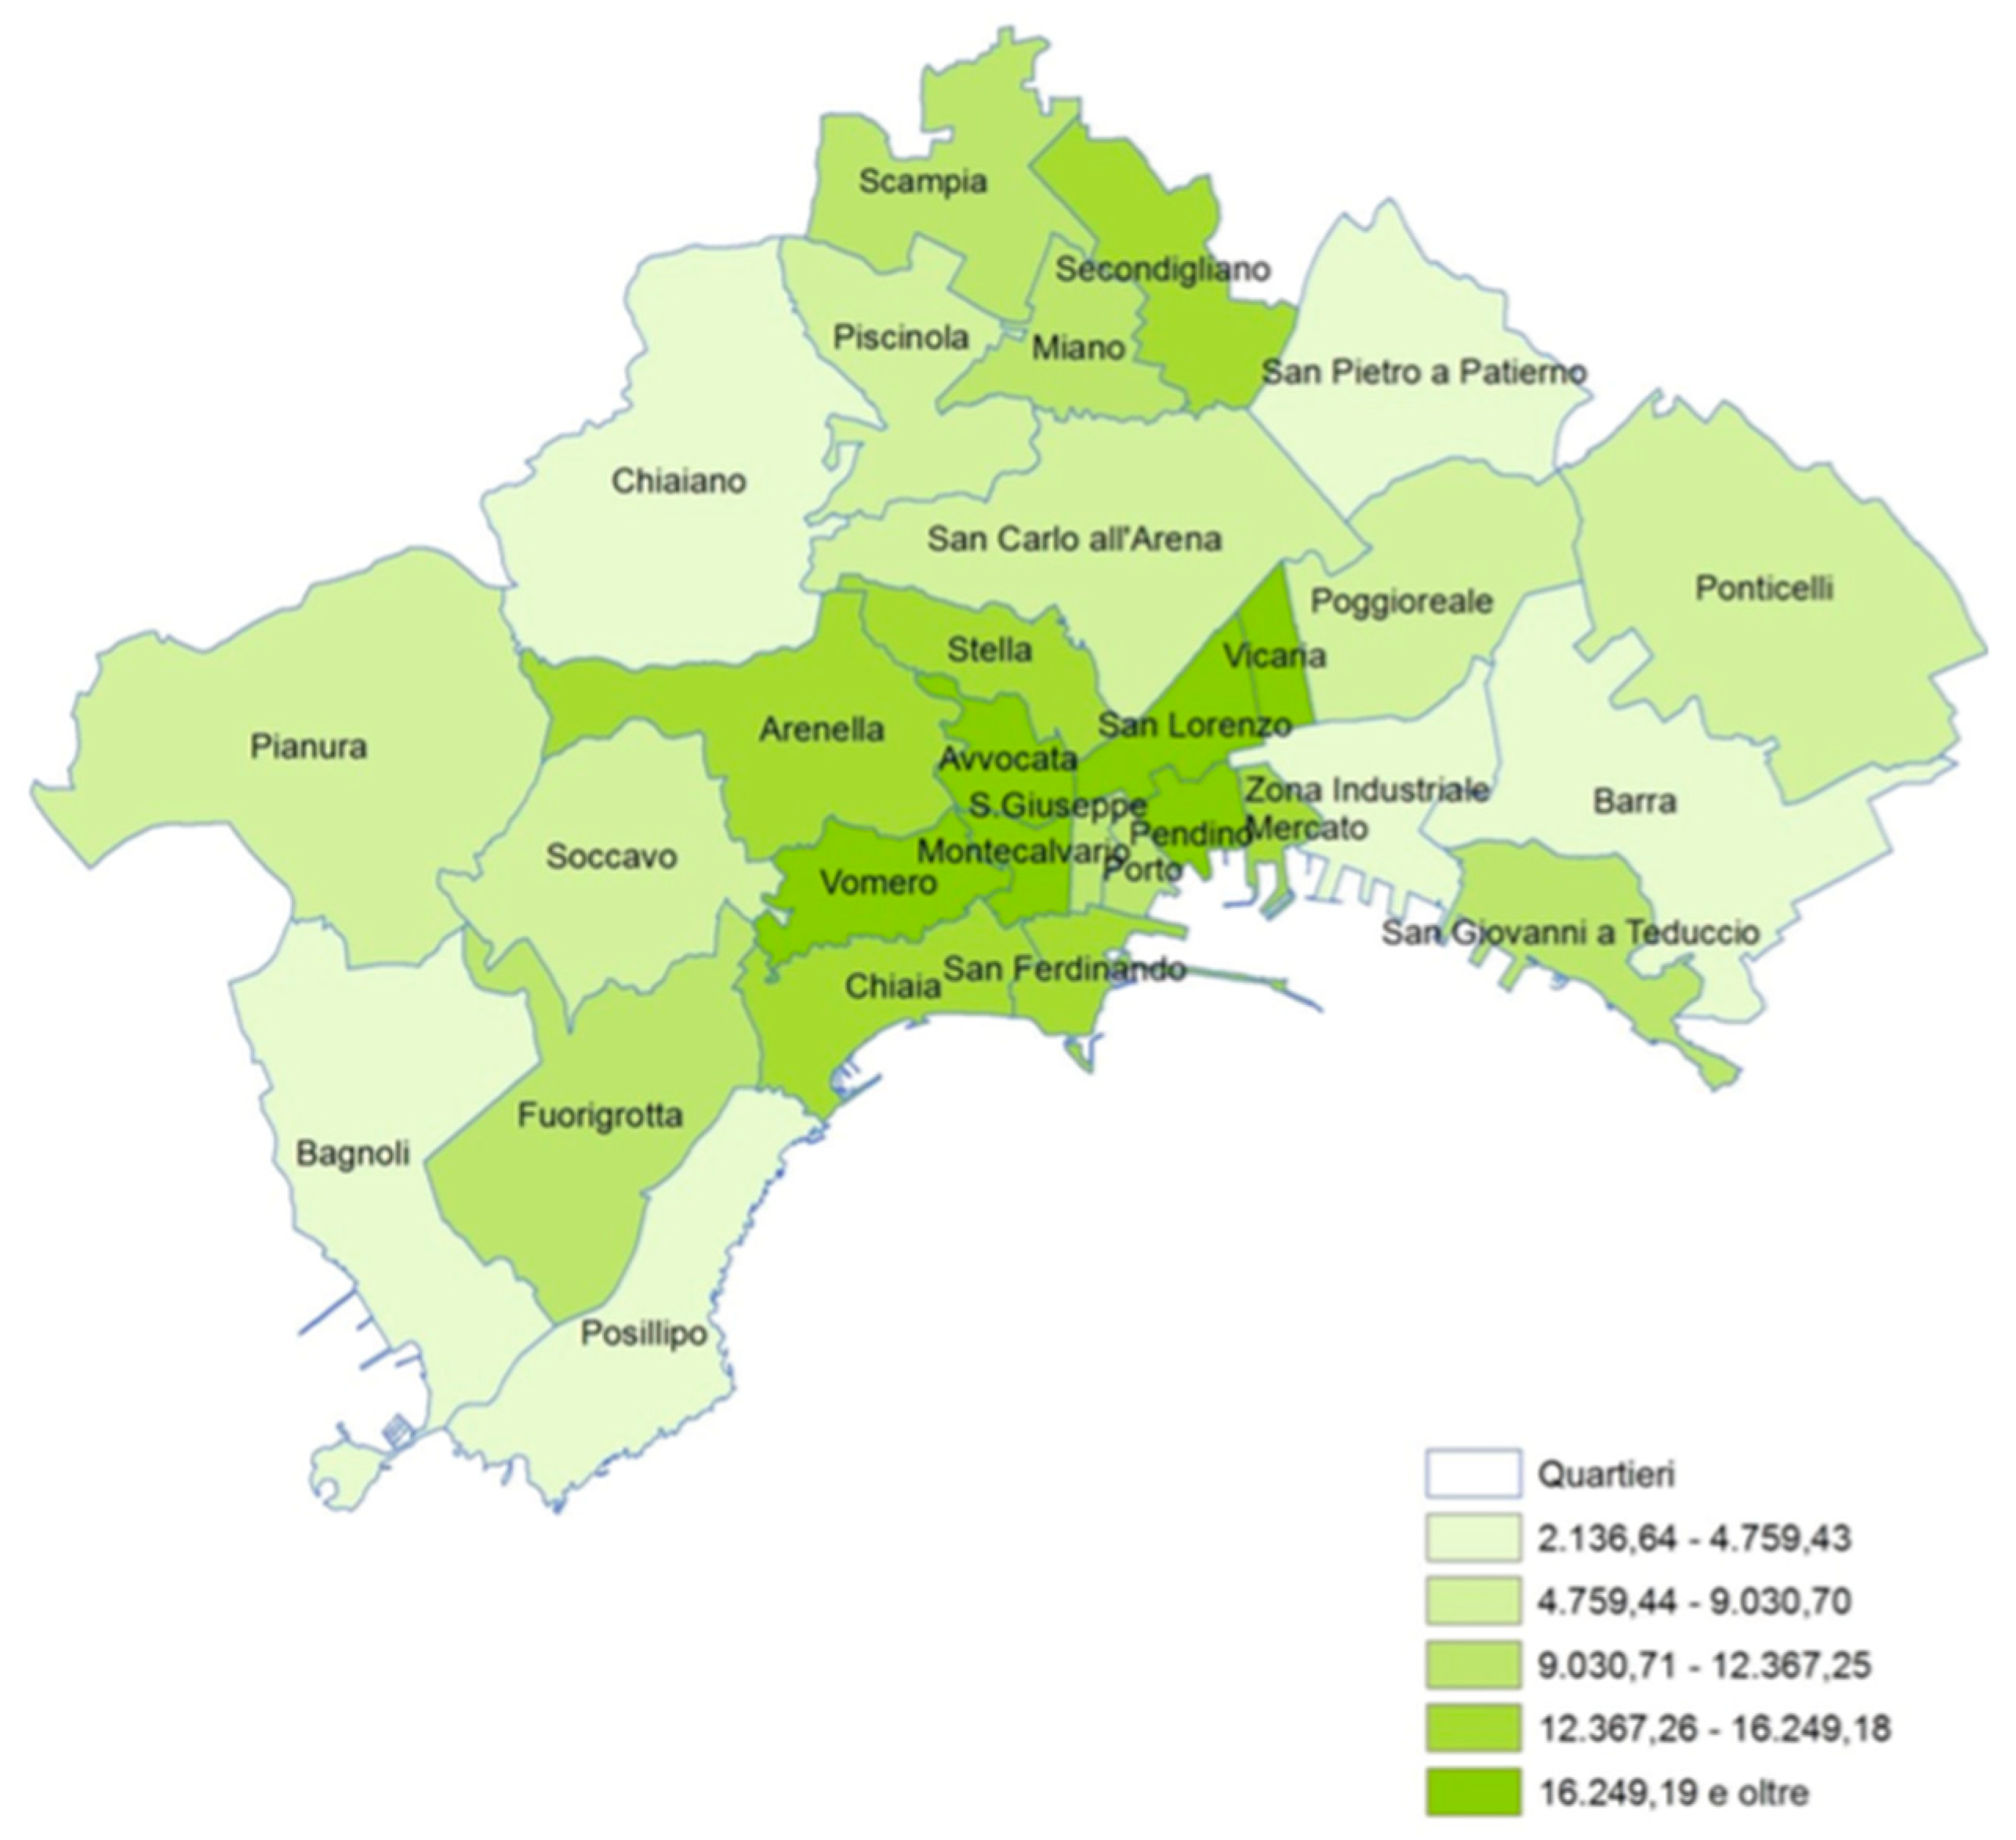
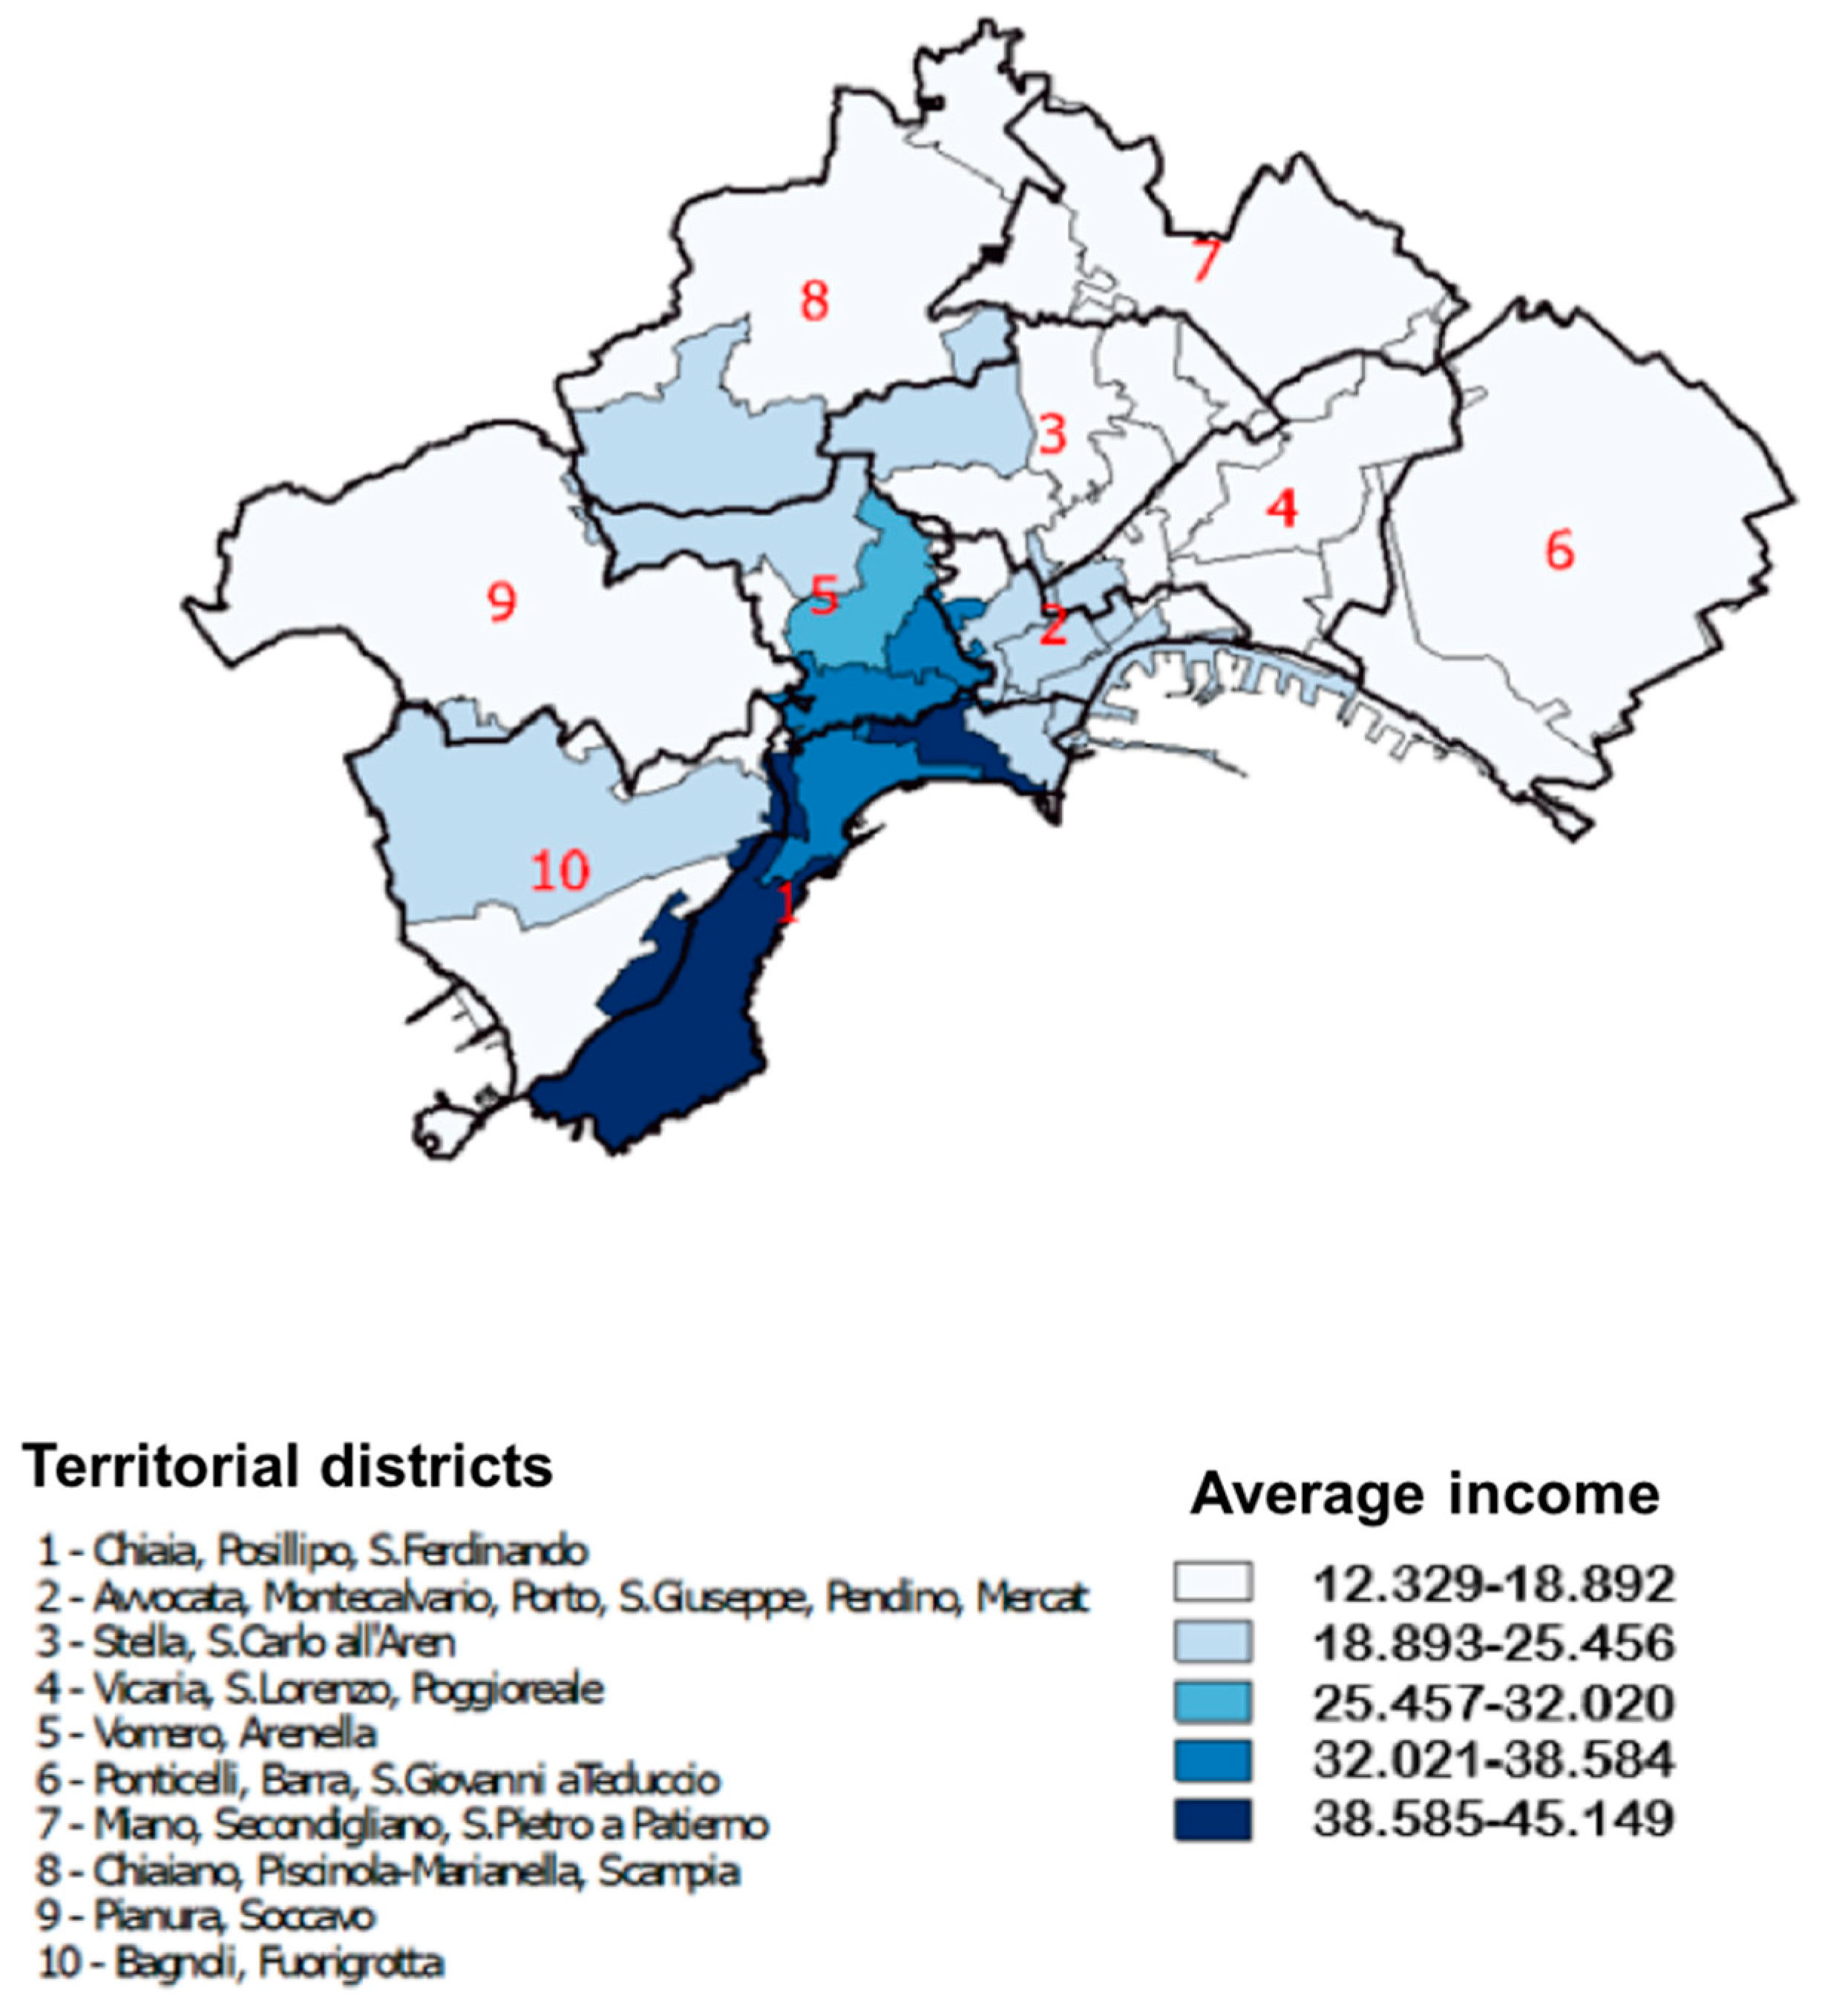
That said, the connotation of the city is clear: diversity. This diversity creates situations of peripherality and marginality, mixed with others that tell a completely opposite story. Diversity can be found not only in the dynamics of the population, but also by analyzing other variables, in particular, those relating to income and the cadastral value of properties (
Figure 11 and
Figure 12).
As can be seen from
Figure 11, the distribution of average income seems to be in line with the distribution of the population, and shows a particular concentration of higher incomes in the area close to the first and fifth municipalities. The same was found in the cadastral values (
Figure 12).
From the analysis of the data, therefore, it seems that the most peripheral and marginalized areas were those to the north and east of the city, characterized by popular urbanization and of lower value than the center, with a population with a lower average income. It is useful to pint out that in Naples, in the rich Chiaia neighborhood, the Irpef (Personal Income Tax) complaints averaged just over 47,300 euros, similarly in the hilly areas of Posillipo they exceeded 45,500 euros. However, if you move a few streets and arrive in the historic center, especially between the “Quartieri Spagnoli”, “Sanità” and “Tribunali”, you will receive very modest 13,400 euros in the industrial area from the central station to San Giovanni a Teduccio. Without underestimating the fact that peripheral neighborhoods, such as Ponticelli and Scampia, do not appear there, almost one in three citizens does not report their income at all, because they do not own assets, and therefore are below the minimum threshold.
Looking closely at the cartograms of income and the estimate of real estate value, in addition to the identification of marginalized areas, there was also a discrepancy between the average income—quite low almost everywhere except for a few enclaves—and the average real estate value, which was accessible only in a few suburbs. This could lead to socio-economic segregation within the city, which pushes middle-class residents to move away from low-income neighborhoods, whereas gentrification means that those who have no other option but to move where housing is cheap are driven out of such areas. The result, however, can prove disastrous for the social stability of the urban region, not to mention the negative impact it can have on residents.
In order to better understand the housing situation in the districts of the city of Naples, an attempt was made to measure urban housing deprivation through a synthetic index, called the “Index of Housing Deprivation in the Neighborhoods of the City of Naples” (
Table 1) (see Methodological Note). The index, taking into account a series of different variables, showed the main areas of residential exclusion where the living conditions (economic and social) were more worrying.
The ranking, drawn up according to the scores of the index of urban housing deprivation, showed, in the first five positions: Scampia (7.2); Mercato (5.6); Zona Industriale (5.3); San Pietro a Patierno (5.2) and Barra (5.1). This means that in these neighborhoods the housing conditions are worse than in other neighborhoods, and therefore there will be a higher housing crowding—housing inhabitants/sq. m—and a greater housing exclusion with a high incidence of improper housing (i.e., real estate units that have characteristics typologically incompatible with the destination of residence). In these same neighborhoods, the economic and social conditions were also worse than in the other areas examined, with a higher unemployment rate, a higher incidence of families with potential economic hardship, and a high number of adults who had not completed middle school.
Conversely, the neighborhoods with the lowest scores were those in which housing, economic and social conditions are the best.
However, if we compare the scores obtained in the various variables that make up the index (worst housing availability; worst housing condition; worst economic situation; worst social situation) between the first and last neighborhoods in the ranking, it is possible to find some discrepancies between housing availability and other variables. In fact, it is clear from the following graph (
Figure 13) that the first five neighborhoods in the ranking all obtained very low scores in the variable “worst availability of housing” (which measures the percentages of owned and rented housing out of total housing, as well as the average real estate value). In this variable, for example, Scampia neighborhood scored 0; Mercato, 5; Zona Industriale, 3; San Pietro a Patierno, 1, and Barra, 3. On the other hand, Chiaia neighborhood (last in the index ranking) obtained a score of 6; Vomero, 8; Posillipo, 8; San Giuseppe, 5, and Arenella 10.
The scenario outlined by the analysis and processing of the data available therefore highlights the real existence of socio-economic and housing segregation in the city of Naples. In fact, the neighborhoods with greater housing problems, in terms of living conditions, and economic and social situation, remained the only ones to have an, albeit minimal, availability of housing which, however, remain empty because they are too expensive for those who are homeless, or live in improper housing. Alternatively, because they are located in areas deemed too degraded by those who could afford them.
Such a situation could lead to the escalation of the social struggle and the emergence of a response from below, especially where due attention is not given by the institutions, as can unfortunately be seen in the case of the city subject of this analysis. In Naples, the return to housing issues by the actors of the Neapolitan Urban Movement took place with force after the economic crisis of 2008, with the campaign for the right to live “Magnammece ‘o pesone” MOP (in the expression of Neapolitan dialect, this literally means “Let’s eat the rent”; in a figurative sense, it is an exhortation not to worry about paying rent, since it implies the occupation of housing as a form of protest).
The crisis has helped to create a new audience of individuals in economic difficulty who have leveraged the housing issue, as they find it difficult to bear the costs of rents in the city -think, for example, of temporary workers-. A group of militants from the Wave Movement, together with other social movements, were at the basis of the creation and structuring of the campaign that developed among the occupations of abandoned buildings, mainly publicly owned, with socio-housing purposes. The MOP campaign was created with the aim of occupying disused buildings for social and residential purposes. The socio-residential purpose is much broader than the claim of the right to housing commonly understood: it includes the desire to re-appropriate spaces and their liberation from disuse, abandonment or speculation, in order to return them to the neighborhood and citizens in the form of places for discussion, socializing, culture and sharing. In addition to the right to housing, campaign activists claimed the right to the city, services and citizenship income. In the words of activists and occupiers of the social movement, urban space is today managed by the logic of real estate developers, and satisfies the exclusive need of private consumption, privileging selfishness and segregation rather than community [
53]. Finally, the re-appropriation of urban space as a public space is seen, essentially, as a possibility of expression, creativity and solidarity in a society that often rejects particular categories. For example, young people, especially if unemployed, who are still looking for their own space for expression, sharing, debate and participation, offer a new political arena that can be understood as a social agora. This campaign was born, therefore, with the precise purpose of claiming the right to housing, and brings the housing emergency in Naples back to the center of political discourse. Today, this affects the subjects penalized by the new rules of the labor market, whose conditions have been aggravated by the economic crisis.
According to the data available on the website of the Municipality of Naples, there are still about 17,000 families waiting for public housing, and the lists have been stopped since 1998. Since 1996, less than two thousand families have seen the allocation of housing. The occupations perpetrated by the campaign represent the final stage of a path that has seen activists undertake various actions, for example: mapping of the territory in order to identify abandoned buildings or those in a state of neglect; city assemblies to share what has emerged from the mapping and discuss the decisions of the Municipality, regarding the disposal of the municipal real estate assets; symbolic demonstrations and occupations of various buildings, including an unused building owned by the Second University of Naples, and a former depot of the ANM (local public transport company). Among the most relevant moments of the campaign was the occupation in January 2013 of Villa De Luca in the Stella neighborhood, followed a few months later by that of the former Andrea Belvedere middle school, a structure that was in a state of neglect located in Vomero neighborhood.
Villa de Luca was the first occupation for socio-residential purposes by the Mop Campaign, it is a monumental complex located in Capodimonte, a residential area located on a hill, away from the historic center of the city, in Territorial District 3, in the Stella neighborhood. Villa de Luca had been abandoned to neglect and decay for decades and was part of the complex of historic buildings that the Municipality of Naples intended to sell, despite the rhetoric of the Common Goods.
In August 2013, the monastic order that owned the Andrea Belvedere building requested police intervention, which led to the eviction of the previously occupied building. The eviction was followed by the occupation of the Ex-Annona, a historic building owned by the municipality in the Chiaia district. In 2014, the occupations continued: in January it was the turn of a private building, called by activists C.R.O.S.S, (Casa e Reddito Occupazioni Senza Sosta), located in the Arenella neighbourhood. Between April and May a disused building owned by the ASL (Azienda Sanitaria Locale, the local institution of the National Health Service) in the Avvocata neighborhood was occupied. Finally, in 2016 there was the occupation of a disused building owned by the Church, called ‘Zia Ada’ (Independent Zone self-managed by inhabitants), in Piazza Miraglia in the San Lorenzo neighborhood, in the heart of the historic centre. Therefore, six buildings have been occupied by the activists during the course of the campaign, four of which are public, one private and one already occupied by another collective that joined the campaign later—the historic building ‘Schipa’ in the Avvocata neighborhood. Then, the monumental complex Villa De Luca, the historic building Ex- Annona, the building owned by the Local Health Authority, one owned by the Church (Zia Ada) and one private (C.R.O.S.S.). Structures which, with the exception of Villa De Luca, are, on the one hand, all located in the city’s historic center, but on the other, do not affect the more peripheral neighborhoods, and none of the neighborhoods that are among the top positions in the synthetic index drawn up in this study. The reason behind the decision to have a greater presence in the historic center, and some in the wealthier neighborhoods (such as the occupation of the former middle school in the Vomero neighborhood, which was subsequently evacuated), lies in the activists’ conviction that their occupations are also a form of resistance against the expulsion of the poorer classes from these neighborhoods. Thus, they had a desire to draw attention to the growing socio-economic segregation in the city, as revealed by the analysis of the urban housing hardship index. A further tool through which the occupations carried out was the housing counters, which acted as points of contact between those in difficulty and in need of support because such as the homeless and the activists. They offered legal advice to support families and young people in precarious situations who were being evicted from their homes. They also responded to the need for housing by assembling new lists for occupations and building solidarity networks for those in housing difficulties. With regard to the functioning of the movement’s actions after the occupation, there were two main moments: the occupation management assembly and the coordination assembly between the various occupations. These phases represent moments of collective sharing of an informal practice of living that takes a political form, and is connoted as a response to the need for care and re-appropriation of spaces, where institutions fail. In addition, the occupations serve, for the activists of the campaign, to draw attention to the fact that there are thousands of flats in abandoned buildings in the center of Naples that potentially still make it a habitable area, not necessarily by going through the speculative logic of the real estate market, or by passively waiting for political interventions that have been silent on the housing issue for too long. So, the MOP appears as a real social response to the housing crisis in the city of Naples but, in practice, it has had no effect either in stimulating an institutional response or in becoming an institutionalized movement. This is because, since its inception, its action has stopped at the aforementioned building occupations and the establishment of a few, not very well organized ‘housing counters’ [
19]. It is not clear why the movement did not have the necessary strength to pursue its initiatives and ideals more incisively: a strong internal division within the movement will have been a likely cause. What we see, therefore, is that in Naples there does not seem to be an adequate grassroots force to push for the resolution of the problem. This represents a missed opportunity because, as happened in other cities, for example in Barcelona, social initiatives can be important not only to bring a problem to light, but also to find concrete solutions to solve it.
This observation leads us to reflect on the importance of social movements, especially those for the right to housing, in all cities where this housing problem is prevalent.
4. The Importance of Social Movements for the Right to Housing: The Case of Barcelona
The movement for the right to housing is a phenomenon that recurs cyclically and consistently throughout post-World War II history [
54], and that most often takes the form of waves of building occupations and protests, as seen in the 1970s in Italy, in Milan [
55] and Naples [
56], and in Germany during the same period [
57]. A phenomenon reinvigorated recently by the COVID-19 pandemic that has further aggravated the problem by expanding the concept of housing adequacy, in addition to the constant concept of its availability [
58]. It is evident that the different economic, social and even geographical contexts make it difficult to compare the various phenomena with each other over time (and space) [
59], the vertical element that unites all past and contemporary experiences is represented by the social profiles that animated and animate these movements: the working class, low-income families and migrants [
60]. A direct effect of the emergence of movements is to generate awareness and create a community with a strong identity at a political level [
61,
62,
63,
64]. In Croatia, the Human Shield movement was structured in a real party that expressed a candidate in the presidential elections collecting in 2014 (16.42%) who managed, in 2015, to express an MP [
65]. The struggle for housing thus became a component of a series of broader social demands [
66], always in a sense of opposition to the neoliberal system [
43]. In Europe, some movements are also developing a transnational dimension, such as the European Action Coalition for the Right to Housing and to the City, which brings together groups from over 20 countries [
67].
Among the most emblematic cases, we cannot fail to mention Barcelona. Since the end of the 1970s, in fact, this city has changed considerably through a series of overlapping processes including urban renewal, a massive increase in tourism, and the creation of a new Barcelona which, especially after the Olympics, brought the city to the international map. The previously segregated areas of Barcelona were connected through the opening of new public spaces which were supposed to create greater social cohesion. Through the cooperation between the public administration and the private sector, the preparation of the 1992 Olympics accelerated the process of urban renewal and developed the process of outsourcing of the economy—in the context of deindustrialization—in particular through the massive development of tourism. The growth of the tourism industry overlapped with the promotion of Barcelona as a cultural capital, since urban regeneration, especially in the central neighborhoods, was linked to the development of cultural strategies and infrastructures such as festivals, events, museums and civic centers. The socialist governments that ruled the city between 1979 and 2011 included [
68] parts of civil society and social movements in their decision-making processes. However, in the 1990s, as the economy and strategic priorities shifted towards integrating Barcelona into global markets, this opening was replaced by a more managerial style of governance. Among the widespread enthusiasm of the success of Barcelona’s urban developments, there was also a critical evaluation of its results, especially in terms of gentrification and tourism phobia [
69,
70,
71]. The further liberalization of land was promoted nationally in 1998, when the growing presence of international real estate funds and developers seemed to have subordinated the urban transformation of Barcelona to profit, beyond the real needs of the city. The consequent increase in housing prices and the reduction in affordable rents, in turn, favored the expulsion of part of the population from the city center [
41,
72,
73]. Thus, Barcelona is emblematic in terms of how tourism affects both housing demand and prices, and consequently favors gentrification [
74,
75,
76]. The report “Pla Estratègic de Turisme de Barcelona 2020, Impacte del lloguer vacacional en el mercat del lloguer residencial de Barcelona”, shows the effects of this trend on the real estate market. In Barcelona, 15,881 houses are used for tourism (HUT), corresponding to 7.7% of the rent of 205,912 homes, reaching 15% or more in some neighborhoods. The report shows that homeowners can earn between 2 and 2.5 times more by renting their homes to tourists, than by putting them on the regular rental market. Despite the importance of the increase in tourism, other factors have also contributed to the rental bubble in Barcelona. The lack of social housing, the growth of a floating residential population and the increased pressure on the real estate market by international investment capital, the search for speculative projects also increase rents and cause gentrification [
41]. The consequences of gentrification and tourism have overlapped on the housing crisis that has caused a wave of foreclosures and mortgage evictions since 2008, representing the onset of urban precariousness in Barcelona. Under the Franco regime, the main way to promote access to housing in Spain was ownership, at the expense of rent and social housing. Housing was seen as an economic growth tool, through an alliance between the construction, tourism and financial sectors that fostered building and housing bubbles and increased household debt. These processes created the conditions for the mortgage crisis that exploded in the aftermath of the global financial crisis [
77,
78,
79]. When the housing bubble burst, hundreds of thousands of people who lost their (often precarious) jobs began to struggle to make it through mortgage payments, facing the risk of losing their home through foreclosure, which meant that not only would they be evicted, but they would often still have a huge debt. The analysis of the official data on mortgage expropriations and evictions processed by the Consejo General del Poder judicial reveals that from 2008 to 2017, 725,134 foreclosure procedures were registered in Spain, of which 632,019 were executed. In the same period, 582,372 evictions were initiated and 367,457 were carried out.
So, in the aftermath of the global financial crisis, the precariousness of the right to housing in Spain was closely linked to the financialization and commodification of housing, and to the overlap with the increase in tourism and the influence of global capital in the housing sector. The result of foreclosures, evictions, rent increases and housing precariousness affected a large portion of Spanish citizens, and in Barcelona these problems have overlapped with the long-term consequences of gentrification and massive tourism.
It is possible to resist eviction, contest gentrification and dispose of housing precariousness, as demonstrated by the urban mobilizations that have emerged in recent years in different contexts [
80,
81,
82,
83,
84,
85]. In Spain, one of the main players in the fight for the right to housing is PAH, a social movement that was founded in Barcelona in February 2009 to provide support to grassroots activists for people who risk losing their homes due to mortgage insolvency. The first effort was to help those affected people overcome the feelings of isolation, fear and guilt that cause other problems, and tackle the practical needs more difficult to deal with. These problems included, first, fighting the risk of eviction, then looking for solutions regarding one’s debt and housing, and finally finding alternative housing solutions in eviction cases. The strategy used by PAH was based on the elaboration of a counter-narrative regarding the mortgage crisis and the empowerment and collective awareness of those affected through weekly assemblies [
86,
87].
PAH has developed three different action protocols and campaigns that directly involve the people affected. First, activists try to stop evictions by gathering as many people as possible at the door of the threatened family, using a form of peaceful passive resistance. Over the past decade, PAH has stopped thousands of evictions across Spain. Since January 2018, PAH Barcelona has registered the eviction cases in which the movement has been involved. In January 2018 and 2019, 474 eviction cases were dealt with, of which 68 (14.3%) were related to mortgage problems, 243 (51.2%) to rent problems, and 161 (34%) to eviction. Thanks to the intervention of the PAH, in 433 cases (91.3%) the eviction was avoided, even if they were blocked “in front of the door” (43%), or suspended before the date (48.3%). Eviction was carried out in 17 cases (3.6%) [
88].
Second, to find solutions to debt and housing problems, PAH creates shared protocols, documents and strategies to be used in direct negotiations between interested persons and banks in evading Spanish mortgage law. There is a variety of possible solutions according to different situations. They are often assigned as “dación en pago”, which is debt cancellation by returning the mortgaged home’s assets to the bank, and “alquiler social”, which is an affordable lease for the mortgaged home, even after the bank has regained possession. In the event that all available tools (negotiation with owners, pressure on social services to provide alternative solutions, etc.) fail, PAH, through the Obra Social campaign, promotes what it calls “recovery”. This can be translated as “bottom-up recovery” which is occupying empty bank-owned homes to relocate evicted families. This campaign, by reformulating the narrative and the language around the occupation, has helped to innovate and legitimize this practical policy, which can be considered an effective way to radically challenge a housing model such as the Spanish one, strongly rooted in private home ownership through debt. Through all these daily practices, PAH supports thousands of people with their housing problems. However, to find structural solutions and effectively guarantee the right to housing, PAH has also devised a long-term strategy to change the legal framework of housing: the ILP—Iniciativa Legislativa Popular (Popular Legislation Initiative).
The ILP (Popular Legislative Initiative) promoted by PAH in collaboration with NGOs and trade unions in 2012 was the first attempt to respond to the legislative crisis on housing. The ILP aimed to introduce mechanisms to make the “dación en pago” automatic and retroactive and to enact a moratorium on evictions for economic reasons and promote the social renting of housing [
89]. The ILP campaign overlapped with the rise of the 15M or “movement of the indignados” which, in turn, contributed to its success [
90]. After collecting 1,402,854 signatures, PAH presented its proposals to the Spanish Parliament. However, the Partido Popular (PP) which had an absolute parliamentary majority opposed the ILP and the PAH withdrew it. Although this first attempt failed, PAH’s requests were now considered legitimate, and were therefore used as a basis for other proposals to change the housing legal framework at the local level [
89].
The Catalan ILP was the second campaign to change the law promoted by the PAH. Since the opposition PP made it impossible to approve the ILP at a national level, the movement changed its strategy and started working autonomously. In early 2015, more than 140,000 signatures were collected to support the presentation of another ILP to the Catalan Parliament. This proposal was presented a few months before the autonomous and municipal elections, to put pressure on the Catalan parties involved in the election campaigns, making them more likely to accept the proposal. Thanks to the mobilization and negotiation with the parties, the proposals of the ILP were approved on 23 July 2015, giving rise to the Catalan law 24/2015. This law responded to the housing crisis and guaranteed the right to housing in several ways: first, it introduced mechanisms to resolve consumer over-indebtedness, and measures to avoid evictions that could produce homelessness in people at risk of residential exclusion, including through the obligation for large lessors to produce a social annuity offer in the event of a foreclosure procedure or non-payment of the rent. Second, it sought to expand the public housing stock by introducing the mandatory transfer to the local government administration of empty houses owned by legal entities and large owners. Third, it introduced mechanisms to ensure access to basic supplies (water, electricity and gas) for vulnerable households. The Catalan law 24/2015 was the first Spanish law to be approved starting from an ILP developed by social movements. It can be considered one of the most advanced autonomous laws, in terms of how housing has developed as a subjective right, and also the mechanisms for granting it [
87]. However, the government of the Popular Party appealed to the Constitutional Court on 29 April 2016, claiming the unconstitutionality of some parts of the law, resulting in the suspension of various articles. In October 2018, the Generalitat—the Catalan government—and the central government, led since June 2018 by the PSOE, agreed to withdraw this constitutional appeal, and from 22 February 2019 most of the articles of the law 24/2015 have returned in force. The “30% measure” in Barcelona represents one of the PAH’s greatest achievements in terms of promoting new policies at a local level. As noted, the intensification of mass tourism and gentrification in Barcelona, in addition to the consequences of the mortgage crisis and the increase in the presence of international funds that are investing speculatively in the city, has fueled the increase in rents.
PAH has come up with a long-term strategy to change the housing legal framework that has complemented, supported and helped legitimize its illegal practices. In this sense, the PAH campaigns represent an attempt to introduce a structural and legal mechanism to undo the precariousness that is complementary to the civil disobedience campaigns analyzed above. This “change the law” strategy was developed through a trial-and-error procedure, addressing the institutional blockade of the PP and its reshaping of housing precariousness by exploiting and contributing to changes in power dynamics within the political system to open up new political opportunities. The case of Barcelona, where, in 2015, Ada Colau, one of the six founders of PAH and for many years spokesperson for the movement, won the municipal elections and became the new Mayor, is emblematic of how PAH has not only challenged and influenced the political system, but it also helped to change it.
5. Conclusions: Differences between the Social Response in Barcelona and Naples
In the previous section, the analysis of the index showed the scenario of a city deeply marked by socio-economic inequalities that, although widespread in urban areas in a global context, tends to have a broader impact in cities such as Naples than in other cities [
91]. This happens mainly because Naples’ institutional framework is unable to provide concrete responses to the specific situation, due to the red tape and the absence of financial instruments to bridge the socio-economic gap, and prevent the resulting urban segregation phenomenon. From the examination of the social responses to the housing crisis, it has also appeared that the existing initiatives do not have enough strength to respond concretely to the problem.
In fact, as analyzed previously, the consequence of such a context of discomfort could arouse a strong social response embodied in the emergence of social movements, including those for the right to housing, as has emerged in different contexts [
76,
80,
81,
82,
83,
84,
85].
In Naples, as we saw above, the return on the issues of housing by the actors of the Neapolitan Urban Movement takes place with the campaign for the right to live “Magnammece ‘o pesone” (MOP).
This campaign, therefore, was born with the precise purpose of claiming the right to housing, and brings the housing emergency in Naples back to the center of the political discourse. The subjects penalized by the new rules of the labor market, whose conditions have been aggravated from the economic crisis, as well as the strata historically in disadvantaged conditions, have for years have been waiting for state intervention to resolve the housing issue that sees them deprived.
Similarly, in Barcelona, the global financial crisis and the precariousness of the right to housing is closely linked to the financialization and commodification of housing, and to the overlap with the increase in tourism and the influence of global capital in the housing sector [
61], leading to foreclosures, evictions, rent increases and housing precariousness with long-term consequences in terms of gentrification and massive tourism [
42]. In this context, the social response has been the birth of an important player in the fight for the right to housing: the PAH (Plataforma de Afectados por la Hipoteca, a social movement founded to provide support to grassroots activists for people who risk losing their homes due to mortgage insolvency).
The main difference between the two movements is the structure of their action. The MOP campaign was created with the aim of occupying disused buildings for social purposes; this goal was much broader than the claim of the right to housing as commonly understood, such as the desire to repossess spaces and liberate them from disuse, abandonment or speculation. The occupations perpetrated by the campaign represent the final stage of a path that has seen activists undertake various actions, such as mapping of the territory in order to identify abandoned buildings, or those in a state of neglect, city assemblies to share what has emerged from the mapping, and discuss the decisions of the Municipality regarding the disposal of the municipal real estate assets, and symbolic demonstrations and occupations of various buildings. However, it failed to structure a comprehensive proposal for a response to the problem other than mere demonstrative action and, most of all, to engage in a dialogue with the city’s institutions.
On the other, instead, the PAH has developed three different action protocols and campaigns that directly involve the people affected. First, activists try to stop evictions by gathering as many people as possible at the door of the threatened family, using a form of peaceful passive resistance. Due to the intervention of the PAH, in 433 cases (91.3%) the eviction was avoided, even if they were blocked “in front of the door” (43%), or suspended before the date (48.3%). Eviction was carried out in 17 cases (3.6%) [
88].
Second, to find solutions to debt and housing problems, PAH creates shared protocols, documents and strategies to be used in direct negotiations between interested persons and banks in evading Spanish mortgage law. There is a variety of possible solutions according to different situations. They are often assigned as “dación en pago”, which is debt cancellation by returning the mortgaged home’s assets to the bank, and “alquiler social”, which is an affordable lease for the mortgaged home, even after the bank has regained possession. In the event that all available tools (negotiation with owners, pressure on social services to provide alternative solutions, etc.) fail, PAH, through the Obra Social campaign, promotes what it calls “recovery”. This can be translated as “bottom-up recovery” which is occupying empty bank-owned homes to relocate evicted families. This campaign, by reformulating the narrative and the language around the occupation, has helped to innovate and legitimize this practical policy, which can be considered an effective way to radically challenge a housing model such as the Spanish one, strongly rooted in private home ownership through debt. Through all these daily practices, PAH supports thousands of people with their housing problems. However, to find structural solutions and effectively guarantee the right to housing, PAH also devised a long-term strategy to change the legal framework of housing: the ILP—Initativa Legislativa Popular (Popular Legislation Initiative). Their first attempt was to respond to the legislative crisis on housing. The ILP aimed to introduce mechanisms to make the “dación en pago” automatic and retroactive, and to enact a moratorium on evictions for economic reasons and promote social renting of housing [
90]. The proposals of the ILP were approved on 23 July 2015, giving rise to the Catalan law 24/2015. This law responds to the housing crisis and guarantees the right to housing, and represents one of the PAH’s greatest achievements in terms of promoting new policies at the local level.
PAH, in contrast to MOP, has come up with a long-term strategy to change the housing legal framework that has complemented, supported and helped legitimize its illegal practices. In this sense, the PAH campaigns represent an attempt to introduce a structural and legal mechanism to undo the precariousness that is complementary to the civil disobedience campaigns analyzed above, on the other hand, as already affirmed, in Naples the MOP movement failed to take the next step and remained, de facto, a movement that produced only actions against the law. In Barcelona, this “change the law” strategy was developed through a trial-and-error procedure, addressing an institutional blockade of the governing Partido Popular. It attempted to reshape housing precariousness by exploiting and contributing to changes in power dynamics within the political system, to open up new political opportunities. In addition to the results achieved in the struggle process, PAH has also achieved such a level of rootedness in the territory, turned into political consensus, to the extent that one of the six founders and spokespersons of the movement, Ada Colau, became mayor of the city in 2015, highlighting how PAH has not only challenged and influenced the political system, but also helped to change it by becoming part of it.


