Article

Spatiotemporal Evolution of Seasonal Crop-Specific Climatic Indices under Climate Change in Greece Based on EURO-CORDEX RCM Simulations

by
Theodoros Mavromatis
1,*,
Aristeidis K. Georgoulias
1,
Dimitris Akritidis
1,2,
Dimitris Melas
3 and
Prodromos Zanis
1
1
Department of Meteorology and Climatology, School of Geology, Aristotle University of Thessaloniki, 54124 Thessaloniki, Greece
2
Atmospheric Chemistry Department, Max Planck Institute for Chemistry, 55128 Mainz, Germany
3
Laboratory of Atmospheric Physics, Department of Physics, Aristotle University of Thessaloniki, 54124 Thessaloniki, Greece
*
Author to whom correspondence should be addressed.
Sustainability 2022, 14(24), 17048; https://doi.org/10.3390/su142417048
Submission received: 1 December 2022 / Revised: 7 December 2022 / Accepted: 15 December 2022 / Published: 19 December 2022
(This article belongs to the Special Issue Climate Change Research toward Sustainable Agriculture)

Abstract

:
This study presents an updated assessment of the projected climate change over Greece in the near future (2021–2050) and at the end of the 21st century (2071–2100) (EOC), relative to the reference period 1971–2000, and focusing on seasonal crop-specific climatic indices. The indices include days (d) with: a maximum daily near-surface temperature (TASMAX) > 30 °C in Spring, a TASMAX > 35 °C in Summer (hot days), a minimum daily near-surface temperature (TASMIN) < 0 °C (frost days) in Spring, a TASMIN > 20 °C (tropical nights) in Spring–Summer and the daily precipitation (PR) > 1 mm (wet days) in Spring and Summer covering the critical periods in which wheat, tomatoes, cotton, potato, grapes, rice and olive are more sensitive to water and/or temperature stress. The analysis is based on an ensemble of 11 EURO-CORDEX regional climate model simulations under the influence of a strong, a moderate, and a no mitigation Representative Concentration Pathway (RCP2.6, RCP4.5 and RCP8.5, respectively). The indices related to TASMAX are expected to increase by up to 11 days in Spring and 40 days in Summer, tropical nights to rise by up to 50 days, frost days to decrease by up to 20 days, and wet days to decline by up to 9 days in Spring and Summer, at the EOC with an RCP8.5. The increased heat stress and water deficit are expected to have negative crop impacts, in contrast to the positive effects anticipated by the decrease in frost days. This study constitutes a further step towards identifying the commodities and/or regions in Greece which, under climate change, are or will be significantly impacted.

1. Introduction

The agricultural sector in Greece provides food, services and resources, guaranteeing the livelihood of 12–13% (in 2010) of the total labor force in Greece and contributing 4% of the national gross domestic product (GDP), almost double the European average. Exports of agricultural products account for one third of the total exports in Greece [1]. Agricultural land accounts for about 36% of Greek land (where 24% of this is irrigated, at least once a year) [2].
Agriculture is one of the most climate- and weather-dependent socio-economic sectors (and this will continue in the future), since most of the agriculture productivity and quality are directly dependent on different climatic factors [3,4,5]. Climate change’s (and particularly the combined effects of changes in temperature, rainfall and atmospheric CO2 concentrations) direct and indirect impacts on the agriculture sector are differentiated across the European regions [6]. Direct impacts relate to temporal shifts in phenology and calendars, the displacement of cultivation areas and soil loss, changes in the water supply and irrigation demand, and the direct effects of increased CO2 on crop growth. Indirect impacts arise as a result of the direct effects, further aggravating the negative impacts on agricultural production, including increases in pests and diseases, invasive species and extreme events (such as very strong winds, hailstorms, intense heat and frosts) [6,7].
According to the American Meteorological Society (AMS) (https://glossary.ametsoc.org/wiki/Agroclimatic_index, accessed on 16 December 2022), an agroclimatic index is a climate measure or indicator that has specific agricultural significance. Most indices are focused on drought, phenology, frost, and heat stress [8]. To date, there have been only a limited number of published studies dealing with changes related to agroclimatic indices for specific crops in Greece [9,10,11,12]. Positive trends were found for the thermal indices of the growing degree Days and heat stress index, using a gridded (25 × 25 km2) daily air temperature (maximum and minimum) from the Agri4Cast dataset of the JRC MARS Meteorological Database, during 1978–2020 [9]. These results suggest a clear expansion ability of maize and wheat to the northern and higher altitude areas in the Balkan Peninsula and an increased risk of heat-caused plant injuries. The free-of-frost period of a year (i.e., the number of days between the last and first frost day of the year), in the same area during the above-mentioned baseline, increased (positive trends were found) as a result of an earlier last Spring frost and a delayed first Autumn frost, and the frost days (TASMIN ≤ 0 °C) are expected to be reduced in the future [9,13]. Refs. [11,12] categorized Greek wine-grape areas with the use of the agroclimatic indices and investigated the relationships between their harvest dates and berry composition (e.g., potential alcohol and acid levels) with the climate during critical periods of the vegetative cycle.
Last but not least, [14] presented an updated assessment of the projected climate change (for specifics of the regional climate model (RCM) ensemble and the Representative Concentration Pathway (RCP) emission scenarios used, see Section 2.1) over Greece in the near future (NF) (2021–2050) and at the end of the 21st century (EOC) (2071–2100), focusing on the near-surface temperature, precipitation, and heat (hot days and tropical nights), cold (frost days) and drought (consecutive dry days)-related climate indices. A warmer future for Greece, ranging from 1.2–1.6 °C in the NF to 1.4–4.3 °C at the EOC, was found no matter which RCP was used. As a result, the number of hot days and tropical nights in a year is projected to increase significantly and the number of frost days to decrease. The precipitation is projected to decrease by up to 16% and the number of consecutive dry days in a year to increase by 15.4 days (30%) at the EOC under RCP8.5.
However, most of these studies provide only a general picture of the effect of climate change on the agroclimatic conditions during a growing season [13,14] without focusing on the critical periods (during which most crops are more sensitive to water and/or temperature stress) that the quality and quantity of specific crops are affected. A recent survey in Pakistan revealed that the closer to harvest time extreme weather events occur, the greater the climate-induced damages to wheat are expected [5]. In this context, this study presents, for the first time to our knowledge, a multi-model assessment of the projected climate change over Greece (Figure 1) in the NF and at the EOC, focusing on crop-specific temperature- and precipitation-related indices during critical time periods. Understanding the specific impacts of temperature and the precipitation threshold frequency changes on a number of major Greek commodities is a necessary step in providing policy makers, agronomists and growers with the decision-making tools to manage and adapt to climate change [15]. This analysis is based on the same regional climate model simulations used by [14].
The paper is structured as follows. Section 2.1 describes the data from the RCM simulations. Section 2.2 discusses the critical crop periods for a number of significant-for-Greece crops and the seasonal crop-specific climatic indices used in this study, while Section 2.3 presents the methodology adopted for the analysis. Section 3 presents and discusses the main results for the maximum temperature-related indices (Section 3.1), the minimum temperature-related indices (Section 3.2), and the precipitation-related indices (Section 3.3), while Section 4 summarizes the key findings of the study.

2. Data and Methods

2.1. Regional Climate Model Simulations

Daily near surface maximum and minimum air temperatures (i.e., TASMAX and TASMIN, respectively; in °C) and precipitation (PR; in mm day−1) from 11 regional climate model (RCM) simulations at a horizontal resolution of 0.11° (~12.5 km), derived from the EURO-CORDEX initiative (https://www.euro-cordex.net/, accessed on 16 December 2022) [16,17,18], were used. The simulations are a product of various RCMs driven by various global climate models (GCMs) (Table 1). For each member of the ensemble, data from four different simulation runs were used: a historical simulation during 1950–2005 and three simulations for the period 2006–2100 under three different RCPs (RCP2.6, RCP4.5 and RCP8.5). RCP2.6 is a strong mitigation scenario where greenhouse gas (GHG) concentrations are bound to decrease by −70% during 2010–2100 [19]. RCP8.5 is a high-end scenario without any future environmental and climate change policies applied with GHG concentrations contentiously increasing [20]. It should be noted that high-end scenarios (such as in RCP8.5) can be very useful to explore the high-end risks of climate change but the rapid development of renewable energy technologies and emerging climate policy have made it considerably less likely that emissions could end up as high as in RCP8.5 [21]. The RCP4.5 is a moderate cost-efficient mitigation scenario designed to reach the radiative forcing target of 4.5 W m−2, with GHG concentrations starting to decrease after 2040 [22]. Details regarding how the original EURO-CORDEX daily data were brought to a standard 0.1° × 0.1° grid using a focus on southeastern Europe (34° N–44° N, 18° E–30° E) with Greece being in the center of this region (Figure 1), are given by [14].

2.2. Critical Crop Periods—Crop- and Seasonal-Specific Climatic Indices

Critical to water and temperature stress periods are those during which insufficient soil moisture causes an irreversible loss of yield or quality. A review of the literature was undertaken to document these critical periods for a number of significant-for-Greece crops (Table 2).
In Greece, wheat (Triticum aestivum L.) covers 25% of the cultivated land, i.e., about 10 million hectares. Winter wheat is a crop that can tolerate cold temperatures during the early phases of its growth and development. From its early developmental stages (through tillering), this small grain can easily withstand temperatures of down to −11 °C; however, as Spring progresses and the wheat growth progresses from boot to flowering, it becomes more susceptible to injury (e.g., moderate to severe yield decreases were identified) by freezing temperatures and its cold tolerance is reduced by −2 to −1 °C [23] (the threshold of 0 °C was selected for this study). This is because the growing point (meristem) is pushed above the soil surface and is no longer protected by the soil. On the other hand, below average yields were found when the TASMAX > 30 °C at anthesis due to pollen sterility, lower carbon dioxide (CO2) assimilation and increased photorespiration [24]. A high nighttime temperature (≥20 °C) from booting to maturity was also found to decrease the spikelet fertility, grains per spike, and grain size [25]. Drought stress on Winter wheat during Spring shooting and booting results in premature heading and early maturity and, thus, a shortened growth period and yield loss [26].
Olive (Olea europaea) trees cover 20% of the cultivated land (approximately 130.000.000 trees in an area of 6900 km² (https://olivetreeroute.gr, accessed on 16 December 2022)). At lower than −7 °C, leaves are lost, and slender branches dry up, resulting in severe yield losses [27]. At −10 °C and below the death of the entire tree occurs. Above 35 °C, the stomata start closing up, thereby negatively affecting the growth [28], and at 40–45 °C, photosynthesis completely stops [29]. Olive production is negatively affected by Summer drought when its fruit formation and development occur [30].
Greece is by far the primary cotton (Gossypium hirsutum)-productive country in the European Union (EU) [31]. Although it is considered a warm season crop, temperatures greater than 30 °C result in a reduction in the fruit retention which can delay the crop maturity and reduce the overall lint yield and quality [32]. Cotton is also frost sensitive, and its germination percentage and seedling establishment is damaged when the temperature drops to −2–−1 °C [23] (the threshold of 0 °C was selected for this study).
A 43% area of western and central Greece, and the Peloponnese, and 30% of Macedonia and Thrace (see Figure 1) are given over to potato (Solanum tuberosum L.) production. The most heat-vulnerable stages of potato growth and development are at tuber initiation and tuber bulking. At a temperature higher than optimal (i.e., haulm growth is fastest in the temperature range of 20–25 °C), a reduction or complete inhibition of tuberization and the intensified development of the aboveground parts of the plants take place [33]. Heat stress (TASMAX > 35 °C) severely reduces the tuber formation and tuber weight by disrupting the tuberization signal as well as reducing the accumulation of carbon into starch in the tuber [34]. Potato is also frost sensitive, and severe damage may occur when the temperature drops below 0 °C [35]. The most sensitive to water stress stage of potato growth generally occurs when its storage organs enlarge; however, major reductions in yields occur from severe water stress only [26].
Tomato (Lycopersicon esculentum) is the most widely cultivated vegetable in the world. The two-week period up to anthesis is the most critical developmental phase for this crop. Under heat stress (the critical temperature varies from 29 °C for sensitive cultivars to 32 °C for more heat-tolerant ones [36]—the threshold of 30 °C was selected for this study), the fruit is set without adequate pollination, the internal fruit segments contain few seeds, and the tomato is flat sided and puffy. Reference [37] suggested that Summer temperatures above 35 °C values would most likely reduce tomato production. Conversely, freezing injury due to a springtime early frost (TASMIN < 0 °C) can also substantially reduce the final yield [23]. Tomatoes are most sensitive to drought stress at flowering and during its fruit and seed development. Moreover, the fruit set on this crop can be seriously reduced if water is limited [26].
The average annual wine production in 2020 was 2.3 million hl (with 1.7 million hl for 2021), which ranks Greece as the 17th largest wine-producing country in the world [38]. Early Spring frosts (TASMIN < 0 °C) damage plant tissue by the rupturing of cells, enzyme reductions caused by dehydration, and the disruption of membrane function. At the other end of the spectrum, Summer temperatures that exceed +35 °C negatively impact wine grape production by “shutting down the vines” through an inhibition of photosynthesis and a reduction in the color development and anthocyanin production [39]. Ample precipitation during the early vegetative stage is beneficial to initial growth; however, during bloom it can reduce or retard flowering, and during berry growth it can enhance the likelihood of fungal diseases. During maturation, rainfall can increase the fungus occurrence and growth, dilute the berries (which reduces the sugar and flavor levels), and severely limit the yield and quality [39].
Seventy percent of all Greek rice (Oryza sativa L.), approximately 26.000 ha of land located primarily on river estuaries and coastal areas, is grown mostly in Central Macedonia (see Figure 1). It is well documented that even a short-term exposure to high temperatures (>34–35 °C) can result in rice growth and yield losses due to spikelet degradation or pollen sterility [40,41,42]. High night temperatures of 22 °C (the threshold of 20 °C was used in this study) were shown to be comparatively more deleterious than high day temperatures to the early and mid-stages of grain filling causing a reduction in the final grain weight and growth rate of rice [43].
Most of the crop specific indices used in this study (Table 2) were recommended by the Expert Team on Sector-Specific Climate Indices (ET-SCI) for the agriculture and food security sector (https://climpact-sci.org/indices/, accessed on 16 December 2022). The impacts of drought and temperature stress on the critical stages of specific crops are also shown in the same table.
Table 2. The crop specific indices used in this study. The impacts of drought and temperature stress on critical crop-specific stages are also shown.
CropIndices Related to TemperatureSeasonImpact of Temperature Stress
1Wheat 1, Tomatoes 5, Cotton 8Days with TASMAX > 30 °CSpringYield decrease (Wheat); fruit setting (Tomato); reduction in fruit retention (Cotton).
2Wheat 2, Cotton 2, Potato 3,
Tomatoes 3, Grapes 7
Days with TASMIN < 0 °C (frost days)SpringYield decrease (Wheat, Tomato, and Potato); plant issue damage (Grape); damage in germination percentage and seedling establishment (Cotton).
3Wheat 9, Rice 11Days with TASMIN > 20 °C (tropical nights)Spring–SummerDecrease in grains per spike and grain size (Wheat); reduction in grain weight and growth rate (Rice).
4Potato 4, Tomatoes 6, Grapes 7, Rice 10, Olive 12Days with TASMAX > 35 °C (hot days)SummerTuber formation and yield (Potato); fruit setting (Tomato); yield decrease (Grape); growth rate decrease (Olive); growth rate and yield losses (Rice).
1: [24]; 2: [23]; 3: [35]; 4: [34]; 5: [36]; 6: [37]; 7: [39]; 8: [32]; 9: [25]; 10: [40]; 11: [43]; 12: [28].
CropIndices Related to PrecipitationSeasonImpact of Water Deficit
1Wheat 1, Tomatoes 1, Grapes 2Days with PR > 1 mm (wet days)SpringFlowering (Potato); shortened growth period and decreased yield (Wheat); early flowering (Grapes).
2Potato 1, Tomatoes 1, Grapes 2, Olive 3Days with PR > 1 mm (wet days)SummerReduced fruit (Tomato) and tuber size (Potatoes); yield and quality decreases (Grapes); fruit formation and development (Olive).
1: [26]; 2: [39]; 3: [30].

2.3. Methodology

Once the indices (shown in Table 2) were calculated on a grid cell basis for each of the 11 sets of simulations (Table 1) separately on an annual basis, they were averaged in order to compile an ensemble mean dataset for the historical period (1950–2005) and for each RCP separately that spanned from 2006 to 2100. The changes in these indices over Greece are reported for the NF (2021–2050) and the EOC (2071–2100) 30 year periods relative to the reference period (1971–2000) and the results are presented by means of maps. Following recent studies [16], a difference between two climate projections was considered statistically robust here if the differences for at least 7 out of the 11 simulations constituting each ensemble had the same sign with the ensemble difference and were statistically significant at the 95% confidence level according to the non-parametric Mann–Whitney test [44]. In addition, timeseries with differences between the indices of the annual mean and the mean for the reference period for Greece (also mentioned as anomalies) are presented for the period 1950–2100 for all the RCPs following [14].

3. Results and Discussion

3.1. Maximum Temperature-Related Indices

Figure 2 shows the projected ensemble change in the number of days with a TASMAX > 30 °C in Spring, for the NF and the EOC periods under the three RCPs. The pattern of change in the number of days with a TASMAX > 30 °C was similar in the NF (under all scenarios) and in the EOC, with an RCP2.6, exhibiting insignificant increases (except for limited areas in Macedonia and Thessaly where robust increases of up to 4 days/yr were found). With the moderate mitigation scenario of an RCP4.5 in the EOC, the areas presenting substantial increases (reaching maximum values of up to 7 days/yr) were extended even further.
For RCP8.5, significant increases (up to 11 additional days/yr with a TASMAX > 30 °C relative to the historical period) at the end of the century are expected all over Greece. The annual timeseries of the difference in the frequency of days in Spring with a TASMAX > 30 °C from the reference period (1971–200), for the three emission scenarios, during 1950–2100, are also shown for Greece in Figure 3a.
As shown in the embedded boxplot (dots), for the RCP2.6, a marginally lower average increase was projected for the EOC relative to the NF (of about 0.9 days/yr vs. 1.0 days/yr, respectively). For the RCP4.5, the projected increase was 0.9 days/yr for the NF and 1.8 d/yr for the EOC, on average. For the RCP8.5, the respective increases were about 0.9 days/yr and 4.8 days/yr. The gradual increase in the last 50 years under the high-end RCP8.5 scenario is highlighted, following an increase in GHG emissions, relative to the stabilization projected for the other two emissions scenarios (particularly for RCP2.6) in the same period.
The stronger magnitude and spatial coverage increase with an RCP8.5 compared to an RCP4.5, relative to the historical period 1995–2014, in the frequency of extreme temperature events (i.e., days with daily temperature > 30 °C on annual basis) in 2081–2100 and with respect to 2046–2065, using an ensemble of 11 CMIP6 climate model simulations, was confirmed for southeastern Europe by [45,46] using an ensemble of 12 EURO-CORDEX simulations. They found the annual number of days with a daily TASMAX ≥30 °C (a) were to continue to increase only for an RCP8.5 (in contrast to RCP2.6) from 2030 onwards and (b) increased in frequency by at least 10 additional heat days/yr in southern Europe with the RCP8.5 in relation to the RCP2.6.
The pattern of change in the number of days with a TASMAX > 35 °C in Summer was similar in the NF (under all scenarios), and in the EOC with the RCP2.6 exhibiting significant increases (except for the higher latitude areas in Pindus, Macedonia, and Peloponnese) up to 16 days/yr (Figure 4). With an RCP4.5 at the EOC, the areas presenting substantial increases extended even further (while only the mountain areas in Pindus stood out presenting no robust changes), reaching maximum values of up to 24 days/yr. For the RCP8.5, increases in the EOC by up to 40 additional days/yr with a TASMAX > 35 °C, in relation to the historical period, are expected all over Greece. The timeseries of this index were similar to that of the TASMAX > 30 °C, with a gradual increase in the last 50 years under the RCP8.5 scenario compared with a stabilization projected for the RCP2.6 and RCP4.5 in the same period (Figure 3b). The almost parallel course and consistent difference (larger than that of TASMAX > 30 °C) between those two scenarios is noticeable. As for the previous index, a marginally lower average increase was projected for the EOC relative to the NF under the RCP2.6. For the RCP4.5, the projected increase was 6.1 days/yr for the NF and 10.5 days/yr for the EOC, on average, while for the RCP85 the respective increases were about 6.7 days/yr and 25.2 days/yr.

3.2. Minimum Temperature-Related Indices

The decreases in the number of days with a TASMIN < 0 °C (frost days) in Spring were largely statistically robust (except for the low elevation land areas in the NF for RCP2.6 and RCP4.5) for the NF and the EOC periods under the three RCPs (Figure 5). While in the NF, maximum decreases of up to 12 days were projected to appear only in the higher elevation parts of Pindus under the RCP8.5, by the EOC, similar magnitude reductions in this index initiated from the strong mitigation scenario (RCP2.6) and decreases of up to 20 days covering the high elevation land areas were projected under the RCP4.5 and RCP8.5 scenarios. The timeseries of frost day differences in Spring displayed a gradual decrease (steeper in the case of the RCP8.5 and weaker for the RCP2.6) with time (Figure 3c). For RCP2.6, the projected decrease from 2.8 days/yr, on average, for the NF was further increased by only ~1 day/yr (3.9 days/yr) in the EOC. The respective changes between the two future periods were 2 days/yr (from 3.3 to 5.3 days/yr) for an RCP4.5 and 3.6 days/yr (from 3.7 to 7.3 days/yr) for an RCP8.5.
Average decreases in the frequency of frost days in Spring of 1.3 days/yr for RCP2.6 and 14.3 days/yr for RCP8.5, for the period 2071–2099 relative to the 1981–2010 reference period, were found for Greece from the European Climate Adaptation Platform Climate-ADAPT (https://climate-adapt.eea.europa.eu, accessed on 1 December 2022), when an ensemble of five global climate model simulations from the EURO-CORDEX initiative was used. A more pronounced reduction in the number of frost days at a higher elevation was also observed from a spatiotemporal analysis of the frost regime in the Iberian Peninsula in the context of climate change [47].
The pattern of change in the number of days with a TASMIN > 20 °C in Spring–Summer was similar in the NF (under all scenarios), and in the EOC with the RCP2.6, exhibiting significant increases (except for the higher latitude areas in Pindus) up to 25 days/yr (Figure 6). While the spatial distribution of change remained the same with the RCP4.5 in the EOC, maximum values of up to 35 days/yr were found. For the RCP8.5, increases in the EOC by up to 50 additional days/yr with a TASMIN > 20 °C, in relation to the historical period, are expected all over Greece. The response of the timeseries in this index exhibited a gradual increase in the last 50 years under an RCP8.5 compared with a stabilization projected for an RCP2.6 and RCP4.5 in the same period (Figure 7a). The similar course and consistent difference between those two scenarios are visible. For an RCP2.6, a marginally lower average increase was projected for the EOC (12 days/yr) relative to the NF (12.3 days/yr). For an RCP4.5, the projected increase was 14.1 days/yr for the NF and 22.8 days/yr for the EOC, on average, while for an RCP8.5, the respective increases were 16 days/yr and 44.2 days/yr.
For Greece, the projected average increases in this index during Spring–Summer from the European Climate Adaptation Platform Climate-ADAPT (https://climate-adapt.eea.europa.eu, accessed on 1 December 2022) were 15.1 days/yr for the RCP2.6 and 42.9 days/yr for the RCP8.5 for the period 2071–2099 relative to the 1981–2010 ERA5 reference period. Their respective numbers for the period 2041–2070 (16.1 days/yr for RCP2.6 and 27.3 days/yr for RCP8.5) were also in agreement with those from the present study (13.3 days/yr for RCP2.6 and 26.2 days/yr for RCP8.5).

3.3. Precipitation-Related Indices

The analysis regarding the change patterns of the number of days with a PR > 1 mm (wet days) in Spring and Summer (Figure 8 and Figure 9, respectively), revealed non-robust decreases that became statistically robust (up to 8–9 days) all over Greece only under an RCP8.5 in the EOC. Specifically, similar spatial patterns of non-robust decreases in wet days (up to 4 days/yr) were projected for some parts of Greece for all three scenarios in the NF. In the EOC, the decrease in wet days extended over the whole of Greece and would become slightly larger (up to 5 days/yr) for an RCP4.5 and significantly larger (up to 9 days/yr) for an RCP8.5. The projected changes were robust in the EOC, for some parts of Greece (i.e., Peloponnese and Crete) in an RCP4.5, and for almost the whole of Greece for an RCP8.5.
The response of the timeseries in this index exhibited a gradual decrease in the last 50 years under an RCP8.5 in relation to a stabilization projected for the RCP2.6 and RCP4.5 (Figure 7b). Marginally lower and higher decreases (less than 0.6 days/yr on average) were projected for the EOC in relation to the NF for the RCP2.6 and RCP4.5, respectively. In the case of the RCP8.5 in the EOC, 2.5 fewer wet days, on average, were projected.
A similar analysis in Spring (Figure 9) revealed non-robust decreases (up to 4 days) in the NF. Statistically robust decreases (up to 5 days) appeared with the RCP4.5 and were projected all over Greece (up to 8–9 days) with the RCP8.5. The response of the timeseries in this index (Figure 7c) also exhibited a gradual decrease in the last 50 years under the RCP8.5 scenario in relation to a stabilization projected for the RCP2.6 and RCP4.5. While no decreases were projected for the EOC in relation to the NF with an RCP2.6, 1.5 and 5 fewer wet days in Spring every year in the EOC in Greece, on average, were projected with the RCP4.5 and RCP8.5, respectively.
A comparison of 15 regional climate model (RCM) simulations (under the RCP4.5 and RCP8.5) from the EURO-CORDEX initiative with 14 RCM simulations (under the A1B emission scenario) from the EU-ENSEMBLES project [48] found the following outcomes. (i) In the NF (the period 2020–2049 was used with respect to 1981–2010), a seasonal agreement over the Mediterranean region, in Spring (with robust decreases of 6% in the probability of wet days (≥1 mm), on average, and with ENSEMBLES vs. 4% with an RCP4.5 and 5% with an RCP8.5) and Summer (with robust decreases of 9% in the probability of wet days, on average, with ENSEMBLES vs. 9% with an RCP4.5 and 10% with an RCP8.5) between the two initiatives and (ii) while in the EOC (the period 2070–2099 was used with respect to 1981–2010), the reductions in the fraction of wet days for the RCP4.5 of EURO-CORDEX runs so as to be not as pronounced as for the EU-ENSEMBLES (e.g., −11% vs. −20% in Spring and −14% vs. −33% in Summer, respectively) and for the RCP8.5 to be similar (e.g., −19% vs. −20% in Spring and −32% vs. −33% in Summer, respectively) [49].

4. Conclusions

This study presents an assessment of the projected climate change over Greece in the NF (2021–2050) and at the EOC (2071–2100), focusing on crop-specific temperature- and precipitation-related indices during the critical time periods for wheat, tomatoes, cotton, potato, grapes, rice and olive. The analysis is based on an ensemble of 11 high-resolution EURO-CORDEX regional climate model simulations under the influence of three scenarios with strong, moderate and without mitigation (RCP2.6, RCP4.5 and RCP8.5, respectively). Our approach with a regional focus on the country of Greece can be potentially expanded to other regions within the EURO-CORDEX domain making use of the EURO-CORDEX high resolution RCM simulations. The primary findings are summarized as follows:
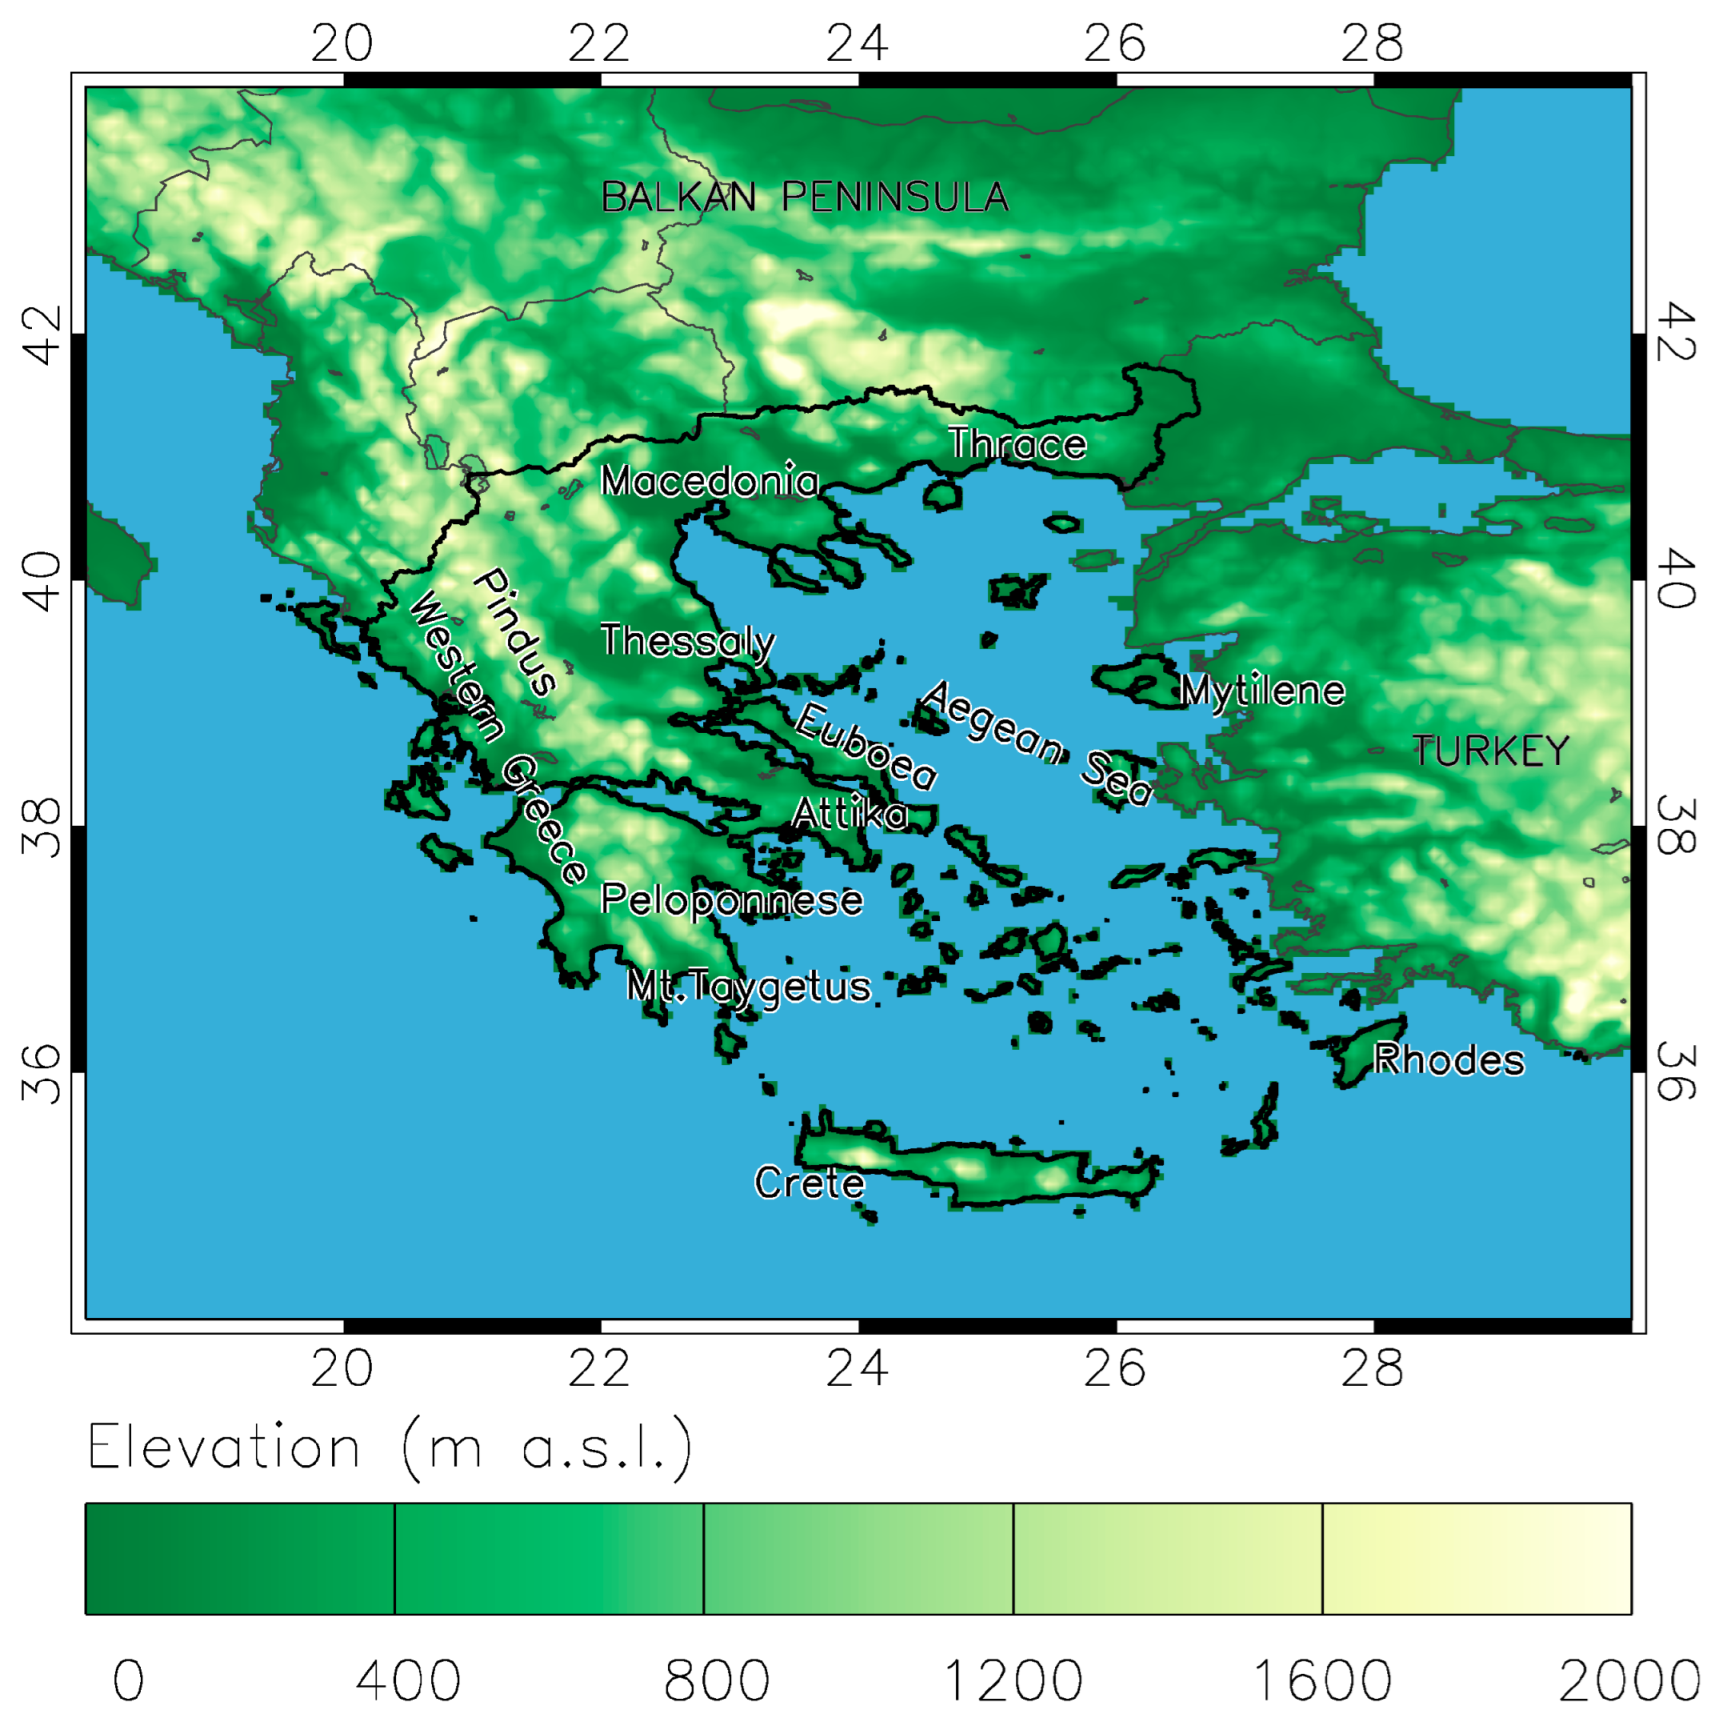
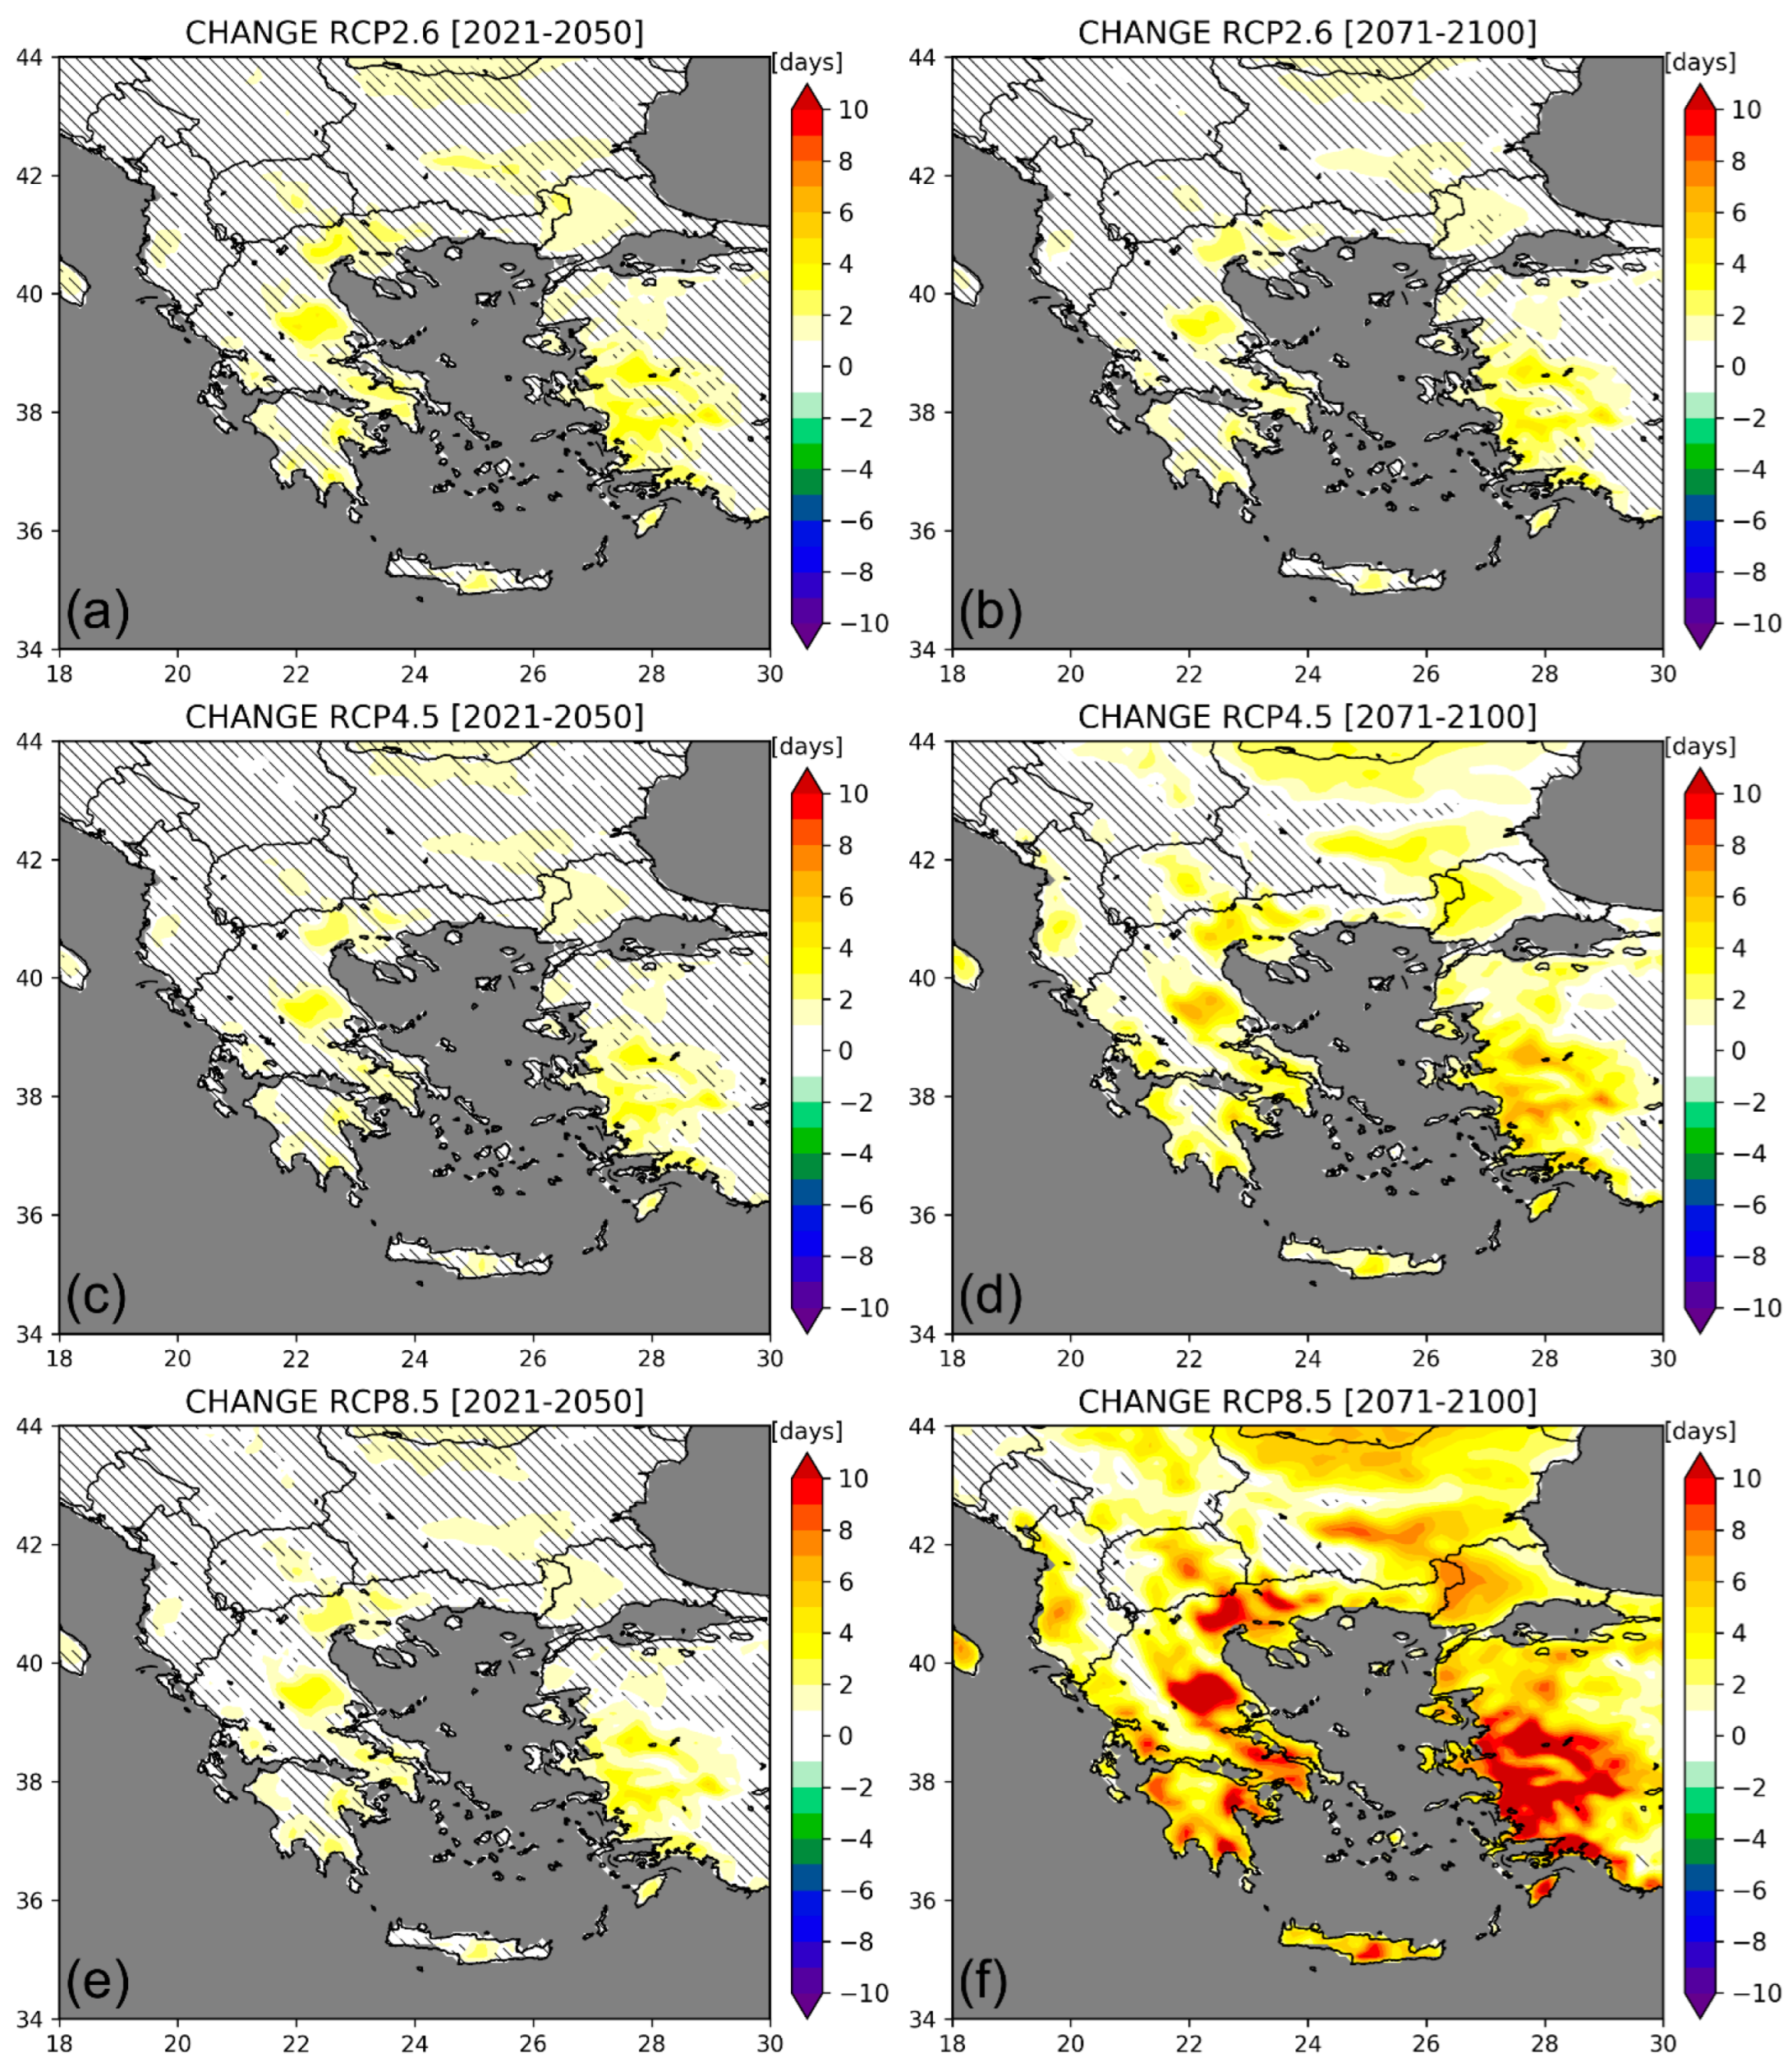
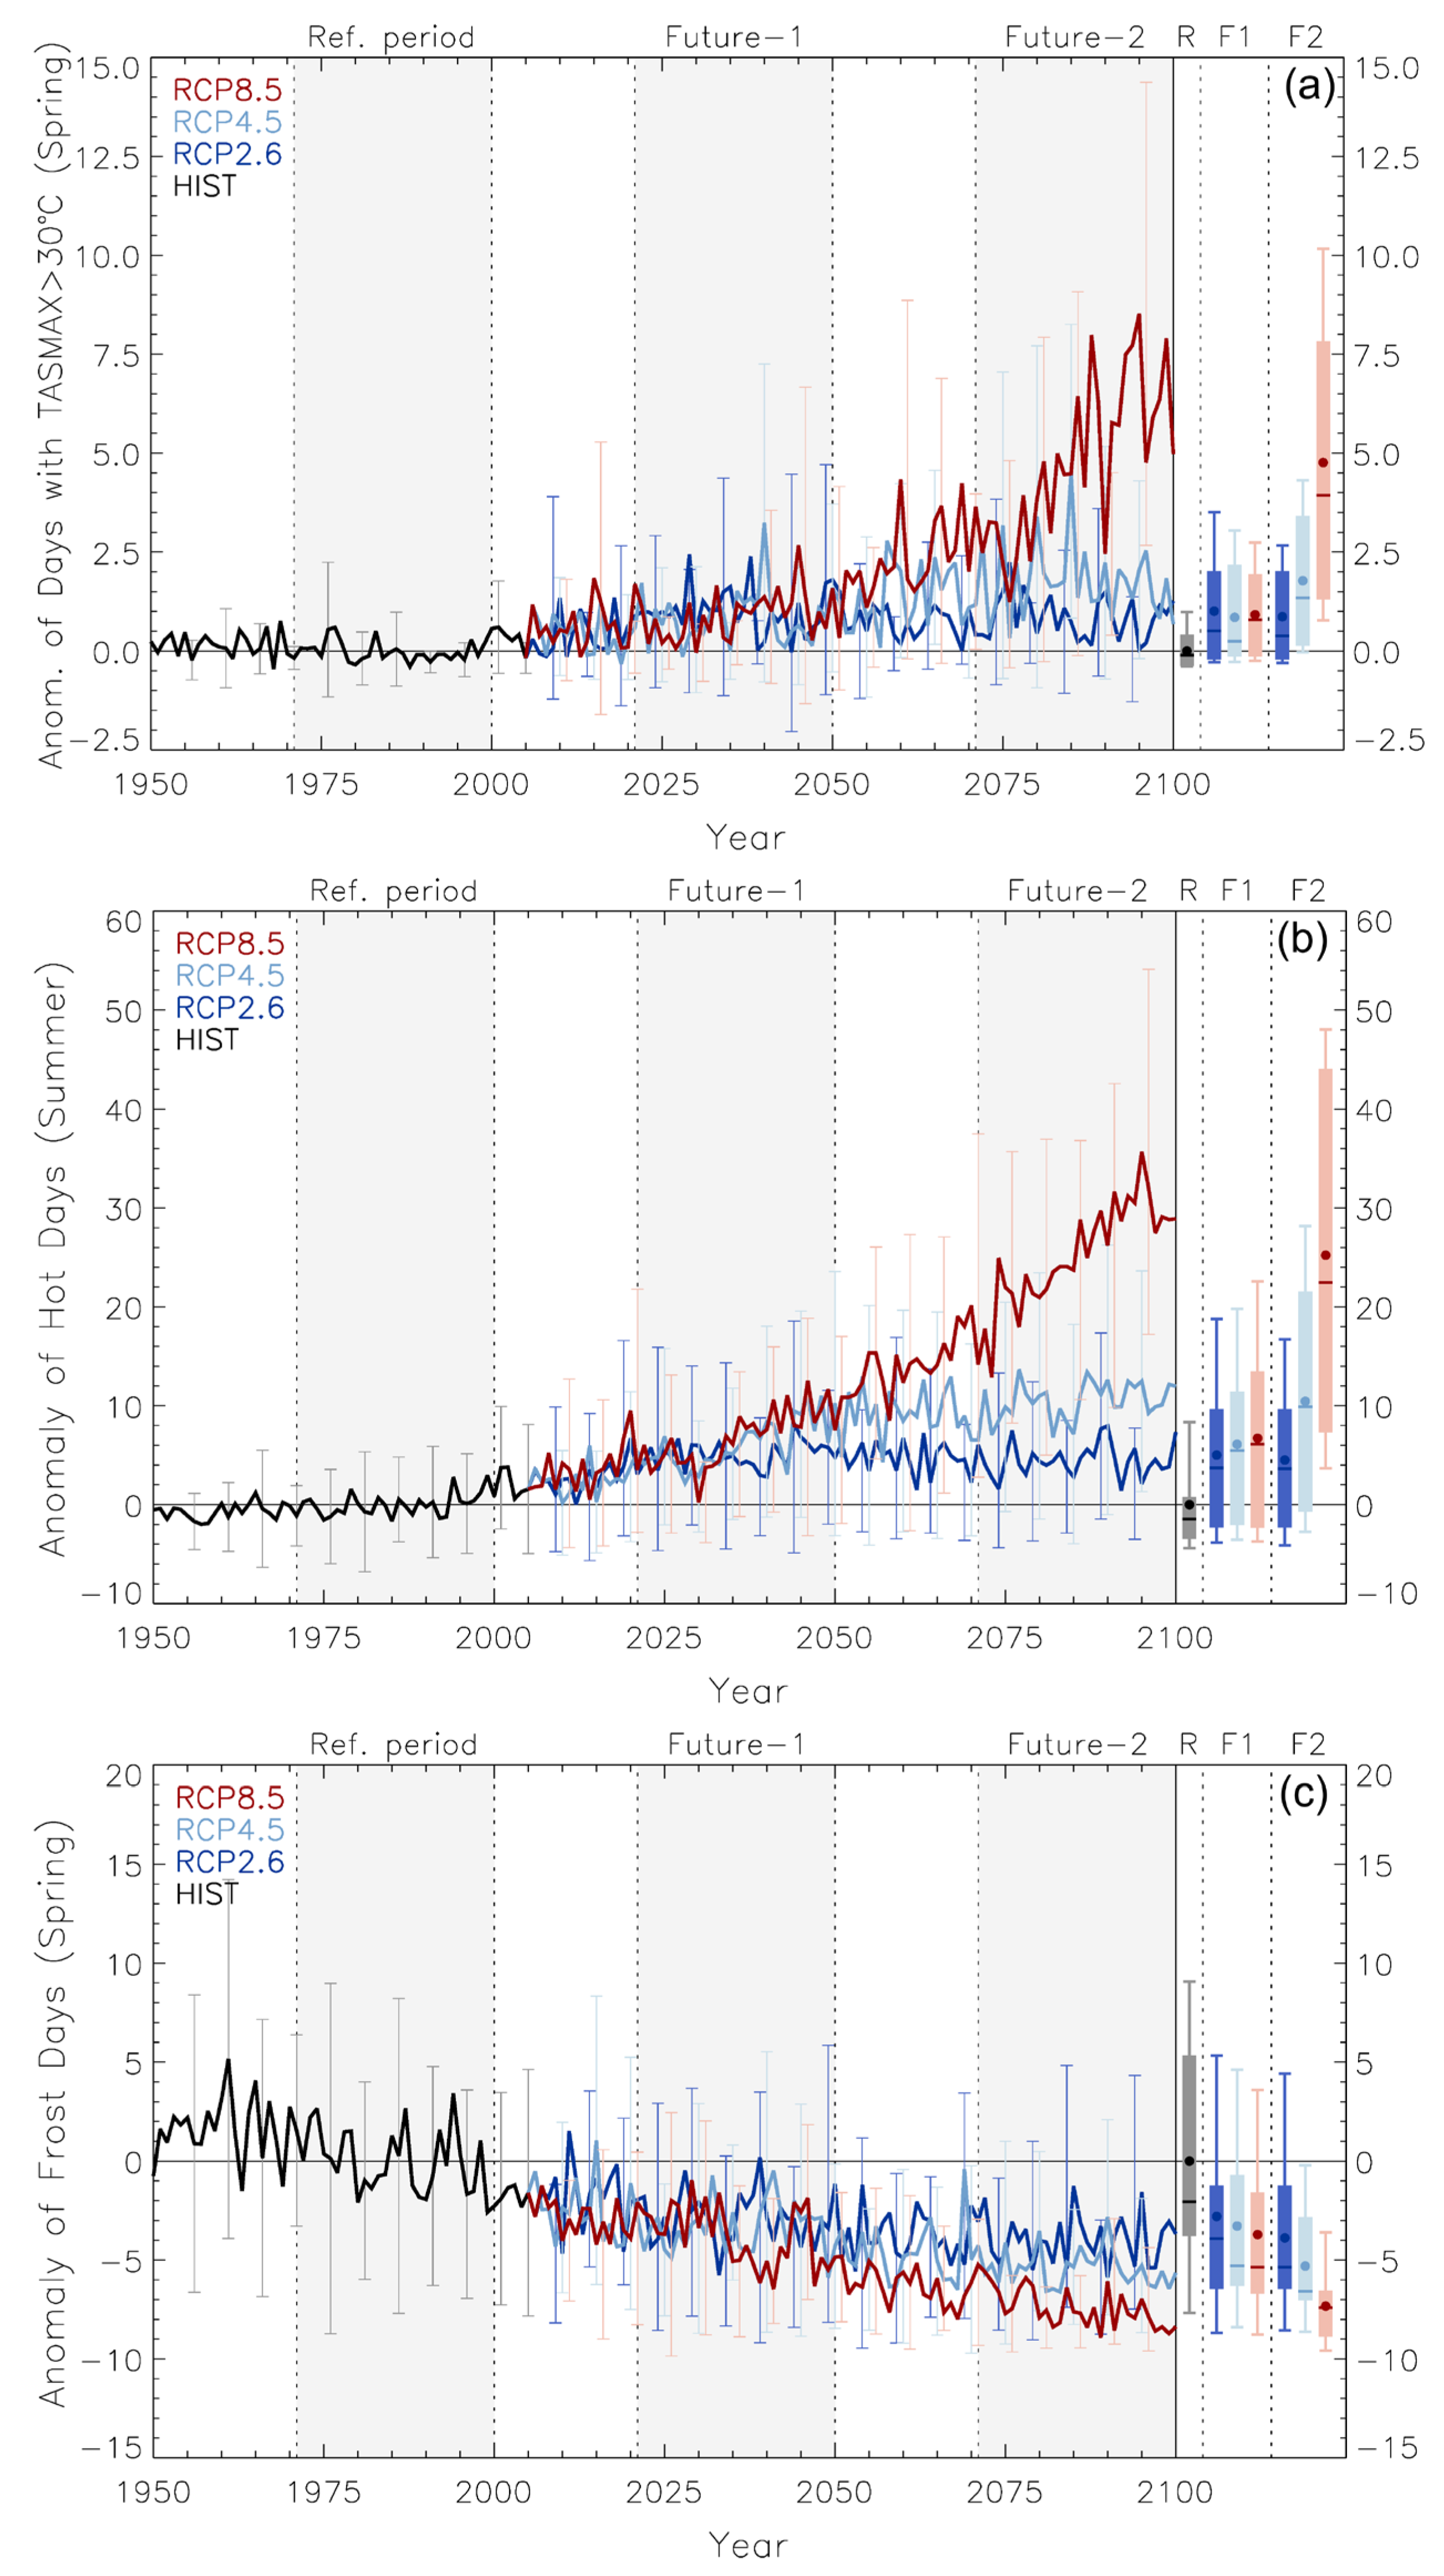
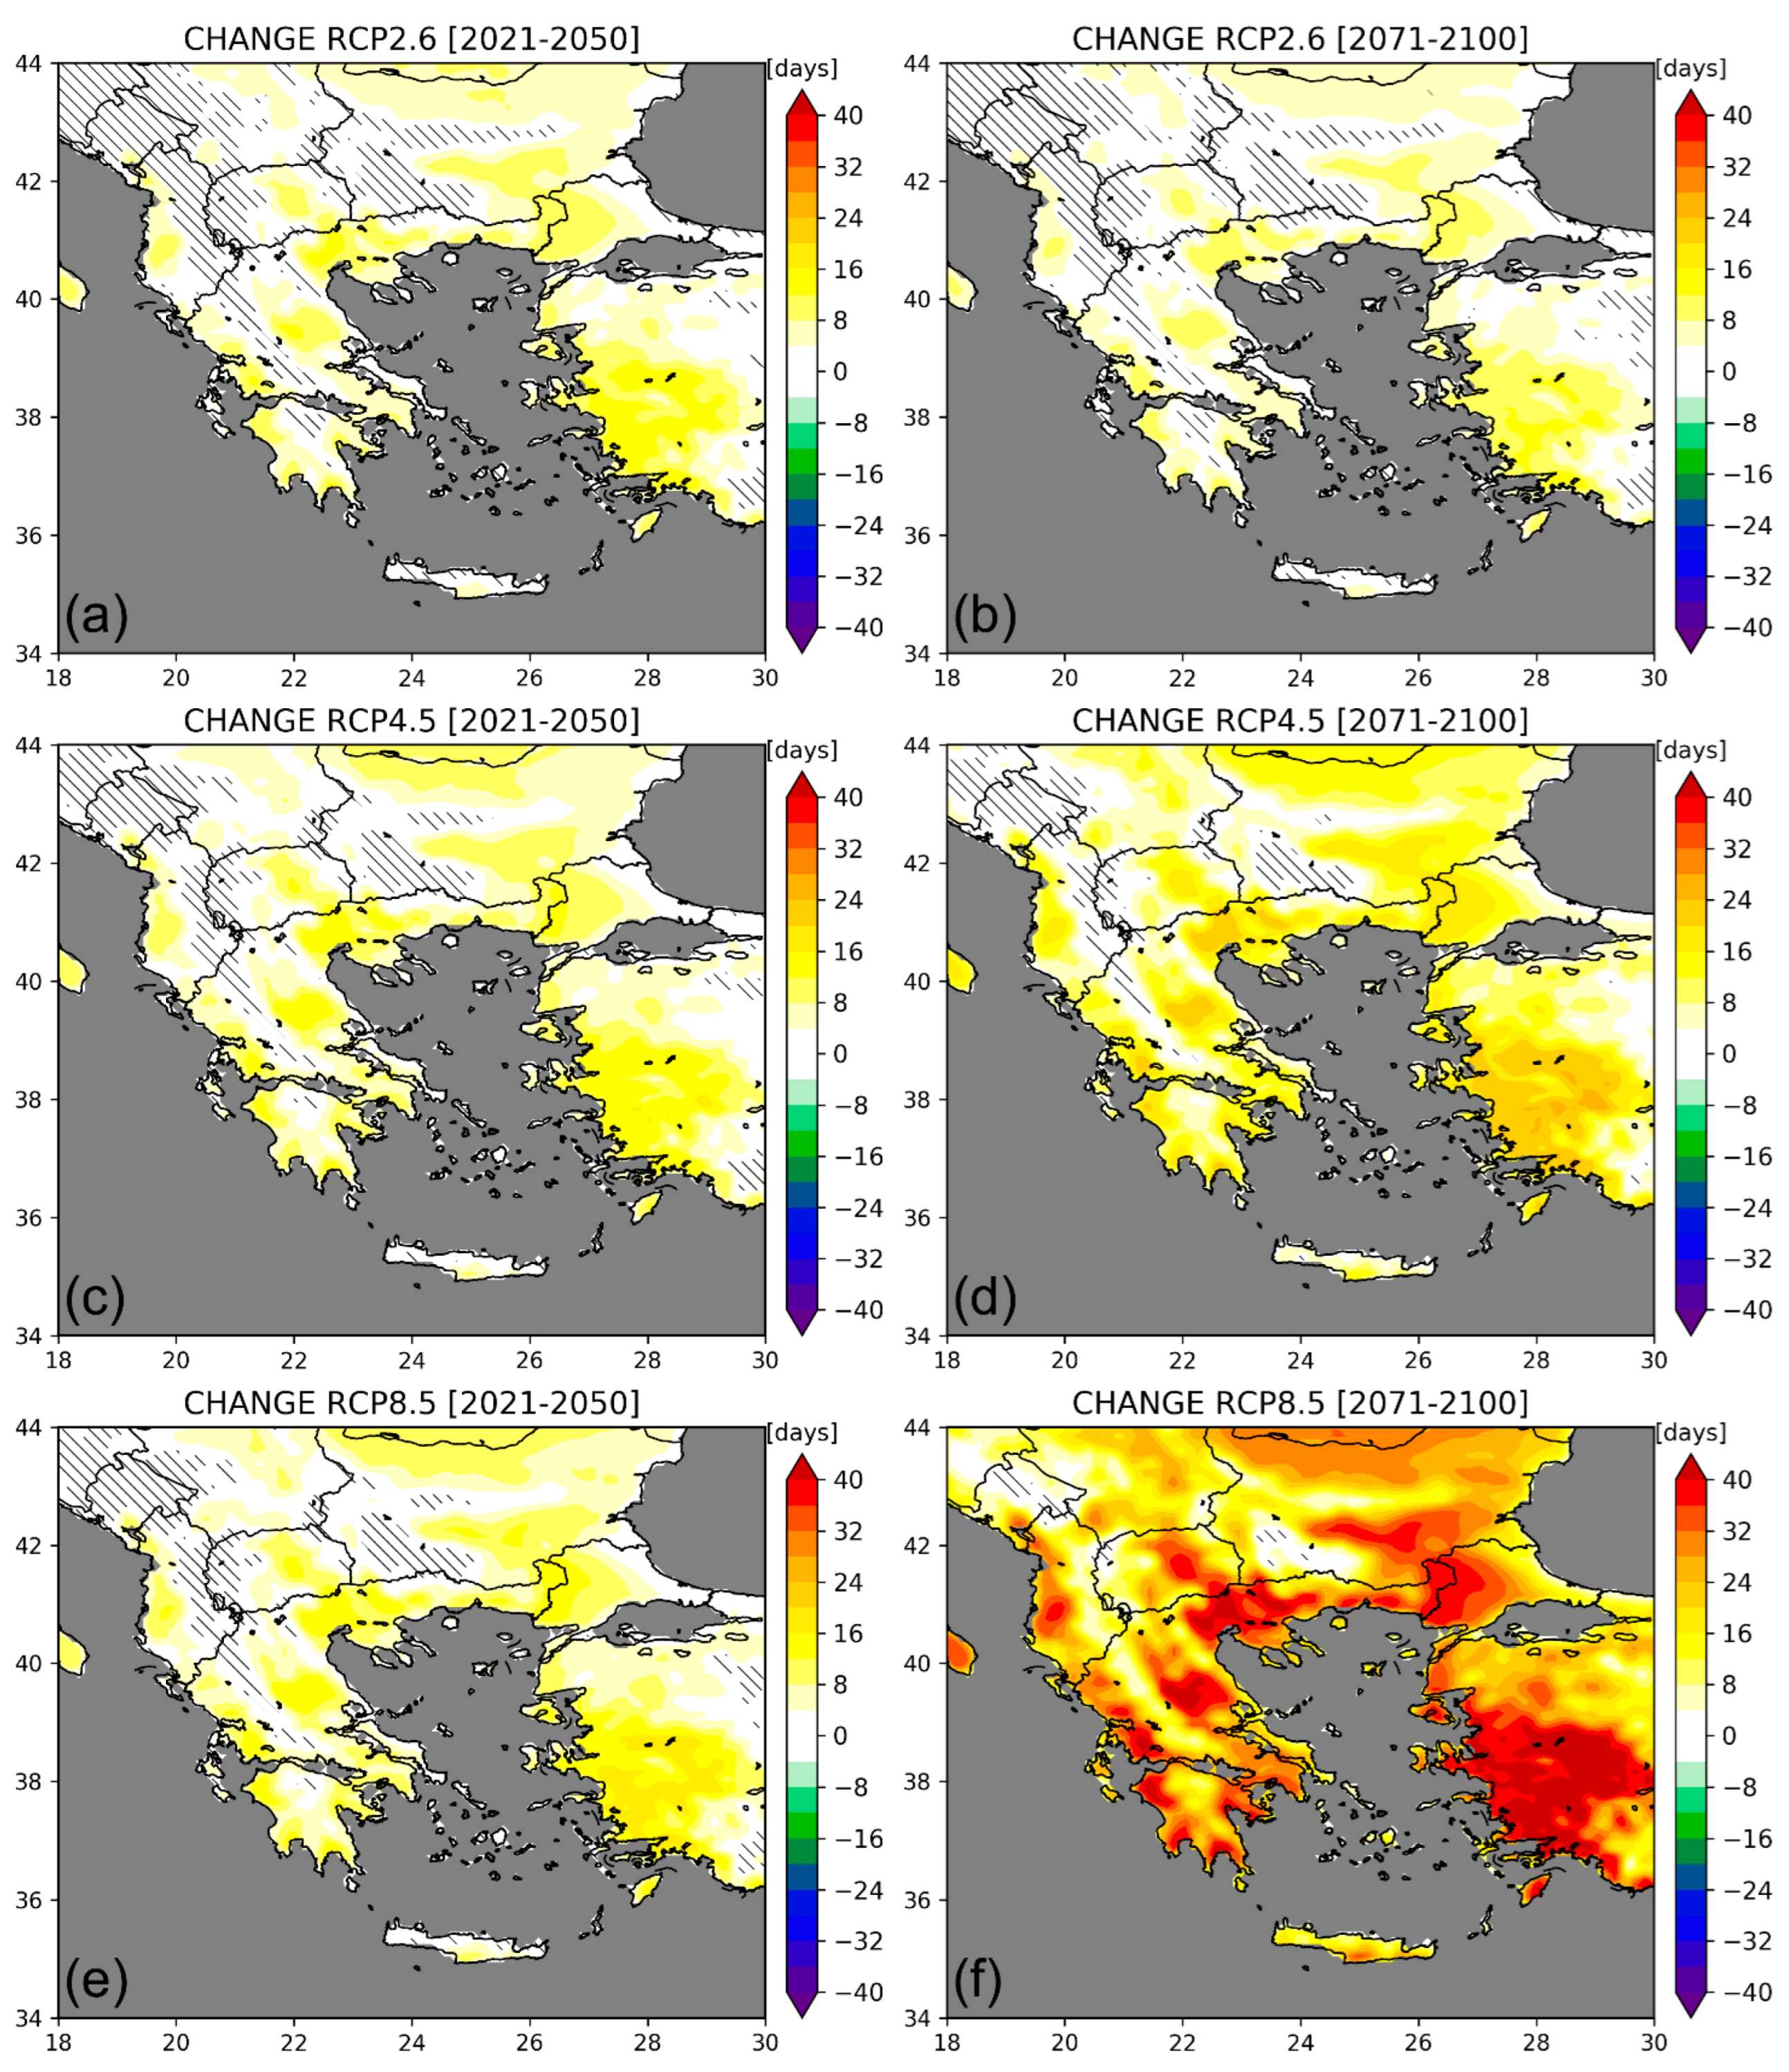
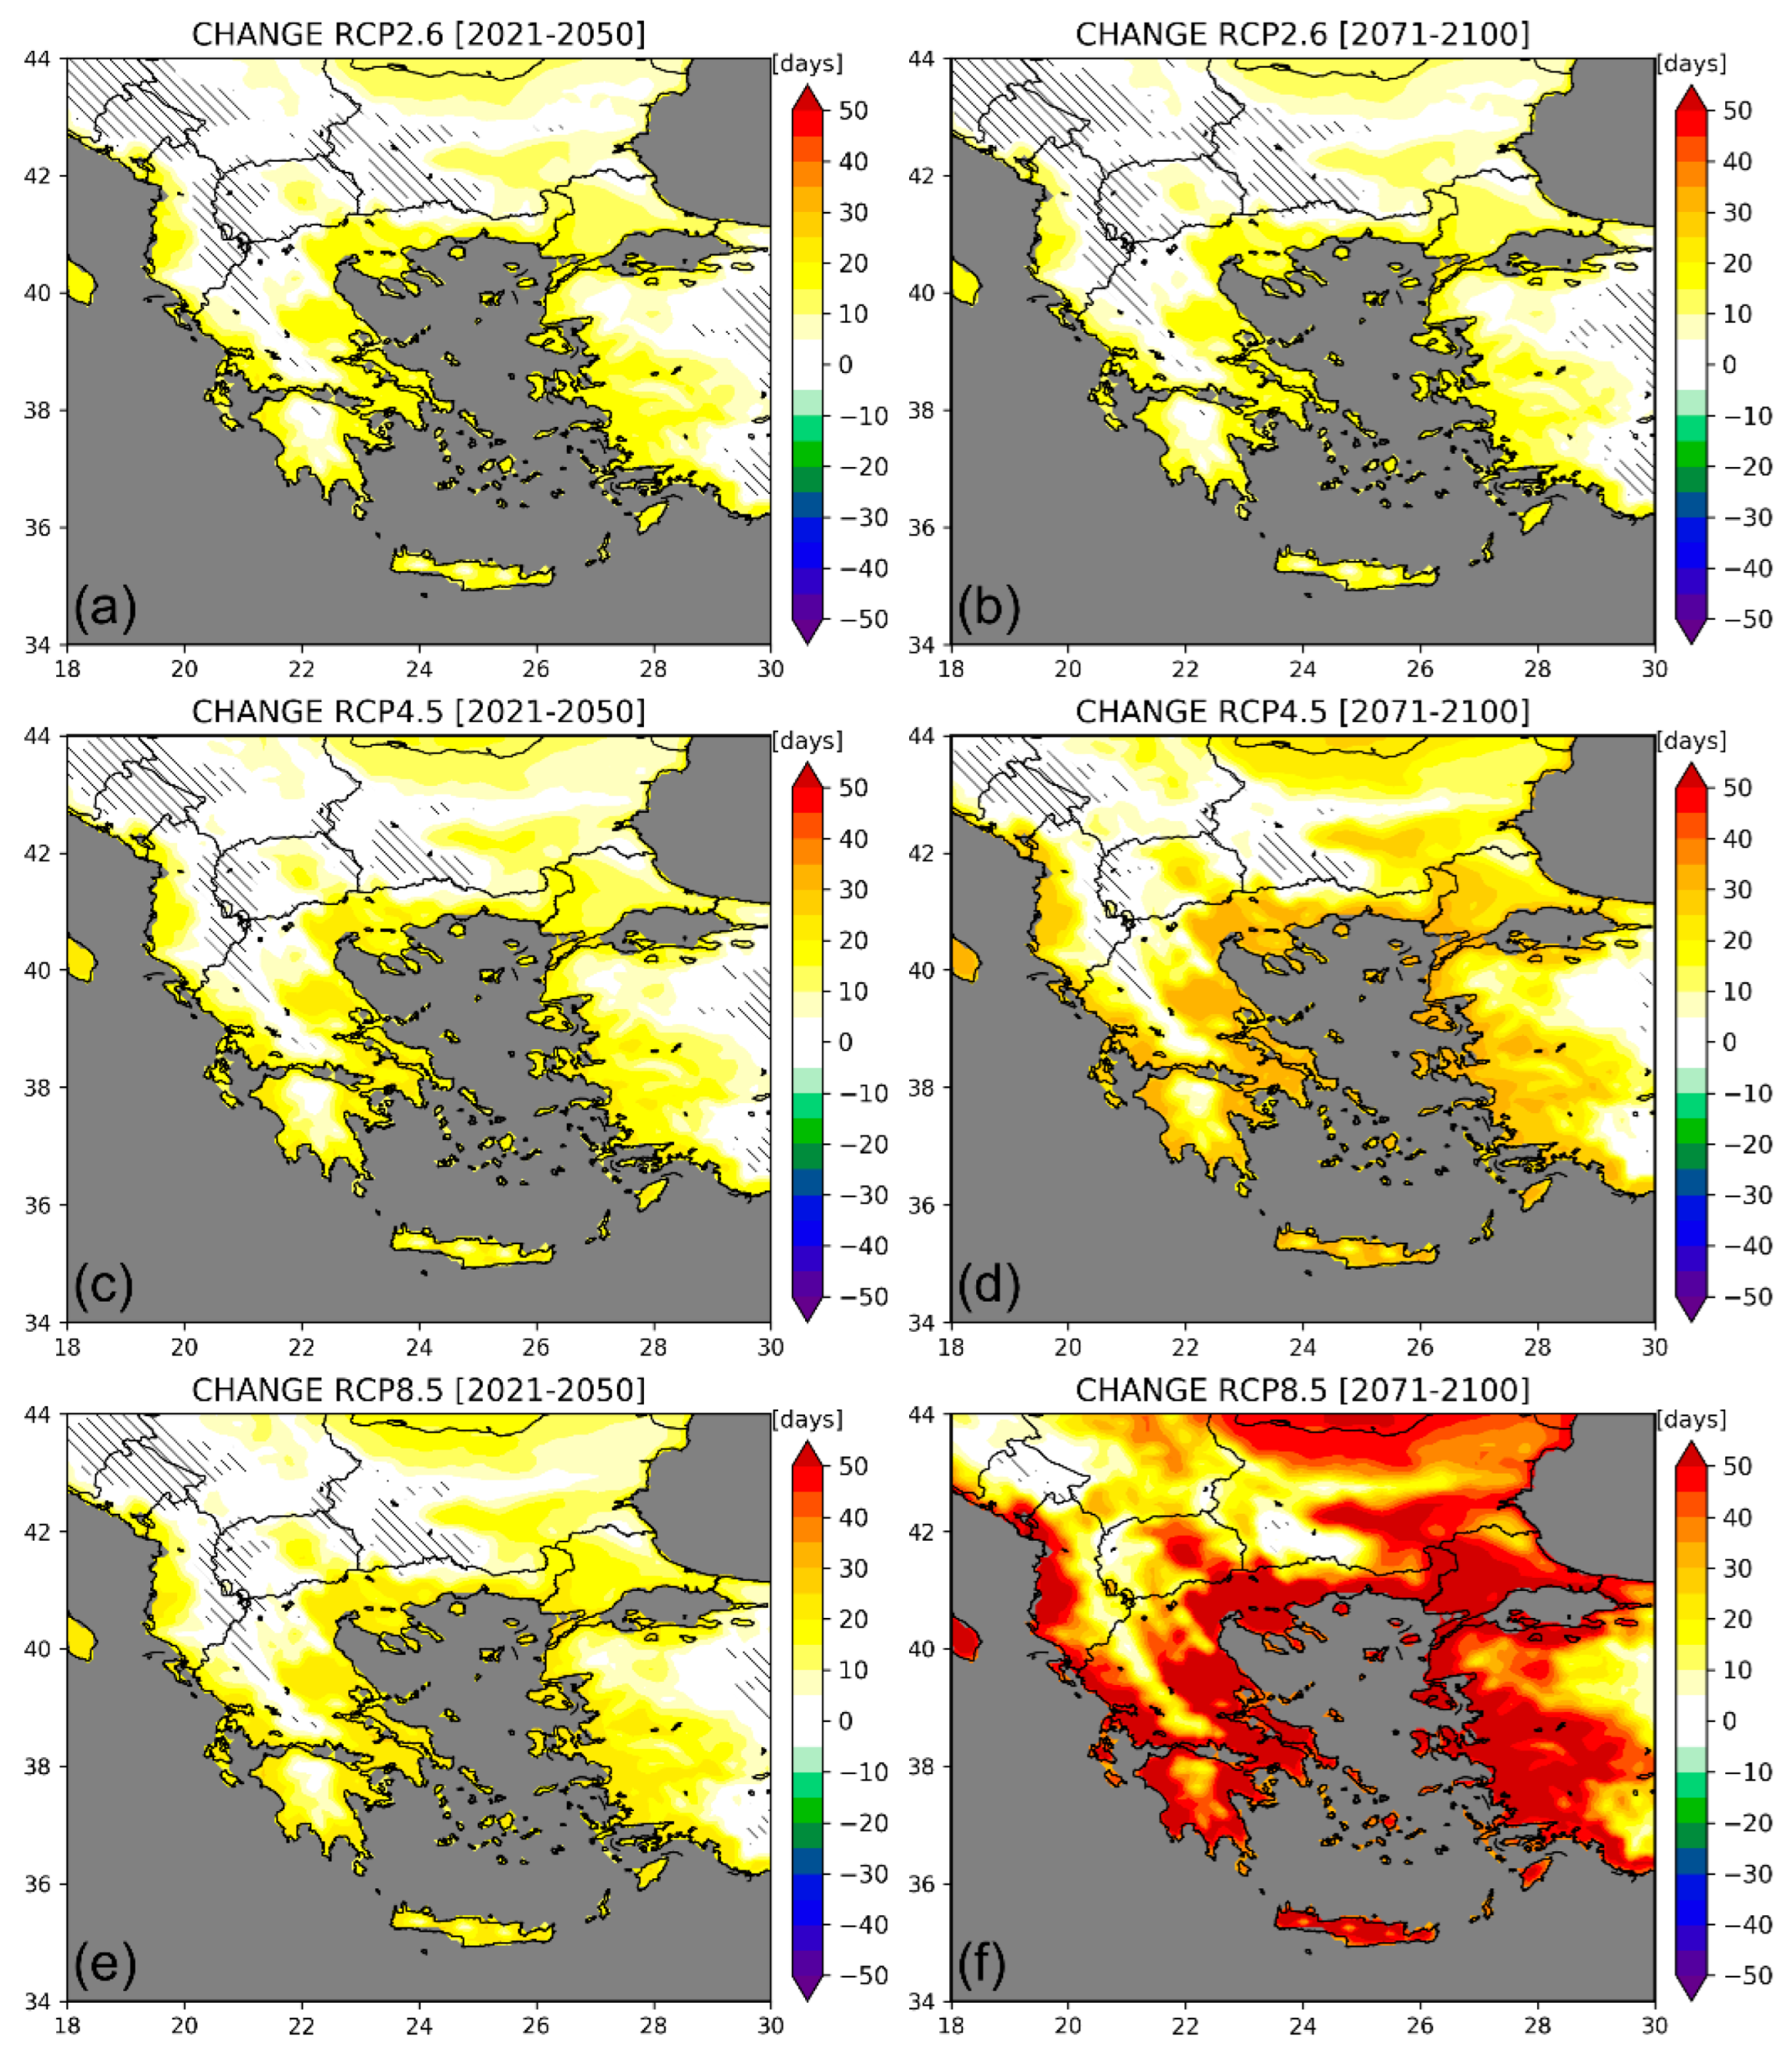
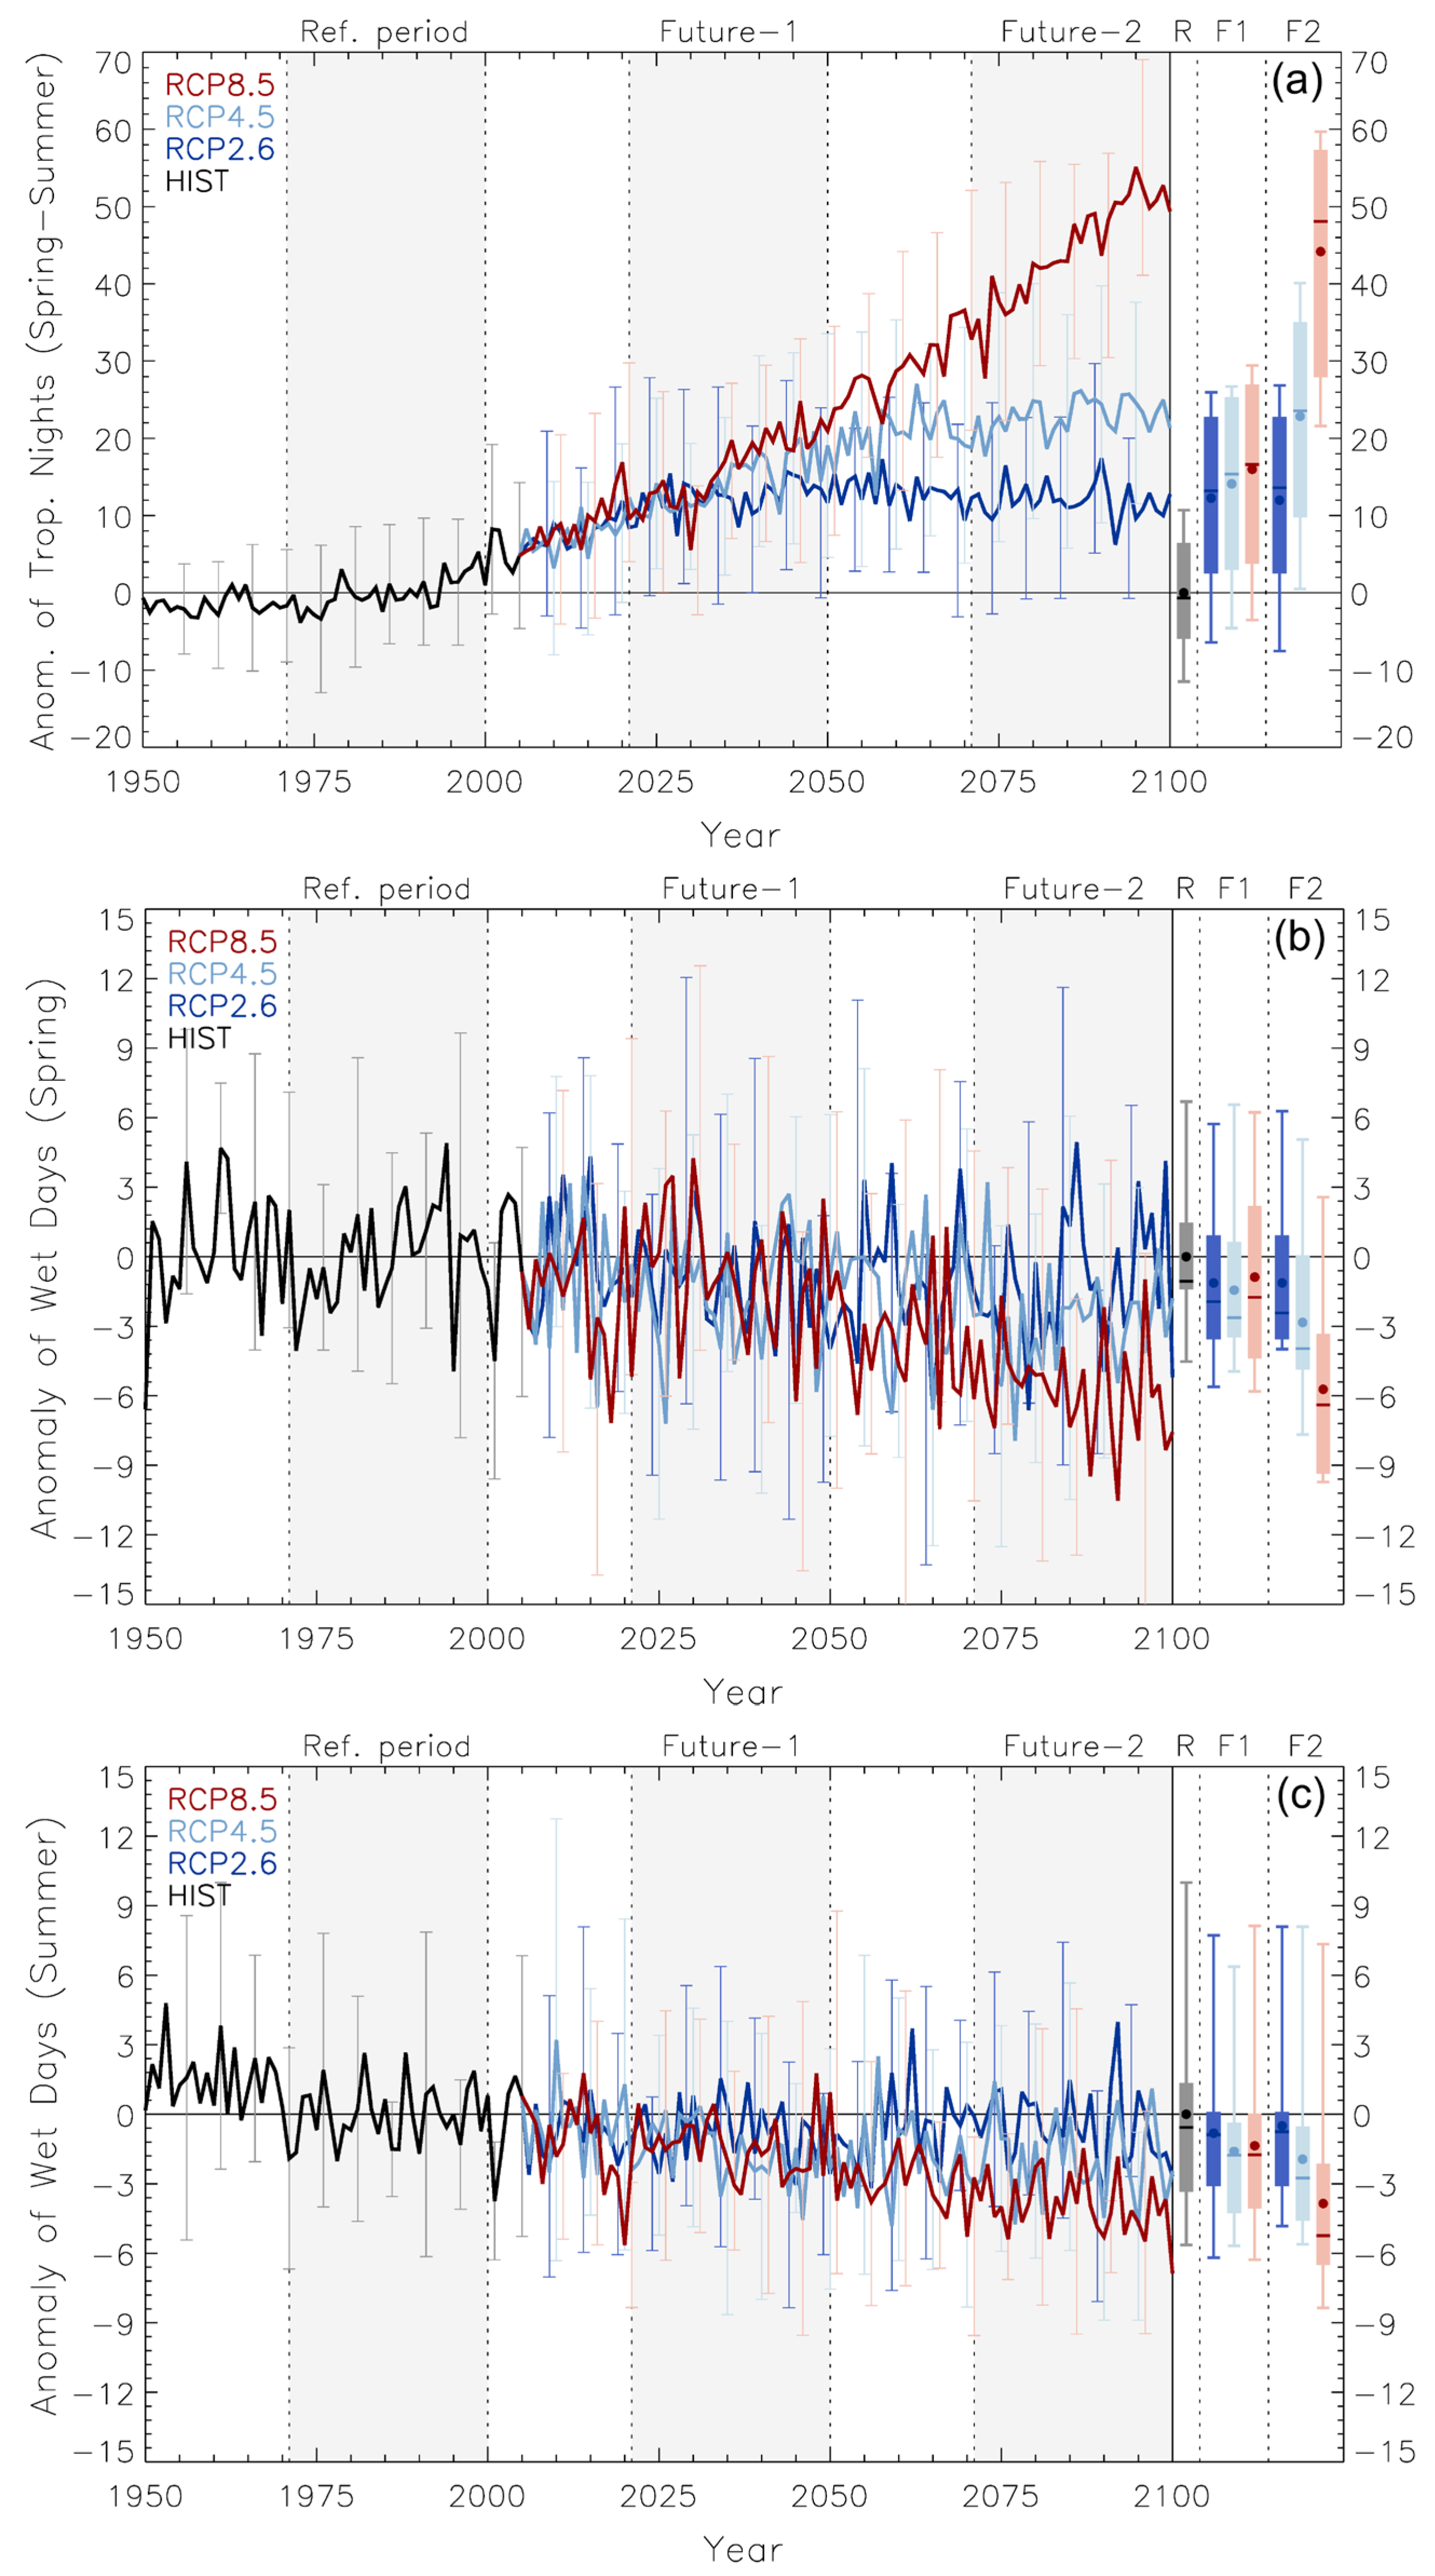
  • The projected numbers of days with a TASMAX >30 °C in Spring and tropical nights (TASMIN > 20 °C) in Spring–Summer are similar in the NF and at the EOC with an RCP2.6, displaying insignificant increases (except for the low-altitude areas in Macedonia and Thessaly) up to 4 and 25 days/yr for the former and latter index, respectively. In contrast, the corresponding projections in the frequency of hot days (TASMAX > 35 °C) in Summer exhibit significant increases (up to 16 days/yr), except for the higher altitude areas in Pindus, Macedonia, and Peloponnese. At the EOC, the areas presenting robust increases are further extended with an RCP4.5 and cover all of Greece with the no-mitigation scenario of an RCP8.5. The increased heat stress is expected to have negative seasonal impacts on the crops in Table 2. These effects, according to the timeseries projections, are projected to display steeper crop responses in the 2nd half of the 21st century with an RCP8.5, in relation to the stabilization projected for the other two emissions scenarios.
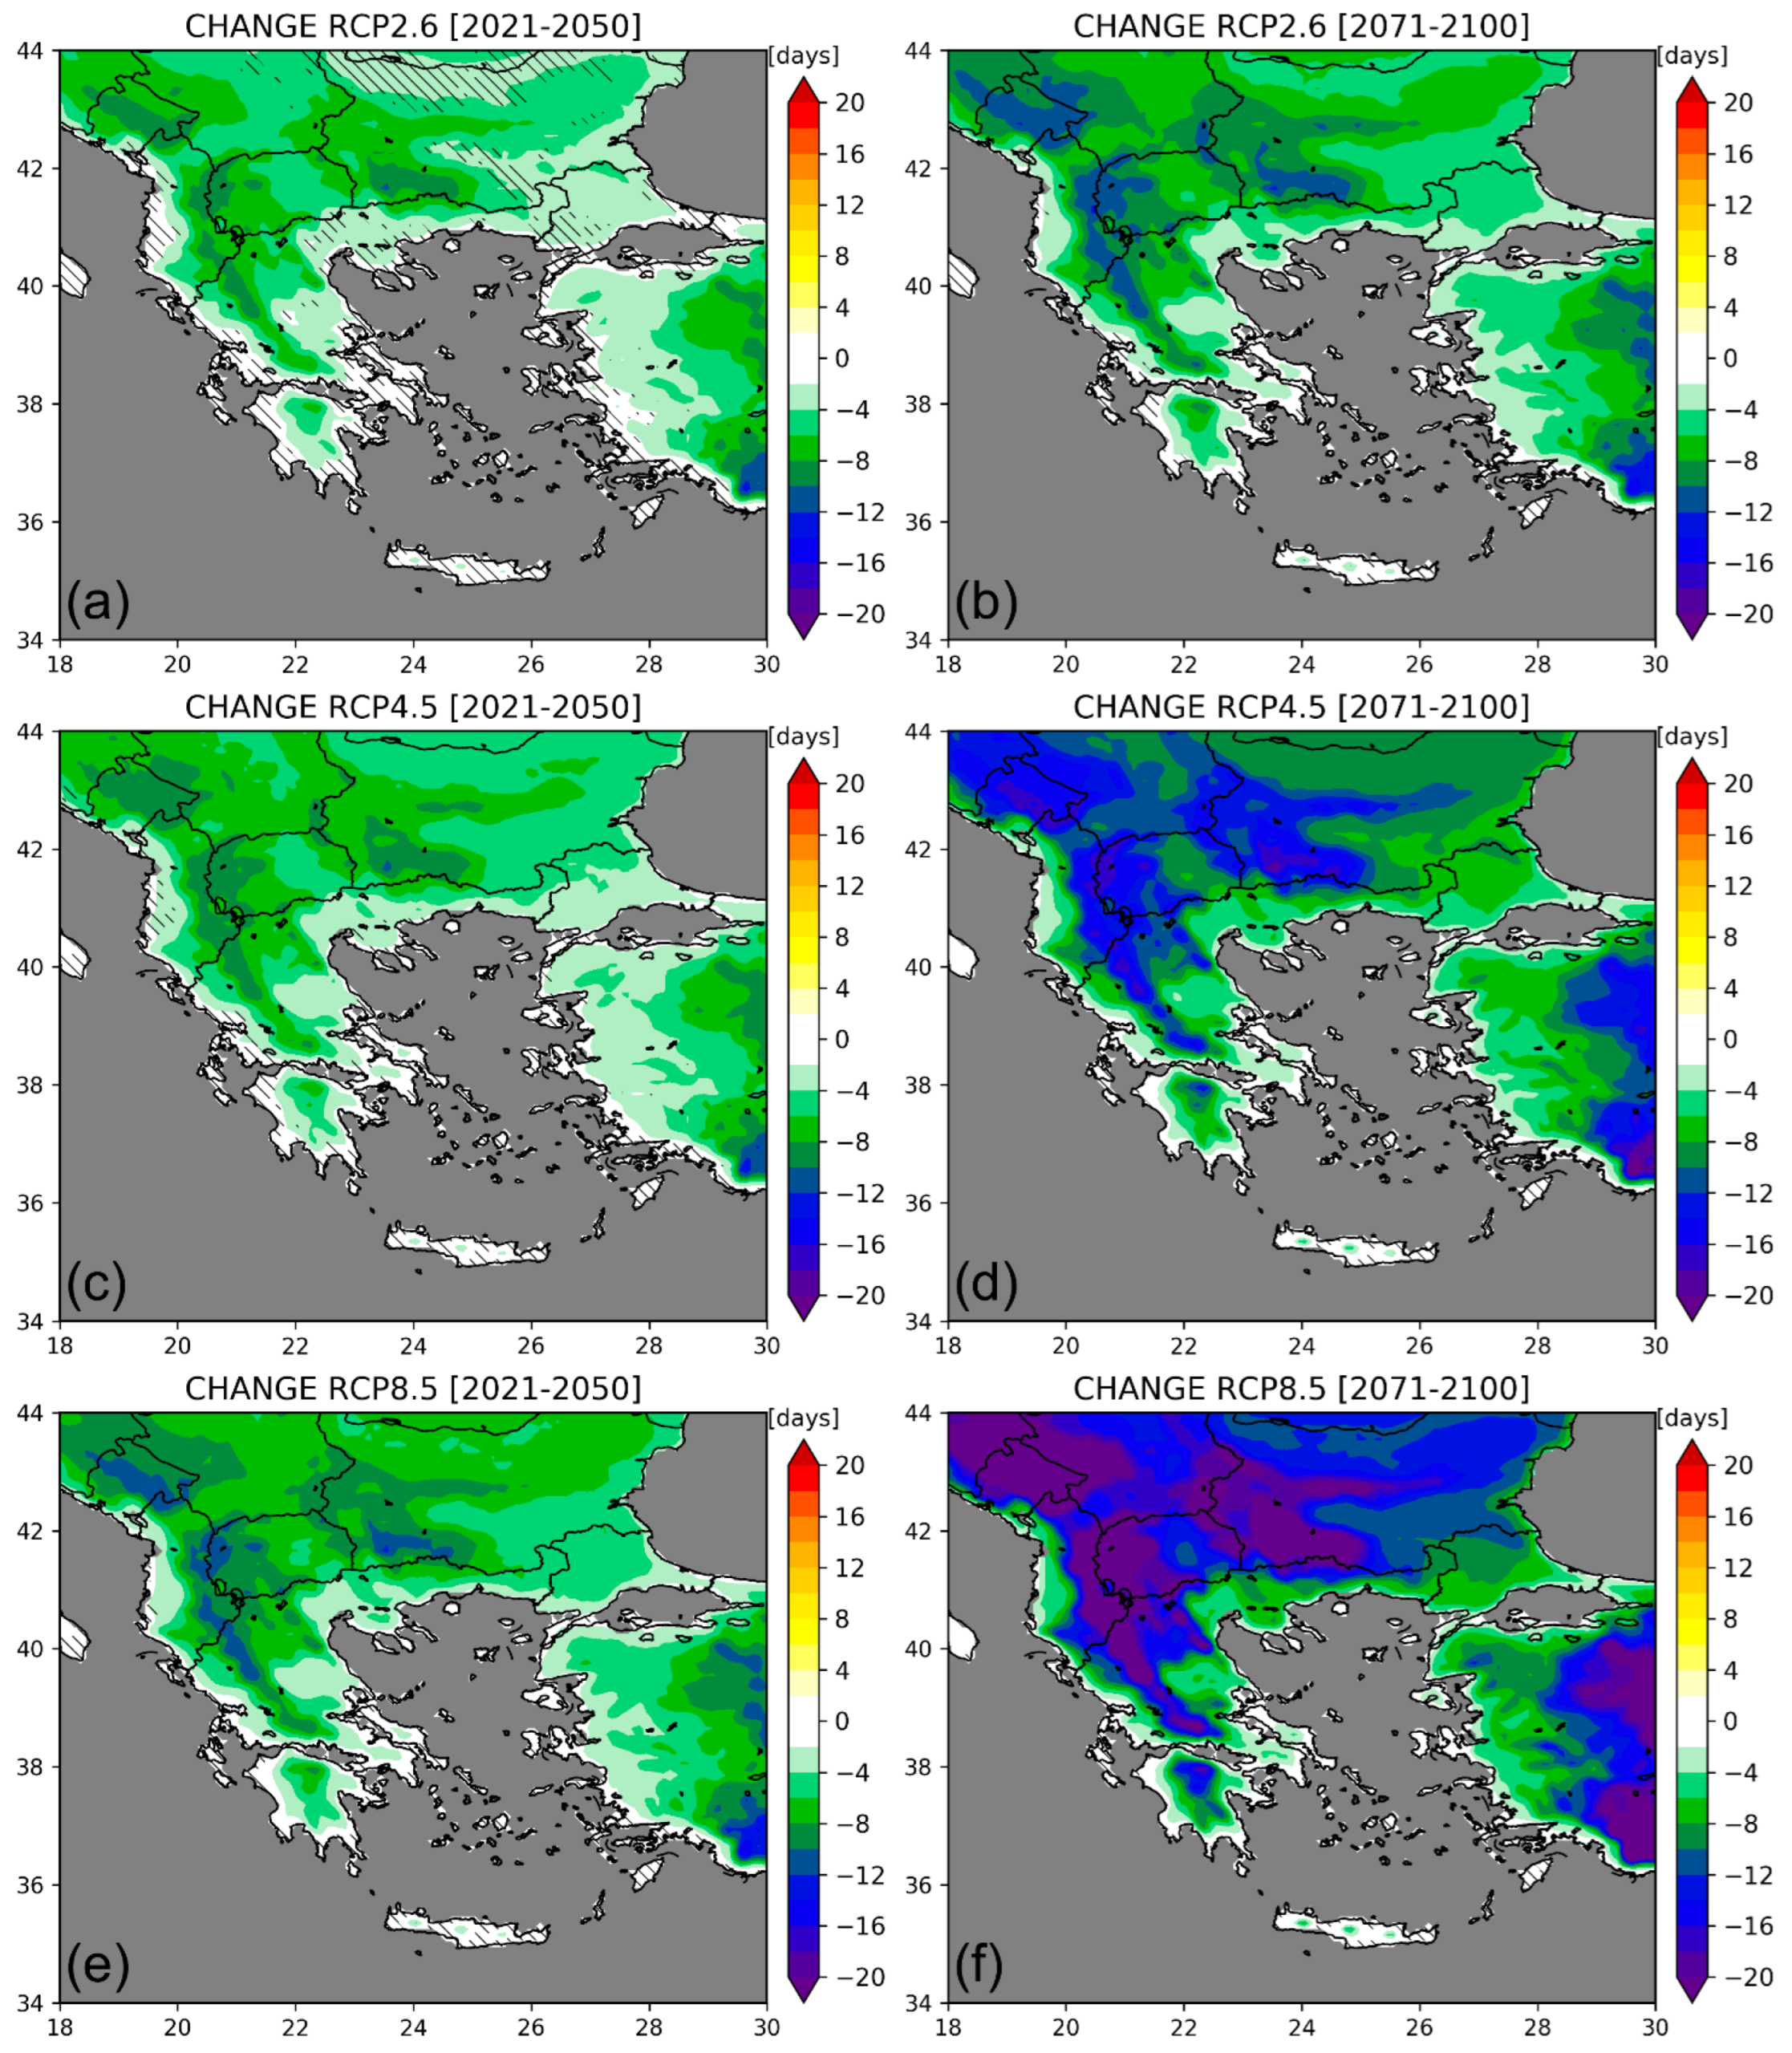
  • On the other hand, the statistically robust decreases in the number of frost days in Spring, projected for the NF and EOC periods under the three RCPs, are anticipated to favor wheat, cotton, potato, tomatoes and grapes. Steeper positive impacts are expected with an RCP8.5 in the last 50 years of the 21st century.
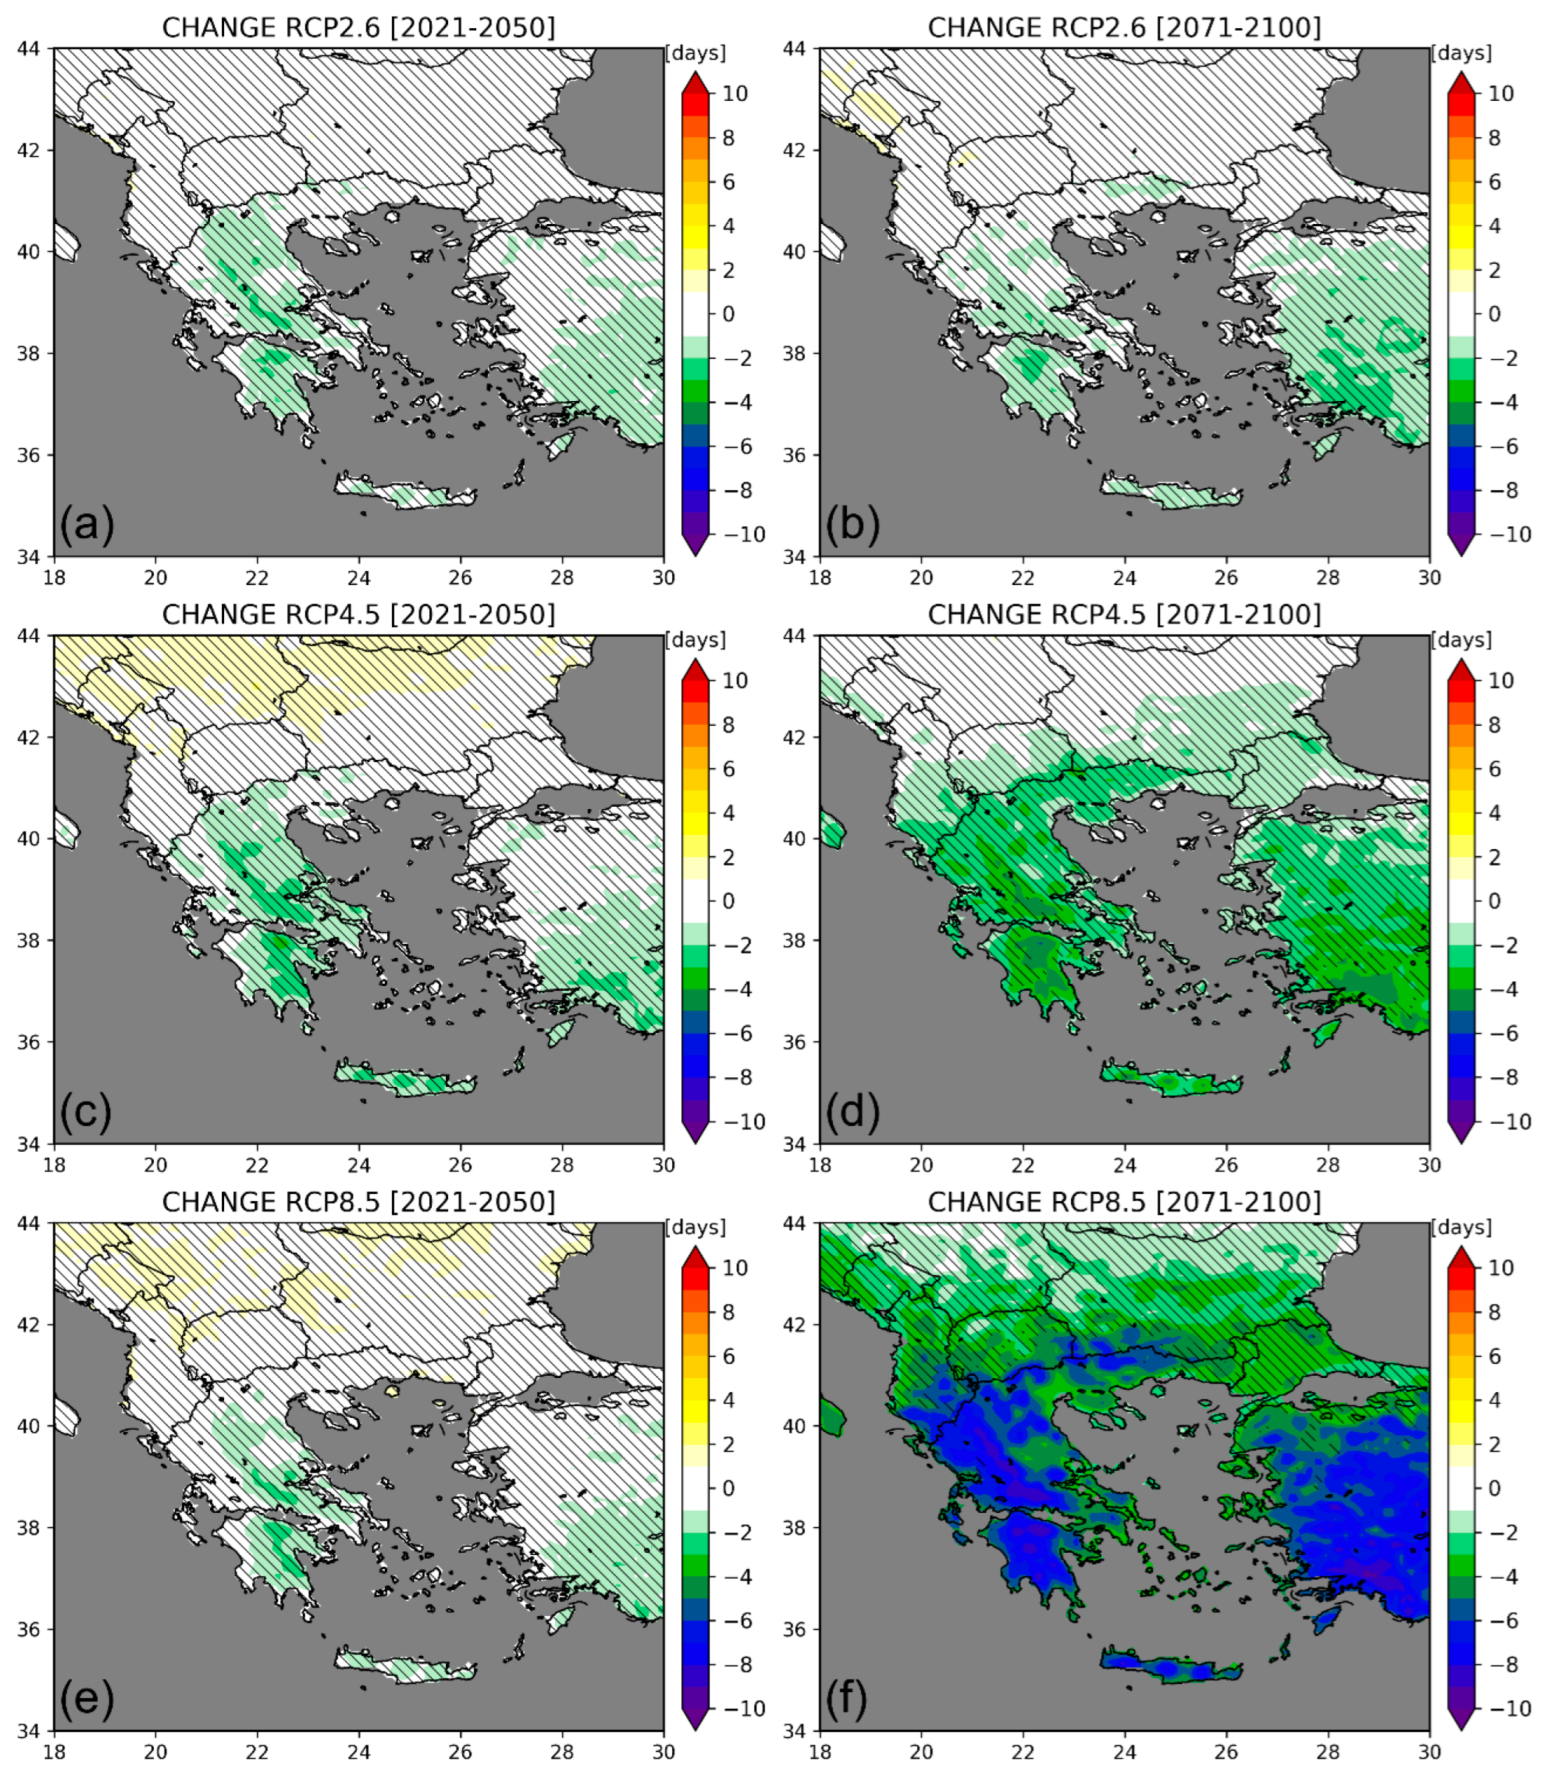
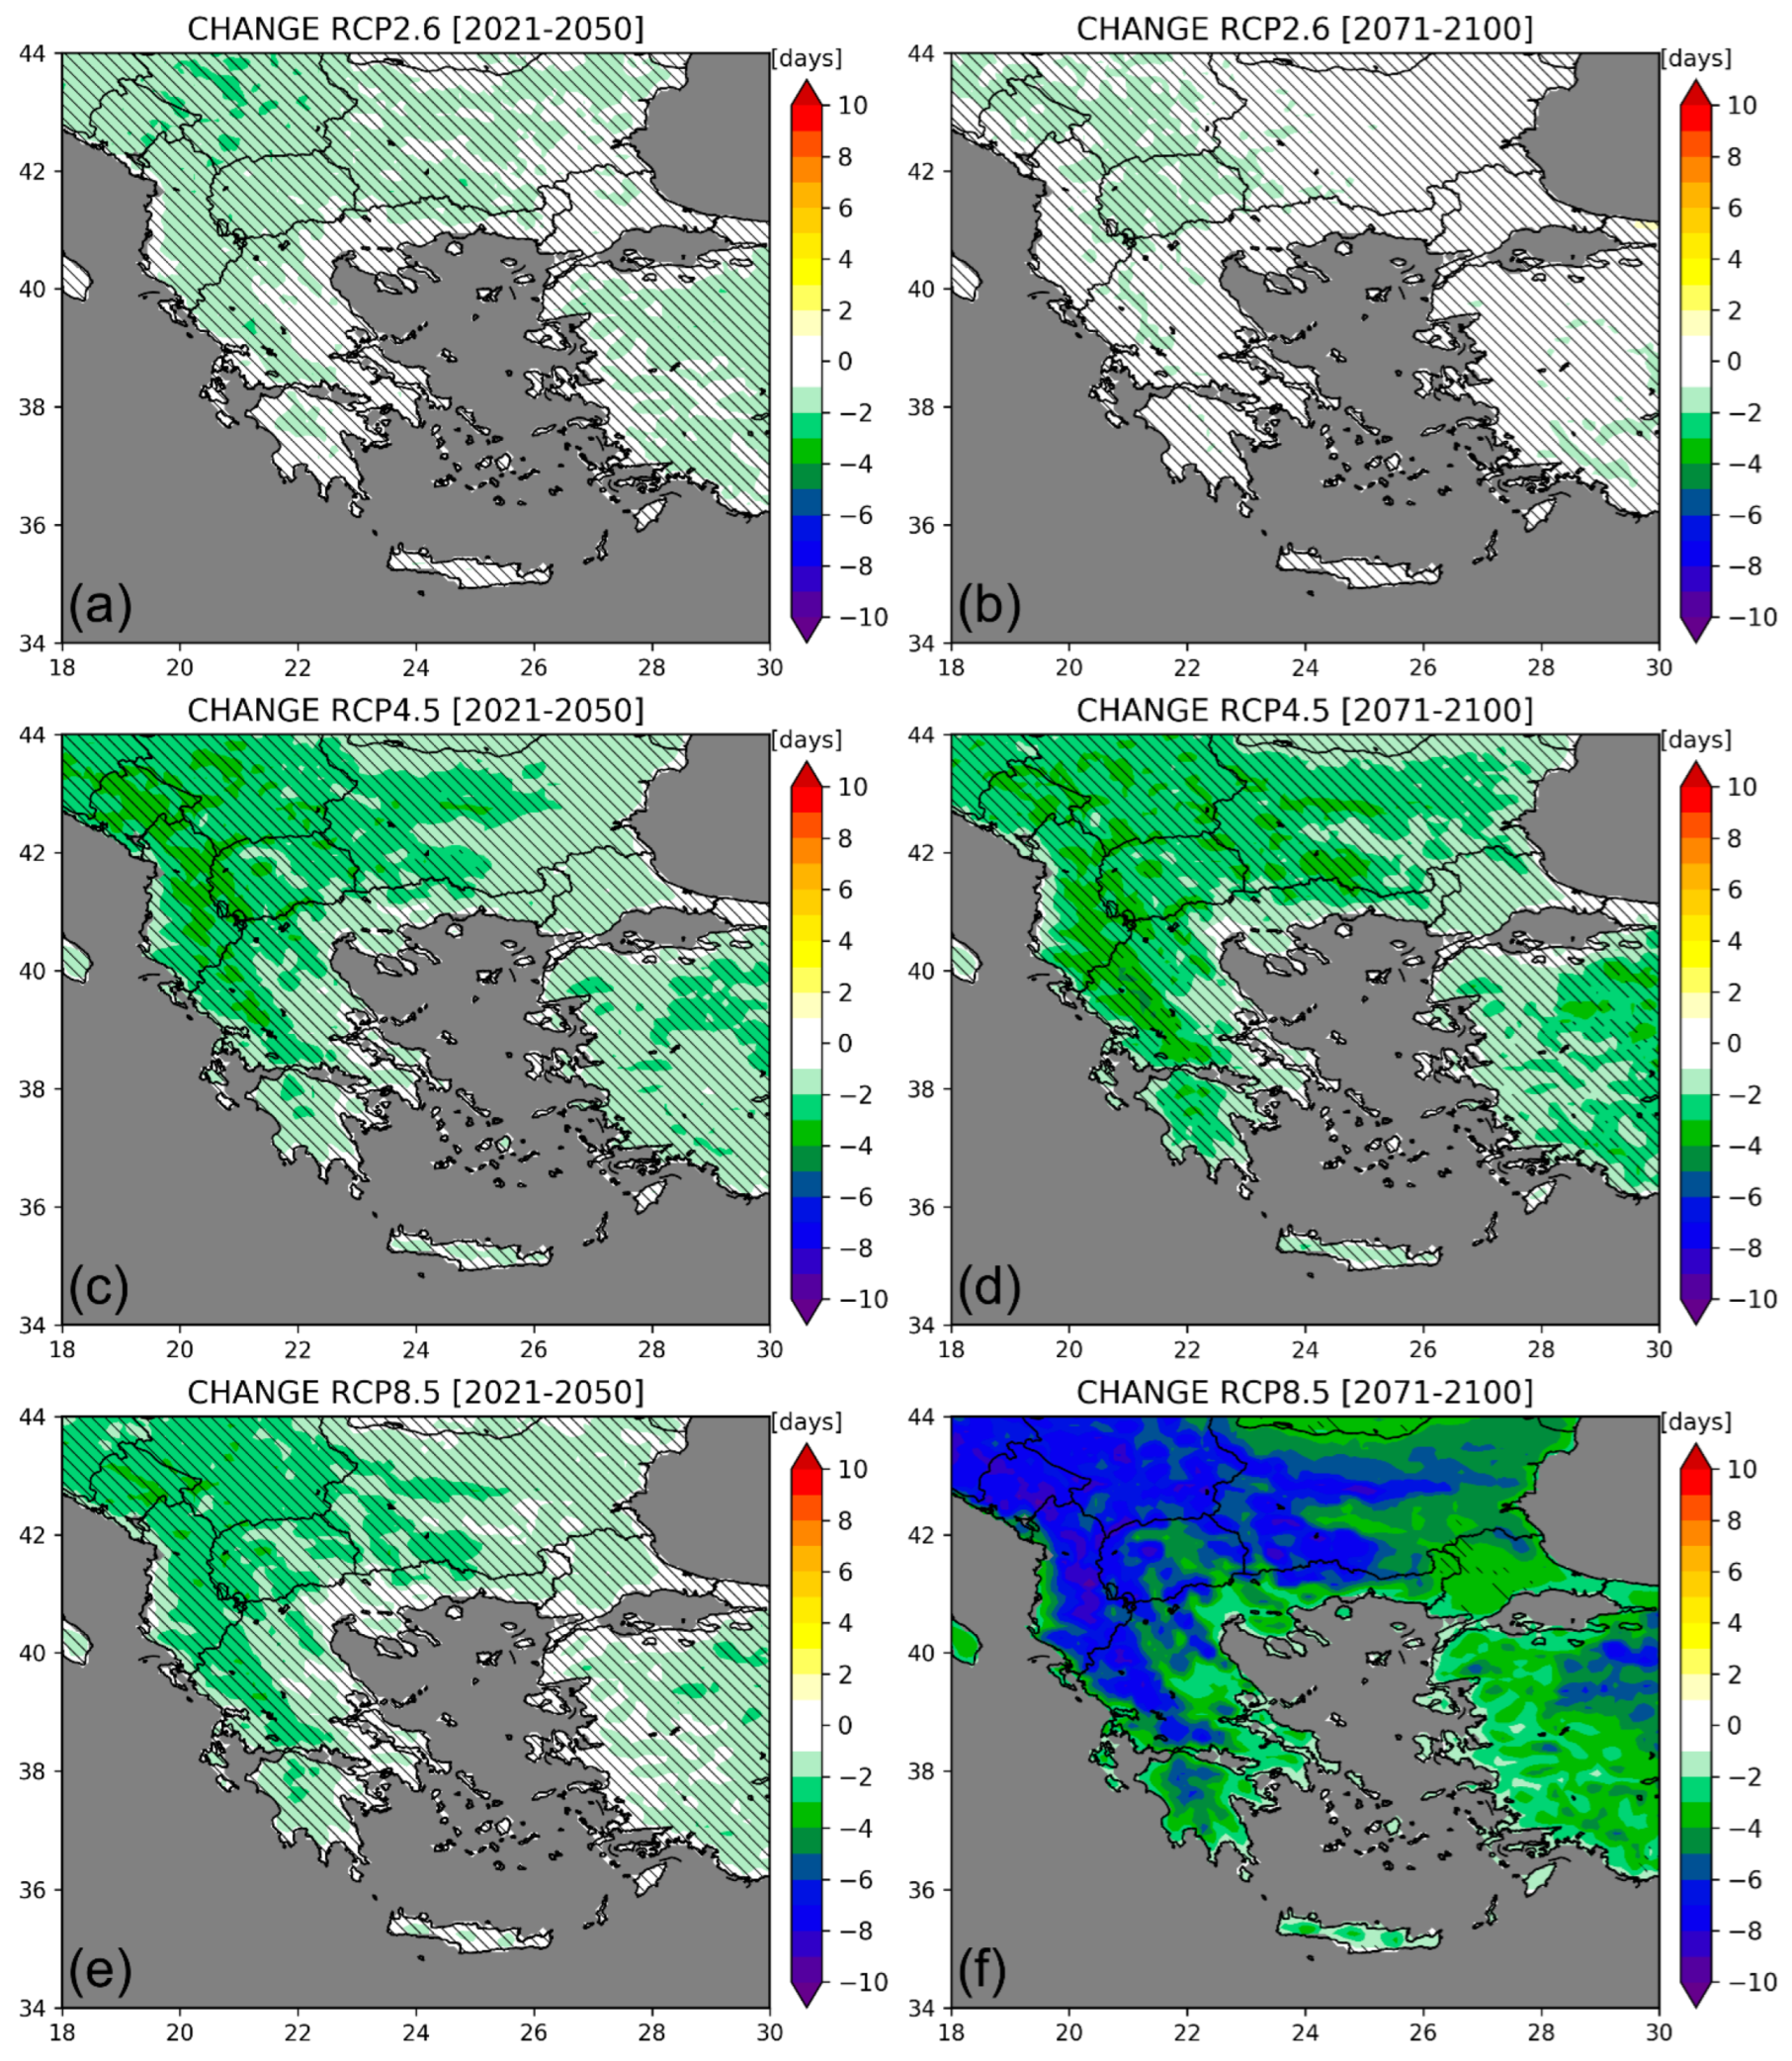
  • Insignificant decreases in the frequency of wet days are projected in Spring and Summer (up to 4–5 days/yr) in the NF, which become statistically robust (up to 8–9 days/yr) all over Greece under an RCP8.5 at the EOC. An increased water deficit will negatively affect wheat in the Spring, potato and olive in the Summer, and tomatoes and grapes in the Spring–Summer, particularly in the 2nd half of the 21st century under the RCP8.5 scenario.
In total, the outcome of the combined positive and negative effects of the abovementioned indices on crop yields is uncertain, due to the nonlinear response of crop yields to meteorological parameters [50]. The application of crop modeling could be beneficial, as it would allow for a more direct assessment of the effect of climate change on the specific crops, hence, we are working towards this direction. In the framework of the ADAPT2CLIMA project, for coping with yield reductions projected in 2031–2060 for an RCP4.5 and increases for an RCP8.5 in the majority of wheat, barley, potatoes, tomatoes, grapes, and olives in Crete, the recommended adaptation measures were mostly related to irrigation, plant health issues and cultural practices focused mainly on choosing suitable heat- and drought-resistant crop varieties [51,52]. Since adaptation measures are context-specific in both space and time [53], further research is needed in the direction of identifying and recommending appropriate adaptation strategies in the different agroecological zones in Greece. Future work will also incorporate the use of (a) more complex indices, since simple climate indices, such as the ones used in this study, might fail to represent the interactions and intended impacts and (b) developing methods to bias-adjust input variables from climate simulations [54].
Last but not least, RCM simulations have their own capabilities and limitations with model uncertainties introduced by the lateral boundary conditions from the driving GCM, the choice of the RCM model setup and physical parametrizations, and the choice of the future emissions scenario [55]. Given the complexity of the climate system, it is not surprising that there are differences in the projections of climate change between different RCMs for the same future emissions scenario. To moderate the uncertainties arising from different parametrizations and dynamical cores in different RCMs, it is, therefore, important to use climate projections from multiple climate models (as we have adopted in this study), rather than using a single climate model. The availability of more EUROCORDEX RCM simulations driven by the new generation CMIP6 GCMs and the new IPCC AR6 scenarios (shared socioeconomic pathways; SSPs) would allow for an update of our results and could potentially reduce uncertainties.

Author Contributions

Conceptualization, T.M. and P.Z.; methodology, T.M. and P.Z.; software, A.K.G. and D.A.; validation, A.K.G. and D.A.; formal analysis, A.K.G. and D.A.; investigation, A.K.G.; D.A. and T.M.; data curation, A.K.G. and D.A.; writing—original draft preparation, T.M.; writing—review and editing, T.M.; A.K.G.; D.A.; D.M. and P.Z.; visualization, A.K.G. and D.A.; project administration, D.M. and P.Z. All authors have read and agreed to the published version of the manuscript.

Funding

This research received funding from the action titled “National Network on Climate Change and its Impacts—CLIMPACT” (grant no. 2018SE01300001) which is implemented under sub-project 3 of the project “Infrastructure of national research networks in the fields of Precision Medicine, Quantum Technology and Climate Change”, funded by the Public Investment Program of Greece, General Secretary of Research and Technology/Ministry of Development and Investments.

Institutional Review Board Statement

Not applicable.

Informed Consent Statement

Not applicable.

Data Availability Statement

The EURO-CORDEX simulations used for the analysis are publicly available via https://esgf-data.dkrz.de/search/cordex-dkrz/, accessed on 16 December 2022.

Acknowledgments

We acknowledge the World Climate Research Program’s Working Group on Regional Climate, and the Working Group on Coupled Modelling, the former coordinating body of CORDEX and the panel responsible for CMIP5. We also thank the climate modelling groups (listed in Table 1) for producing and making available their model output. We also acknowledge the Earth System Grid Federation infrastructure, an international effort led by the U.S. Department of Energy’s Program for Climate Model Diagnosis and Intercomparison, the European Network for Earth System Modelling and other partners in the Global Organization for Earth System Science Portals (GO-ESSP).

Conflicts of Interest

The authors declare no conflict of interest.

References

  1. Ministry of Foreign Affairs in Greece. Available online: https://www.mfa.gr/missionsabroad/en/about-greece/food-and-gastronomy/facts-and-figures.html (accessed on 23 September 2022).
  2. Eurostat. Provisional Results for the 2016 EU Farm Structure Survey, Press Release. Available online: https://ec.europa.eu/eurostat/documents/2995521/9028470/5-28062018-AP-EN.pdf/8d97f49b-81c0-4f87-bdde-03fe8c3b8ec2 (accessed on 30 November 2022).
  3. McArthur, J.W. Agriculture in the COP21 Agenda. In COP21 at Paris: What to Expect; The issues, the actors, and the road ahead on climate change; Global Economy and Development, Brookings Institution: Washington, DC, USA, 2016; pp. 37–42. [Google Scholar]
  4. Prăvălie, R.; Sîrodoev, I.; Patriche, C.; Roșca, B.; Piticar, A.; Bandoc, G.; Sfîcă, L.; Tişcovschi, A.; Dumitraşcu, M.; Chifiriuc, C.; et al. The impact of climate change on agricultural productivity in Romania. A country-scale assessment based on the relationship between climatic water balance and maize yields in recent decades. Agric. Syst. 2020, 179, 102767. [Google Scholar] [CrossRef]
  5. Elahi, E.; Khalid, Z.; Tauni, M.Z.; Zhang, H.; Lirong, X. Extreme weather events risk to crop-production and the adaptation of innovative management strategies to mitigate the risk: A retrospective survey of rural Punjab, Pakistan. Technovtion 2022, 117, 102255. [Google Scholar] [CrossRef]
  6. EEA. Climate change adaptation in the agriculture sector in Europe. Eur. Environ. Agency 2019, 4. [Google Scholar] [CrossRef]
  7. Nelson, G.C.; Rosegrant, M.W.; Jawoo Koo, J.; Sulser, R.T.; Zhu, T.; Ringler, C.; Msangi, S.; Palazzo, A.; Batka, M.; Magalhaes, M.; et al. Climate Change Impact on Agriculture and Costs of Adaptation. Intl. Food Policy Res. Inst. 2009, 21. [Google Scholar] [CrossRef]
  8. Eitzinger, J.; Thaler, S.; Orlandini, S.; Nejedlik, P.; Kazandjiev, V.; Sivertsen, T.H.; Mihailovic, D. Applications of agroclimatic indices and process oriented crop simulation models in European agriculture. Idojaras 2009, 113, 1–12. [Google Scholar]
  9. Charalampopoulos, I. Agrometeorological Conditions and Agroclimatic Trends for the Maize and Wheat Crops in the Balkan Region. Atmosphere 2021, 12, 671. [Google Scholar] [CrossRef]
  10. Lazoglou, G.; Anagnostopoulou, C.; Koundouras, S. Climate change projections for Greek viticulture as simulated by a regional climate model. Theor. Appl. Climatol. 2018, 133, 551–567. [Google Scholar] [CrossRef]
  11. Koufos, G.; Mavromatis, T.; Koundouras, S.; Fyllas, M.N.; Jones, G.V. Viticulture—Climate relationships in Greece: The impact of recent climate trends on harvest dates variation. Int. J. Climatol. 2014, 34, 1445–1459. [Google Scholar] [CrossRef]
  12. Koufos, G.; Mavromatis, T.; Koundouras, S.; Jones, G.V. Response of viticulture-related climatic indices and zoning to historical and future climate conditions in Greece. Int. J. Climatol. 2017, 38, 2097–2111. [Google Scholar] [CrossRef]
  13. Charalampopoulos, I.; Droulia, F. Frost Conditions Due to Climate Change in South-Eastern Europe via a High-Spatiotemporal-Resolution Dataset. Atmosphere 2022, 13, 1407. [Google Scholar] [CrossRef]
  14. Georgoulias, A.K.; Akritidis, D.; Kalisoras, A.; Kapsomenakis, J.; Melas, D.; Zerefos, C.S.; Zanis, P. Climate change projections for Greece in the 21st century from high-resolution EURO-CORDEX RCM simulations. Atmos. Res. 2022, 271, 106049. [Google Scholar] [CrossRef]
  15. Deuter, P.; White, N.; Putland, D.; Mackenzie, R.; Muller, J. Critical (Temperature) Thresholds and Climate Change Impacts/Adaptation in Horticulture; Report number QP1005130; Queensland Government and Horticulture Australia Limited: Nambour, Australia, 2011.
  16. Jacob, D.; Teichmann, C.; Sobolowski, S.; Katragkou, E.; Anders, I.; Belda, M.; Benestad, R.; Boberg, F.; Buonomo, E.; Cardoso, R.M.; et al. Regional climate downscaling over Europe: Perspectives from the EURO-CORDEX community. Reg. Environ. Chang. 2020, 20, 51. [Google Scholar] [CrossRef]
  17. Jacob, D.; Petersen, J.; Eggert, B.; Alias, A.; Christensen, O.B.; Bouwer, L.M.; Braun, A.; Colette, A.; Déqué, M.; Georgievski, G.; et al. EURO-CORDEX: New high-resolution climate change projections for European impact research. Reg. Environ. Chang. 2014, 14, 563–578. [Google Scholar] [CrossRef]
  18. Vautard, R.; Gobiet, A.; Jacob, D.; Belda, M.; Colette, A.; Déqué, M.; Fernández, J.; García-Díez, M.; Goergen, K.; Güttler, I.; et al. The simulation of European heat waves from an ensemble of regional climate models within the EURO-CORDEX project. ClimDyn 2013, 41, 2555–2575. [Google Scholar] [CrossRef]
  19. Van Vuuren, D.P.; Stehfest, E.; den Elzen, M.G.J.; Kram, T.; van Vliet, J.; Deetman, S.; Isaac, M.; Klein Goldewijk, K.; Hof, A.; Mendoza Beltran, A.; et al. RCP2.6: Exploring the possibility to keep global mean temperature increase below 2 °C. Clim. Chang. 2011, 109, 95–116. [Google Scholar] [CrossRef]
  20. Riahi, K.; Rao, S.; Krey, V.; Cho, C.; Chirkov, V.; Fischer, G.; Kindermann, G.; Nakicenovic, N.; Rafaj, P. RCP 8.5—A scenario of comparatively high greenhouse gas emissions. Clim. Chang. 2011, 109, 33–57. [Google Scholar] [CrossRef] [Green Version]
  21. Hausfather, Z.; Peters, G.P. Emissions—the “business as usual” story is misleading. Nature 2020, 577, 618–620. [Google Scholar] [CrossRef] [Green Version]
  22. Thomson, A.M.; Calvin, K.V.; Smith, S.J.; Kyle, G.P.; Volke, A.; Patel, P.; Delgado-Arias, S.; Bond-Lamberty, B.; Wise, M.A.; Clarke, L.E.; et al. RCP4.5: A pathway for stabilization of radiative forcing by 2100. Clim. Chang. 2011, 109, 77–94. [Google Scholar] [CrossRef] [Green Version]
  23. Mavi, H.S.; Tupper, G.J. Agrometeorology: Principles and Applications of Climate Studies in AgricultureI; CRC Press: Boca Raton, FL, USA, 2004. [Google Scholar]
  24. Kumar, V.P.; Rao, V.; Bhavani, O.; Dubey, A.; Singh, C.; Venkateswarlu, B. Sensitive growth stages and temperature thresholds in wheat (Triticum aestivum L.) for index-based crop insurance in the Indo-Gangetic Plains of India. J. Agric. Sci. 2016, 154, 321–333. [Google Scholar] [CrossRef]
  25. Prasad, P.V.V.; Pisipati, S.R.; Ristic, Z.; Bukovnik, U.; Fritz, A.K. Impact of Nighttime Temperature on Physiology and Growth of Spring Wheat. Crop Sci. 2014, 48, 2372–2380. [Google Scholar] [CrossRef]
  26. Kemble, J.K.; Sanders, D.C. Basics of Vegetable Crop Irrigation; Alabama Co-operative Extension System: Auburn, AL, USA, 2000. [Google Scholar]
  27. Vitagliano, C.; Sebastiani, L. Physiological and biochemical remarks on environmental stress in olive (Olea europaea L.). In Proceedings of the IV International Symposium on Olive Growing, Bari, Italy, 25–30 October 2000; ISHS: Valenzano, Italy, 2000. [Google Scholar]
  28. Benlloch-González, M.; Quintero, J.M.; Suárez, M.P.; Sánchez-Lucas, R.; Fernández-Escobar, R.; Benlloch, M. Effect of moderate high temperature on the vegetative growth and potassium allocation in olive plants. J. Plant Physiol. 2016, 207, 22–29. [Google Scholar] [CrossRef] [PubMed]
  29. Ayaz, M.; Varol, N. The effect of climatic parameters changing (heat, raining, snow, relative humidity, fog, hail, and wind) on olive growing. ZeytinBilimi 2015, 5, 33–40. [Google Scholar]
  30. Ozturk, M.; Altay, V.; Gönenç, T.M.; Unal, B.T.; Efe, R.; Akçiçek, E.; Bukhari, A. An Overview of Olive Cultivation in Turkey: Botanical Features, Eco-Physiology and Phytochemical Aspects. Agronomy 2021, 11, 295. [Google Scholar] [CrossRef]
  31. Tsiros, E.; Domenikiotis, C.; Dalezios, N.R. Assessment of cotton phenological stages using agroclimatic indices: An innovative approach. Ital. J. Agrometeorol. 2009, 1, 50–55. [Google Scholar]
  32. Brown, P. Cotton Heat Stress; University of Arizona Extension: Tucson, AZ, USA, 2008. [Google Scholar]
  33. Rykaczewska, K. The Impact of High Temperature during Growing Season on Potato Cultivars with Different Response to Environmental Stresses. Am. J. Plant Sci. 2013, 4, 2386–2393. [Google Scholar] [CrossRef] [Green Version]
  34. Hancock, R.D.; Morris, W.L.; Ducreux, L.J.M.; Morris, J.A.; Usman, M.; Verrall, S.R.; Fuller, J.; Simpson, C.G.; Zhang, R.; Hedley, P.E.; et al. Physiological, biochemical and molecular responses of the potato (Solanum tuberosum L.) plant to moderately elevated temperature. Plant Cell Environ. 2014, 37, 439–450. [Google Scholar] [CrossRef]
  35. Hijmans, R.J.; Condori, B.; Carrillo, R.; Kropff, M.J. A quantitative and constraint-specific method to assess the potential impact of new agricultural technology: The case of frost resistant potato for the Altiplano (Peru and Bolivia). Agric. Syst. 2003, 76, 895–911. [Google Scholar] [CrossRef]
  36. Higashide, T. Prediction of Tomato Yield on the Basis of Solar Radiation Before Anthesis under Warm Greenhouse Conditions. Hortscience 2009, 44, 1874–1878. [Google Scholar] [CrossRef] [Green Version]
  37. Rudich, J.; Zamski, E.; Regev, Y. Genotypic Variation for Sensitivity to High Temperature in the Tomato: Pollination and Fruit Set. Bot. Gaz. 1997, 138, 448–452. [Google Scholar] [CrossRef]
  38. The Greek Vineyard Today. Available online: https://winesofgreece.org/articles/key-production-figures/ (accessed on 30 November 2022).
  39. Jones, G.V.; Reid, R.; Vilks, A. Climate, Grapes, and Wine: Structure and Suitability in a Variable and Changing Climate. In The Geography of Wine: Regions, Terrior, and Techniques; Dougherty, P., Ed.; Springer Press: New York, NY, USA, 2012; p. 255. [Google Scholar]
  40. Baker, J.T.; Allen, L.H., Jr.; Boote, K.J. Response of rice to carbon dioxide and temperature. Agri. For. Meteorol. 1992, 60, 153–166. [Google Scholar] [CrossRef]
  41. Matsui, T.; Omasa, K.; Horie, T. The difference in sterility due to high temperature during the flowering period among japonica rice varieties. Plant Prod. Sci. 2001, 4, 90–93. [Google Scholar] [CrossRef]
  42. Yang, H.C.; Huang, Z.Q.; Jiang, Z.X.; Wang, X.W. Investigation and study of flowering harm to high temperature on early and mid-season rice in Jiang-Huai rice area in 2003. J. Anhui Agric. Sci. 2004, 32, 607–609. [Google Scholar]
  43. Morita, S.; Yonemaru, J.I.; Takanashi, J.I. Grain growth and endosperm cell size under high night temperatures in rice (Oryza sativa L.). Ann. Bot. 2005, 95, 695–701. [Google Scholar] [CrossRef] [PubMed] [Green Version]
  44. Mann, H.B.; Whitney, D.R. On a Test of Whether one of Two Random Variables is Stochastically Larger than the Other. Ann. Math. Statist. 1947, 18, 50–60. [Google Scholar] [CrossRef]
  45. Carvalho, D.; Cardoso Pereira, S.; Rocha, A. Future surface temperatures over Europe according to CMIP6 climate projections: An analysis with original and bias-corrected data. Clim. Chang. 2021, 167, 10. [Google Scholar] [CrossRef]
  46. Regional Climate Projections for Europe. Available online: https://www.climate-servicecenter.de/products_and_publications/maps_visualisation/detail/062517/index.php.en (accessed on 3 November 2022).
  47. García-Martín, A.; Paniagua, L.L.; Moral, F.J.; Rebollo, F.J.; Rozas, M.A. Spatiotemporal Analysis of the Frost Regime in the Iberian Peninsula in the Context of Climate Change (1975–2018). Sustainability 2021, 13, 8491. [Google Scholar] [CrossRef]
  48. Van der Linden, P.; Mitchell, J.F.B. ENSEMBLES: Climate Change and its Impacts: Summary of Research and Results from the ENSEMBLES Project; University of Exeter, MetOffice Hadley Centre: Exeter, UK, 2009; p. 160. [Google Scholar]
  49. Rajczak, J.; Schär, C. Projections of future precipitation extremes over Europe: A multimodel assessment of climate simulations. J. Geophys. Res. Atmos. 2017, 122, 10–773. [Google Scholar] [CrossRef]
  50. Schlenker, W.; Roberts, M.J. Nonlinear temperature effects indicate severe damages to U.S. crop yields under climate change. Proc. Natl. Acad. Sci. USA 2009, 106, 15594–15598. [Google Scholar] [CrossRef] [Green Version]
  51. Markou, M.; Moraiti, C.A.; Stylianou, A.; Papadavid, G. Addressing Climate Change Impacts on Agriculture: Adaptation Measures for Six Crops in Cyprus. Atmosphere 2020, 11, 483. [Google Scholar] [CrossRef]
  52. Giannakopoulos, C.; Karali, A.; Lemesios, G.; Loizidou, M.; Papadaskalopoulou, C.; Moustakas, K.; Papadopoulou, M.; Moriondo, M.; Markou, M.; Hatziyanni, E.; et al. Adaptation to Climate Change Impact on the Mediterranean Island’s Agriculture; GRA: Munich, Germany, 2016. [Google Scholar]
  53. Rosenstock, T.S.; Lamanna, C.; Chesterman, S.; Bell, P.; Arslan, A.; Richards, M.; Rioux, J.; Akinleye, A.; Champalle, C.; Cheng, Z. The Scientific Basis of Climate-Smart Agriculture: A Systematic Review Protocol; Agriculture and Food Security (CCAFS): Copenhagen, Denmark, 2016. [Google Scholar]
  54. Wiréhn, L. Climate indices for the tailoring of climate information–A systematic literature review of Swedish forestry and agriculture. Clim. Risk Manag. 2021, 34, 100370. [Google Scholar] [CrossRef]
  55. Xue, Y.; Janjic, Z.; Dudhia, J.; Vasic, R.; de Sales, F. A review on regional dynamical downscaling in intra-seasonal to seasonal simulation/prediction and major factors that affect downscaling ability. Atmos. Res. 2014, 147, 68–85. [Google Scholar] [CrossRef]
Figure 1. Topography of the study region (in meters above sea level—m a.s.l.). Locations and areas of interest mentioned in the text are also indicated along with the outline of Greece.
Sustainability 14 17048 g001
Figure 2. (a) Difference in the frequency of days with TASMAX > 30 °C (heat days) in Spring from the EURO-CORDEX ensemble between the near-future (2021–2050) and the reference period (1971–2000) for southeastern Europe for RCP2.6. (b) The same as (a) but for the difference between the end-of-the-century (2071–2100) and the reference period, (c,d) the same as (a,b), respectively, but for RCP4.5, (e,f) the same as (a,b), respectively, but for RCP8.5. Hatching indicates areas where the differences were not statistically robust.
Sustainability 14 17048 g002
Figure 3. (a) Timeseries (1950–2100) with the difference in the frequency of days with TASMAX > 30 °C (heat days) in Spring for the reference period (1971–2000) for Greece (land only; boundaries shown in the figure). Error bars denote the ±1σ from the 11 EURO-CORDEX simulations’ annual means and are plotted every 5 years. The boxplot on the right shows the mean difference (dot) of the periods 1971–2000, 2021–2050 and 2071–2100 with the reference period. The middle lines in each box represent the corresponding median difference, the boxes indicate the range between the 25th and 75th percentiles and the whiskers the maximum and minimum difference values from the 11 EURO-CORDEX simulations (inter-model variability), (b) the same as (a) but for TASMAX > 35 °C in Summer and (c) the same as (a) but for the days in Spring with TASMIN < 0 °C.
Sustainability 14 17048 g003
Figure 4. The same as Figure 2 but for TASMAX > 35 °C in Summer.
Sustainability 14 17048 g004
Figure 5. The same as Figure 2 but for TASMIN < 0 °C (frost days) in Spring.
Sustainability 14 17048 g005
Figure 6. The same as Figure 2 but for TASMIN > 20 °C in Spring–Summer.
Sustainability 14 17048 g006
Figure 7. The same as Figure 3 but for the days with (a) TASMIN >20 °C in Spring–Summer, (b) PR > 1 mm in Spring and (c) PR > 1 mm in Summer.
Sustainability 14 17048 g007
Figure 8. The same as Figure 2 but for wet days (PR > 1 mm) in Spring.
Sustainability 14 17048 g008
Figure 9. The same as Figure 2 but for PR > 1 mm in Summer.
Sustainability 14 17048 g009
Table 1. List with the EURO-CORDEX RCMs whose simulations were used in the present study. The corresponding driving GCMs and the specific realizations are also shown.
RCMDriving GCMRealization
1ALADIN63.v2CNRM.CNRM-CERFACS-CNRM-CM5r1i1p1
2CCLM4-8-17.v1CLMcom.ICHEC-EC-EARTHr12i1p1
3HIRHAM5.v2DMI.ICHEC-EC-EARTHr3i1p1
4RACMO22E.v1KNMI.ICHEC-EC-EARTHr12i1p1
5RACMO22E.v2KNMI.MOHC-HadGEM2-ESr1i1p1
6RACMO22E.v2KNMI.CNRM-CERFACS-CNRM-CM5r1i1p1
7RCA4.v1SMHI.MOHC-HadGEM2-ESr1i1p1
8RCA4.v1SMHI.MPI-M-MPI-ESM-LRr1i1p1
9RCA4.v1SMHI.ICHEC-EC-EARTHr12i1p1
10REMO2009.v1MPI-CSC.MPI-M-MPI-ESM-LRr1i1p1
11REMO2009.v1MPI-CSC.MPI-M-MPI-ESM-LRr2i1p1
Publisher’s Note: MDPI stays neutral with regard to jurisdictional claims in published maps and institutional affiliations.

