Article

Prioritisation of Charismatic Animals in Major Conservation Journals Measured by the Altmetric Attention Score

1
Department of Environmental Ecology and Landscape Management, Faculty of Natural Sciences, Comenius University, Ilkovičova 6, 842 15 Bratislava, Slovakia
2
Institute of Zoology, Slovak Academy of Sciences, 845 06 Bratislava, Slovakia
*
Author to whom correspondence should be addressed.
Sustainability 2022, 14(24), 17029; https://doi.org/10.3390/su142417029
Submission received: 24 November 2022 / Revised: 14 December 2022 / Accepted: 15 December 2022 / Published: 19 December 2022
(This article belongs to the Special Issue Wildlife Conservation: Managing Resources for a Sustainable World)

Abstract

:
Large, charismatic animals trigger human emotional responses, which consequently result in taxonomic biases that have been proven in various fields. In our research, we analysed the representation of animals and plants in scientific papers published in three major conservation journals (Conservation Biology, Journal of Applied Ecology and Conservation Letters) between 2011 and 2020. Furthermore, we examined the Altmetric Attention Score (AAS) and each paper’s total number of citations focused exclusively on a single taxon (59% of all papers). Mammals were represented on journal cover pages significantly more frequently than other taxa, while reptiles, amphibians and fish were underrepresented. The total number of published papers and the AAS favoured mammals significantly, while reptiles, plants and amphibians received the lowest AAS. The AAS of mammals was positively influenced by the body mass and appeal score. Scientific citations showed a slight correlation with the AAS. Papers about mammals, invertebrates and amphibians received the most citations, followed by plants, fish, birds and reptiles. These results showed that there are taxonomic biases that favour large mammals over other taxa, both among scientists as well as the public. Therefore, publication policy should be changed in order to support the shift of scientists and, subsequently, public interest itself toward neglected taxa.

1. Introduction

Scientists worldwide are traditionally evaluated by conventional metrics, including the journal impact factor, the total number of citations covered by WoS or Scopus or the Hirsch index. However, internet use rapidly increases and reaches near-universal access, allowing for open communication between scientists and laypeople [1]. Traditional scientometrics is supplied by the Altmetric Attention Score (AAS), which investigates the impact of various research activities on social media [2,3] and realistically reflects what the public wants to know [4]. The inconsistency between the public and scientists [5] is beautifully illustrated by moderate or non-significant relationships between conventional citations registered in scientific databases and the AAS [4,6,7,8,9]. Therefore, the AAS reflects the public’s curiosity, ideas and knowledge about a particular research topic [10].
Environmental degradation and biodiversity loss capture public attention [11,12]. This is not surprising given that animal populations have experienced a decline of 69% since 1970 [13], which simultaneously affects the dispersal of plants’ seeds by animals and reduces the capacity of plants to track climate change by 60% globally [14]. It is therefore crucial to better understand human attitudes toward living organisms to improve the effectiveness of nature protection campaigns using the acceptability and likeability of living things [15,16,17].
Human emotions toward animals strongly influence their preferences and attitudes toward them (reviewed by [16,18]). The most preferred species are phylogenetically closer to humans [19,20,21,22], colourful [23,24,25] and large [24,26,27,28,29,30]. Preferred animals also receive the greatest willingness to support their conservation by people (e.g., [25,31,32,33,34,35]).
Human preferences have non-trivial behavioural consequences; for instance, US conservation and nature magazines predominantly depict large-bodied mammals and birds on their covers, while invertebrates, fish, amphibians, reptiles or plants remain underrepresented (Clucas et al., 2008) [36]. In addition, large-bodied species are more frequently reared in zoos [24,37,38,39] and receive more donations than small, non-charismatic species [40,41,42]. Finally, plants are special because they receive lower conservation support than animals [43,44]. Although researchers are well informed about taxonomic biases, it is unclear whether these trends are pervasive or whether something has been changed.
In this study, we investigated the representation of living organisms in scientific articles published by major conservation journals and their preferences by laypeople, as estimated by the AAS. First, we hypothesised that mammals are depicted on the cover pages of the three journals more than other taxa. Second, we hypothesised that scientific papers about vertebrates are more prevalent and receive a higher AAS than those about invertebrates or plants. Third, mammals receive the greatest attention in terms of the total number of published articles and the AAS. Fourth, we hypothesised that the AAS of mammals is positively correlated with their body mass as an index of charisma (cf. [27]) and overall appeal score [45]. We do not predict that the total number of scientific citations correlates with the specific taxon, the body mass or the appeal score of mammals.

2. Materials and Methods

2.1. Journal Selection

We analysed all articles published between 2011 and 2020 from three major conservation journals: Conservation Biology, Journal of Applied Ecology and Conservation Letters. These journals were chosen because all of them are among the top quartile in Biodiversity Conservation according to the Journal Citation Reports (JCR) category (Thomson Reuters) in 2021. Furthermore, all these journals are published by the same publisher (John Wiley & Sons), preventing possible differences in AAS calculations among publishers.

2.2. Cover Pages

We analysed the taxa depicted on the cover pages in each issue. Taxa were categorised as mammals, birds, reptiles, amphibians, fish, invertebrates, plants and “others”. In this case, we created a specific category for “humans” because we did not intend to mix humans with other mammals, since our focus was solely on non-humans.

2.2.1. AAS and the Total Number of Citations

Both the AAS and the total number of citations were obtained from journal web pages. We omitted calculations of articles that were not exclusively focused on one of the investigated taxa (mammals, birds, reptiles, amphibians, fish, invertebrates, plants).

2.2.2. Measuring of Species’ Body Mass

The body mass of each species was calculated using data from Jones et al. [46]. The data were logarithmically transformed, following the recommendations of Smith et al. [47]. We found a match of n = 356 species for the investigated mammals.

2.2.3. Measuring of Species Appeal

The appeal scores for the mammal species were taken from the available data for 4320 species of mammals [45]. These scores reflect participants’ preferences for each species in the context of conservation. We found a match of n = 238 for the investigated mammals. Higher scores mean a greater appeal (range = 0.77 to 5.01).

2.3. Statistical Analyses

Differences in the frequency of the appearance of cover pages of each taxon between the three journals were calculated with the Generalised Linear Mixed Model (GLMM) with a Poisson distribution, where the total number of occurrences was defined as a dependent variable, and journal identity was defined as a random effect. Finally, the AAS and citations were analysed with the GLMM with a Poisson distribution, where the journal identity and the matter of whether the paper was open-access or not were defined as random effects. Open-access papers have more citations than non-open-access papers in ecology [48]; thus, it was necessary to control our analysis with this variable. Note that all articles published in Conservation Letters are open-access; therefore, we did not compare the AAS or the total number of citations between open-access and non-open-access papers. The taxon was always defined as a fixed factor. Post hoc tests were performed with contrast analysis. All statistical analyses were performed in SPSS ver. 26.

3. Results

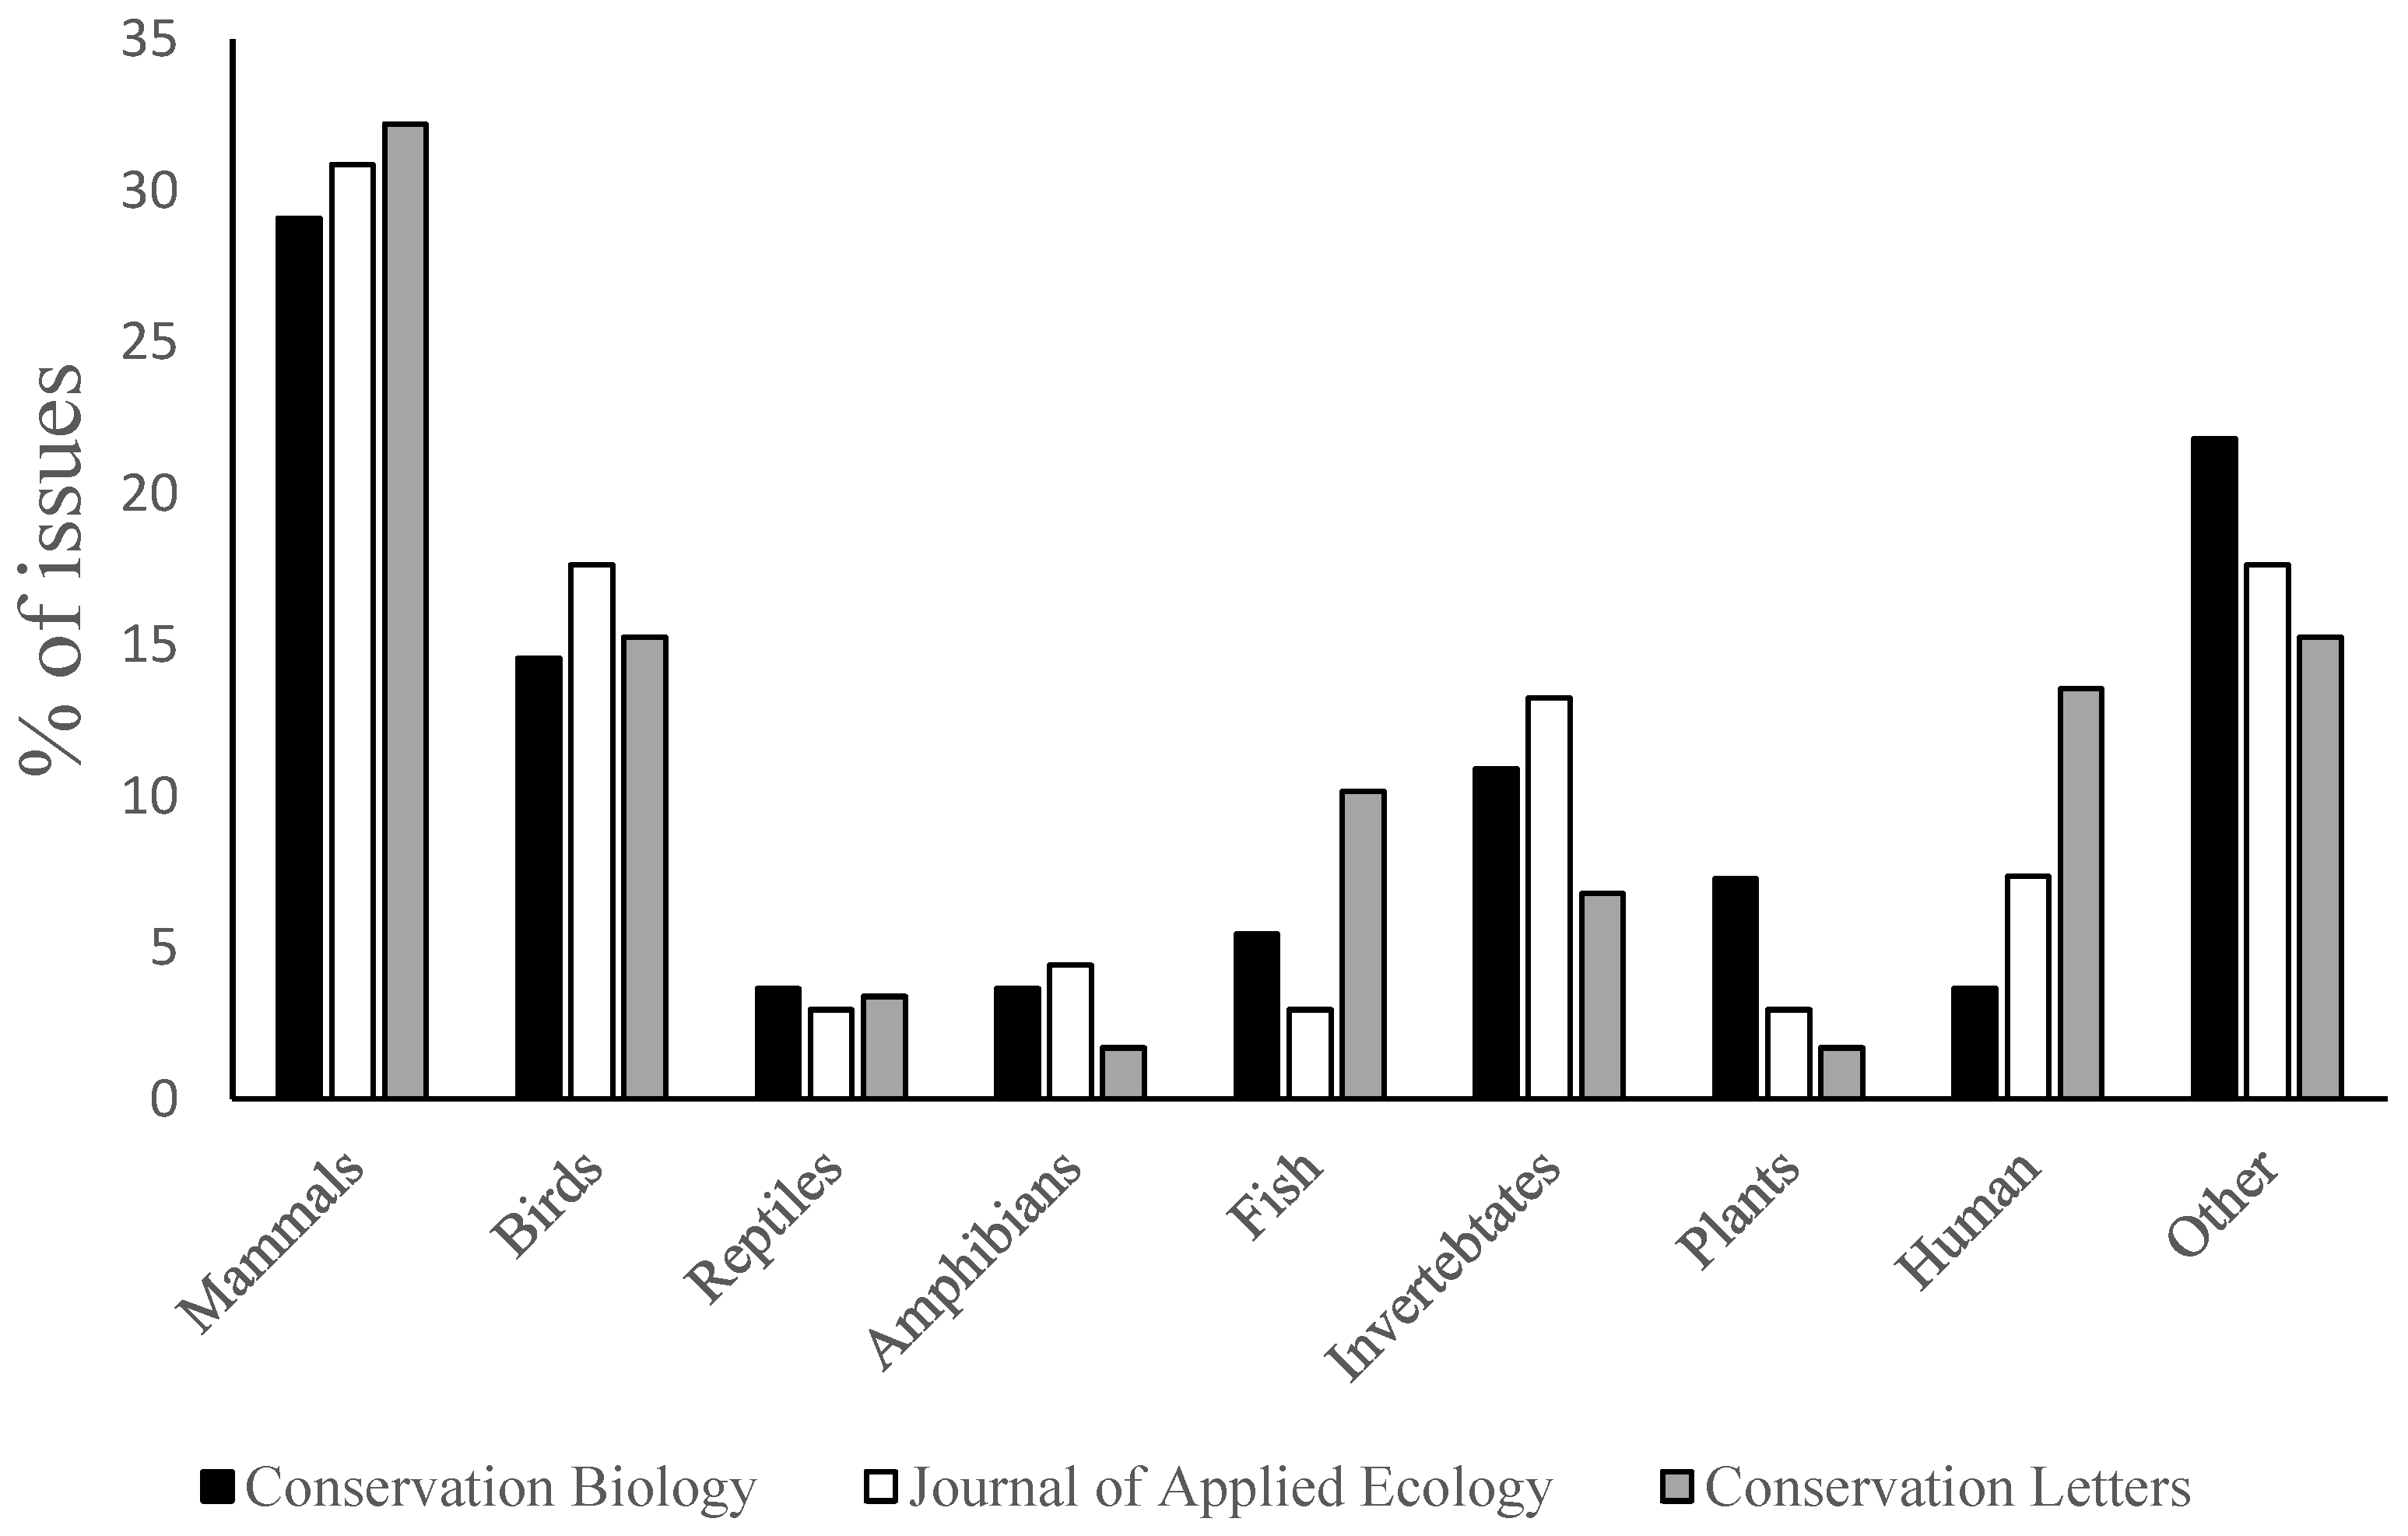
3.1. Journals’ Cover Pages

There were significant differences in the total number of cover pages representing various taxa (GLMM, F(8,18) = 9.58, p < 0.001). Mammals received significantly greater attention compared with all other taxa (contrast analyses, all p < 0.001), followed by birds (comparison with all other taxa, all p < 0.001) (Figure 1). Reptiles, amphibians, plants and fish were significantly the least frequently depicted on journal cover pages.

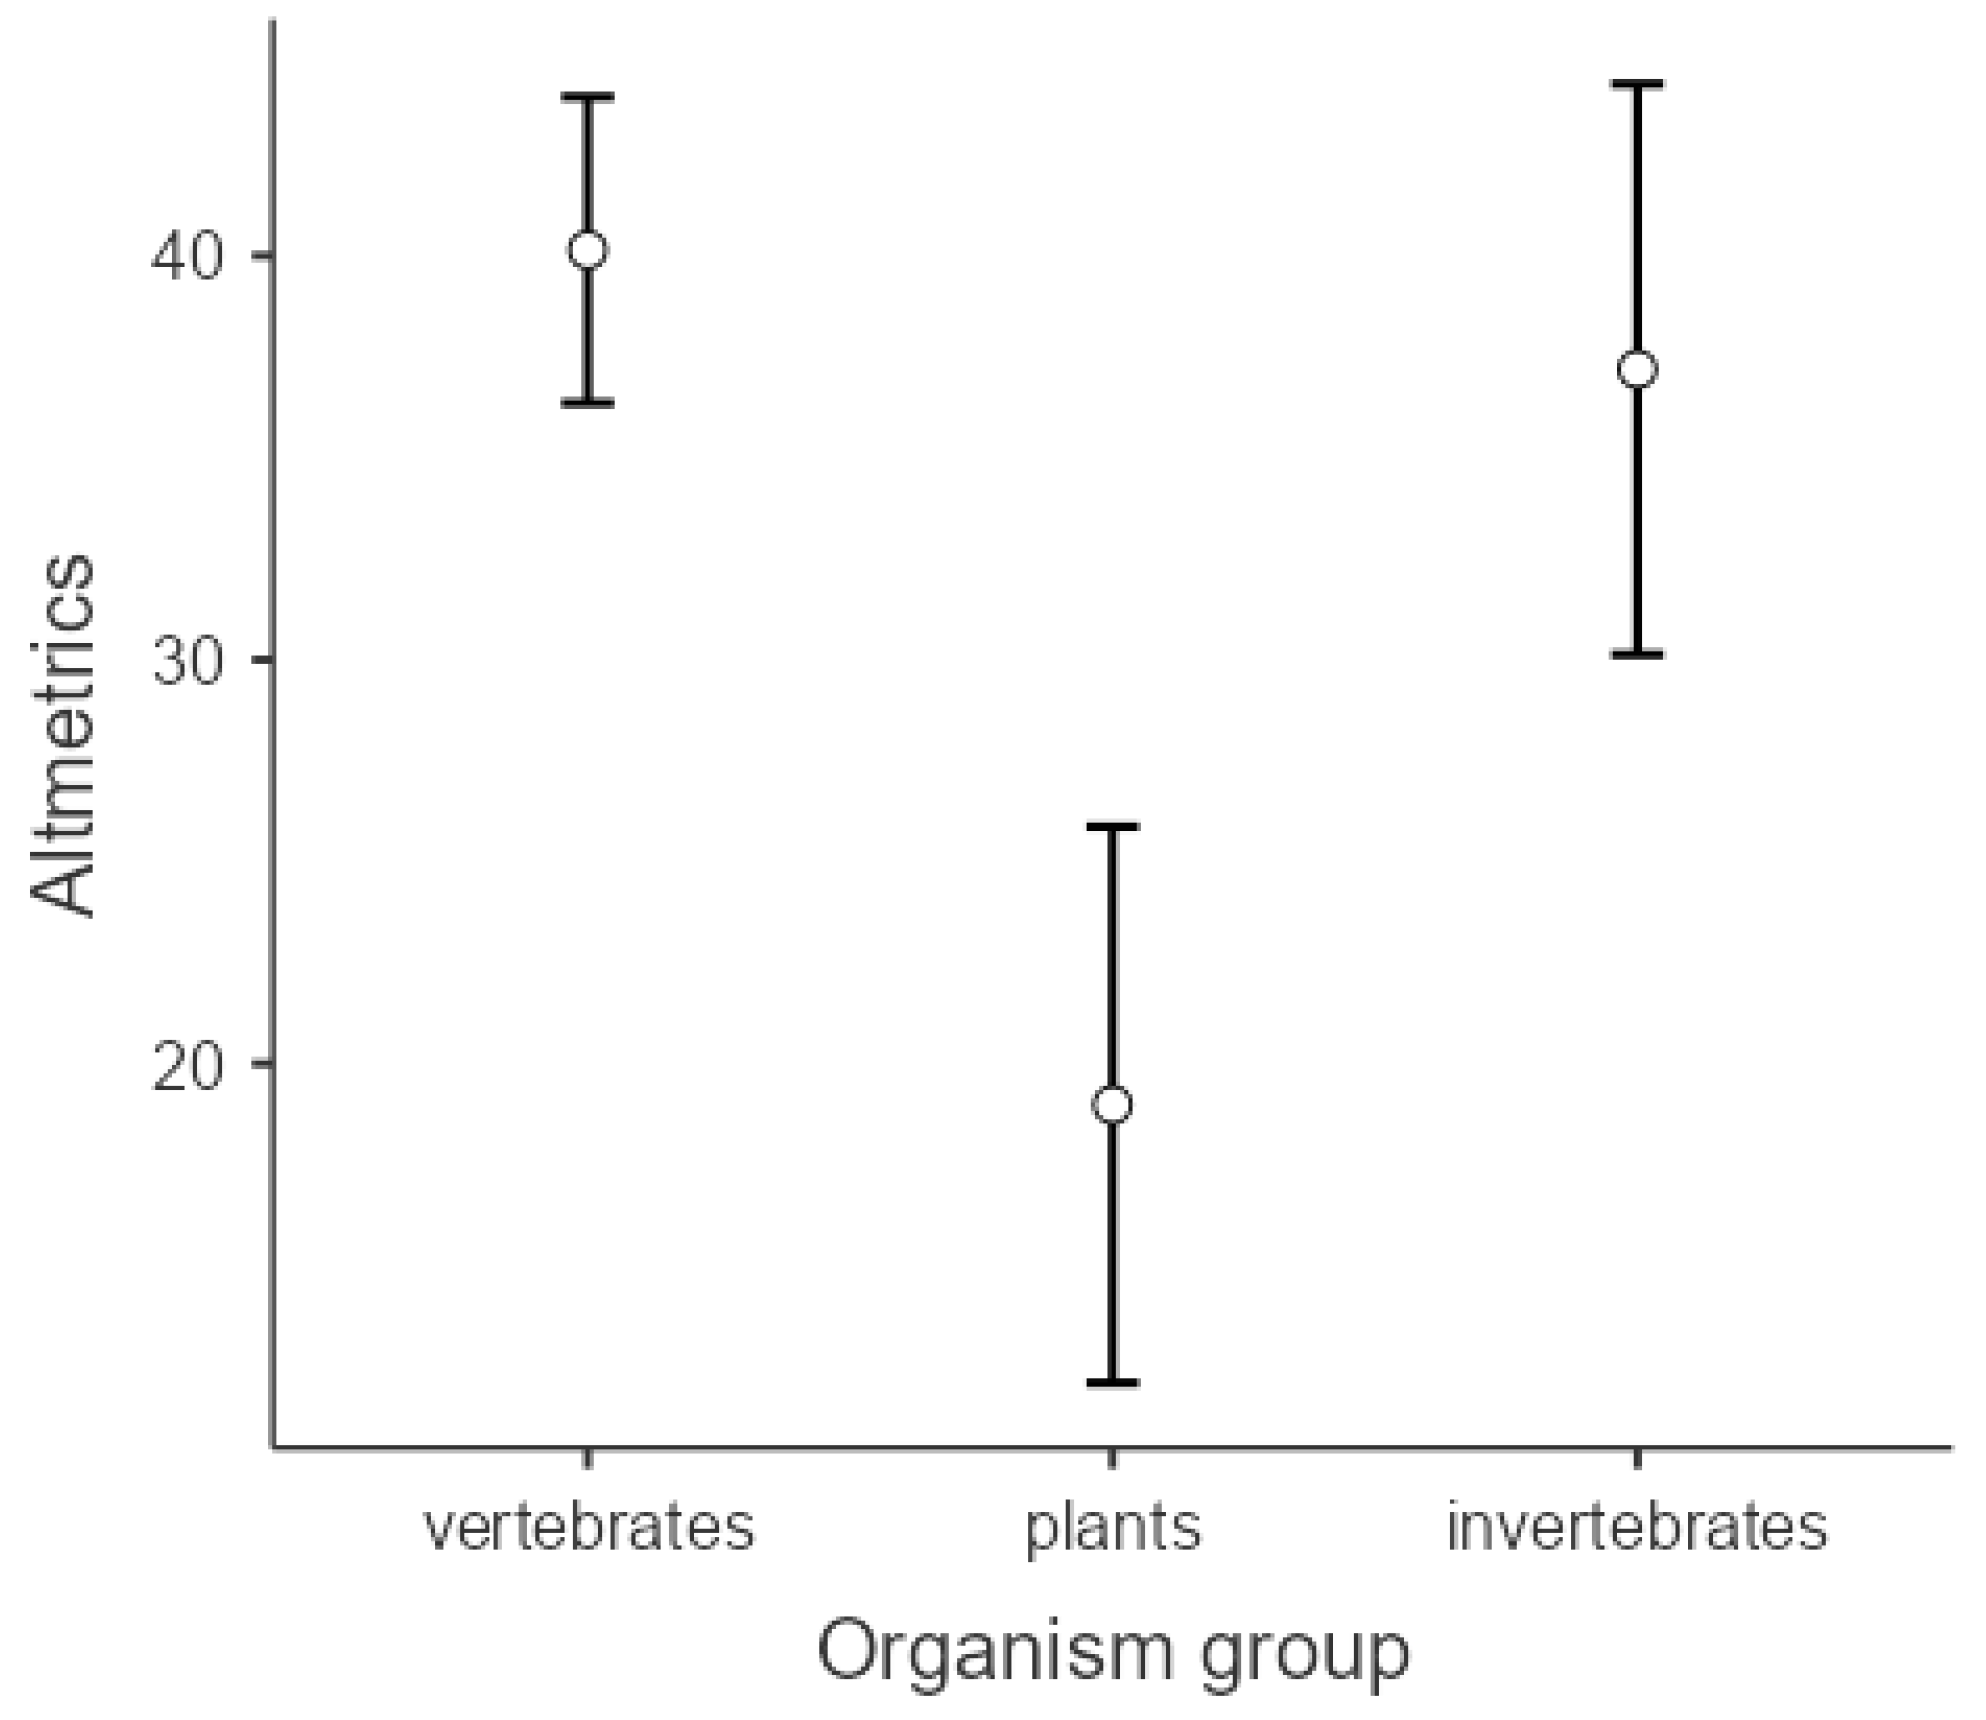
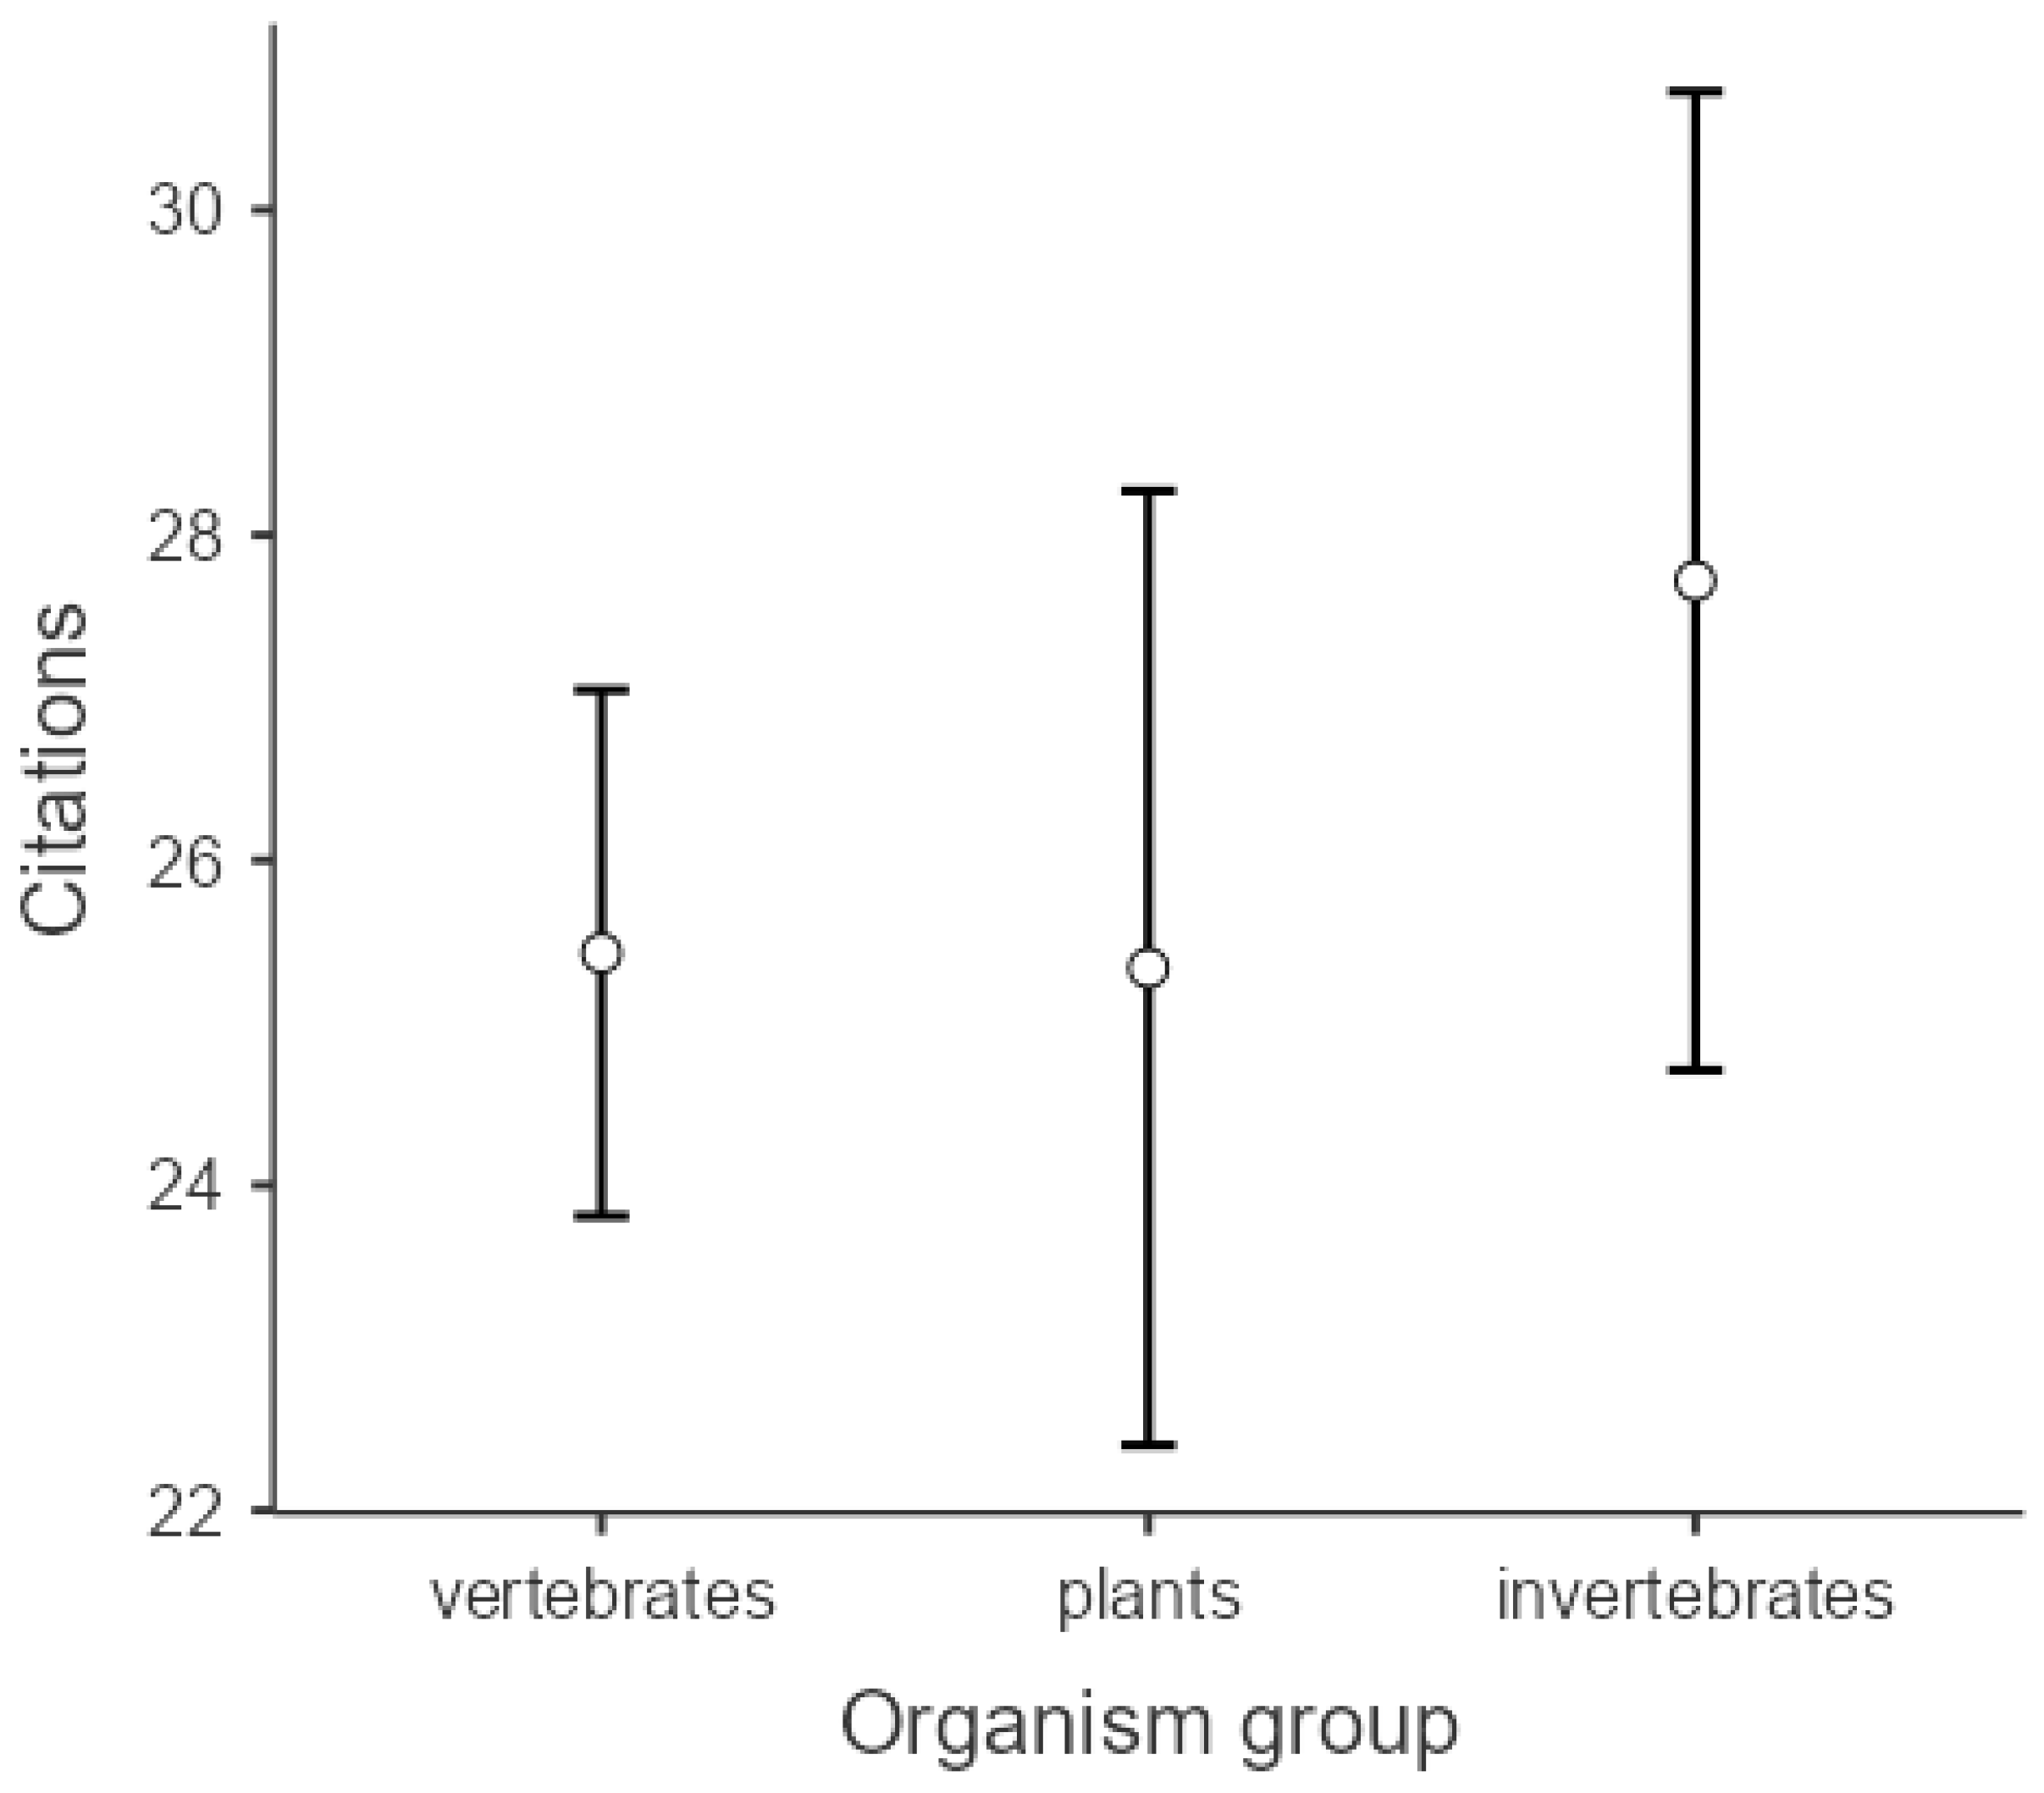
3.2. The Influence of the Major Organisms Group on Altmetrics and Citations

Among all 3647 papers that were analysed, 2152 (59%) focused on one taxon (e.g., vertebrates). There was a small but significant correlation between the altmetrics and the total number of citations (Spearman r = 0.21, p < 0.001).
There were apparent differences in the distribution of papers among the three groups of organisms (plants, invertebrates and vertebrates). The articles on vertebrates (n = 1351, 62.8%) were the most frequent, followed by the articles on plants (n = 410, 19.1%) and invertebrates (n = 390, 18.1%). Additionally, there were significant differences in the AAS between the three groups of organisms (GLMM, F(2,2145) = 2038.14, p < 0.001, Figure 2). Pair-wise analysis of contrasts showed that vertebrates received the highest AAS, followed by invertebrates and plants.
Concerning the total number of citations, invertebrates received significantly more citations than vertebrates or plants, while there was no difference between the latter two (GLMM, F(2,2146) = 40.2, p < 0.001, Figure 3).

3.3. Differences in the Class Level

Subsequent analyses focus on differences between vertebrate classes and invertebrates and plants. Most papers were published about mammals, followed by plants, birds and invertebrates. Fish, amphibians and reptiles received the lowest attention (Table 1).
There were significant differences in the AAS between the three groups of organisms (GLMM, F(6,2059) = 1196.75, p < 0.001). Pairwise contrast analysis showed that vertebrates received the highest AAS, followed by invertebrates and plants. Mammals received the highest AAS compared to other groups of organisms (all p < 0.001, Table 2). Mammals were followed by invertebrates, fish and birds, while reptiles, plants and amphibians received the lowest AAS.
Regarding the total number of citations, the differences between the groups were significant (GLMM, F(6,2060) = 94.02, p < 0.001). Mammals, invertebrates and amphibians received the most citations, followed by plants, fish, birds and reptiles (Table 3).

3.4. Body Mass and Appeal Score as Predictors of the AAS?

Because mammals received the greatest attention in terms of the total number of papers and altmetrics scores, we proceeded with calculations of the relationships between the body mass of mammals and their altmetrics and citation scores. Mammalian body mass was a significant positive predictor of the AAS (GLMM, F(1,354) = 446.82, coefficient = 4.6, p < 0.001). Because appeal scores were found for a reduced number of mammals (n = 238), we repeated the GLMM with the inclusion of an appeal score together with mammalian body mass in the AAS. Both the appeal score and body mass significantly and positively influenced the AAS (GLMM, F(1,125) = 124.95 and 36.6, coefficient = 4.22 and 2.5, both p < 0.001). The appeal scores were correlated with mammalian body mass (Spearman r = 0.7, p < 0.001, n = 238). To address possible problems with multicollinearity, we repeated the GLMM without mammalian body mass. The influence of the appeal score on the AAS remained significant (F(1,236) = 461.05, coefficient = 5.58, p < 0.001).
Mammalian body mass negatively and significantly influenced the total number of citations (GLMM, F(1,354) = 14.7, coefficient = −0.71, p < 0.001). The repeated GLMM with the inclusion of the appeal score presented the appeal score positively and the mammalian body mass negatively while influencing the total number of citations at the same time (F(1,235) = 175.8 and 125.6, coefficient = 3.65 and −4.04, both p < 0.001). Citation scores did not correlate with mammalian body mass (Spearman r = 0.04, p = 0.54, n = 238). To address possible problems with multicollinearity, we repeated the GLMM without mammalian body mass. The influence of the appeal score on the total number of citations remained significant (F(1,236) = 52.02, coefficient = 1.42, p < 0.001).

4. Discussion

This study investigated publication biases toward charismatic species in three major conservation journals on cover pages and published scientific papers during the past ten years. To the best of our knowledge, this is the first study that has attempted to associate the charisma of the animal, which was estimated by the body mass and appeal score, with the AAS. Our results support the idea that taxonomic bias in conservation journals toward large, charismatic animals (predominantly mammals) exists. Furthermore, charismatic animals received greater attention from the public, at least according to the calculations obtained from the AAS.
Our first hypothesis dealt with the presentation of mammals on the covers of three conservation journals. This hypothesis was supported because mammals significantly exceed all other taxa in these journals. By investigating the covers of ten representative US conservation and nature magazines, Clucas et al. (2008) [36] showed that mammals were used more frequently than other taxa, followed by birds. In their study, reptiles, amphibians, fish and plants were underrepresented to a similar extent as in our current research.
Many reptiles are traditionally considered disgusting and dangerous [49,50], while amphibians are viewed as slimy (and therefore disgusting) [51,52], and fish are of little interest to people [53]. People are generally less interested in plants than in animals [43,44,54,55], and photographs of plants in textbooks are less numerous and less diverse than images of animals [55,56]. In general, these traits seem to be responsible for the biases toward more charismatic organisms. Unfortunately, many plant species, particularly Cactaceae, Asparagaceae, Crassulaceae, Orchidaceae and Bromeliaceae, are endangered due to land use changes and illegal trading [57]. However, considering journal covers, editorial boards primarily contribute to taxonomic biases, because the chosen covers are selected by the editors despite readers’ desire. The editors’ specialisation may further influence the selection of covers. Moreover, it is expected that mammals are more represented on the covers since they are also more represented in the papers published in each journal.
Our second hypothesis suggested that scientific papers on vertebrates are more prevalent and receive a higher AAS than invertebrates or plants. This hypothesis received partial support because vertebrates received a higher AAS than plants, although there were no differences in the mean AAS scores between vertebrates and invertebrates. As discussed above, these results are not surprising in the case of plants; however, in the case of invertebrates, phylogenetically distant and less attractive animals receive less empathy and conservation support than vertebrates [21,22,25]. Interestingly, certain flagship species, such as colourful butterflies, dragonflies or insects that provide ecological services, are perceived positively by people [58,59]. Therefore, a deeper investigation of preferred invertebrates, as measured by the AAS, is a challenge for future research.
Our final hypotheses dealt with the superiority of mammals, as measured by the total number of published papers, with a relatively higher AAS compared to other taxa (Hypothesis 3) and with a positive association between mammalian body mass, appeal score and AAS. These hypotheses received statistical support. Since the AAS favours large mammals, it can be assumed that people are more likely to talk about larger animals on blogs and share information about them through social networks (such as Twitter and Facebook) rather than small-bodied species. These results correspond with research showing that people prefer larger-bodied animals, particularly exotic terrestrial mammals [27,41,42,60]. Alternatively, some exotic mammals are currently studied and published in conservation journals (e.g., Sus scrofa, Callithrix jacchus, domestic cats and dogs on islands); thus, our results could be influenced by a temporal bias rather than by charisma. This idea requires deeper attention.
It seems that taxonomic biases, which favour the keeping of large mammals in zoos [37,38,39], exist in conservation science as well as in the exchange of information through social networks by the public. Finally, our findings are derived from the additional influence of the appeal score on AAS and the positive correlation between mammalian body mass and appeal scores. In other words, large-bodied mammals are perceived as more appealing using people’s interest, as measured with AAS.
We did not expect significant shifts in the number of scientific citations among the taxa examined. However, there was a considerable bias favouring mammals, invertebrates and amphibians over plants, fish, birds and reptiles. The interest in invertebrates would be acceptable, since invertebrates comprise 97% of all animals on our planet [61]. However, plants, which exceed 300,000 extant species [62], and fish, with more than 30,000 species (which is more than all other vertebrates combined) [63], are heavily underestimated by scientists. Interestingly, even though mammalian body mass showed a negative influence, appeal positively influenced the total number of citations. Citations accumulate more slowly than AAS [64], and AAS is slow for smaller mammals (this study). This is one possible explanation for why smaller mammals receive more citations relative to AAS; it also supports the low consistency between the public and scientists [5]. A small correlation between AAS and the total number of citations suggests that public opinion does not necessarily reflect scientists’ opinions [4,6,7,8,9].
A positive influence of the appeal score on the total number of citations could reflect the intrinsic interest in particular animals among scientists, which is corroborated by the greater overall number of publications favouring mammals, as shown in the present study. However, more research is necessary in order to investigate whether publications and citations of papers about each species are influenced by conservation needs or scientists’ attraction to charismatic species. Additional predictors that need to be considered are life history strategies. Common, abundant species with fast reproduction (e.g., fish, insects, plants) are less vulnerable to extinction; thus, research about them has lower changes in terms of being published in conservation journals. On the other hand, slowly reproducing animals (certain mammals, birds, etc.) have little capacity to recover [65], and their research requires attention by conservation journals.

Limitations

The main limitation of our research is that we were able to investigate taxonomic biases for only 59% of all published papers. The remaining papers focused on other topics and/or various unexplored taxa. Still, our analyses are based on more than 2000 papers published in three major, influential conservation journals which have a non-trivial impact on creating public opinion. Second, we did not control the geographical distribution of the studied species, the author(s) affiliations and the richness of the country where the research was carried out. Tahamtan et al. (2016) [66], for example, showed that US papers received more citations than papers from other countries, which may reflect the reputation of the country or the research team. Although we acknowledge this shortcoming of our methodological approach, we do not believe that taxonomic bias on journal cover pages or the influences of mammalian body mass and appeal scores on AAS could be confounded by these factors. Finally, our analysis is stratified on relatively recent papers published in the selected conservation journals, which could influence the representation of certain taxa. For instance, during the 1990s–2000s, an invertebrate golden mussel (Limnoperna fortunei) was frequently represented in conservation journals as a “current” threat to biodiversity. To address these shortcomings, further research should involve more conservation journals (e.g., Biological Conservation, Biodiversity and Conservation, Environmental Conservation), taking articles published earlier into account.

5. Conclusions

In conclusion, our research showed that publication biases, measured in terms of the total number of papers and citations and the public interest calculated with AAS, favour certain taxonomic groups of animals (particularly large-bodied mammals) over others. Surprisingly, these trends, which had been previously investigated by different methods, persist, even in professional conservation journals. Publication policies that favour neglected taxa are therefore necessary to improve current trends shaped by animal charisma. For instance, the editors should support special issues regarding the conservation of plants, fish or reptiles, which would contribute to a more balanced situation without any apparent focus on just a few taxonomic groups. Furthermore, improving the publication bias may influence communication between scientists and laypeople [1] and public opinion about living organisms.

Author Contributions

Conceptualisation, P.P.; Methodology, P.P., R.M. and P.F.; Software, P.P.; Validation, P.P., R.M., P.F. and M.Z.; Formal analysis, R.M.; Investigation, P.P., R.M., S.H., Z.J. and M.Z.; Resources, P.F.; Data curation, P.P. and R.M.; Writing—original draft preparation, P.P.; Writing—review & editing, R.M., S.H., Z.J., M.Z. and P.F.; Visualisation, P.P.; Supervision, P.P. All authors have read and agreed to the published version of the manuscript.

Funding

This work was supported by the Scientific Grant Agency of the Ministry of Education of the Slovak Republic, Grant No. VEGA 1/0286/20 and 1/0007/21. P.P. was also supported by the Operation Program of Integrated Infrastructure for the project UpScale of Comenius University Capacities and Competence in Research, Development and Innovation, ITMS2014+: 313021BUZ3, co-financed by the European Regional Development Fund.

Institutional Review Board Statement

Not applicable.

Informed Consent Statement

Not applicable.

Data Availability Statement

Raw data and visual material are available upon request.

Acknowledgments

We thank the three anonymous referees for their constructive comments.

Conflicts of Interest

The authors declare that they have no conflict of interest.

References

  1. Cho, J. Altmetrics analysis of highly cited academic papers in the field of library and in formation science. Scientometrics 2021, 126, 7623–7635. [Google Scholar] [CrossRef]
  2. Costas, R.; Zahedi, Z.; Wouters, P. Do “altmetrics” correlate with citations? Extensive comparison of altmetric indicators with citations from a multidisciplinary perspective. J. Assoc. Inf. Sci. Technol. 2015, 66, 2003–2019. [Google Scholar] [CrossRef] [Green Version]
  3. Erdt, M.; Nagarajan, A.; Sin, S.-C.J.; Then, Y.-L. Altmetrics: An Analysis of the State-Of-The-Art in Measuring Research Impact on Social Media. Scientometrics 2016, 109, 1117–1166. [Google Scholar] [CrossRef]
  4. Kim, Y.; Kim, J.E.; Kim, Y.H.; Yoon, D.Y.; Kim, Y.J.; Bae, J.S. Social attention and scientific articles on stroke: Altmetric analysis of top-50 articles. Clin. Neurol. Neurosurg. 2019, 183, 105386. [Google Scholar] [CrossRef] [PubMed]
  5. Araujo, R.; Sorensen, A.A.; Konkiel, S.; Bloem, B.R. Top Altmetric scores in the Parkinson’s disease literature. J. Park. Dis. 2017, 7, 81–87. [Google Scholar] [CrossRef] [Green Version]
  6. Kolahi, J.; Khazaei, S. Altmetric: Top 50 dental articles in 2014. Br. Dent. J. 2016, 220, 569–574. [Google Scholar] [CrossRef]
  7. Ezema, I.J.; Ugwu, C.I. Correlating research impact of library and information science journals using citation counts and altmetrics attention. Inf. Discov. Deliv. 2019, 47, 143–153. [Google Scholar] [CrossRef]
  8. Baek, S.; Yoon, D.Y.; Lim, K.J.; Hong, J.H.; Moon, J.Y.; Seo, Y.L.; Yun, E.J. Top-cited articles versus top Altmetric articles in nuclear medicine: A comparative bibliometric analysis. Acta Radiol. 2020, 61, 1343–1349. [Google Scholar] [CrossRef]
  9. Nabavi, M. An analysis of journalism articles achieving high Altmetric attention scores. Learn. Publ. 2022, 35, 617–624. [Google Scholar] [CrossRef]
  10. Chen, M.; Wang, L. An Altmetrics and citation analysis of selected predatory journals in library and information science field. J. Acad. Libr. 2022, 48, 102618. [Google Scholar] [CrossRef]
  11. Grodzińska-Jurczak, M.; Cent, J. Can public participation increase nature conservation effectiveness? Innovation 2011, 24, 371–378. [Google Scholar] [CrossRef]
  12. Donkersley, P.; Ashton, L.; Lamarre, G.P.; Segar, S. Global insect decline is the result of wilful political failure: A battle plan for entomology. Ecol. Evol. 2022, 12, e9417. [Google Scholar] [CrossRef]
  13. WWF. Living Planet Report 2022—Building a Nature-Positive Society; Almond, R.E.A., Grooten, M., Juffe Bignoli, D., Petersen, T., Eds.; WWF: Gland, Switzerland, 2022; pp. 1–118. [Google Scholar]
  14. Fricke, E.C.; Ordonez, A.; Rogers, H.S.; Svenning, J.C. The effects of defaunation on plants’ capacity to track climate change. Science 2022, 375, 210–214. [Google Scholar] [CrossRef]
  15. Martín-López, B.; Montes, C.; Benayas, J. The non-economic motives behind the willingness to pay for biodiversity conservation. Biol. Conserv. 2007, 139, 67–82. [Google Scholar] [CrossRef]
  16. Prokop, P.; Randler, C. Biological predispositions and individual differences in human attitudes toward animals. In Ethnozoology: Animals in Our Lives; Alves, R.R.N., Albuquerque, U.P., Eds.; Academic Press: London, UK, 2018; pp. 447–466. [Google Scholar]
  17. Lévesque, A.; Gagné, L.; Dupras, J. Expressing citizen preferences on endangered wildlife for building socially appealing species recovery policies: A stated preference experiment in Quebec, Canada. J. Nat. Conserv. 2022, 69, 126255. [Google Scholar] [CrossRef]
  18. Castillo-Huitrón, N.M.; Naranjo, E.J.; Santos-Fita, D.; Estrada-Lugo, E. The importance of human emotions for wildlife conservation. Front. Psychol. 2020, 11, 1277. [Google Scholar] [CrossRef]
  19. Plous, S. The role of animals in human society. J. Soc. Issue 1993, 49, 11–52. [Google Scholar] [CrossRef]
  20. Serpell, J.A. Factors influencing human attitudes to animals and their welfare. Anim. Welf. 2004, 13, S145–S152. [Google Scholar]
  21. Miralles, A.; Raymond, M.; Lecointre, G. Empathy and compassion toward other species decrease with evolutionary divergence time. Sci. Rep. 2019, 9, 1955. [Google Scholar] [CrossRef] [Green Version]
  22. Prokop, P.; Zvaríková, M.; Zvarík, M.; Pazda, A.; Fedor, P. The effect of animal bipedal posture on perceived cuteness, fear, and willingness to protect them. Front. Ecol. Evol. 2021, 9, 681241. [Google Scholar] [CrossRef]
  23. Marešová, J.; Landová, E.; Frynta, D. What makes some species of milk snakes more attractive to humans than others? Theor. Biosci. 2009, 128, 227–235. [Google Scholar] [CrossRef] [PubMed]
  24. Frynta, D.; Lišková, S.; Bültmann, S.; Burda, H. Being attractive brings advantages: The case of parrot species in captivity. PLoS ONE 2010, 5, e12568. [Google Scholar] [CrossRef] [PubMed]
  25. Prokop, P.; Fančovičová, J. Does colour matter? The influence of animal warning colouration in human emotions and willingness to protect them. Anim. Conserv. 2013, 16, 458–466. [Google Scholar] [CrossRef]
  26. Landová, E.; Poláková, P.; Rádlová, S.; Janovcová, M.; Bobek, M.; Frynta, D. Beauty ranking of mammalian species kept in the Prague Zoo: Does beauty of animals increase the respondents’ willingness to protect them? Sci. Nat. 2018, 105, 69. [Google Scholar] [CrossRef] [PubMed]
  27. Berti, E.; Monsarrat, S.; Munk, M.; Jarvie, S.; Svenning, J.C. Body size is a good proxy for vertebrate charisma. Biol. Conserv. 2020, 251, 108790. [Google Scholar] [CrossRef]
  28. Frynta, D.; Marešová, E.; Landová, E.; Lišková, S.; Šimková, O.; Tichá, I.; Zelenková, M.; Fuchs, R. Are animals in zoos rather conspicuous than endangered? In Endangered Species—New Research; Columbus, A.M., Kuznetsov, L., Eds.; Nova Science Publishers, Inc.: New York, NY, USA, 2009; pp. 299–341. [Google Scholar]
  29. Lišková, S.; Frynta, D. What determines bird beauty in human eyes? Anthrozoös 2013, 26, 27–41. [Google Scholar] [CrossRef]
  30. Ward, P.I.; Mosberger, N.; Kistler, C.; Fischer, O. The relationship between popularity and body size in zoo animals. Conserv. Biol. 1998, 12, 1408–1411. [Google Scholar] [CrossRef]
  31. Samples, K.C.; Dixon, J.A.; Gowen, M.M. Information disclosure and endangered species valuation. Land Econ. 1986, 62, 306–312. [Google Scholar] [CrossRef]
  32. Small, E. The new Noah’s Ark: Beautiful and useful species only. Part 1. Biodiversity conservation issues and priorities. Biodiversity 2011, 12, 232–247. [Google Scholar] [CrossRef]
  33. Small, E. The new Noah’s Ark: Beautiful and useful species only. Part 2. The chosen species. Biodiversity 2012, 13, 37–53. [Google Scholar] [CrossRef]
  34. Prokop, P.; Fančovičová, J. Animals in dangerous postures enhance learning, but decrease willingness to protect animals. Eurasia J. Math. Sci. Technol. Educ. 2017, 13, 6069–6077. [Google Scholar] [CrossRef]
  35. Knight, A.J. “Bats, snakes and spiders, Oh my!” How aesthetic and negativistic attitudes, and other concepts predict support for species protection. J. Environ. Psychol. 2008, 28, 94–103. [Google Scholar] [CrossRef]
  36. Clucas, B.; McHugh, K.; Caro, T. Flagship species on covers of US conservation and nature magazines. Biodivers. Conserv. 2008, 17, 1517–1528. [Google Scholar] [CrossRef]
  37. Fa, J.E.; Gusset, M.; Flesness, N.; Conde, D.A. Zoos have yet to unveil their full conservation potential. Anim. Conserv. 2014, 17, 97–100. [Google Scholar] [CrossRef] [Green Version]
  38. Balmford, A.; Leader-Williams, N.; Green, M.J.B. Parks or arks: Where to conserve threatened mammals? Biodivers. Conserv. 1995, 4, 595–607. [Google Scholar] [CrossRef]
  39. Frynta, D.; Šimková, O.; Lišková, S.; Landová, E. Mammalian collection on Noah’s ark: The effects of beauty, brain and body size. PLoS ONE 2013, 8, e63110. [Google Scholar] [CrossRef]
  40. Walpole, M.J.; Leader-Williams, N. Tourism and flagship species in conservation. Biodivers. Conserv. 2002, 11, 543–547. [Google Scholar] [CrossRef]
  41. Colléony, A.; Clayton, S.; Couvet, D.; Saint Jalme, M.; Prévot, A.C. Human preferences for species conservation: Animal charisma trumps endangered status. Biol. Conserv. 2017, 206, 263–269. [Google Scholar] [CrossRef] [Green Version]
  42. Fančovičová, J.; Prokop, P.; Repáková, R.; Medina-Jerez, W. Factors Influencing the Sponsoring of Animals in Slovak Zoos. Animals 2021, 12, 21. [Google Scholar] [CrossRef]
  43. Balding, M.; Williams, K.J. Plant blindness and the implications for plant conservation. Cons. Biol. 2016, 30, 1192–1199. [Google Scholar] [CrossRef]
  44. Fančovičová, J.; Prokop, P.; Kubíčková, M. The Effect of Aposematic Signals of Plants on Students’ Perception and Willingness to Protect Them. Sustainability 2022, 14, 9121. [Google Scholar] [CrossRef]
  45. Macdonald, E.A.; Hinks, A.; Weiss, D.J.; Dickman, A.; Burnham, D.; Sandom, C.J.; Malhi, Y.; Macdonald, D.W.; Macdonald, D.W. Identifying ambassador species for conservation marketing. Glob. Ecol. Conserv. 2017, 12, 204–214. [Google Scholar] [CrossRef]
  46. Jones, K.E.; Bielby, J.; Cardillo, M.; Fritz, S.A.; O’Dell, J.; Orme, C.D.L.; Safi, K.; Sechrest, W.; Boakes, E.H.; Carbone, C.; et al. PanTHERIA: A species-level database of life history, ecology, and geography of extant and recently extinct mammals: Ecological Archives E090-184. Ecology 2009, 90, 2648. [Google Scholar] [CrossRef] [Green Version]
  47. Smith, R.J.; Veríssimo, D.; Isaac, N.J.; Jones, K.E. Identifying Cinderella species: Uncovering mammals with conservation flagship appeal. Conserv. Lett. 2012, 5, 205–212. [Google Scholar] [CrossRef] [Green Version]
  48. Tang, M.; Bever, J.D.; Yu, F.H. Open access increases citations of papers in ecology. Ecosphere 2017, 8, e01887. [Google Scholar] [CrossRef] [Green Version]
  49. Prokop, P.; Özel, M.; Uşak, M. Cross-cultural comparison of student attitudes toward snakes. Soc. Anim. 2009, 17, 224–240. [Google Scholar]
  50. Rádlová, S.; Janovcová, M.; Sedláčková, K.; Polák, J.; Nácar, D.; Peléšková, Š.; Frynta, D.; Landová, E. Snakes represent emotionally salient stimuli that may evoke both fear and disgust. Front. Psychol. 2019, 10, 1085. [Google Scholar] [CrossRef] [Green Version]
  51. Prokop, P.; Fančovičová, J. Tolerance of amphibians in Slovakian people: A comparison of pond owners and non-owners. Anthrozoos 2012, 25, 277–288. [Google Scholar] [CrossRef]
  52. Frynta, D.; Peléšková, Š.; Rádlová, S.; Janovcová, M.; Landová, E. Human evaluation of amphibian species: A comparison of disgust and beauty. Sci. Nat. 2019, 106, 41. [Google Scholar] [CrossRef]
  53. Carr, N. An analysis of zoo visitors’ favourite and least favourite animals. Tour. Manag. Perspect. 2016, 20, 70–76. [Google Scholar] [CrossRef]
  54. Kinchin, I.M. Investigating secondary-school girls’ preferences for animals or plants: A simple ‘head-to-head’ comparison using two unfamiliar organisms. J. Biol. Educ. 1999, 33, 95–99. [Google Scholar]
  55. Balas, B.; Momsen, J.L. Attention “blinks” differently for plants and animals. CBE Life Sci. Educ. 2014, 13, 437–443. [Google Scholar] [CrossRef] [Green Version]
  56. Link-Perez, M.A.; Dollo, V.H.; Weber, K.M.; Schussler, E.E. What’s in a Name: Differential Labelling of Plant and Animal Photo-graphs in Two Nationally Syndicated Elementary Science Textbook Series. Int. J. Sci. Educ. 2010, 32, 1227–1242. [Google Scholar] [CrossRef]
  57. Flores-Palacios, A.; Valencia-Díaz, S. Local illegal trade reveals unknown diversity and involves a high species richness of wild vascular epiphytes. Biol. Cons. 2007, 136, 372–387. [Google Scholar] [CrossRef]
  58. Oberhauser, K.; Guiney, M. Insects as flagship conservation species. Terr. Arthropod. Rev. 2009, 1, 111–123. [Google Scholar] [CrossRef]
  59. Schlegel, J.; Rupf, R. Attitudes towards potential animal flagship species in nature conservation: A survey among students of different educational institutions. J. Nat. Conserv. 2010, 18, 278–290. [Google Scholar] [CrossRef]
  60. Albert, C.; Luque, G.M.; Courchamp, F. The twenty most charismatic species. PLoS ONE 2018, 13, e0199149. [Google Scholar] [CrossRef] [Green Version]
  61. May, R.M. How many species are there on earth? Science 1988, 241, 1441–1449. [Google Scholar] [CrossRef]
  62. Christenhusz, M.J.; Byng, J.W. The number of known plants species in the world and its annual increase. Phytotaxa 2016, 261, 201–217. [Google Scholar] [CrossRef] [Green Version]
  63. Froese, R.; Pauly, D. Fish Base—World Wide Electronic Publication (ver. 6/2022). Available online: https://www.fishbase.se/search.php (accessed on 18 November 2022).
  64. Abramo, G.; Cicero, T.; D’Angelo, C.A. A sensitivity analysis of researchers’ productivity rankings to the time of citation observation. J. Informetr. 2012, 6, 192–201. [Google Scholar] [CrossRef] [Green Version]
  65. González-Suárez, M.; Revilla, E. Variability in life-history and ecological traits is a buffer against extinction in mammals. Ecol. Lett. 2013, 16, 242–251. [Google Scholar] [CrossRef] [PubMed] [Green Version]
  66. Tahantan, I.; Afshar, A.S.; Ahamdzadeh, K. Factors affecting number of citations: A comprehensive review of the literature. Scientometrics 2016, 107, 1195–1225. [Google Scholar] [CrossRef]
Figure 1. Occurrence of the investigated taxa on the cover pages in the three journals between 2011 and 2020.
Sustainability 14 17029 g001
Figure 2. Differences in altmetrics (AAS) among the major taxa (means ± 95% CI).
Sustainability 14 17029 g002
Figure 3. Differences in the total number of citations among the major taxa (means ± 95% CI).
Sustainability 14 17029 g003
Table 1. The frequency of papers published on each taxon.
n%
mammals52725.5
plants40819.7
birds40219.4
invertebrates38918.8
fish21810.5
amphibians763.7
reptiles492.4
Table 2. Descriptive statistics for the AAS for all taxa (means and ±95% CI). Differences in the AAS between all taxonomic groups are significant at p < 0.01 and less.
MammalsInvertebratesFishBirdsReptilesPlantsAmphibians
Mean5242.437.438.831.323.922.9
Lower CI39.930.325.326.719.211.910.8
Upper CI6454.549.350.943.43635
Table 3. Descriptive statistics for the total number of citations for all taxa (means and ±95% CI). Different letters denote significant differences based on contrast analysis. All differences are significant at p < 0.001.
Mammals aInvertebrates aFish bBirds cReptiles dPlants eAmphibians a
Mean28.627.923.922.219.725.727.5
Lower CI27.426.722.721.618.124.525.9
Upper CI29.729.125.223.321.326.829
Publisher’s Note: MDPI stays neutral with regard to jurisdictional claims in published maps and institutional affiliations.

