Article

Birds’ Flight Initiation Distance in Residential Areas of Beijing Are Lower than in Pristine Environments: Implications for the Conservation of Urban Bird Diversity

1
Research Institute of Forestry, Chinese Academy of Forestry, Beijing 100091, China
2
Key Laboratory of Tree Breeding and Cultivation and Urban Forest Research Centre, National Forestry and Grassland Administration, Beijing 100091, China
*
Author to whom correspondence should be addressed.
Sustainability 2023, 15(6), 4994; https://doi.org/10.3390/su15064994
Submission received: 11 February 2023 / Revised: 5 March 2023 / Accepted: 8 March 2023 / Published: 10 March 2023
(This article belongs to the Special Issue Wildlife Conservation: Managing Resources for a Sustainable World)

Abstract

:
(1) Background: With rapid urbanization, birds are facing a variety of challenges. Evaluating bird behaviour changes in response to urbanization can help us understand how to make them coexist sustainably with humans. We aimed to investigate whether birds inhabiting residential areas differed in their escape behaviour and their influencing factors. (2) Methods: We used the flight initiation distance (FID), the horizontal distance between the observer and the target bird when it escapes, to measure the escape behaviour of birds. We chose 40 urban residential areas within the 5th ring road in Beijing and conducted surveys each month for one year. We applied Generalized Linear Mixed Models (GLMMs) separately to evaluate the response variable of FID for the total species, the most common species, and the other species. (3) Results: Birds that appear more frequently in residential areas or as ground foragers, insectivores, and omnivores are better adapted to human interference and have shorter FIDs. Individual initial conditions affect bird FID, and environmental characteristics can be used as predictors for the most common birds. Tree canopy coverage was found to positively affect FID, while floor area ratio (FAR) is negatively correlated with FID. (4) Conclusions: Our results demonstrated that birds in residential areas have been adapting to the human environment, and urban tree canopies can provide refuge for birds to avoid human interference. Our study focused on the response of bird FIDs to human interference and urban trees under high urbanization, which has substantial practical implications for urban managers to improve habitat quality to ensure that birds coexist with human beings.

1. Introduction

Urban green spaces, with refuges, stepping stones, and abundant food sources, provide habitats for birds; and birds represent the primary type of wildlife that people engage with on a daily basis [1]. With rapid urbanization, an increasing number of people live in cities, and birds face a variety of challenges. Urban environments are heterogeneous, therefore, birds living in proximity to humans have to adapt to local conditions by altering their behavioural response to human interference [2]. Evaluating how bird behaviour changes in response to urbanization informs our understanding of how species respond to human-induced environmental changes [3]. Birds can be categorized into three types based on their response to urbanization: urban avoiders, urban adapters, and urban exploiters [4]. Adapters and exploiters adapt to highly urbanized areas by interacting with humans [5,6]. A critical trait of such birds is the ability to tolerate high levels of disturbing stimulation by humans [4]. Successful urban species modify their escape behaviour in response to new conditions, as evolutionary mismatches between fear responses and environmental conditions are likely to have negative fitness consequences [3].
Escape behaviour is a typical adaptive behaviour that follows vigilance, and many response distances can be used as a quantitative measure of a bird’s tolerance to human-caused disturbances [7,8,9,10,11]. Different response distances of birds facing risks [8,12,13], including start distance (SD), detection distance (DD), physiological initiation distance (PID), alarm distance (AD), flight initiation distance (FID), and flight distance (FD), can partly represent their ability to perceive risks and escape behaviour. These parameters reflect the level of dependence and adaptability of birds to humans [14]. FID—the distance at which the bird moves away in response to the approach of a perceived threat—has been used to define a minimal setback distance and provide a measurement of risk-taking behaviour [3,9,10,15,16]. FID is a balance of optimization of benefits associated with escape weighed against disturbances (such as loss of feeding opportunity and energy cost of flight), which may vary with ambient conditions [17,18]. FID indicates how well a species or population has adapted to chronic environmental stress [19].
Among all response distances, SD, AD, and FID are the most frequently used for measuring escape behaviour. Some studies have suggested that FID is positively correlated with SD and AD [20,21]. Nevertheless, the relationship between SD and FID is not present under low perceived risk of predation, and birds are more relaxed in urban habitats with friendly people [22,23,24,25]; this may generate a spurious positive relationship between FID and SD [20]. Compared with AD, FID is the most visible and directly measurable behavioural response that can be observed plainly through the behaviour change of birds taking off suddenly. Therefore, we only chose FID as the most reliable response variable in this study.
Different stimulations faced by individuals influence their behaviour. Different stimulus types include vehicles (walk, bicycle, vehicle, motorcycle) [26,27,28,29], approach speeds or direction [30,31,32], colour of clothes [25], and noise [1]. Bicycles evoke longer FIDs than pedestrians [26], and photography was associated with longer FIDs [33]. In general, intense stimulation led to lower bird FIDs and led to complete escape. Human feeding behaviour and abundance of food in cities result in lower bird FIDs [14,22]. Birds may become habituated to certain continuous stimulations or disturbances, depending on their experience shaped by behavioural flexibility and phenotypic plasticity [4,6,19,22,34]. Considering flexible behaviour and gradual adaptation to the habitat, it is necessary to explore the bird behaviour response to human disturbance in residential areas: adapting or escaping.
Among these external factors, many studies focus on macro differences between urban and rural areas [5,19,24,25,35,36], which illustrates that birds adapt to urbanization by changing escape behaviour when facing people or potential predators [4]. Species living in closed habitats are likely to have smaller FIDs, and those residing in open habitats should have greater opportunities for trade-offs. Habitat was classified as open grassland, shrubs, trees, forests [37,38,39]. There is a lack of detailed quantitative habitat variables to study FID responses to different habitats. Urban trees provide habitat and shelter for birds from predators and human interference. We added quantitative variables using tree canopy coverage to reflect habitat characteristics.
Beijing is an important node for bird migration, with a large number of birds. There are 503 species (List of terrestrial wildlife in Beijing (2021) (http://yllhj.beijing.gov.cn/ztxx/ysdw/ml/202110/t20211027_2522201.shtml, accessed on 1 March 2023)) in Beijing and 448 species (http://www.birdreport.cn/, accessed on 1 March 2023) in the downtown area, of which about 100 species (https://www.fx361.com/page/2016/0307/3276550.shtml, accessed on 1 March 2023) are common species. Although FID has been relatively well studied in birds, there is a lack of experimental studies clarifying birds FID in residential areas. We aimed to test whether birds inhabiting residential areas differed in their escape behaviour (measured as FID), and whether birds modified and optimized their FID when facing human residential areas with different external environment and tree canopy coverage. By increasing the individual initial conditions, we also generated an effect related to the initial conditions. We hypothesized that differences in individual and external environmental characteristics can affect the responses of birds. We applied a mixed model approach and compared FID between bird species, focusing on the relative importance of factors, including frequency, initial behaviour, height, visibility, floor area ratio, adjacent road ratio, and canopy coverage, on the escape behaviour of birds. We focused on the implications of urban human settlements with different tree canopy coverage that alter bird behaviour in the context of human wildlife interactions. Data were collected from residential areas in the main unban area of Beijing, which is a relatively closed and independent residential area with complete infrastructure.

2. Materials and Methods

2.1. Study Area and Sampling Sites

Beijing (39°28′–41°05′ N, 115°20′–117°30′ E) is the capital of China, spanning 16,410.54 km2 and with a population of 21.89 million people in 2020 (http://www.stats.gov.cn/tjsj/, accessed on 25 January 2023). Beijing has the sub-humid and semi-arid continental monsoon climate of the northern temperate zone, with four distinct seasons (average annual temperature of 12.06°and average annual rainfall of 545.3 mm from 1978; http://tjj.beijing.gov.cn/, accessed on 25 January 2023). The study area contained the main urban area within the 5th ring road in Beijing (667.35 km2). We chose 40 urban residential areas distributed evenly along eight radiation directions within the 5th ring road as sample sites (Figure 1, Table S1). All studied residential areas are relatively closed and independent settlements with similar urban infrastructure (multi-story houses, concrete buildings, central squares, green space, gardens, etc.) and are surrounded by urban roads, green spaces, and buildings.

2.2. Field Surveys

During the entire year from June 2020 to May 2021, our survey was conducted on weekdays to reduce the fluctuation of pedestrian volume and from 7:00 to 10:00 on sunny days, when birds were most active. Each residential area was sampled once per month. We focused on birds that were foraging or engaged in “relaxed behaviour,” such as preening or roosting. Neither highly vigilant and obviously alarmed birds, nor nesting birds were approached [40]. Any flight due to obvious relocation for foraging or other disturbances was not recorded [9]. The distance to the closest individual was determined when a group of birds was encountered [19]. We chose transects mainly along the walkway at each site covering the entire area. When a target bird was located with a pair of binoculars, the observer approached the bird by walking toward it in a straight line at a constant speed of 0.5 m/s [41]. Before data collection, the observer was trained to maintain a consistent stride length and a constant pace. FID was recorded as the horizontal distance between the observer and the target bird when it flew, ran, or hopped in response to being approached [34], using a laser rangefinder (Trupulse 200). During each survey, we avoided re-sampling individuals by focusing on birds in different geographic locations and not re-sampling the same location repeatedly. In addition, observers wore similar drab clothing across all surveys to control for the confounding effects of observer appearance on FID data. We eliminated the Eurasian Tree Sparrow (Passer montanus) to avoid influencing the results which have already adapted to the urban artificial environment.

2.3. Variables Collection

A total of 7 variables were used to characterize each individual or environmental characteristic of the 40 sampling sites. They were classified into three different groups: species frequency (1 variable), individual initial condition (3 variables), and external environment characteristics (3 variables) (Table 1).

2.3.1. Species Frequency

Species frequency was recorded as the total number of individuals of each species during the survey at all sites. In order to facilitate the analysis, we also classified species frequency into four levels: the most common (MCS, n ≥ 200), common (CS, 50 ≤ n < 200), rare (RS, 10 ≤ n < 50), and extremely rare (ERS, n < 10).

2.3.2. Individual Initial Conditions

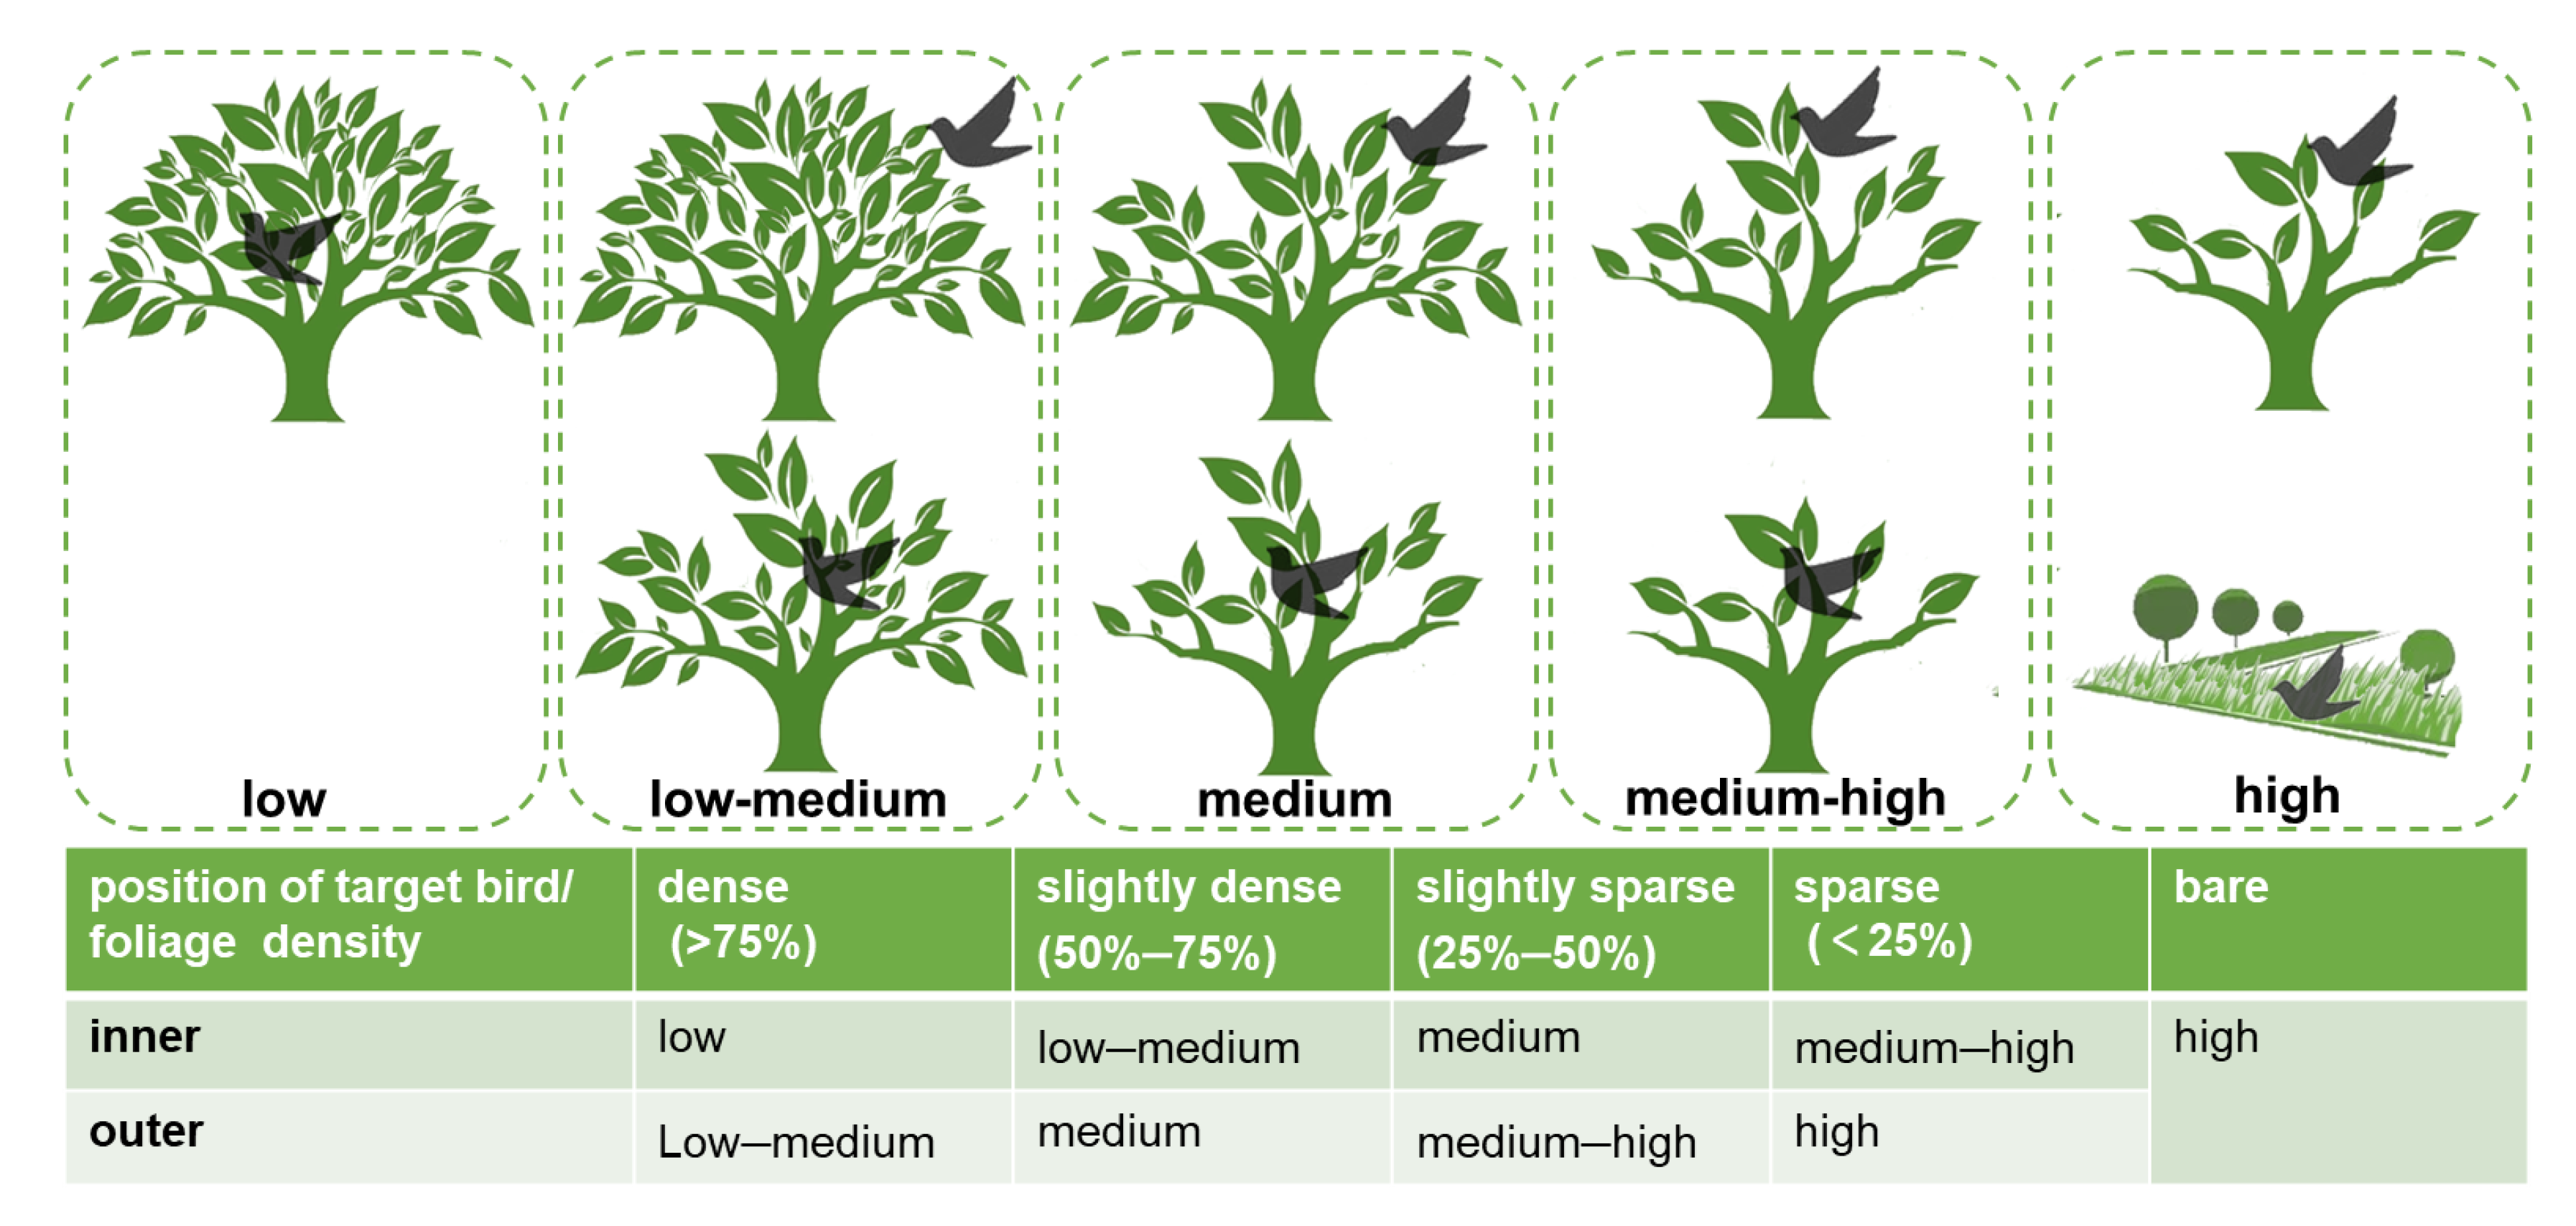
Unlike previous studies that only focused on individuals on the ground or in an open space to avoid the effects of height and vegetation cover [21,24], we also recorded the height of the ground where the target bird was on the ground or in a tree at the start of the approach [16], and classified birds’ initial behaviours into forage, feed, drink, perch, walk, and play [3]. Similar to habitat openness [40,41], we defined the visibility level for the individuals who were approached. Visibility level was classified based on the foliage density of a tree or shrub estimated by the eye where the target bird was perched and the position of the target bird in the vegetation (Figure 2): low, low-medium, medium, medium-high, and high (bare vegetation, open lawn, or ground without any shelter). All information was collected by one person to avoid inter-observer variation [8].

2.3.3. External Environment Characteristics

External environment characteristics were calculated based on the visual interpretation method using satellite imagery from Google Earth (September 2019) and combined with field investigation for each site. The floor area ratio of buildings was calculated by dividing the total floor area by the area of each site, which reflected the overall environment and population density. Considering the impact of the surrounding environment on the residential district, the adjacent road ratio was defined as the proportion of urban main and secondary roads adjacent to the residential district, which was equal to the road length divided by the perimeter of each site. The tree canopy coverage ratio was increased to reflect the environment for each site and was equal to the area covered by the tree canopy divided by the area of each site, which could also provide refuges for birds.

2.4. Data Analysis

All statistical analyses were performed using the R version 4.0.3. Firstly, we found the data did not conform to the normal distribution with the Shapiro–Wilk test and still presented an abnormal distribution after log transformation. Therefore, we chose the Kruskal–Wallis non-parametric test method to compare bird FID among different groups, including residence type, frequency level, diet [42], foraging site [1], visibility level, and initial behaviour. We also conducted multiple comparisons between each level using Dunn post hoc tests (p-values adjusted with the Benjamini–Hochberg method). A mixed model procedure was applied to study escape behaviour in relation to frequency, individual initial behaviour (height and visibility level), and environmental characteristics (floor area ratio, adjacent road ratio, and canopy coverage). Considering there were significant differences among residence types, we applied generalized linear mixed models (GLMMs) to evaluate the response variables for species with different residence types, but the models did not apply to migratory species in which the best-supported model (the lowest AICc) was without any variables (Table S3). Hence, we applied generalized linear mixed models (GLMMs) separately to evaluate the response variables of bird FID for the total species, the most common species, and the other species. To control for temporal and interspecific variation, we included census months and species as random factors.
All explanatory variables were standardized before the analyses for the comparison of the model parameter estimates. The effects of these explanatory variables on bird FIDs were tested using the model selection procedure. For each model, a multi-model inference procedure was applied using the R MuMIn package. This method allowed us to perform model selection by creating a set of models with all possible combinations of the initial variables and sorting them according to the Akaike information criterion corrected (AICc) fitted with maximum likelihood. We selected all models with ΔAICc < 2 and used the model-averaging approach to estimate the parameters. To evaluate the relative importance of the explanatory variables of bird FIDs, we calculated the relative effect of the parameter estimates for each of the variables among the three models. We also fitted the curves for different variables with 95% confidence intervals. All analyses were run by using the package “lme4” [43], “MuMIn” [44], “ sjPlot “ [45] and “forestplot” [46].

3. Results

3.1. Birds FID in Residential Area

Over the 12 months of the survey, we collected 1360 valid FIDs of 31 species recorded within 40 residential areas (Table S2). Spotted Dove (Streptopelia chinensis) and Azure-winged Magpie (Cyanopica cyanus) were the most abundant bird species recorded, accounting for 24.93% and 22.21% of all individuals, respectively. Light-vented bulbul (Pycnonotus sinensis) and common magpie (Pica pica) were the two other common species.
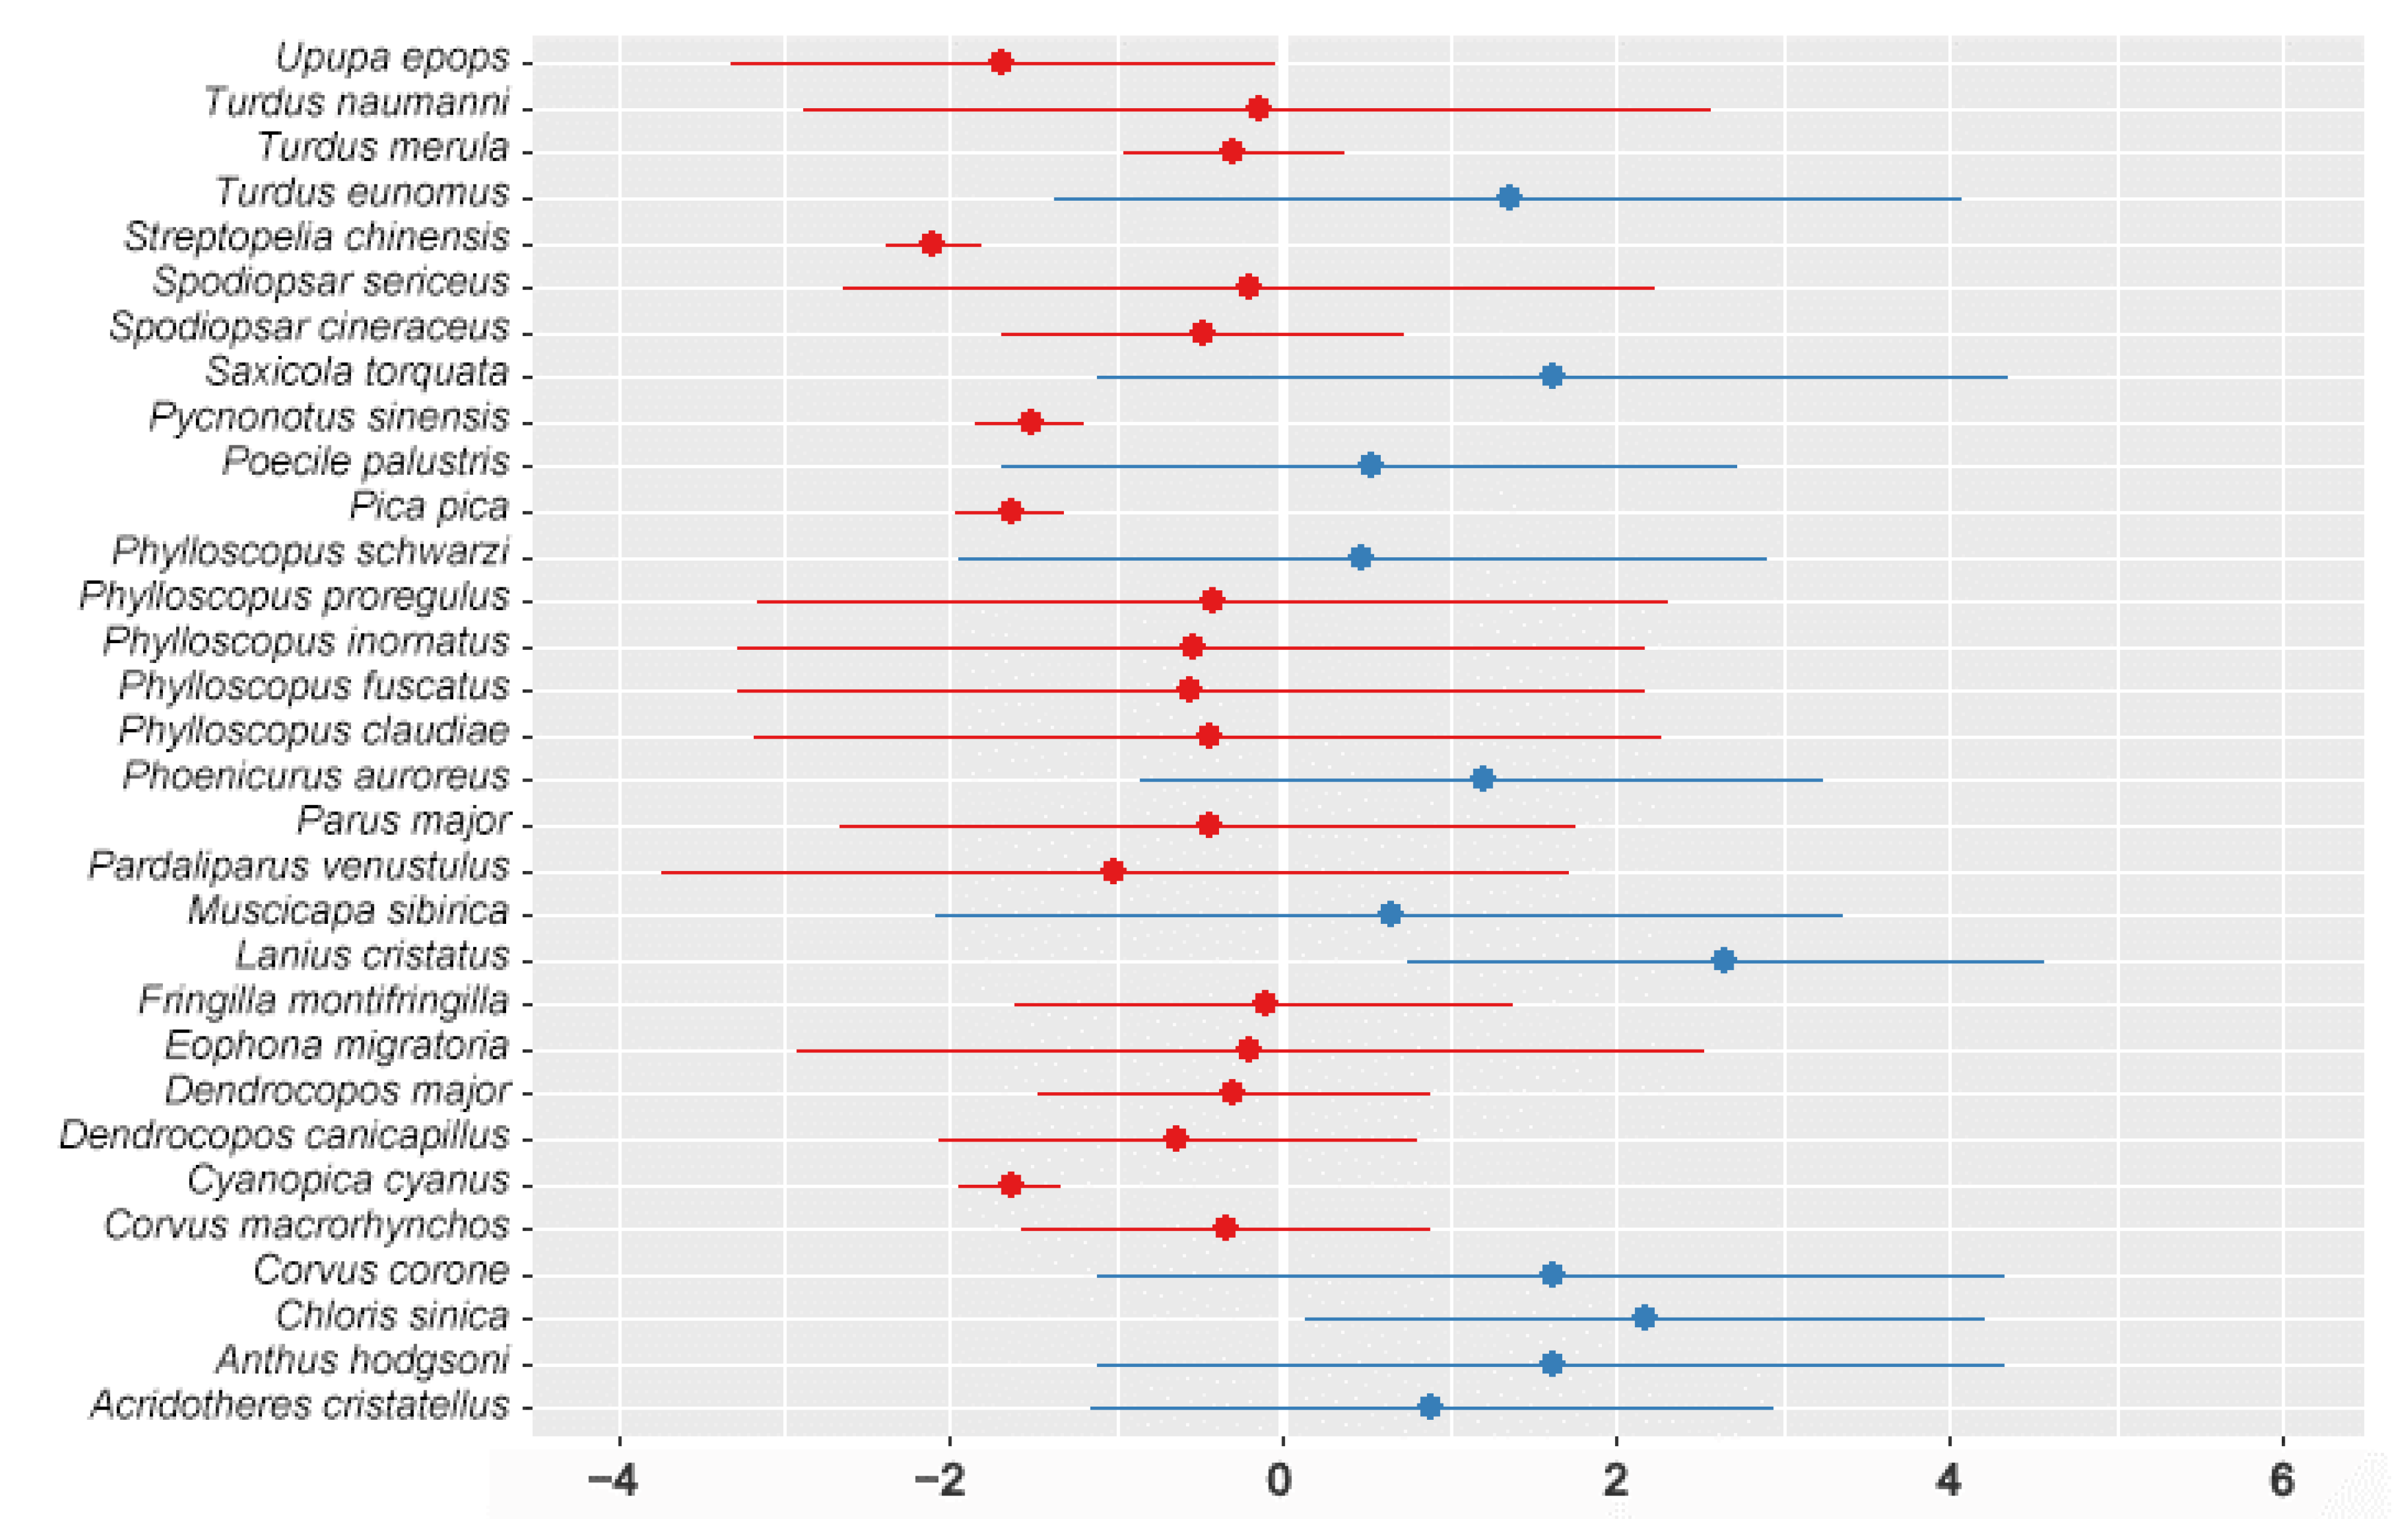
For the pooled data, the estimated mean FID was 8.58 m. A total of 20 species had FIDs shorter than the mean FID, while 11 species had FIDs longer than the mean FID (Figure 3). Some species (e.g., human commensals), such as Spotted Dove, Common Magpie, Azure-winged Magpie, Light-vented Bulbul, and Common Hoopoe (Upupa epops), had FIDs significantly shorter than the mean FID. While some species hardly appeared in the residential areas, such as Grey-capped Greenfinch (Chloris sinica), Brown Shrike (Lanius cristatus) and Daurian Redstart (Phoenicurus auroreus), had longer FIDs (Figure 3). For different residence types, the estimated status mean FID of a resident bird was 7.86 m whereas, for a migratory bird, it was 9.60 m. Similarly, the estimated mean FID of the four most common birds was 6.83 m, whereas for the other species, it was 9.00 m.

3.2. Birds FID of Different Groups

For different bird groups, there were significant differences between the FIDs (Figure 4). The FID of resident birds was significantly shorter than that of migratory birds (including summer breeders, winter visitors, and passengers) (Figure 4A). Similarly, the species that appeared more frequently in residential areas had shorter FIDs. The most common species had FIDs significantly shorter than those of the common and rare species (Figure 4B). For the foraging guilds, birds with different diets had significantly different FIDs. Granivore species had FIDs shorter than those of insectivores and omnivores, and carnivores had the longest (Figure 4C). The FIDs of ground foragers and canopy gleaners were similar, but significantly shorter than that of the hawking flycatcher (Figure 4D).

3.3. Birds FID in Different Initial Conditions

For individual initial conditions, FID also showed a significant difference, which gradually increased significantly with the visibility level of the individual initial location (Figure 4E). Different initial behaviours also affected the FID. Birds with quiet or immersive behaviours (perched, drinking, foraging) had significantly longer FIDs than individuals with dynamic behaviours such as walking and playing (Figure 4F). Birds showed different awareness and vigilance in different conditions.

3.4. Factors Influencing Birds FID

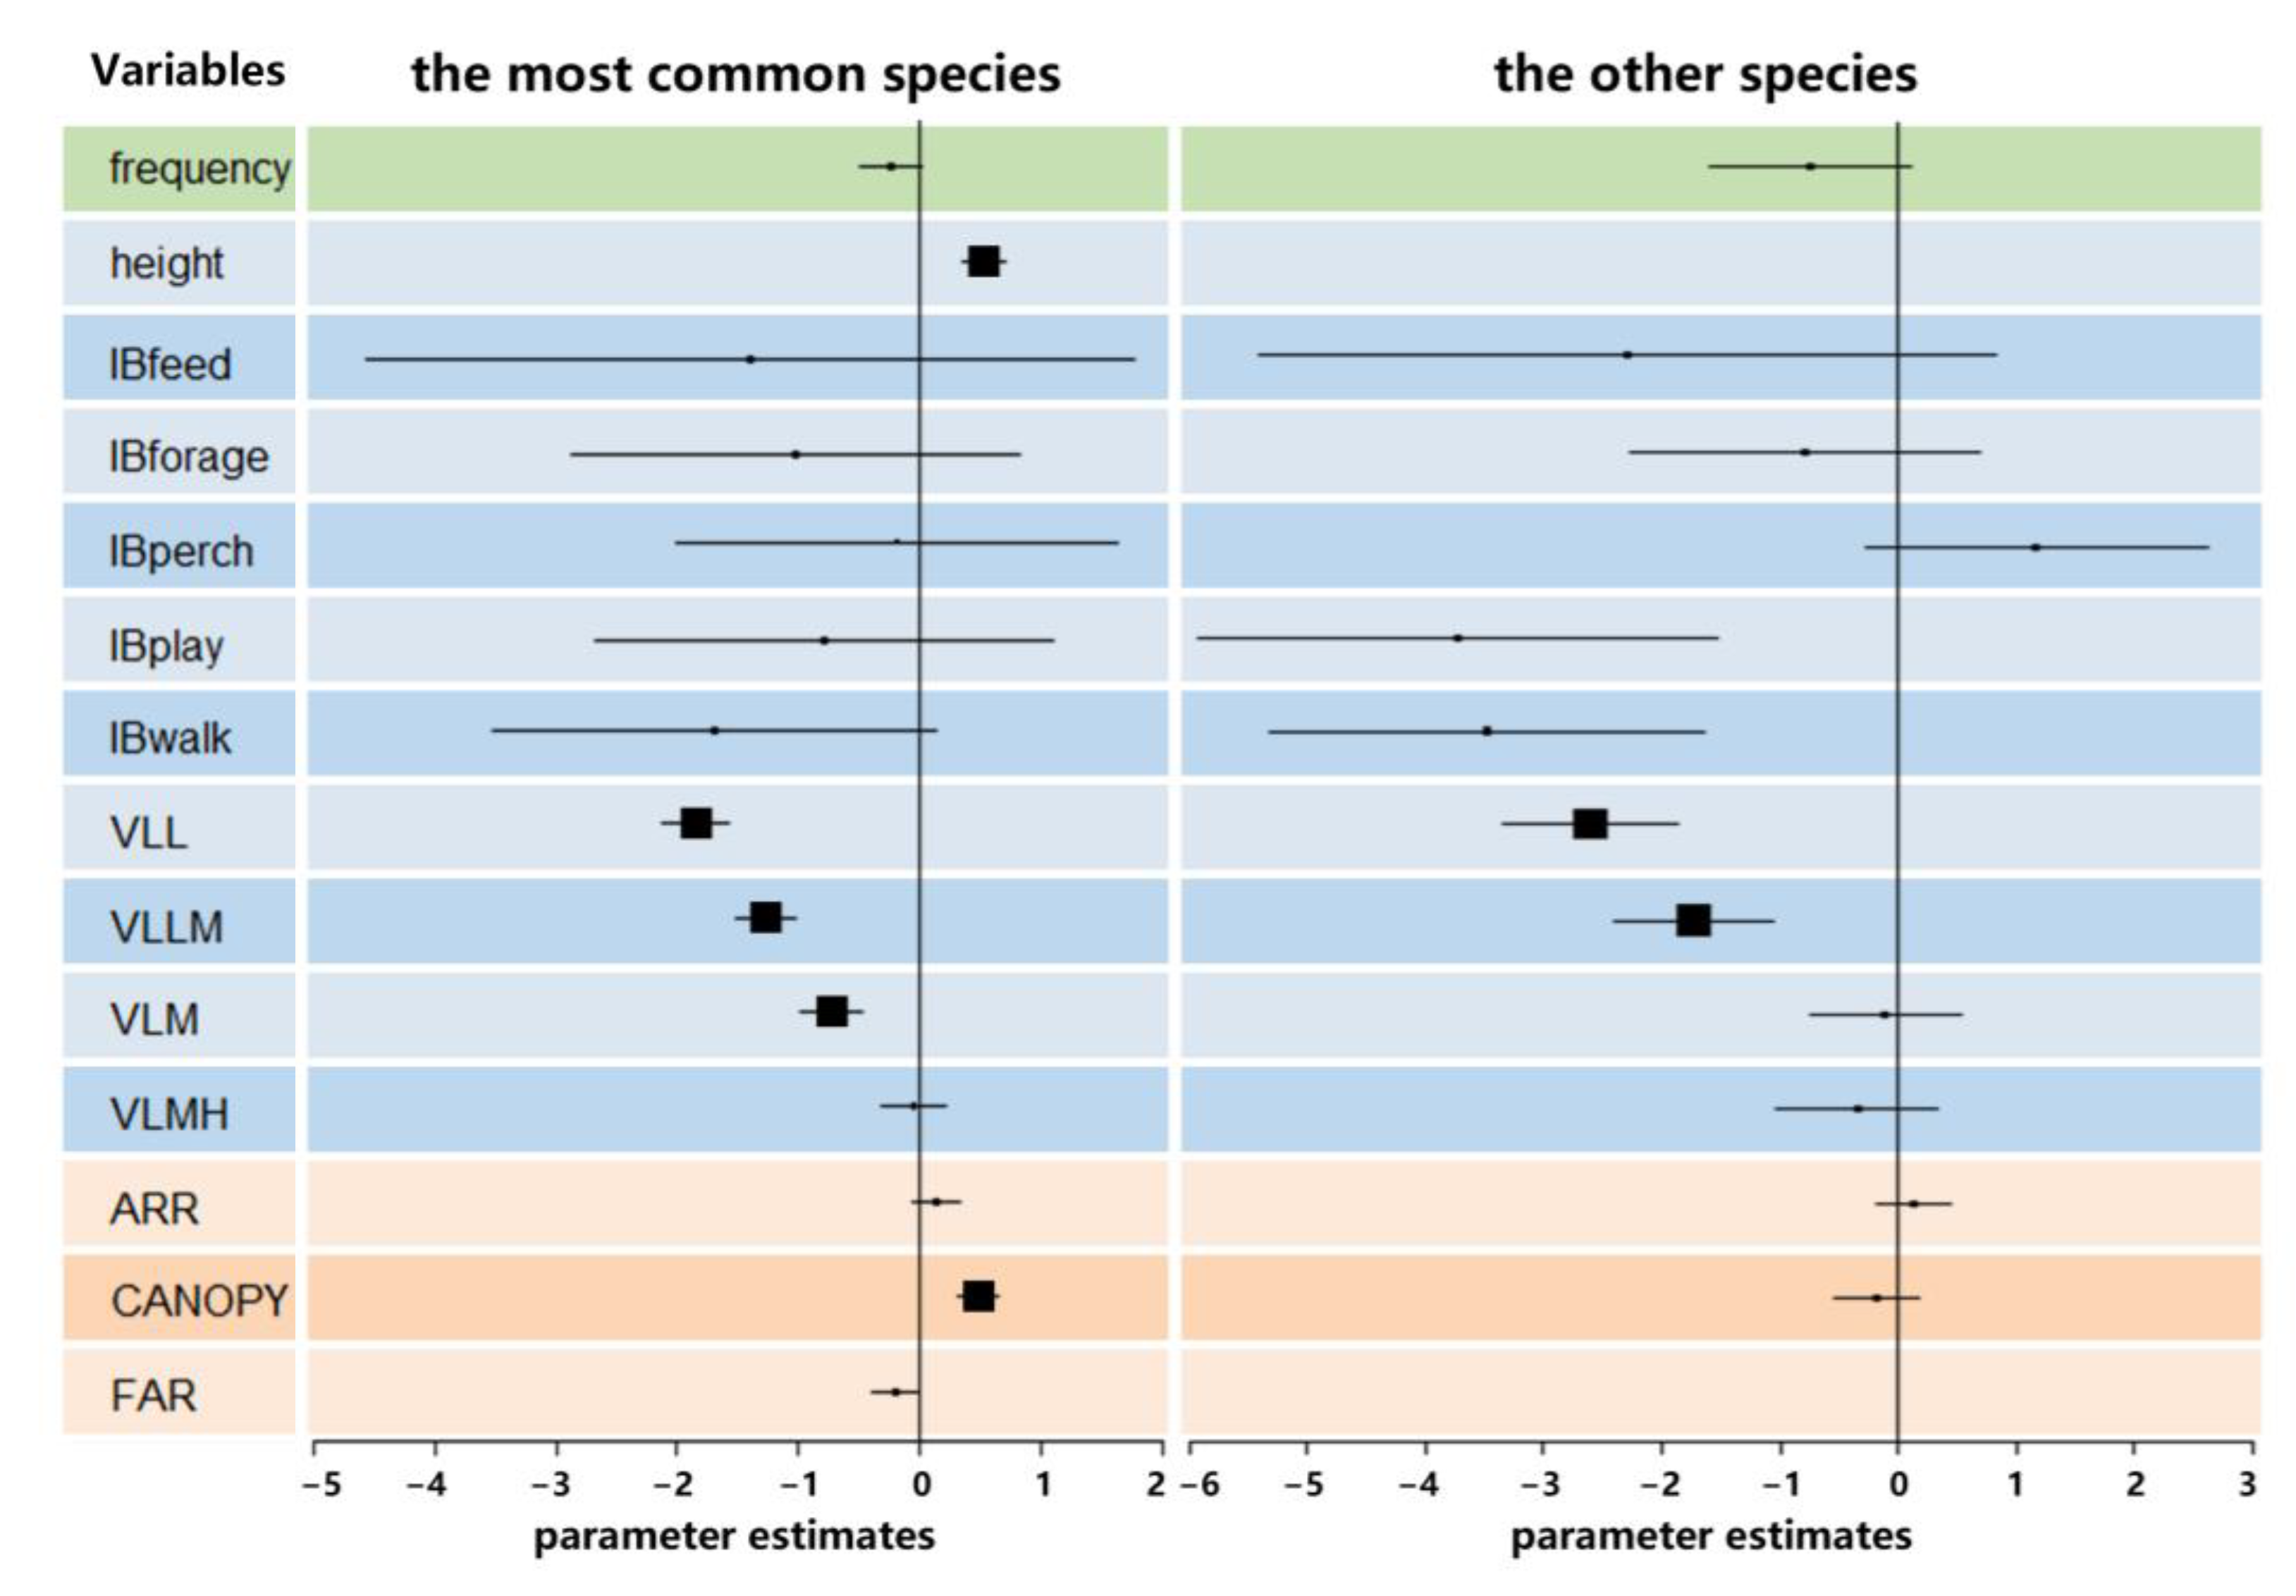
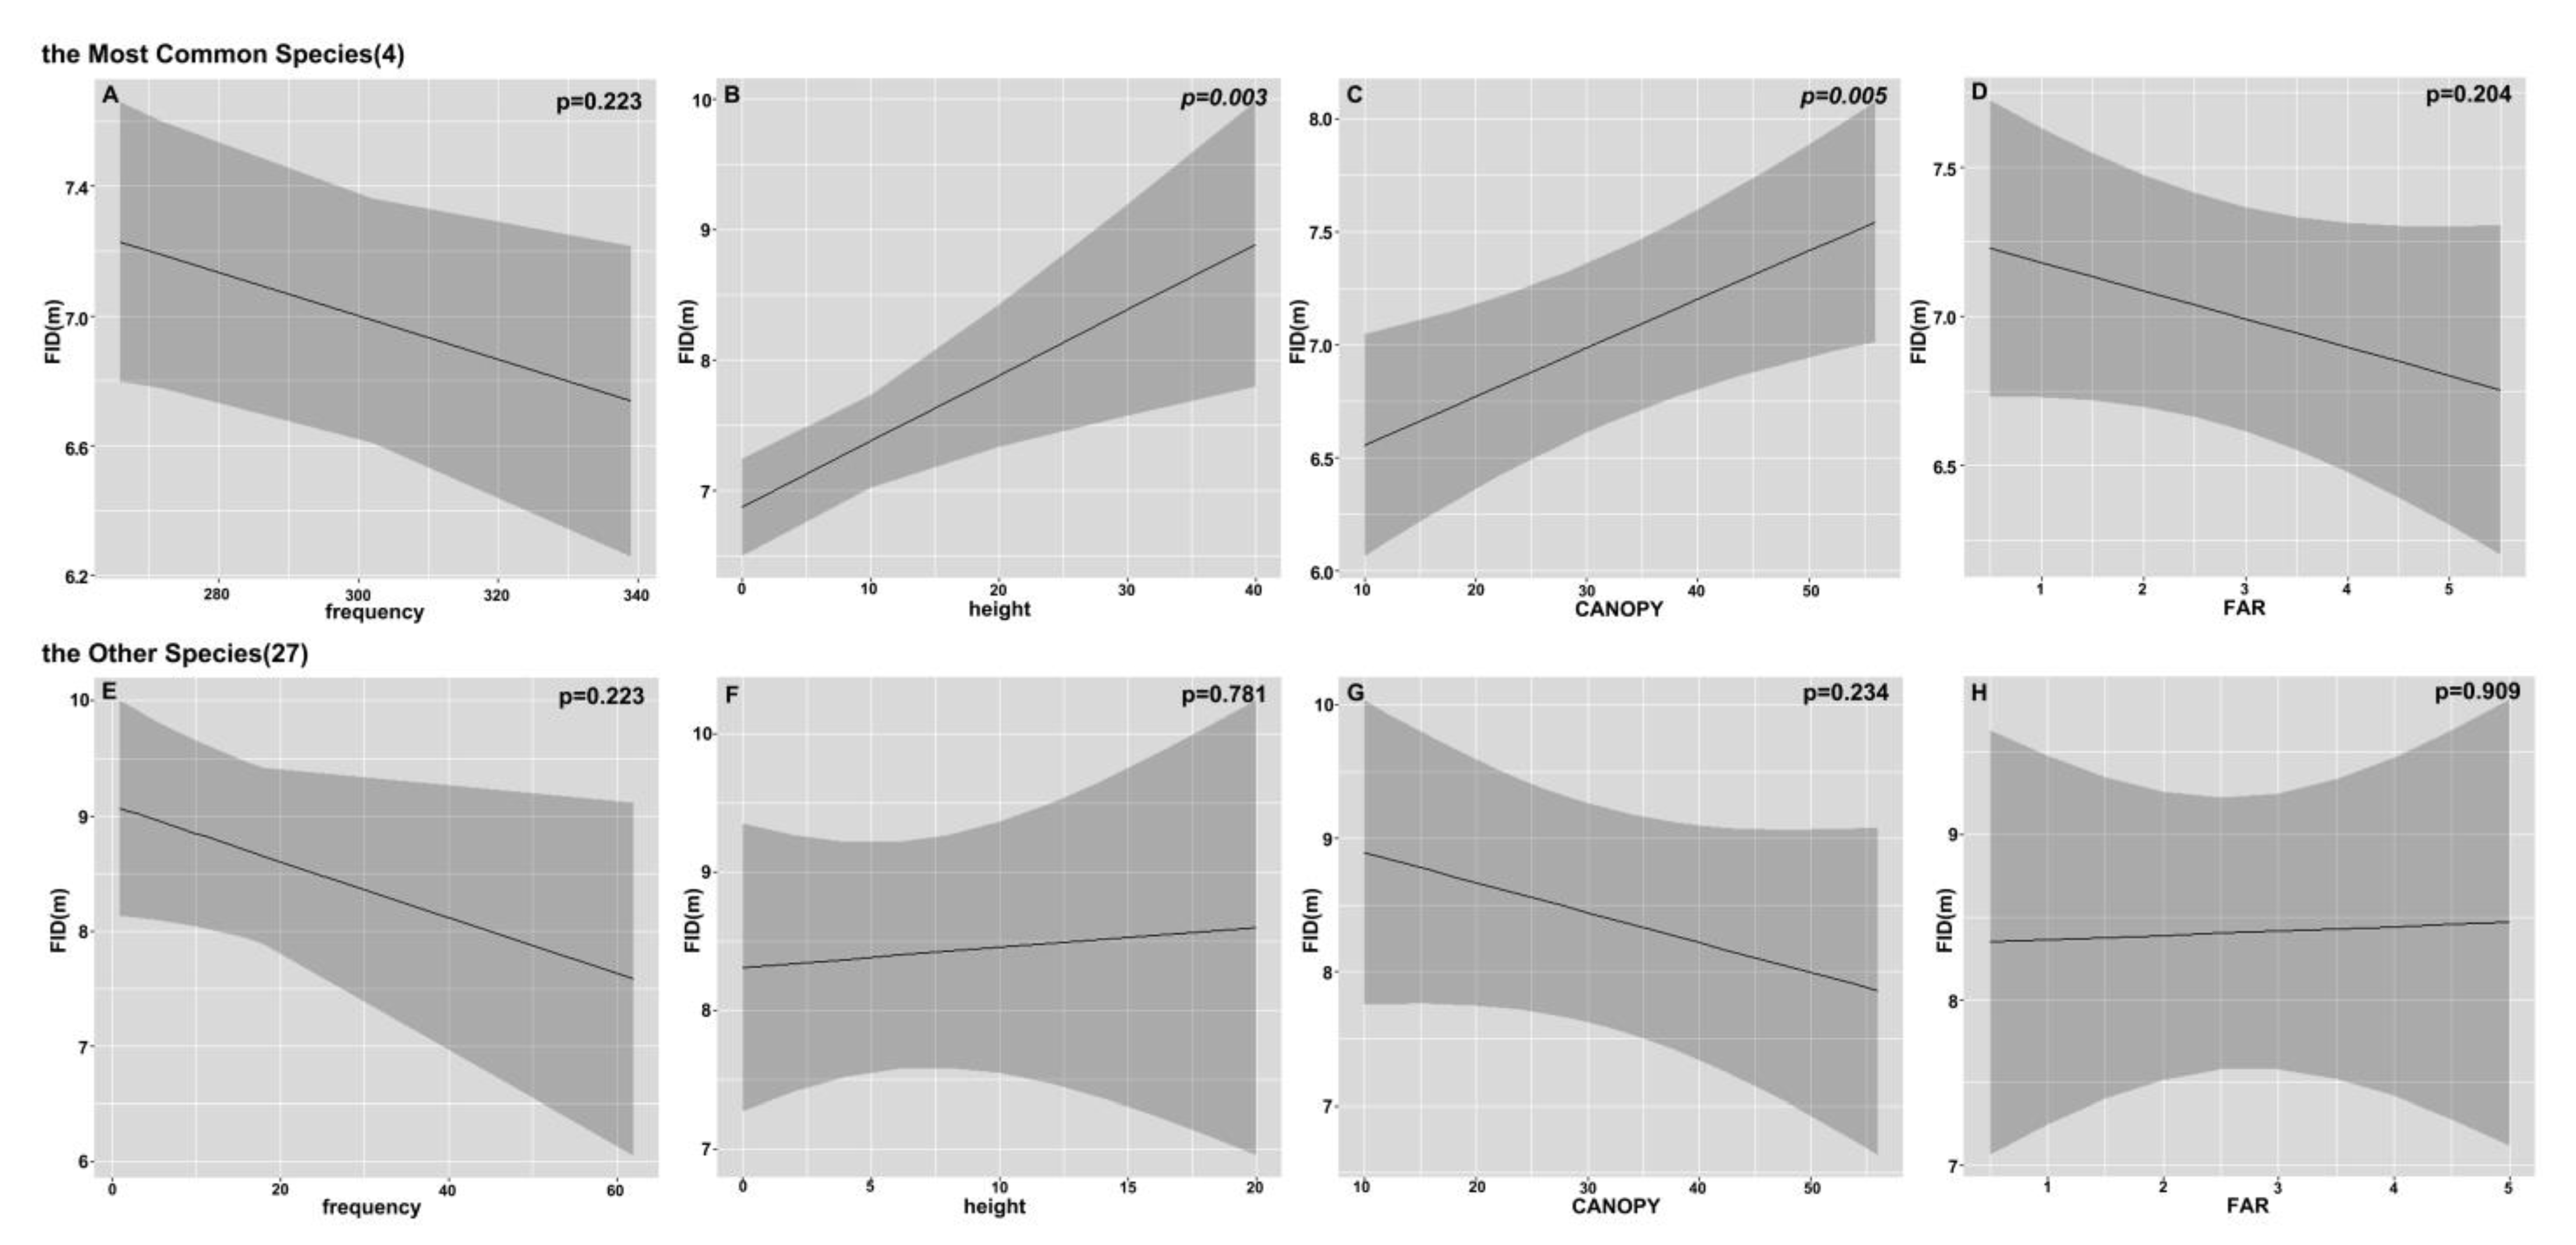
The best models were selected for total species, the most common species, and the other species (Table S4). For the three models, frequency had a significant negative effect on FID (βtotal = −1.22, p < 2 × 10⁻¹⁶, Figure S1), while significance for the latter two models based on frequency was significantly reduced (Figure 5 and Figure 6A–C). The most common species have an overwhelming impact on the total species. We mainly reported the most common species and the other species.
Individual initial conditions had significant effects on FID for the two models. The degree of negative effects decreased significantly with decreased visibility (Figure 5). Initial height had a significant positive effect on the most common species (β = 0.53, p = 0.003; Figure 5 and Figure 6E), while there was no relationship for the other species without convergence (Figure 6F).
For environmental variables, ARR was not included in three best models (Table S4). FID of the most common species increased significantly with tree canopy coverage (β = 0.48, p = 0.004), while the other species decreased marginally (Figure 5 and Figure 6G–I). Although not statistically significant (p > 0.1), the FID of the most common species still decreased with FAR (Figure 5 and Figure 6K).
Height, tree canopy coverage, and FAR were all more significant for the most common bird species than the other species, which indicated that the variables were more applicable to common species than to rare species. The significance of the total species model was reduced by the addition of other species.

4. Discussion

4.1. Birds’ FID in Residential Areas

Birds’ FID in residential areas in this study was lower than that in other habitat types, such as forests, water bodies, gardens, parks [26,35,47,48]. Reducing FID is a strategy to fit urban characteristics, increase tolerance to human presence, and adjust the cost-benefit relationship between the risks of starvation and predation [49]. In the process of urbanization, birds in residential areas mostly play the role of exploiters and adaptors coping with frequent interactions with humans, which ultimately leads to them becoming more tolerant of humans and adapting to coexist [12]. In highly urbanized areas, due to landscape heterogeneity, and environmental complexity (lack of rich vegetation and full of a large number of artificial facilities or human interference), only a few bold birds can adapt to the complex environment and inhabit here [30]. Human commensals are likely to habituate human interference, whereas others are sensitive [50]. Living in urban environments for a long time makes these birds show lower vigilance to humans and shorter FIDs via learning, cognition, and rapid adjustment [32,36]. Food is an important factor in the reduction of FID in urban animals [14,22]. In residential areas, people feed grain or other food to birds, so that they have a friendlier relationship with humans and no longer fear them.
Our results indicated that the frequency of birds’ presence in residential areas showed a negative correlation with FID, and the frequency of birds’ presence was correlated with their residence types. Studies have shown that common birds have shorter FID than threatened birds [51], and FID is negatively correlated with the duration for which the birds have lived in the urban area. Migratory birds have longer FIDs than resident birds [21]. Resident birds (e.g., Spotted Dove, Light-vented Bulbul, and Common Magpie) that have been living in urban areas for a long time, especially in residential areas, have adapted to the environment full of human beings and various complex interferences (people, traffic, noise, etc.). For migratory birds that stay for only several months in summer or winter, the time to adapt is shortest and FID is the longest, while passengers pass through the same place in spring and autumn, so the FID lies in the middle. The FIDs of summer breeders are longer than those of winter visitors, even if they both stay for several months. This may be because summer breeders visit in the breeding season, and are busy hatching, and feeding their young. Additionally, parent birds will maintain higher vigilance to protect their offspring and improve their survival rate [10]. At the same time, when birds are able to meet their daily energy requirements easily in summer, the balance in the trade-off between avoidance of starvation and predation shifts toward greater FIDs [52]. Winter visitors may spend more time and energy on foraging and less on escape flight to reduce energy expenditure in winter when the weather is cold and food is scarce. The FID of birds was longer in autumn and winter [32,52,53]. In general, summer breeders come from lower latitudes, while winter visitors come from higher latitudes. Previous studies have shown that birds at higher latitudes have shorter FIDs than birds at lower latitudes [5,7], and our results also confirm this from another perspective.
In our study, bird species with different food sources and foraging sites showed different FIDs. Granivore species are the most intimate with humans. Some people sprinkle corn, millet, and other grains on their windowsills or on the ground in residential areas. Granivore species mainly forage on the ground, and they are the boldest because of their long adaptation to close contact with human beings [14]. In urban habitats, omnivorous and insectivorous species have shorter FIDs [54]. Insectivores and omnivores mostly live in trees (on trunks like woodpeckers or in the canopy) and eat flower buds, leaf buds, fruits, or insects, and are, therefore, less close to humans than the ground foragers. Aerial foraging species that are less vulnerable to predation have shorter FIDs than other species [39]. In our study, only the Brown Shrike (Lanius cristatus) was recorded among carnivores, which tends to perch on tree tops, pounce on prey, and return to its original position. They are hawking flycatcher-like hunters and exhibit greater alertness. Similar to this foraging pattern and predation behaviour, the Dark-sided Flycatcher (Muscicapa sibirica) was another insectivore we recorded among hawking flycatchers, which are agile and shy. These hawking flycatchers have longer FIDs, which may be due to their hunter-like foraging patterns and high vigilance to both prey and external interference.

4.2. Individual Initial Conditions That Affect Birds’ FID

Our results demonstrated that the initial height of the bird significantly affected the FID. Some studies have shown that the higher the aboveground location of a bird, the shorter is its horizontal FID [16,55]. A higher aboveground might mean increased safety and a reduction in the perceived risk due to vertical relief from the threat [1,41]. Even if the threat does come, they have a longer time to escape because they are farther off the ground. However, in our study, FID increased with height, possibly because birds at higher positions have a wider field of vision and can detect threats in advance. Ground birds that lose the protection of height are exposed to open habitats, making them more likely to be disturbed. It should be noted that ground birds are usually closer to humans (e.g., Spotted Dove and Common Magpie) because foraging for small seeds at the soil surface in open sites makes them adapt to people via habituation [30,56]. Even when a person walks very close to the bird, the bird is completely immersed in the foraging process and is immune to interference.
Unlike previous studies [3], the FID of target birds varied with their initial behaviour. Birds’ tolerance to urban environments is directly linked to habitat choice, resource requirements, reproductive strategy, and survival rate, and keeping vigilant constantly and taking flight are a huge drain and cost at the expense of other activities such as foraging or feeding due to limited energy and attention [18,19,22,49]. Birds may compromise the relationship between foraging or feeding behaviour and perceived risk. Birds exhibiting immersive behaviours (drinking, foraging, or feeding) have shorter FIDs than resting birds (perched) because their attention is used to supplement their energy rather than to keep alert or take flight. In contrast, resting birds have sufficient energy to perceive risk and have longer FIDs. Birds exhibiting dynamic behaviours (walking or playing) are bolder and have shorter FIDs. They are completely lost in their own world, unless people are in very close proximity.
The visibility level is a two-fold “see and been seen” concept, reflecting whether birds can detect people’s approach and whether people can see the hidden bird easily. Birds perching in trees keep away from interference, and the canopy provides refuge for the birds to make them feel safer from being seen [24]. Dense canopies also block the sight of birds, making them less perceptive to dangers around them [40]. Low visibility means that birds in the canopy are not easy to see, and these birds have shorter FIDs, probably because they are not easy to detect. While high visibility means birds are exposed to the open habitat or tree canopy surface even if the tree canopy is without leaves, lack of refuge makes birds detect risks earlier and causes longer FID.

4.3. The Predictors of Birds’ FID among Environmental Characteristics

The adjacent road ratio (ARR) of environmental factors was not included in the models. This may be because bird behaviour is more affected by the internal environmental factors of the residential areas, but is less related to circumjacent environmental factors. These predictors were more applicable to the most common birds than they were to rare birds. Common birds are likely to habituate, whereas rare birds are sensitized to human activity [50]. The most common birds appear more frequently in residential areas and show different adaptability and habituation to different levels of human activity intensity and habitat quality, which are represented by floor area ratio (FAR) and tree canopy coverage in residential areas. Most rare birds are urban avoiders, usually just passing through residential areas during migration. They show a strong fear of artificial environment or human interference and adapt to the environment poorly; therefore, their FIDs are weakly correlated with environmental characteristics. For common birds, the recorded data were sufficient, and the model was more reliable. For uncommon birds, the recorded data amount was smaller and the predictive power of variables decreased significantly, and a conclusion similar to that for common birds could not be drawn. Environmental characteristics can be used as predictors of FID for most common birds.
FAR and tree canopy coverage seem to be partly opposite environmental characteristics, but we cannot simply assume that the two variables have a negative correlation because FAR is affected by the building stories. Among the environmental factors, FAR reflects population density and human interference intensity in residential areas. Although not statistically significant, FID tended to decrease with an increase in FAR. Similar to previous studies [4,12,17,36,48,57], birds in habitats with high population densities may adapt to human interference and have shorter FIDs
Tree canopy coverage reflects the habitat quality of the residential areas. For most bird species, higher tree canopy coverage means more natural and suitable habitats like natural forests and fewer artificial facilities (buildings, roads, parking lots, etc.), making these birds have longer FIDs. At the same time, the tree canopy also provides refuge for birds when faced with risk [40]. Higher tree canopy coverage gives birds more refuge that can be chosen proactively in advance, resulting in a longer FIDs [24]. When tree canopy coverage is low, birds may be passively exposed to open habitats for a long time, and thus have to change their behaviour to adapt to human interference and gradually gain longer FIDs via behavioural flexibility and phenotypic plasticity [30,58,59].
It is worth noting that our predictors have certain limitations because birds’ behaviour is affected by inherent genetic characteristics such as temperament and physiological properties [60]. Species could be a relatively important factor in explaining variations in FID [50]. Given that Eurasian Tree Sparrows (Passer montanus) are found in all residential areas and occupy an extremely dominant position, they are highly adapted to the human environment without distinction. Living closely with human beings for a long time, they have become accustomed to human interference. When people walk by them, or even approach them, such birds continue doing their tasks and are not perturbed. FIDs of sparrows are sometimes even less than one meter, and thus, are very different from those of other bird species, severely affecting the results of this study. Meanwhile, it is difficult to accurately measure the FIDs of sparrows because they like cluster activities and are naturally active and bold [61]. Therefore, the Eurasian Tree Sparrows were ignored in our study.

4.4. Cultivate Big Trees in Planning and Management

Residential green space is an important component of urban green space [62], which is an important activity space and habitat for many urban birds [63]. The urban pattern of plant diversity was significantly affected by land use, and larger tree canopy patches support more diverse species [64]. Urban tree canopy can provide a cooler downtown environment, privacy on larger lots, or reduced noise and pollution from a major road way [65]. Simultaneously, urban tree canopy can provide breeding or foraging habitat for some bird species [66]. Our results show that birds in higher canopy cover have longer FIDs. Studies have shown that conservation of small forest fragments and urban tree cover can benefit migrants including residential areas [67].
Residential area planning should plan green space rationally, cultivate big trees with larger tree canopies and leave enough space and time for small trees to grow. Local managers should ensure trees are healthier and not overdo the pruning. Branches more often being removed for thinning crowns results in narrow crown width [68], which is not benefit to conservation of urban bird diversity. Planners and managers should work together to make cities friendlier to bird.

5. Conclusions

To our knowledge, this is the first study of bird FIDs in residential areas that quantitatively measures environmental factors using FAR and tree canopy coverage. Our results indicate that bird FIDs in residential areas are different among different groups (residence type, frequency, diet, and foraging site). Birds that appear more frequently in residential areas or are ground foragers, insectivores, or omnivores are better adapted to human interference and have shorter FIDs. Further analyses revealed that individual initial conditions affect bird FID, and environmental characteristics (FAR, tree canopy coverage) can be used as predictors for the most common birds. Tree canopy coverage was found to positively affect FID, whereas FAR negatively affected FID.
Our results demonstrated that birds in residential areas have been adapting to the human environment, especially in places with high population density. Urban tree canopies can provide refuge for birds to avoid human interference, and a lower FAR is more habitable for both, birds and people. Our study focused on the response of bird FIDs to human interference and urban trees under high urbanization, which has substantial practical implications for urban residential planners and managers to improve habitat quality and help birds coexist with human beings. Furthermore, other potential factors and response variables should be thoroughly investigated to further our understanding of bird escape behaviour in residential areas.

Supplementary Materials

The following supporting information can be downloaded at: https://www.mdpi.com/article/10.3390/su15064994/s1, Table S1: Summary of sampling sites; Table S2: Summary of the birds’ FIDs collected in residential areas; Table S3: Summary of the final best models within a ∆AICc < 2 for the FIDs of total species, resident species and migratory species; Table S4: Summary of the final best models within a ∆AICc < 2 for the FIDs of total species, the most common species and other species FIDs; Figure S1. Relationships between variables and FID for the total species.

Author Contributions

Conceptualization, C.W. and L.Y.; methodology, L.Y.; software, L.Y.; validation, C.W. and L.Y.; formal analysis, L.Y. and C.W.; investigation, L.Y. and W.H.; resources, C.W.; data curation, L.Y.; writing—original draft preparation, L.Y.; writing—review and editing, C.W. and C.Z.; visualization, L.Y.; Supervision, C.W.; project administration, C.W.; funding acquisition, C.W. and L.Y. All authors have read and agreed to the published version of the manuscript.

Funding

This research was funded by National Non-Profit Research Institutions of the Chinese Academy of F (CAFYBB2022SY006, CAFYBB2020ZB008).

Institutional Review Board Statement

Not applicable.

Informed Consent Statement

Not applicable.

Data Availability Statement

Not applicable.

Acknowledgments

We thank Dan Han for writing advice. We thank anonymous reviewers for comments and suggestions that greatly improved the manuscript.

Conflicts of Interest

The authors declare no conflict of interest.

References

  1. Petrelli, A.R.; Levenhagen, M.J.; Wardle, R.; Barber, J.R.; Francis, C.D. First to Flush: The Effects of Ambient Noise on Songbird Flight Initiation Distances and Implications for Human Experiences with Nature. Front. Ecol. Evol. 2017, 5, 67. [Google Scholar] [CrossRef] [Green Version]
  2. Morelli, F.; Mikula, P.; Benedetti, Y.; Bussière, R.; Jerzak, L.; Tryjanowski, P. Escape behaviour of birds in urban parks and cemeteries across Europe: Evidence of behavioural adaptation to human activity. Sci. Total Environ. 2018, 631–632, 803–810. [Google Scholar] [CrossRef] [PubMed]
  3. Hall, M.J.; Burns, A.L.; Martin, J.M.; Hochuli, D.F. Flight initiation distance changes across landscapes and habitats in a successful urban coloniser. Urban Ecosyst. 2020, 23, 785–791. [Google Scholar] [CrossRef]
  4. Gendall, J.; Lill, A.; Beckman, J. Tolerance of disturbance by humans in long-time resident and recent colonist urban doves. Avian Res. 2015, 6, 7. [Google Scholar] [CrossRef] [Green Version]
  5. Samia, D.S.M.; Blumstein, D.T.; Díaz, M.; Grim, T.; Ibáñez-Álamo, J.D.; Jokimäki, J.; Tätte, K.; Markó, G.; Tryjanowski, P.; Møller, A.P. Rural-Urban Differences in Escape Behavior of European Birds across a Latitudinal Gradient. Front. Ecol. Evol. 2017, 5, 66. [Google Scholar] [CrossRef] [Green Version]
  6. van Donselaar, J.L.; Atma, J.L.; Kruyf, Z.A.; LaCroix, H.N.; Proppe, D.S. Urbanization alters fear behavior in black-capped chickadees. Urban Ecosyst. 2018, 21, 1043–1051. [Google Scholar] [CrossRef]
  7. Andrade, M.; Blumstein, D.T. Anti-predator behavior along elevational and latitudinal gradients in dark-eyed juncos. Curr. Zool. 2020, 66, 239–245. [Google Scholar] [CrossRef] [Green Version]
  8. Charuvi, A.; Lees, D.; Glover, H.K.; Rendall, A.R.; Dann, P.; Weston, M.A. A physiological cost to behavioural tolerance. Behav. Process. 2020, 181, 104250. [Google Scholar] [CrossRef]
  9. Coetzer, C.; Bouwman, H. Waterbird flight initiation distances at Barberspan Bird Sanctuary, South Africa. Koedoe 2017, 59, a1419. [Google Scholar] [CrossRef]
  10. Dowling, L.; Bonier, F. Should I stay, or should I go: Modeling optimal flight initiation distance in nesting birds. PLoS ONE 2018, 13, e0208210. [Google Scholar] [CrossRef]
  11. McFadden, T.N.; Herrera, A.G.; Navedo, J.G. Waterbird responses to regular passage of a birdwatching tour boat: Implications for wetland management. J. Nat. Conserv. 2017, 40, 42–48. [Google Scholar] [CrossRef]
  12. Prestes, T.V.; Manica, L.T.; de Guaraldo, A.C. Behavioral responses of urban birds to human disturbance in urban parks at Curitiba, Paraná (Brazil). Rev. Bras. Ornitol. 2018, 26, 77–81. [Google Scholar] [CrossRef]
  13. Weston, M.A.; McLeod, E.M.; Blumstein, D.T.; Guay, P.-J. A review of flight-initiation distances and their application to managing disturbance to Australian birds. Emu–Austral Ornithol. 2012, 112, 269–286. [Google Scholar] [CrossRef] [Green Version]
  14. Feng, C.; Liang, W. Behavioral responses of black-headed gulls (Chroicocephalus ridibundus) to artificial provisioning in China. Glob. Ecol. Conserv. 2020, 21, e00873. [Google Scholar] [CrossRef]
  15. Bateman, P.W.; Fleming, P.A. Who are you looking at? Hadeda ibises use direction of gaze, head orientation and approach speed in their risk assessment of a potential predator. J. Zool. 2011, 285, 316–323. [Google Scholar] [CrossRef]
  16. Bötsch, Y.; Gugelmann, S.; Tablado, Z.; Jenni, L. Effect of human recreation on bird anti-predatory response. PeerJ 2018, 6, e5093. [Google Scholar] [CrossRef]
  17. Díaz, M.; Møller, A.P.; Flensted-Jensen, E.; Grim, T.; Ibáñez-Álamo, J.D.; Jokimäki, J.; Markó, G.; Tryjanowski, P. The geography of fear: A latitudinal gradient in anti-predator escape distances of birds across Europe. PLoS ONE 2013, 8, e64634. [Google Scholar] [CrossRef] [Green Version]
  18. Møller, A.P. The value of a mouthful: Flight initiation distance as an opportunity cost. Eur. J. Ecol. 2015, 1, 43–51. [Google Scholar] [CrossRef] [Green Version]
  19. Lin, T.; Coppack, T.; Lin, Q.-X.; Kulemeyer, C.; Schmidt, A.; Behm, H.; Luo, T. Does avian flight initiation distance indicate tolerance towards urban disturbance? Ecol. Indic. 2012, 15, 30–35. [Google Scholar] [CrossRef]
  20. Chamaillé-Jammes, S.; Blumstein, D.T. A case for quantile regression in behavioral ecology: Getting more out of flight initiation distance data. Behav. Ecol. Sociobiol. 2012, 66, 985–992. [Google Scholar] [CrossRef]
  21. Mikula, P.; Díaz, M.; Møller, A.P.; Albrecht, T.; Tryjanowski, P.; Hromada, M. Migratory and resident waders differ in risk taking on the wintering grounds. Behav. Process. 2018, 157, 309–314. [Google Scholar] [CrossRef]
  22. Fleming, P.A.; Bateman, P.W. Scavenging Opportunities Modulate Escape Responses over a Small Geographic Scale. Ethology 2017, 123, 205–212. [Google Scholar] [CrossRef]
  23. Stansell, H.M.; Blumstein, D.T.; Yeh, P.J.; Nonacs, P. Individual variation in tolerance of human activity by urban dark-eyed juncos (Junco hyemalis). Wilson J. Ornithol. 2020, 134, 43–51. [Google Scholar] [CrossRef] [PubMed]
  24. Tätte, K.; Møller, A.P.; Mänd, R. Towards an integrated view of escape decisions in birds: Relation between flight initiation distance and distance fled. Anim. Behav. 2018, 136, 75–86. [Google Scholar] [CrossRef]
  25. Zhou, B.; Liang, W. Avian escape responses to observers wearing clothing of different colors: A comparison of urban and rural populations. Glob. Ecol. Conserv. 2020, 22, e00921. [Google Scholar] [CrossRef]
  26. Bernard, G.E.; van Dongen, W.F.D.; Guay, P.-J.; Symonds, M.R.E.; Robinson, R.W.; Weston, M.A. Bicycles evoke longer flight-initiation distances and higher intensity escape behaviour of some birds in parks compared with pedestrians. Landsc. Urban Plan. 2018, 178, 276–280. [Google Scholar] [CrossRef]
  27. Glover, H.K.; Guay, P.-J.; Weston, M.A. Up the creek with a paddle; avian flight distances from canoes versus walkers. Wetl. Ecol. Manag. 2015, 23, 775–778. [Google Scholar] [CrossRef]
  28. McLeod, E.M.; Guay, P.-J.; Taysom, A.J.; Robinson, R.W.; Weston, M.A. Buses, cars, bicycles and walkers: The influence of the type of human transport on the flight responses of waterbirds. PLoS ONE 2013, 8, e82008. [Google Scholar] [CrossRef] [Green Version]
  29. Vines, A.; Lill, A. Boldness and urban dwelling in little ravens. Wildl. Res. 2015, 42, 590. [Google Scholar] [CrossRef]
  30. Battle, K.E.; Foltz, S.L.; Moore, I.T. Predictors of flight behavior in rural and urban songbirds. Wilson J. Ornithol. 2016, 128, 510–519. [Google Scholar] [CrossRef]
  31. Guay, P.-J.; Lorenz, R.D.A.; Robinson, R.W.; Symonds, M.R.E.; Weston, M.A. Distance from Water, Sex and Approach Direction Influence Flight Distances Among Habituated Black Swans. Ethology 2013, 119, 552–558. [Google Scholar] [CrossRef]
  32. Legagneux, P.; Ducatez, S. European birds adjust their flight initiation distance to road speed limits. Biol. Lett. 2013, 9, 20130417. [Google Scholar] [CrossRef] [PubMed] [Green Version]
  33. Slater, C.; Cam, G.; Qi, Y.; Liu, Y.; Guay, P.-J.; Weston, M.A. Camera shy? Motivations, attitudes and beliefs of bird photographers and species-specific avian responses to their activities. Biol. Conserv. 2019, 237, 327–337. [Google Scholar] [CrossRef]
  34. Jiang, X.; Liu, J.; Zhang, C.; Liang, W. Face masks matter: Eurasian tree sparrows show reduced fear responses to people wearing face masks during the COVID-19 pandemic. Glob. Ecol. Conserv. 2020, 24, e01277. [Google Scholar] [CrossRef]
  35. Carrete, M.; Tella, J.L. Inter-individual variability in fear of humans and relative brain size of the species are related to contemporary urban invasion in birds. PLoS ONE 2011, 6, e18859. [Google Scholar] [CrossRef] [Green Version]
  36. Davey, S.; Massaro, M.; Freire, R. Differences in flight initiation distance (FID) between rural and urban populations of two species of Australian birds. Behaviour 2019, 156, 1151–1164. [Google Scholar] [CrossRef]
  37. Bjørvik, L.M.; Dale, S.; Hermansen, G.H.; Munishi, P.K.T.; Moe, S.R. Bird flight initiation distances in relation to distance from human settlements in a Tanzanian floodplain habitat. J. Ornithol. 2015, 156, 239–246. [Google Scholar] [CrossRef]
  38. Møller, A.P. Basal metabolic rate and risk-taking behaviour in birds. J. Evol. Biol. 2009, 22, 2420–2429. [Google Scholar] [CrossRef]
  39. Møller, A.P.; Garamszegi, L.Z. Between individual variation in risk-taking behavior and its life history consequences. Behav. Ecol. 2012, 23, 843–853. [Google Scholar] [CrossRef]
  40. Blumstein, D.T.; Fernandez-Juricic, E.; LeDee, O.; Larsen, E.; Rodriguez-Prieto, I.; Zugmeyer, C. Avian Risk Assessment: Effects of Perching Height and Detectability. Ethology 2004, 110, 273–285. [Google Scholar] [CrossRef]
  41. Blumstein, D.T. Developing an evolutionary ecology of fear: How life history and natural history traits affect disturbance tolerance in birds. Anim. Behav. 2006, 71, 389–399. [Google Scholar] [CrossRef]
  42. Huang, Y.; Zhao, Y.; Li, S.; von Gadow, K. The Effects of habitat area, vegetation structure and insect richness on breeding bird populations in Beijing urban parks. Urban For. Urban Green. 2015, 14, 1027–1039. [Google Scholar] [CrossRef]
  43. Bates, D.; Mächler, M.; Bolker, B.; Walker, S. Fitting Linear Mixed-Effects Models Using Lme4. arXiv 2015, arXiv:1406.5823. [Google Scholar]
  44. Bartoń, K. MuMIn: Multi-Model Inference. 2020. Available online: https://CRAN.R-project.org/package=MuMIn (accessed on 11 November 2022).
  45. Mazerolle, M.J. AICcmodavg: Model Selection and Multimodel Inference Based on (Q)AIC(c). 2020. Available online: https://cran.r-project.org/package=AICcmodavg (accessed on 11 November 2022).
  46. Gordon, M.; Lumley, T. Forestplot: Advanced Forest Plot Using ‘Grid’ Graphics. 2020. Available online: https://CRAN.R-project.org/package=forestplot (accessed on 11 November 2022).
  47. Mayer, M.; Natusch, D.; Frank, S. Water body type and group size affect the flight initiation distance of European waterbirds. PLoS ONE 2019, 14, e0219845. [Google Scholar] [CrossRef] [PubMed] [Green Version]
  48. Mikula, P. Pedestrian Density Influences Flight Distances of Urban Birds. Ardea 2014, 102, 53–60. [Google Scholar] [CrossRef] [Green Version]
  49. Piratelli, A.J.; Favoretto, G.R.; de Almeida Maximiano, M.F. Factors affecting escape distance in birds. Zoologia 2015, 32, 438–444. [Google Scholar] [CrossRef] [Green Version]
  50. Blumstein, D.T.; Anthony, L.L.; Harcourt, R.; Ross, G. Testing a key assumption of wildlife buffer zones: Is flight initiation distance a species-specific trait? Biol. Conserv. 2003, 110, 97–100. [Google Scholar] [CrossRef]
  51. Jiang, Y.; Møller, A.P. Antipredator escape distances of common and threatened birds. Behav. Ecol. 2017, 28, 1498–1503. [Google Scholar] [CrossRef] [Green Version]
  52. Collop, C.; Stillman, R.A.; Garbutt, A.; Yates, M.G.; Rispin, E.; Yates, T. Variability in the area, energy and time costs of wintering waders responding to disturbance. Ibis 2016, 158, 711–725. [Google Scholar] [CrossRef]
  53. Poddubnaya, N.; Korotkova, T.; Vanicheva, P. Increasing corvid tolerance to humans in urban ecosystems with increasing latitude. Biol. Commun. 2020, 64. [Google Scholar] [CrossRef] [Green Version]
  54. Morelli, F.; Benedetti, Y.; Díaz, M.; Grim, T.; Ibáñez-Álamo, J.D.; Jokimäki, J.; Kaisanlahti-Jokimäki, M.; Tätte, K.; Markó, G.; Jiang, Y.; et al. Contagious fear: Escape behavior increases with flock size in European gregarious birds. Ecol. Evol. 2019, 9, 6096–6104. [Google Scholar] [CrossRef] [PubMed] [Green Version]
  55. Chen, X.-M.; Xie, W.-T.; Shuai, L.-Y. Flush early and avoid the rush? It may depend on where you stand. Ethology 2020, 126, 987–992. [Google Scholar] [CrossRef]
  56. Osorio-Beristain, M.; Rodríguez, A.; Martínez-Garza, C.; Alcalá, R.E. Relating flight initiation distance in birds to tropical dry forest restoration. Zoologia 2018, 35, 1–6. [Google Scholar] [CrossRef] [Green Version]
  57. Gravolin, I.; Key, M.; Lill, A. Boldness of Urban Australian Magpies and Local Traffic Volume. Avian Biol. Res. 2014, 7, 244–250. [Google Scholar] [CrossRef]
  58. Jablonszky, M.; Szász, E.; Markó, G.; Török, J.; Herczeg, G.; Garamszegi, L.Z. Escape ability and risk-taking behaviour in a Hungarian population of the collared flycatcher (Ficedula albicollis). Behav. Ecol. Sociobiol. 2017, 71, 54. [Google Scholar] [CrossRef] [Green Version]
  59. Vincze, E.; Papp, S.; Preiszner, B.; Seress, G.; Bókony, V.; Liker, A. Habituation to human disturbance is faster in urban than rural house sparrows. Behav. Ecol. 2016, 27, 1304–1313. [Google Scholar] [CrossRef]
  60. Jiang, Y.; Møller, A.P. Escape from predators and genetic variance in birds. J. Evol. Biol. 2017, 30, 2059–2067. [Google Scholar] [CrossRef] [Green Version]
  61. García-Arroyo, M.; MacGregor-Fors, I. Tolerant to humans? Assessment of alert and flight initiation distances of two bird species in relation to sex, flock size, and environmental characteristics. Ethol. Ecol. Evol. 2020, 32, 445–456. [Google Scholar] [CrossRef]
  62. Jiao, M.; Xue, H.; Yan, J.; Zheng, Z.; Wang, J.; Zhao, C.; Zhang, L.; Zhou, W. Tree abundance, diversity and their driving and indicative factors in Beijing’s residential areas. Tree abundance, diversity and their driving and indicative factors in Beijing’s residential areas. Ecol. Indic. 2021, 125, 107462. [Google Scholar] [CrossRef]
  63. Yin, L.; Wang, C.; Han, W. Food source characteristics and diversity of birds based on feeding behavior in residential areas of Beijing. Biodivers. Sci. 2022. [Google Scholar] [CrossRef]
  64. Li, X.; Jia, B.; Zhang, W.; Ma, J.; Liu, X. Woody plant diversity spatial patterns and the effects of urbanization in Beijing, China. Urban For. Urban Green. 2020, 56, 126873. [Google Scholar] [CrossRef]
  65. Sachs, A.L.; Boag, A.E.; Troy, A. Valuing urban trees: A hedonic investigation into tree canopy influence on property values across environmental and social contexts in Baltimore, Maryland. Urban For. Urban Green. 2023, 80, 127829. [Google Scholar] [CrossRef]
  66. Chin, M.; Ruppert, W.; Shrestha, N.; Fortin, M. Urban Avian Conservation Planning Using Species Functional Traits and Habitat Suitability Mapping. Land 2022, 11, 1831. [Google Scholar] [CrossRef]
  67. Amaya-Espinel, J.D.; Hostetler, M.E. The value of small forest fragments and urban tree canopy for Neotropical migrant birds during winter and migration seasons in Latin American countries: A systematic review. Landsc. Urban Plan. 2019, 190, 103592. [Google Scholar] [CrossRef]
  68. Speak, A.F.; Salbitano, F. The impact of pruning and mortality on urban tree canopy volume. Urban For. Urban Green. 2023, 79, 127810. [Google Scholar] [CrossRef]
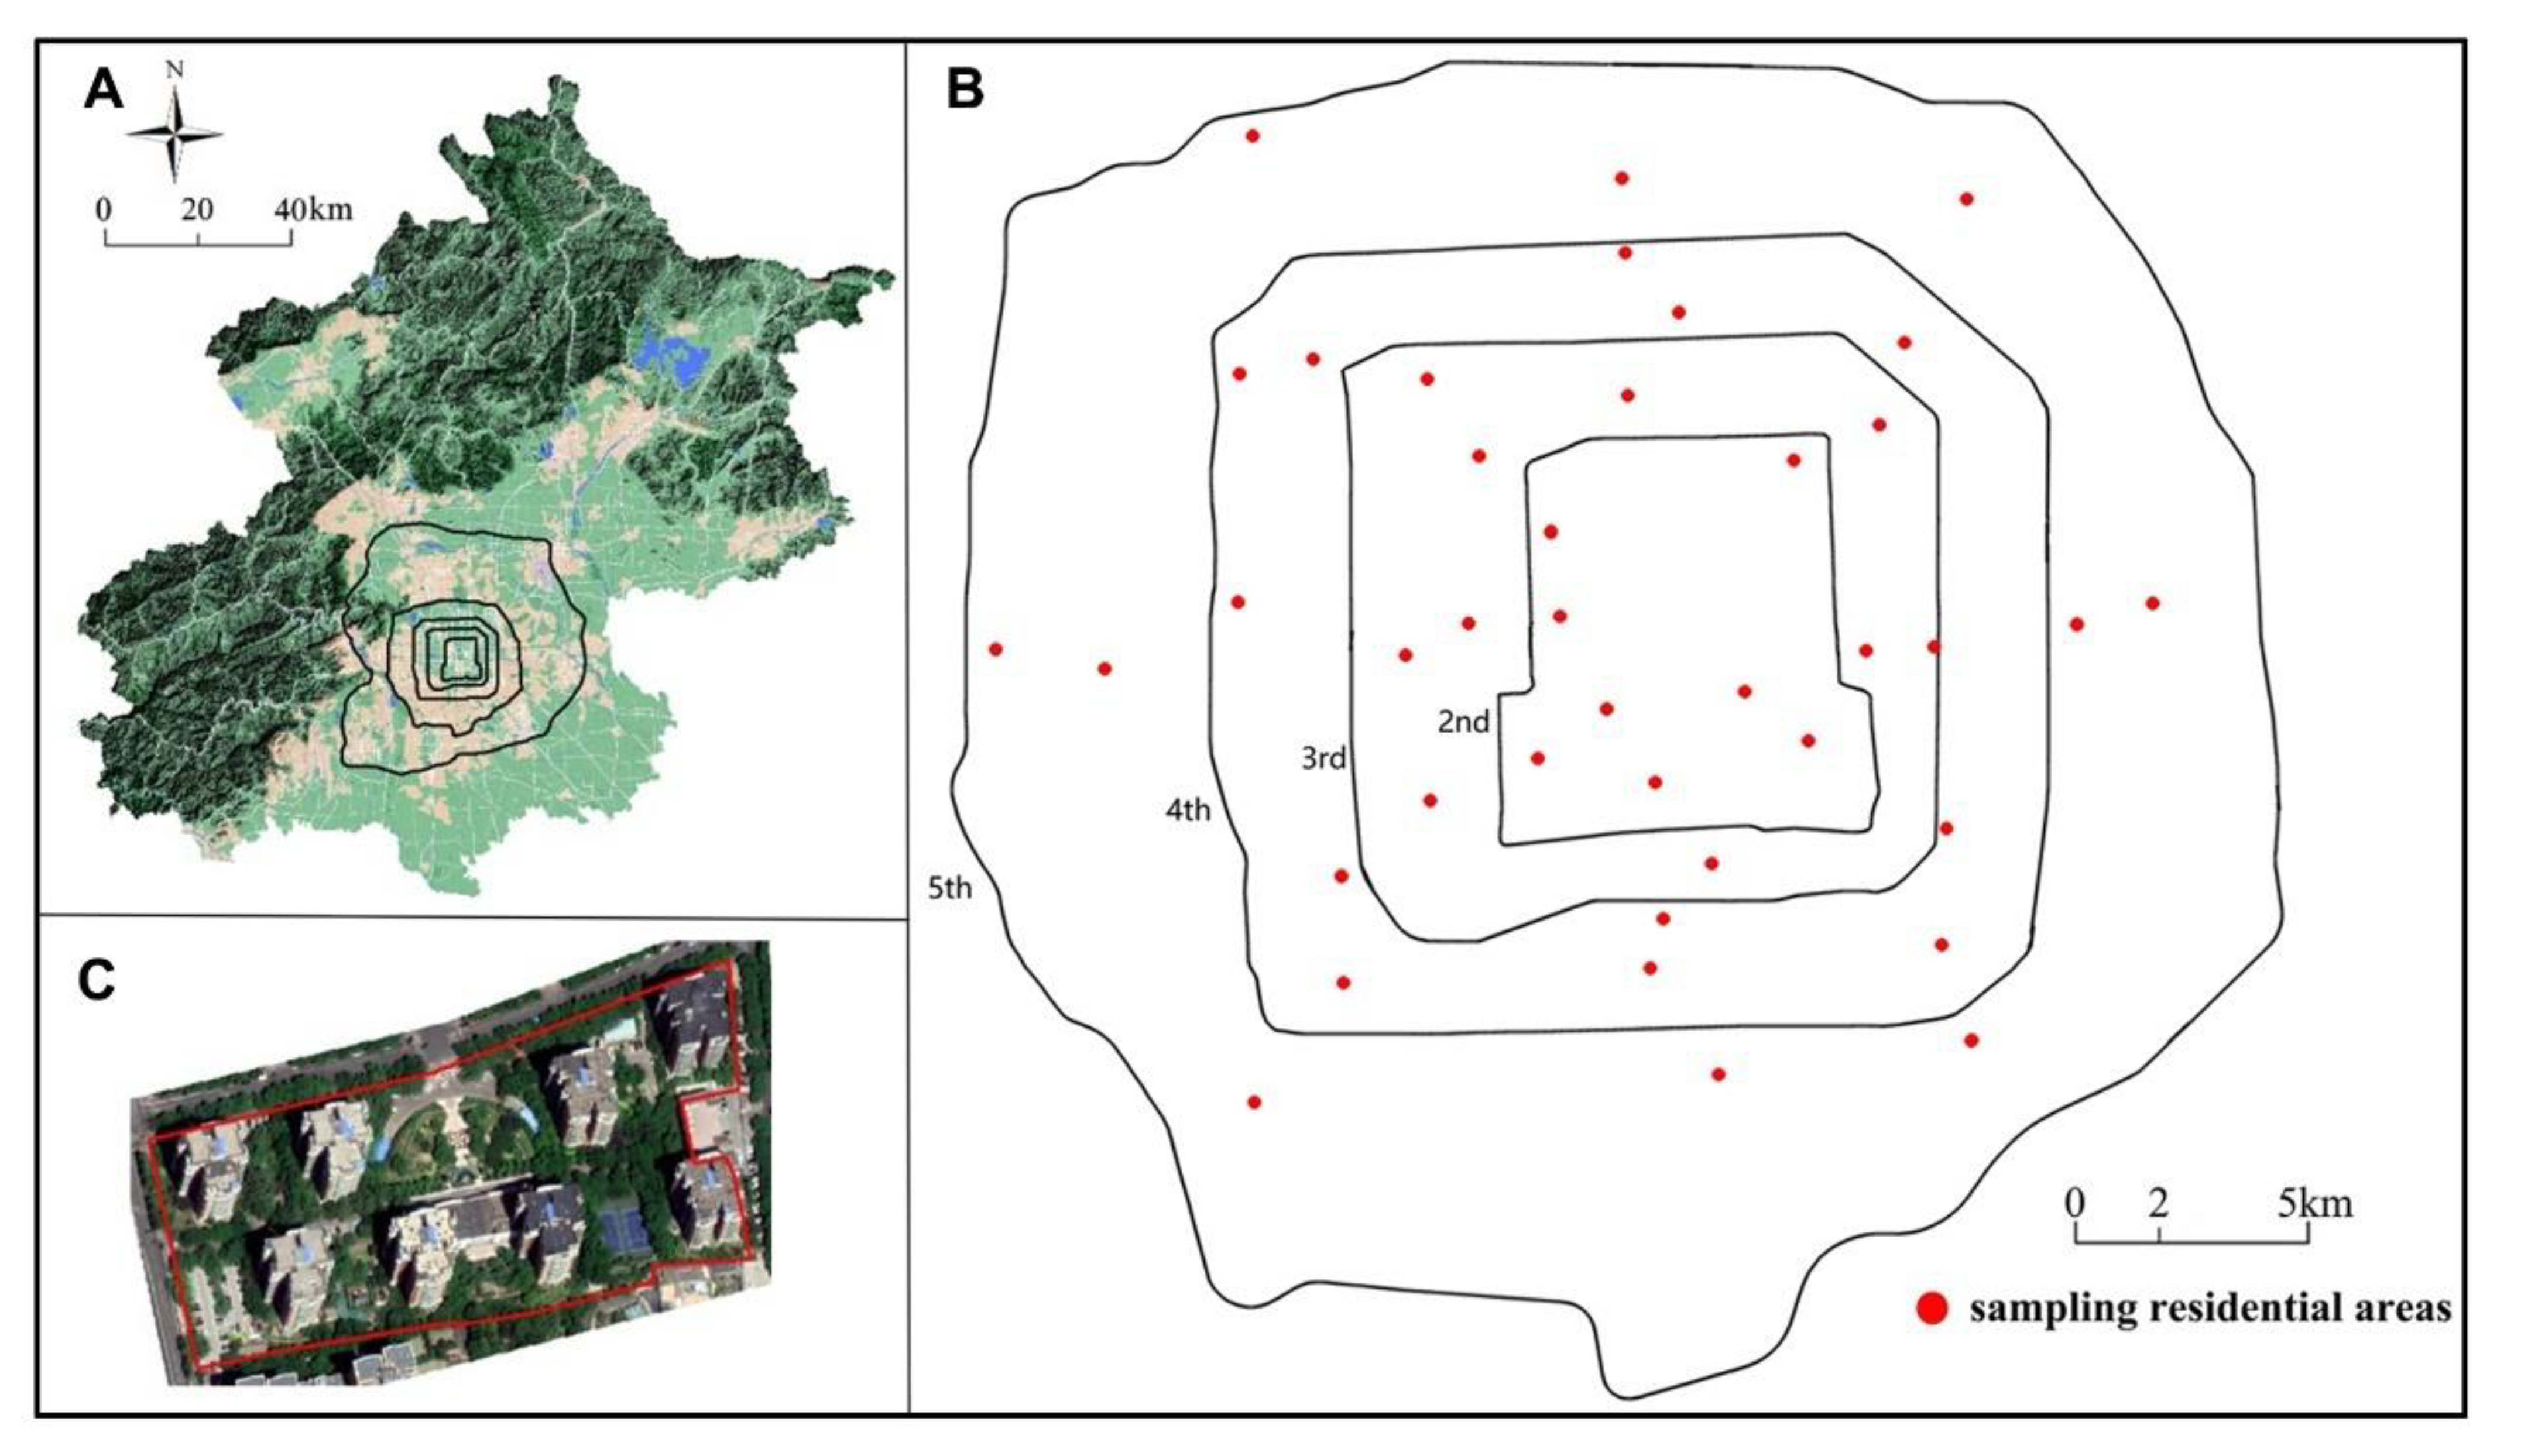
Figure 1. (A) The topographic map of Beijing. The light brown areas are building areas, blue areas are waters, light green areas are green spaces in the plain area, and dark green areas are green spaces in the mountain area. (B) The right figure shows 40 sampled residential areas located within the 5th ring road of Beijing. (C) An example of residential areas. The red line is the boundary of residential areas.
Sustainability 15 04994 g001
Figure 2. Diagram of visibility level according to the foliage density and the position of target bird.
Sustainability 15 04994 g002
Figure 3. Comparing estimated FIDs of different species. Red shows lower than the estimated mean FID, while blue shows longer than the estimated mean FID.
Sustainability 15 04994 g003
Figure 4. Comparison of FIDs among (A) status, (B) dominance level, (C) diet, (D) foraging site, (E) visibility level and (F) initial behaviour. The y-axis represents the value of FID (in meters). Box plots show the median (bar in the middle of rectangles), upper and lower quartiles, maximum and minimum values (vertical lines) and outliers (black dots). The letters above boxes indicates the significant difference among different groups (p < 0.05). Residence type: R = Resident, P = Passenger, S = Summer breeders, W = Winter visitors. Frequency: MCS = the most common species, CS = common species, RS = rare species, ERS = Extreme rare species. Visibility level: L = low, LM = low-medium, M = medium, MH = medium-high, H = high.
Sustainability 15 04994 g004
Figure 5. Effect sizes of variables are predicted based on the best models’ conditional coefficient for birds FID. Estimates in the plot are shown using the mean values (black squares or points) and associated 95% CIs (black horizontal lines). The shape of mean values varies according to the p-value: p < 0.05 ‘■’ and p > 0.05 ‘•’. The bigger black squares represent variables that have a significant effect on the averaged model. Green represents frequency variables, blue represents individual initial condition variables, and orange represents environment characteristic variables.
Sustainability 15 04994 g005
Figure 6. Relationships between variables and FID for (AD) the most common species, (EH) the other species. Black lines indicate estimates with 95% confidence intervals (grey area). The p values (p < 0.05) in italics indicates significant effect.
Sustainability 15 04994 g006
Table 1. Variables of birds FID in residential areas.
TypeVariablesDescription
Species frequencyFrequencyTotal individuals of each species recorded during the survey reflecting species frequency
Individual initial conditionInitial behaviour (IB)Initial behaviour of the target bird.
Height(m)Initial height of the target bird off the ground.
Visibility level (VL)Initial visibility of the target bird (Figure 2).
External environment characteristicFloor area ratio (FAR)The total floor area is divided by the area of each site.
Adjacent roads ratio (%) (ARR)The length of urban main and secondary roads is divided by the perimeter of each site.
Tree canopy coverage (%) (CANOPY)The area covered by the tree canopy is divided by the area of each site.
Disclaimer/Publisher’s Note: The statements, opinions and data contained in all publications are solely those of the individual author(s) and contributor(s) and not of MDPI and/or the editor(s). MDPI and/or the editor(s) disclaim responsibility for any injury to people or property resulting from any ideas, methods, instructions or products referred to in the content.