Creation of a Mobile Application for Navigation for a Potential Use of People with Visual Impairment Exercising the NTRIP Protocol


Abstract
1. Introduction
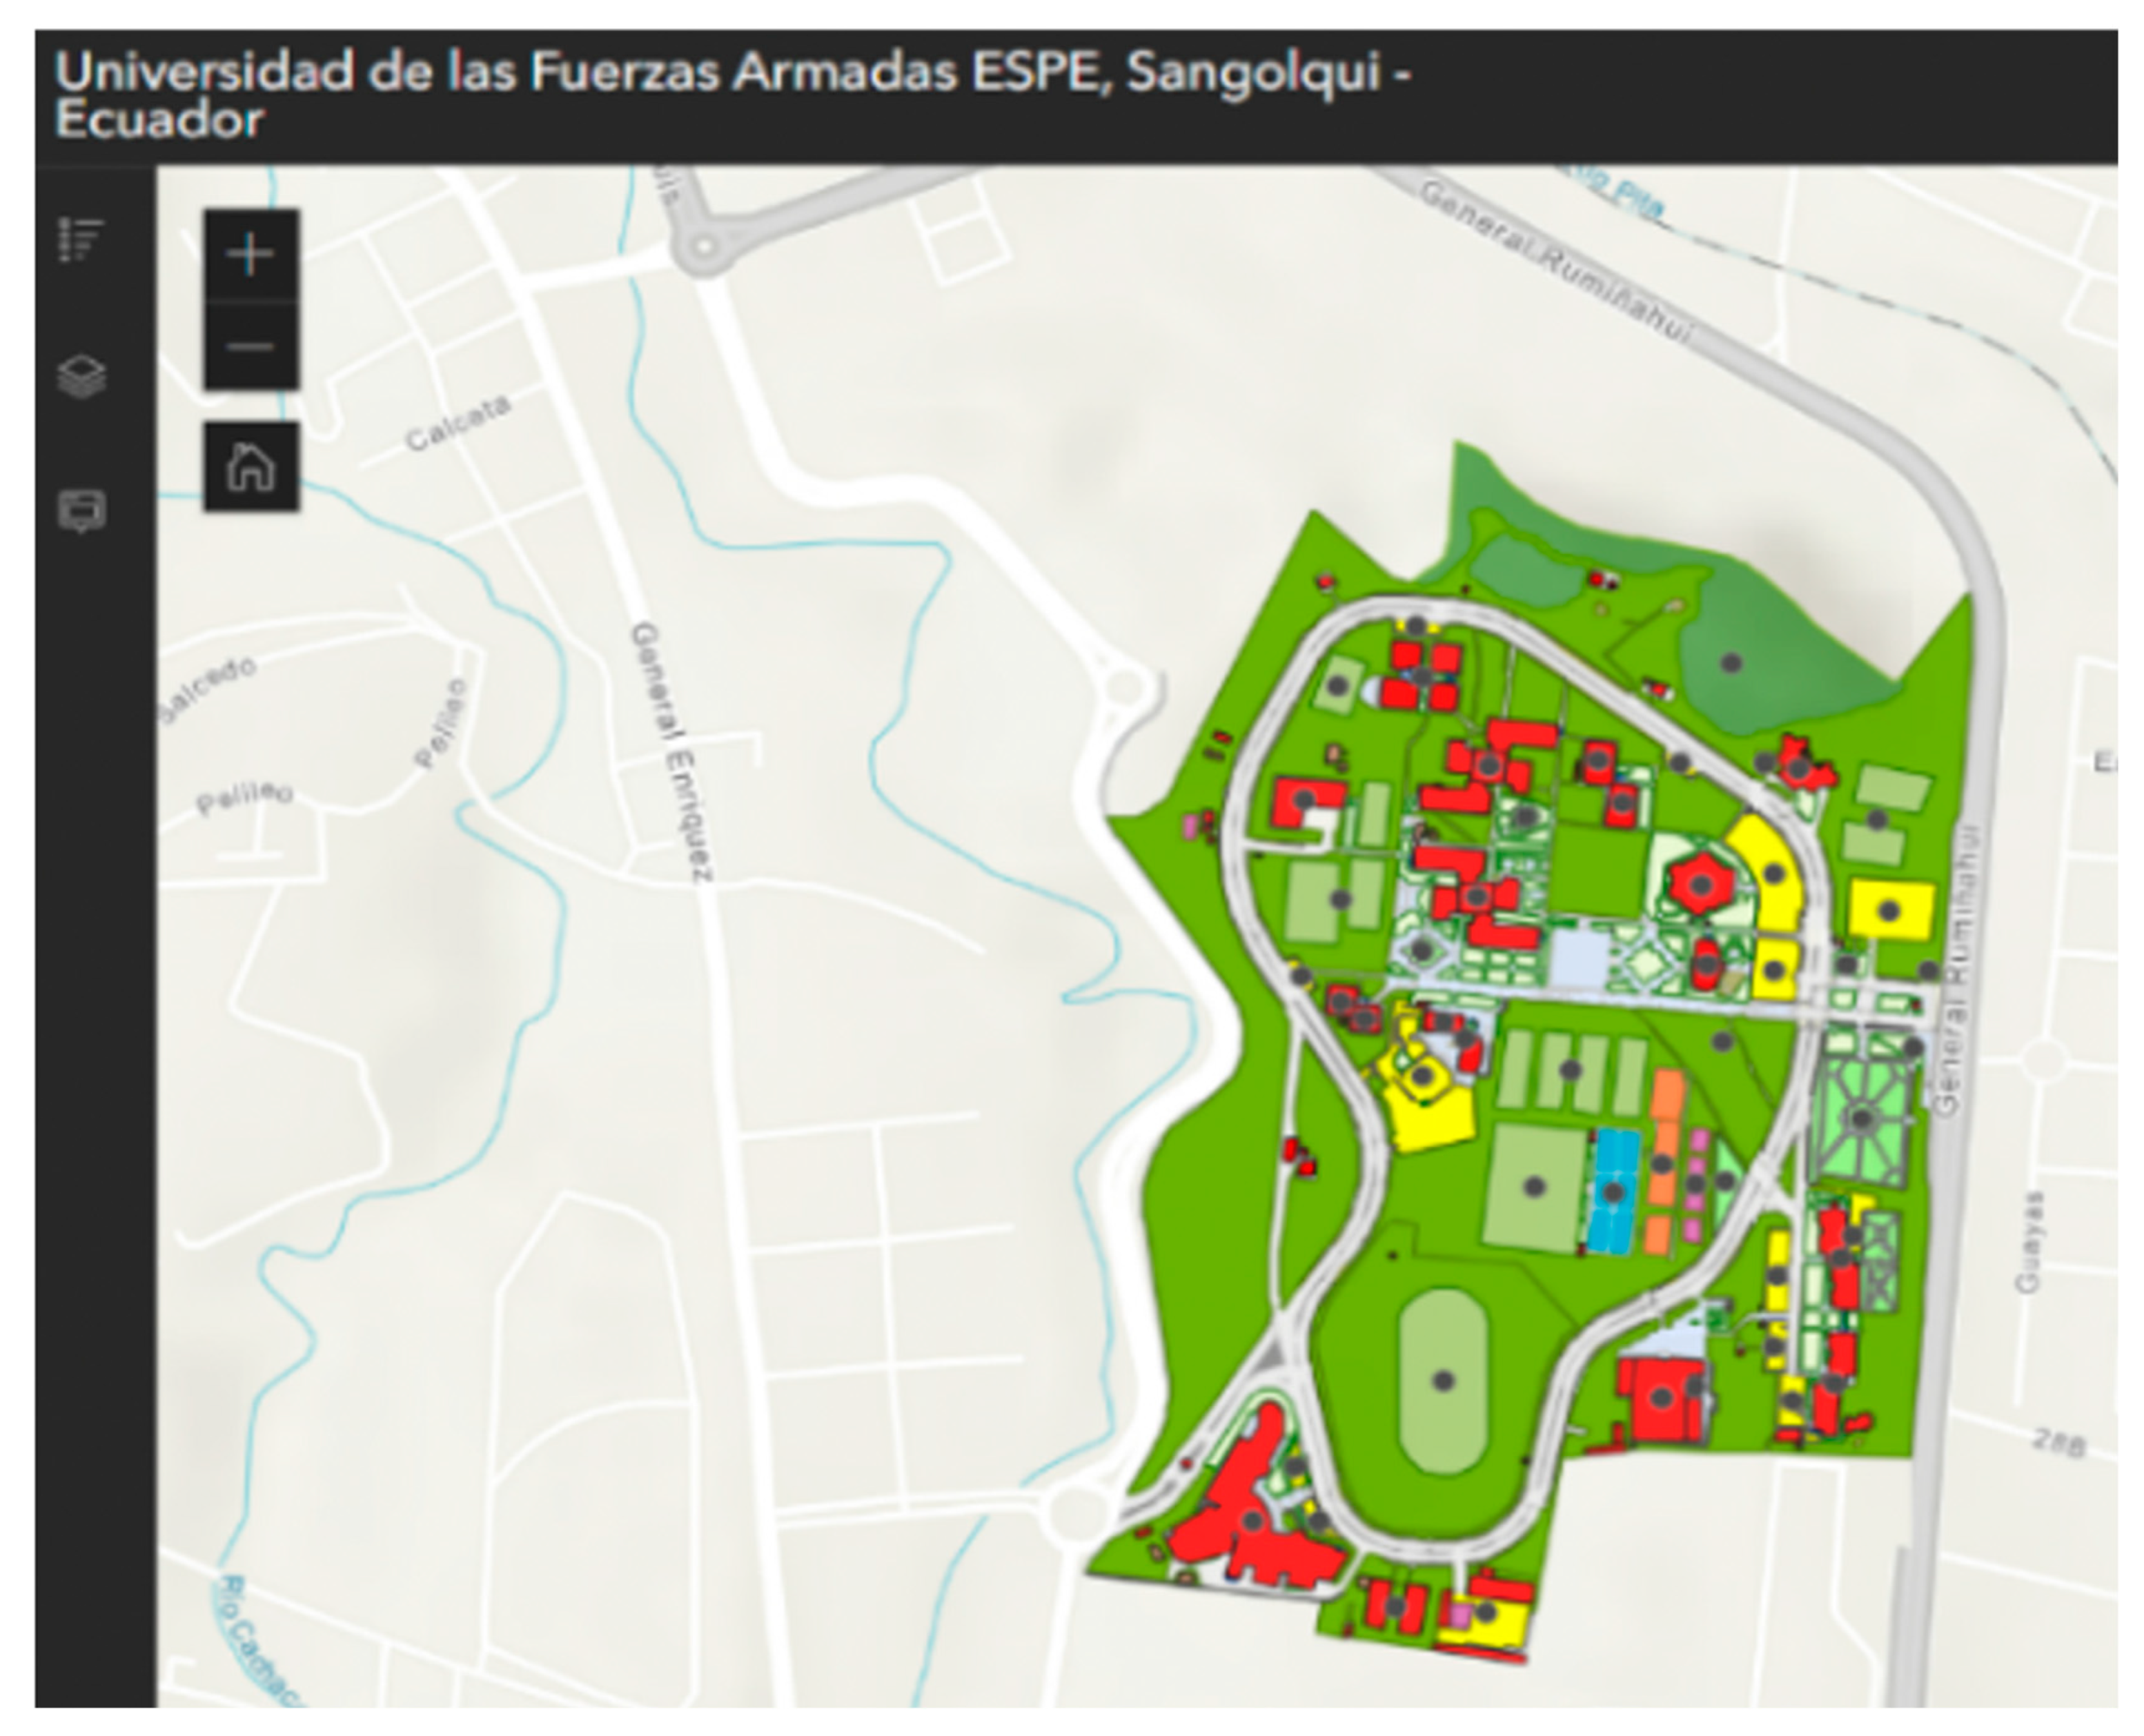
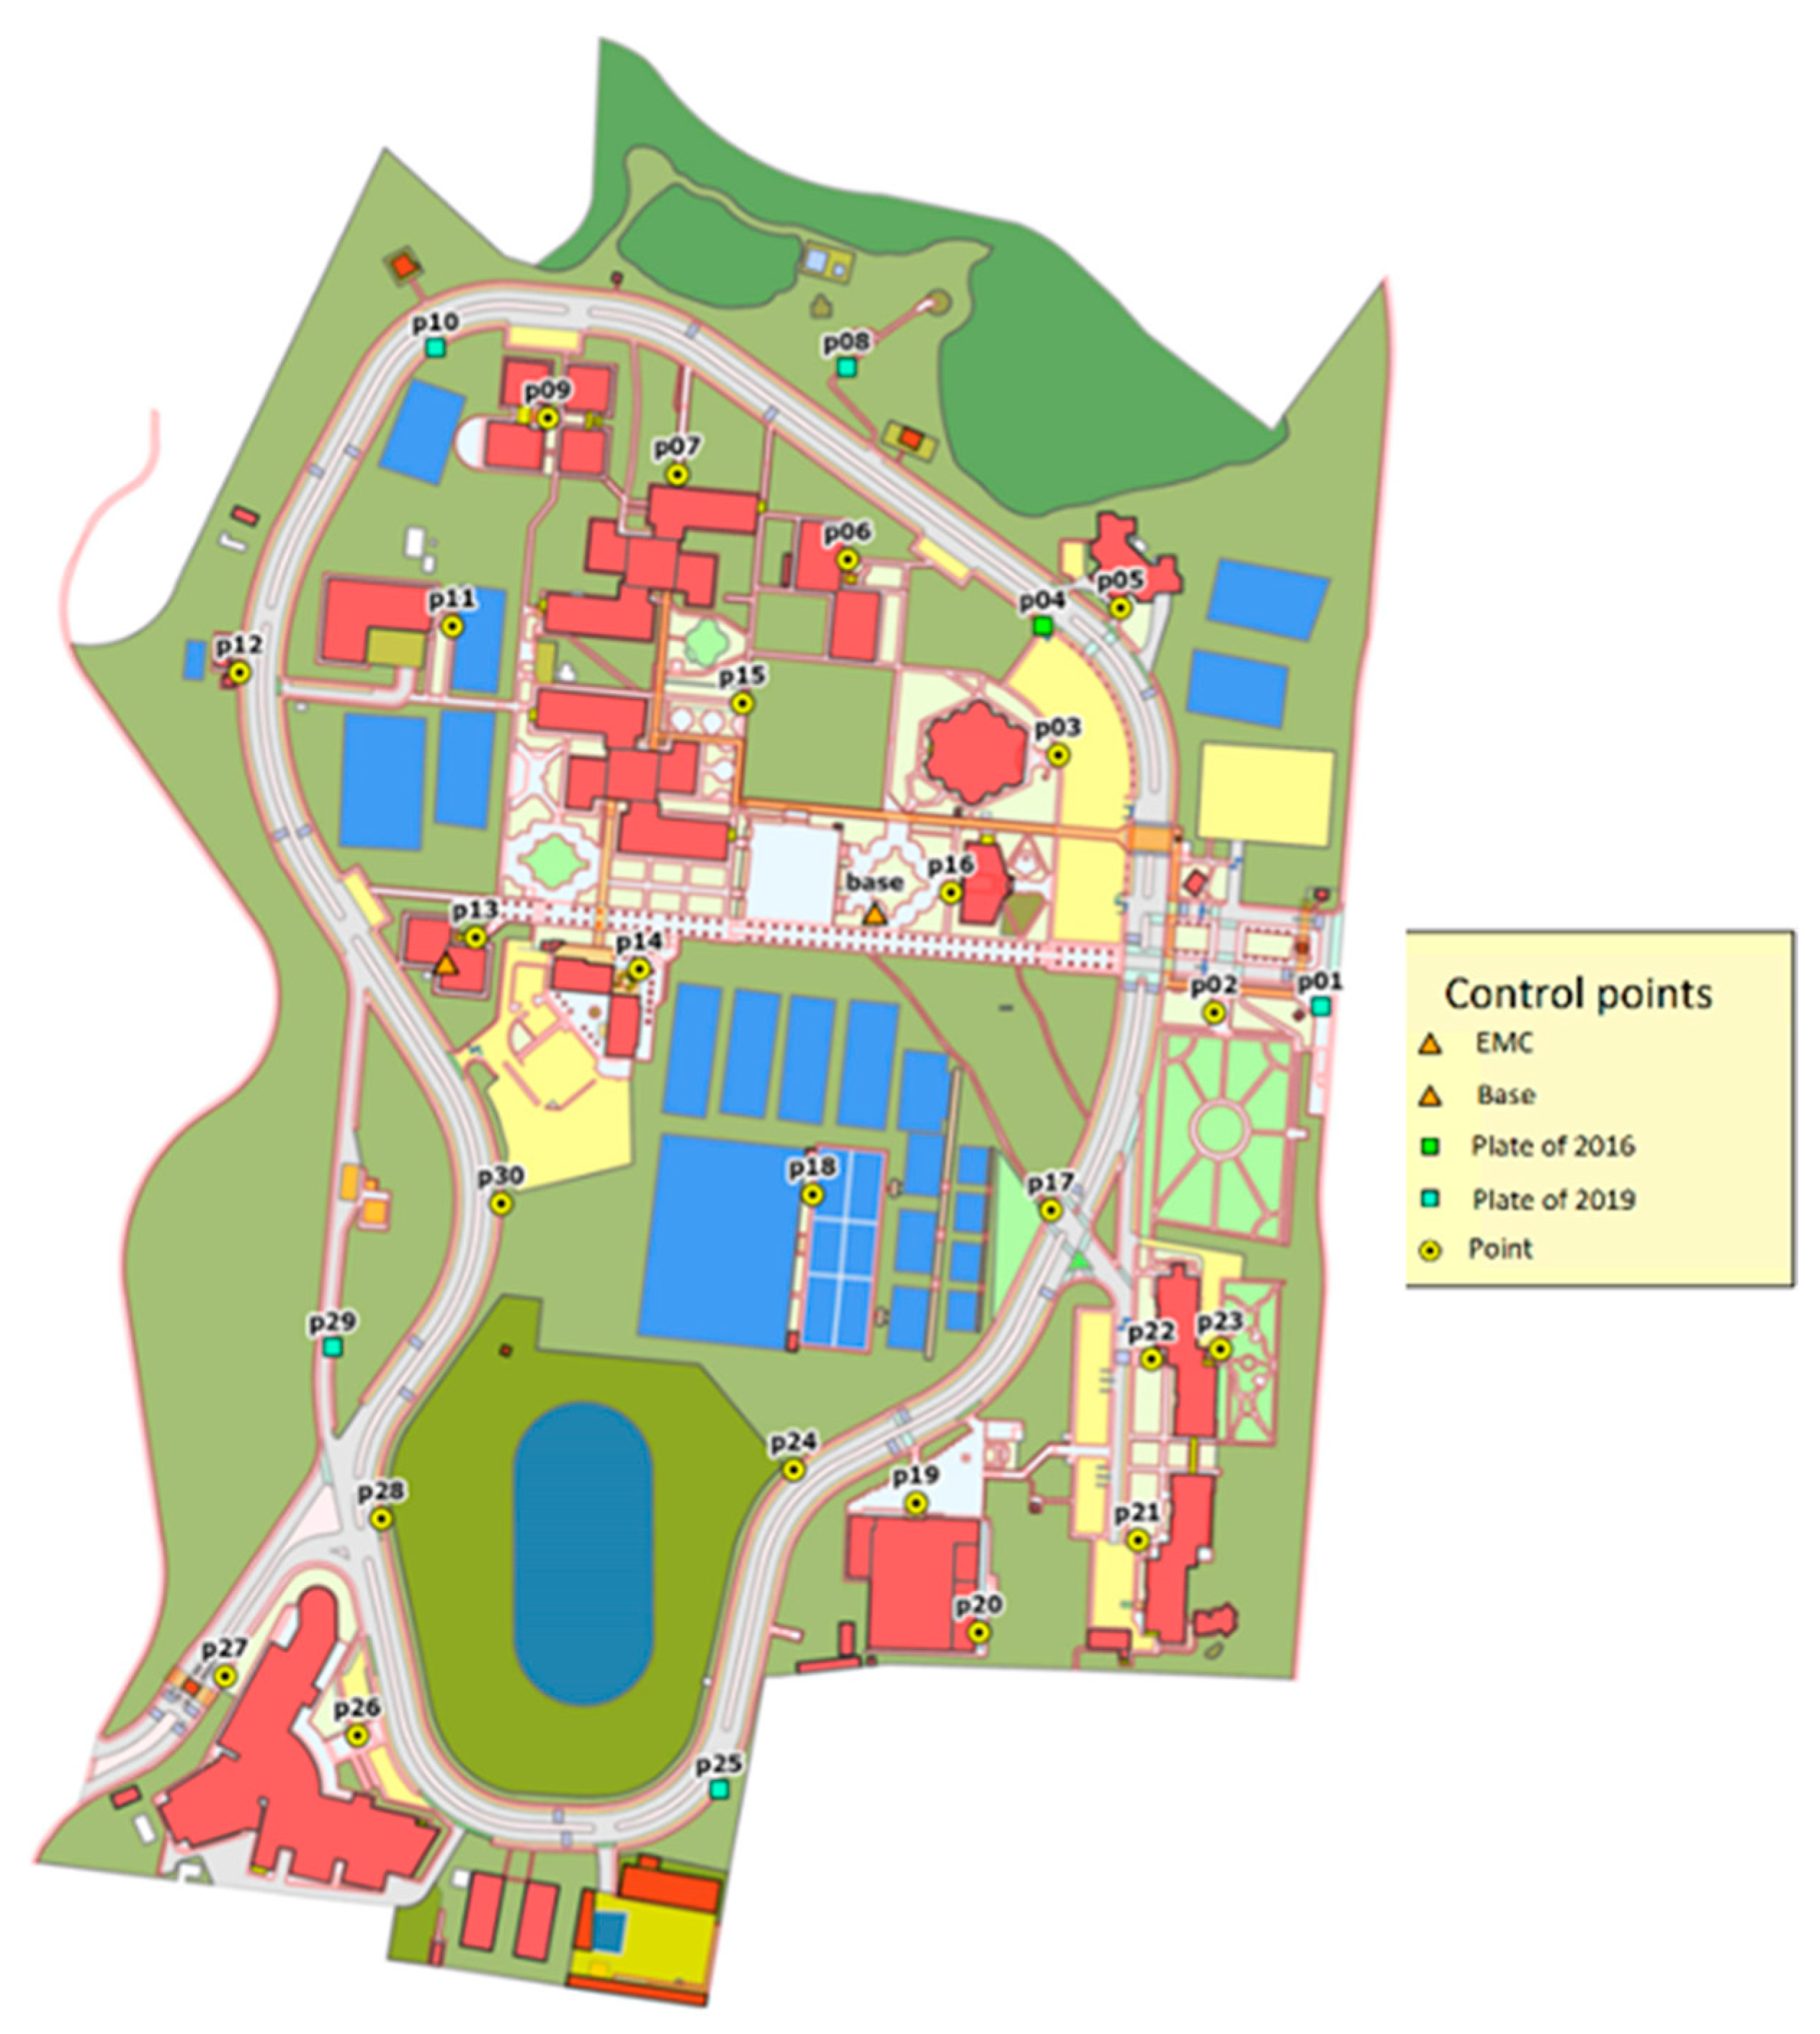
2. Study Area
3. Methodology
3.1. Geodatabase Structure
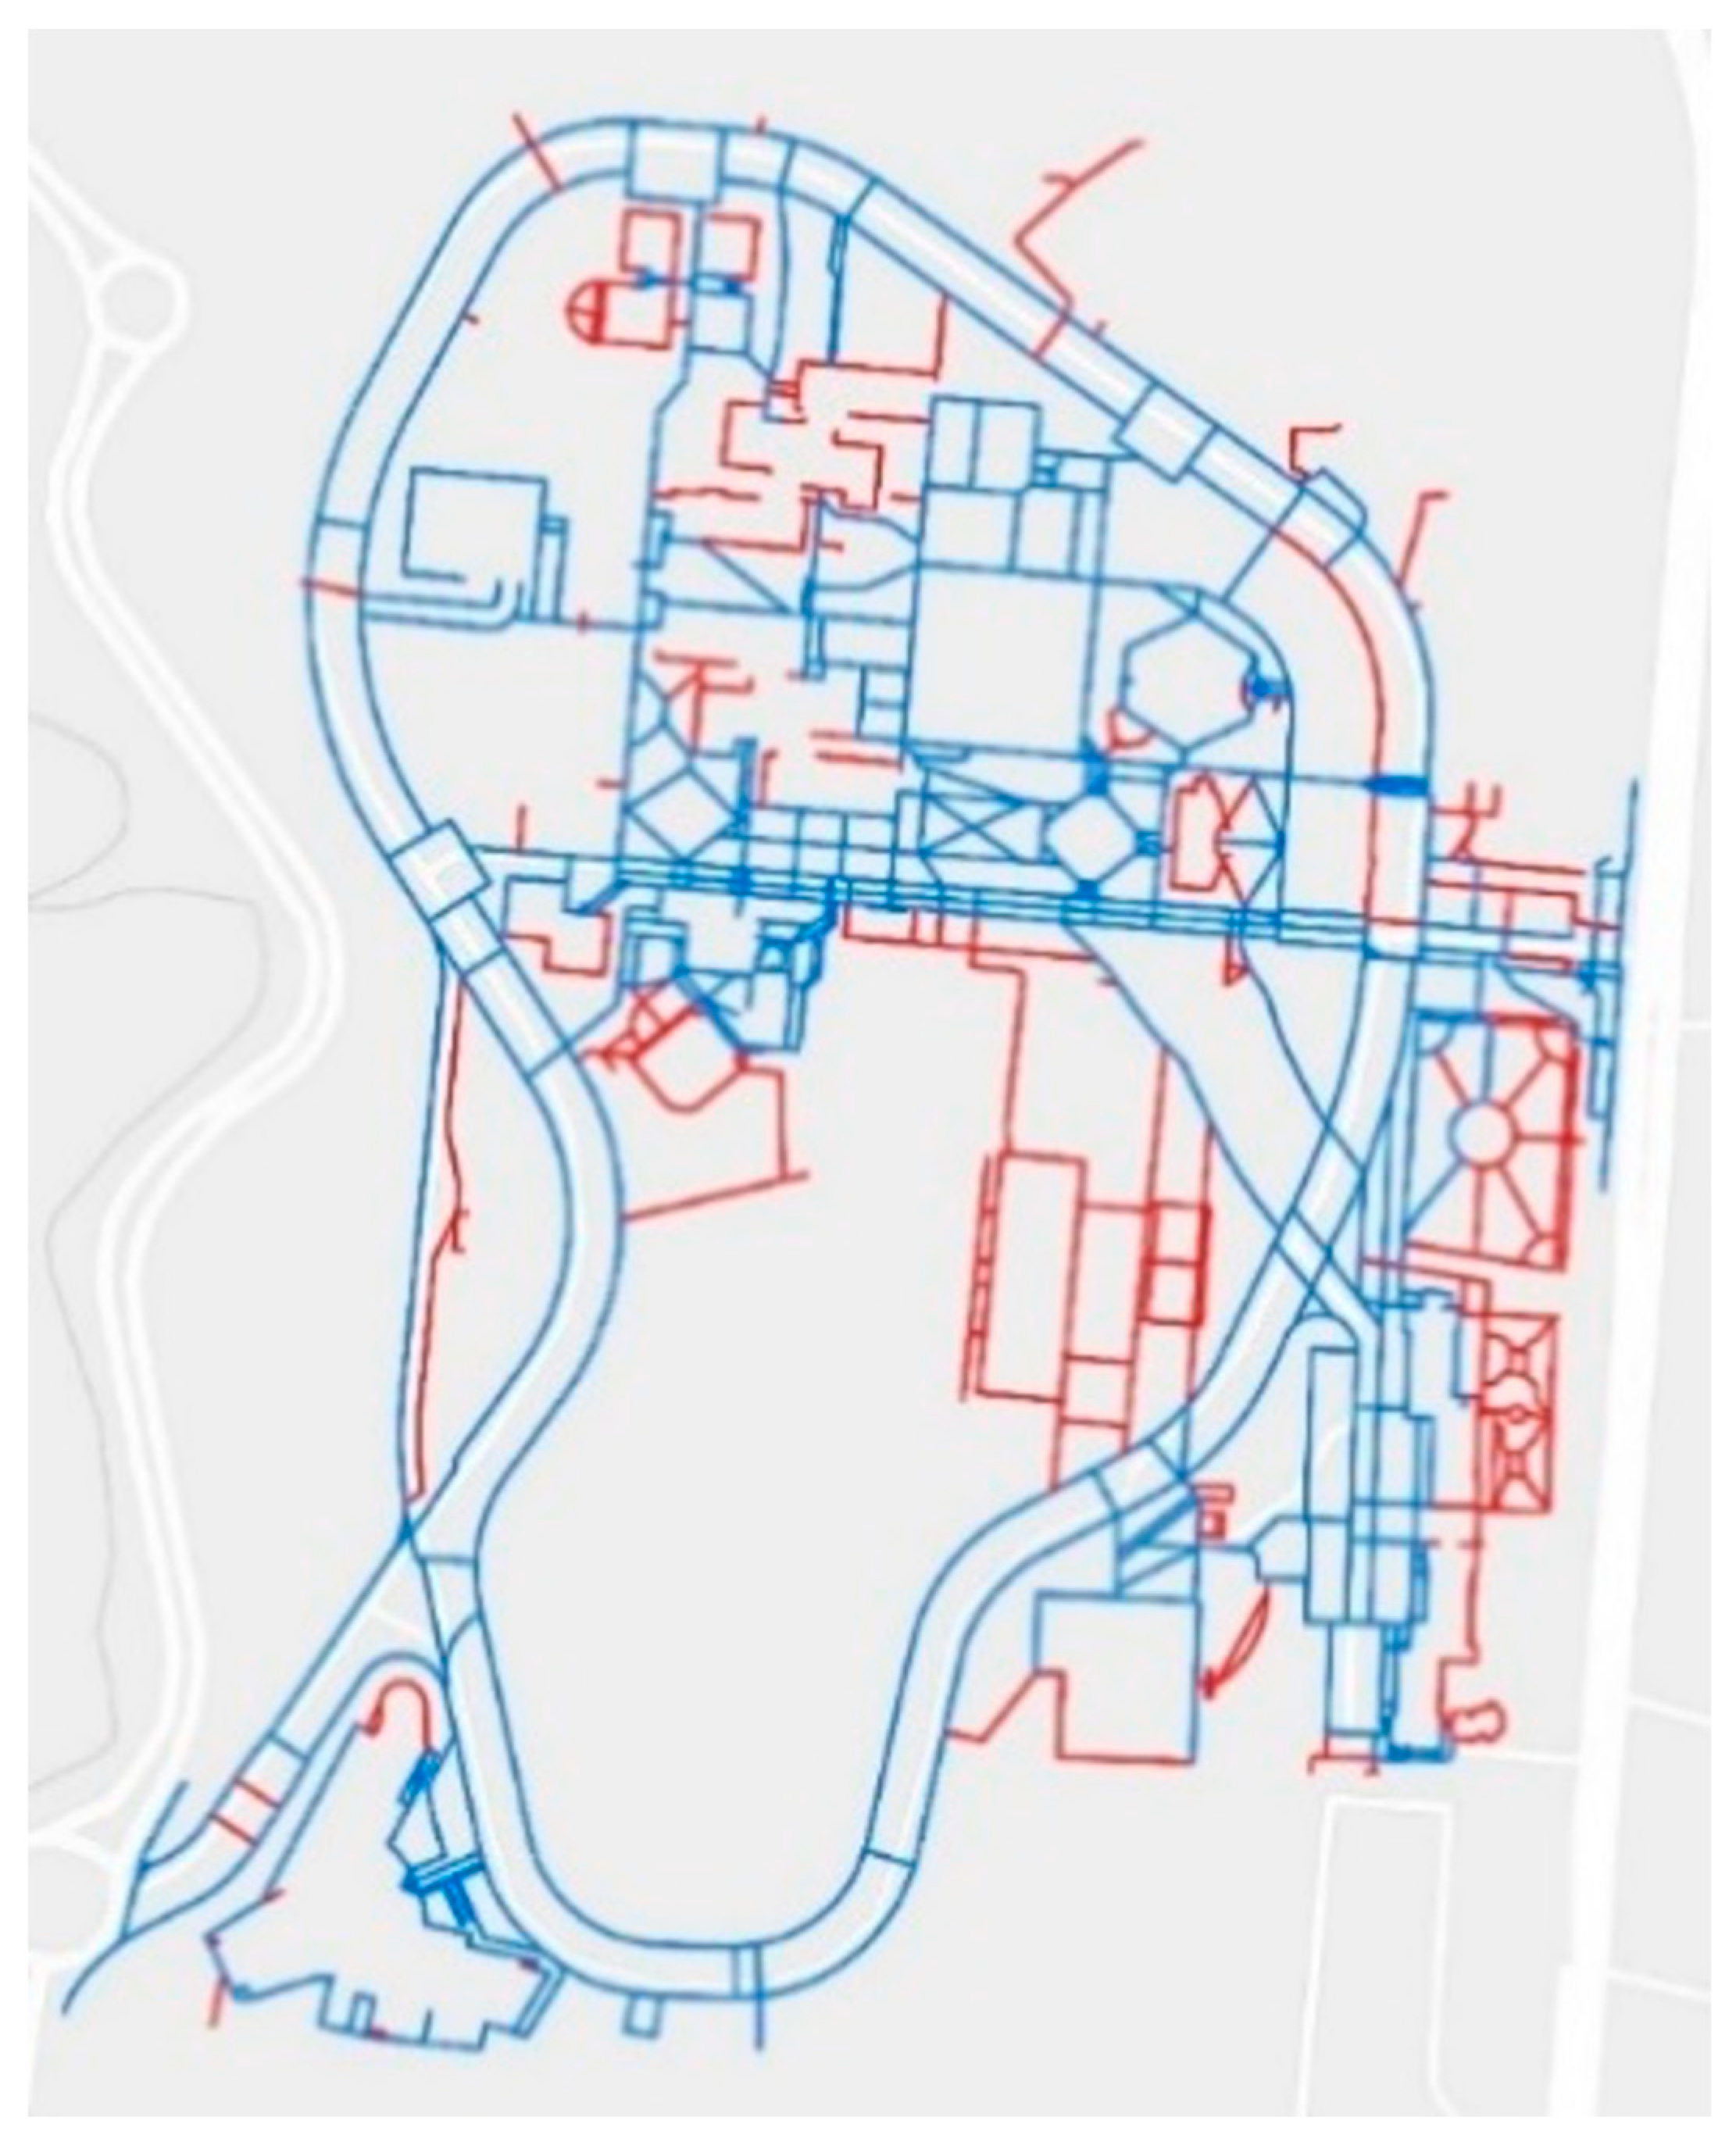
3.2. Design of Route Segments and Deploying the Base Map in a Web Viewer
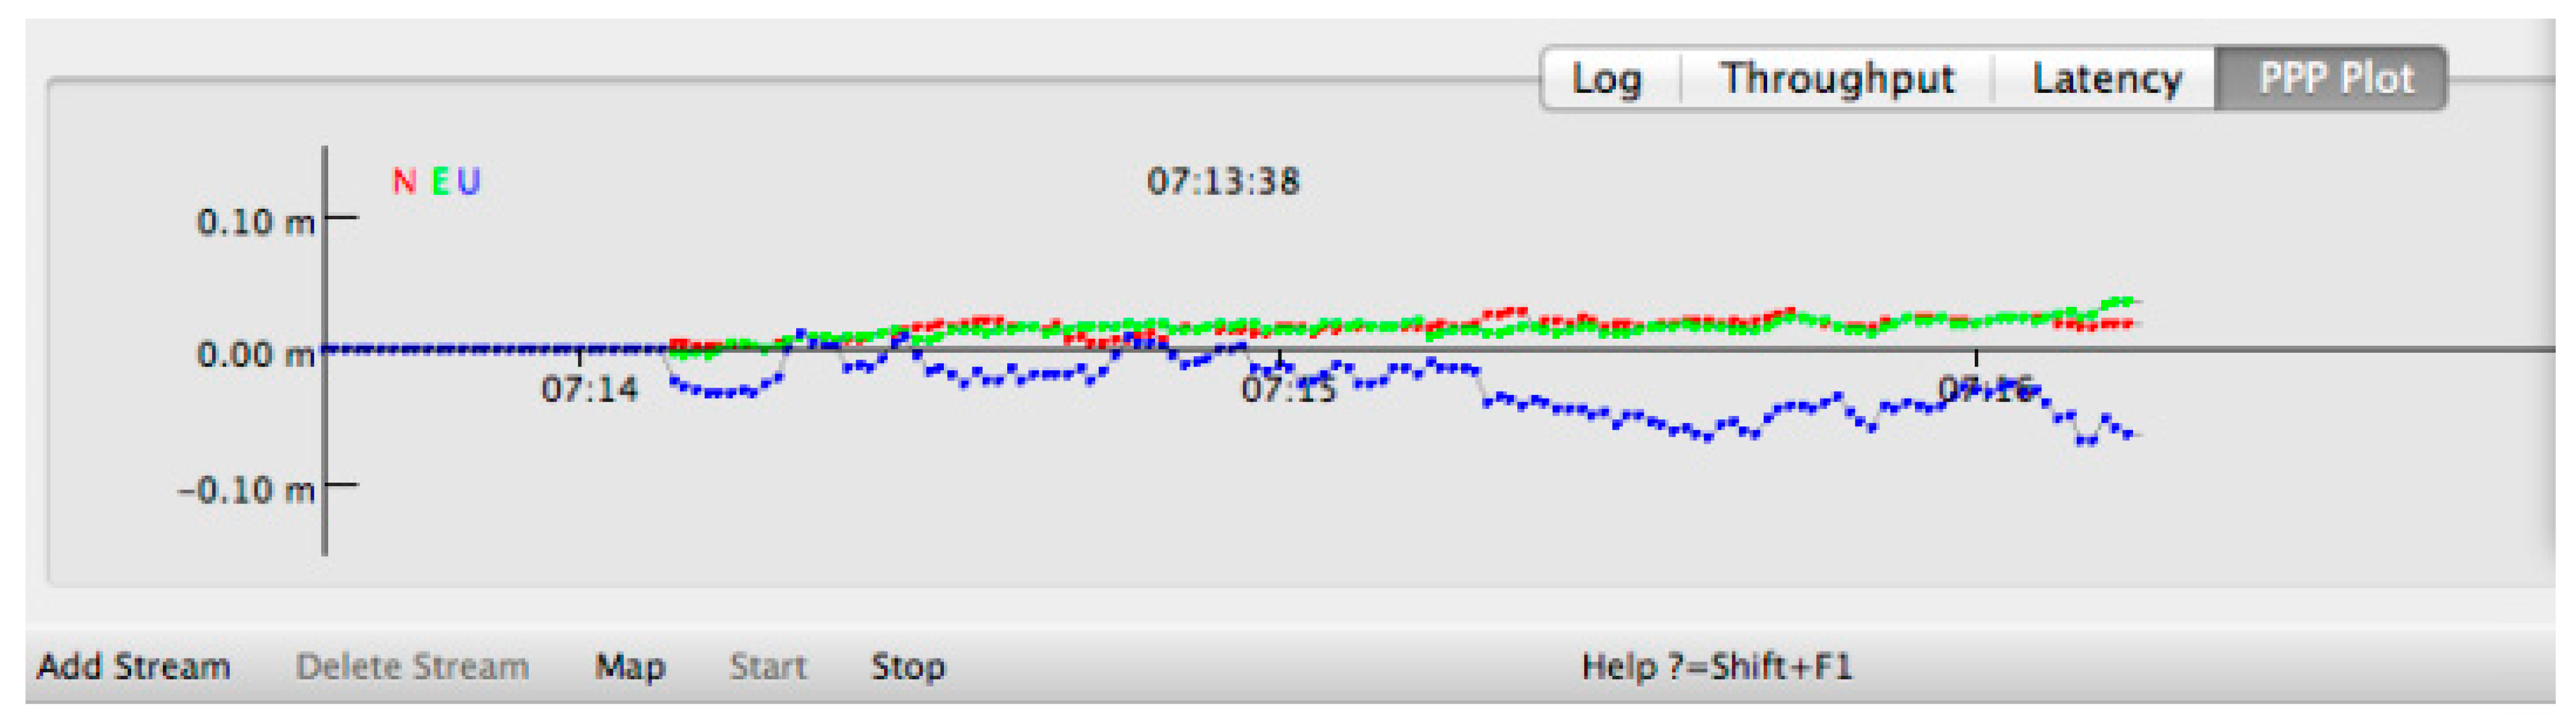
3.3. GNSS Correction Generation via NTRIP Protocol (Receptor Base, Stream Connection, PPP)
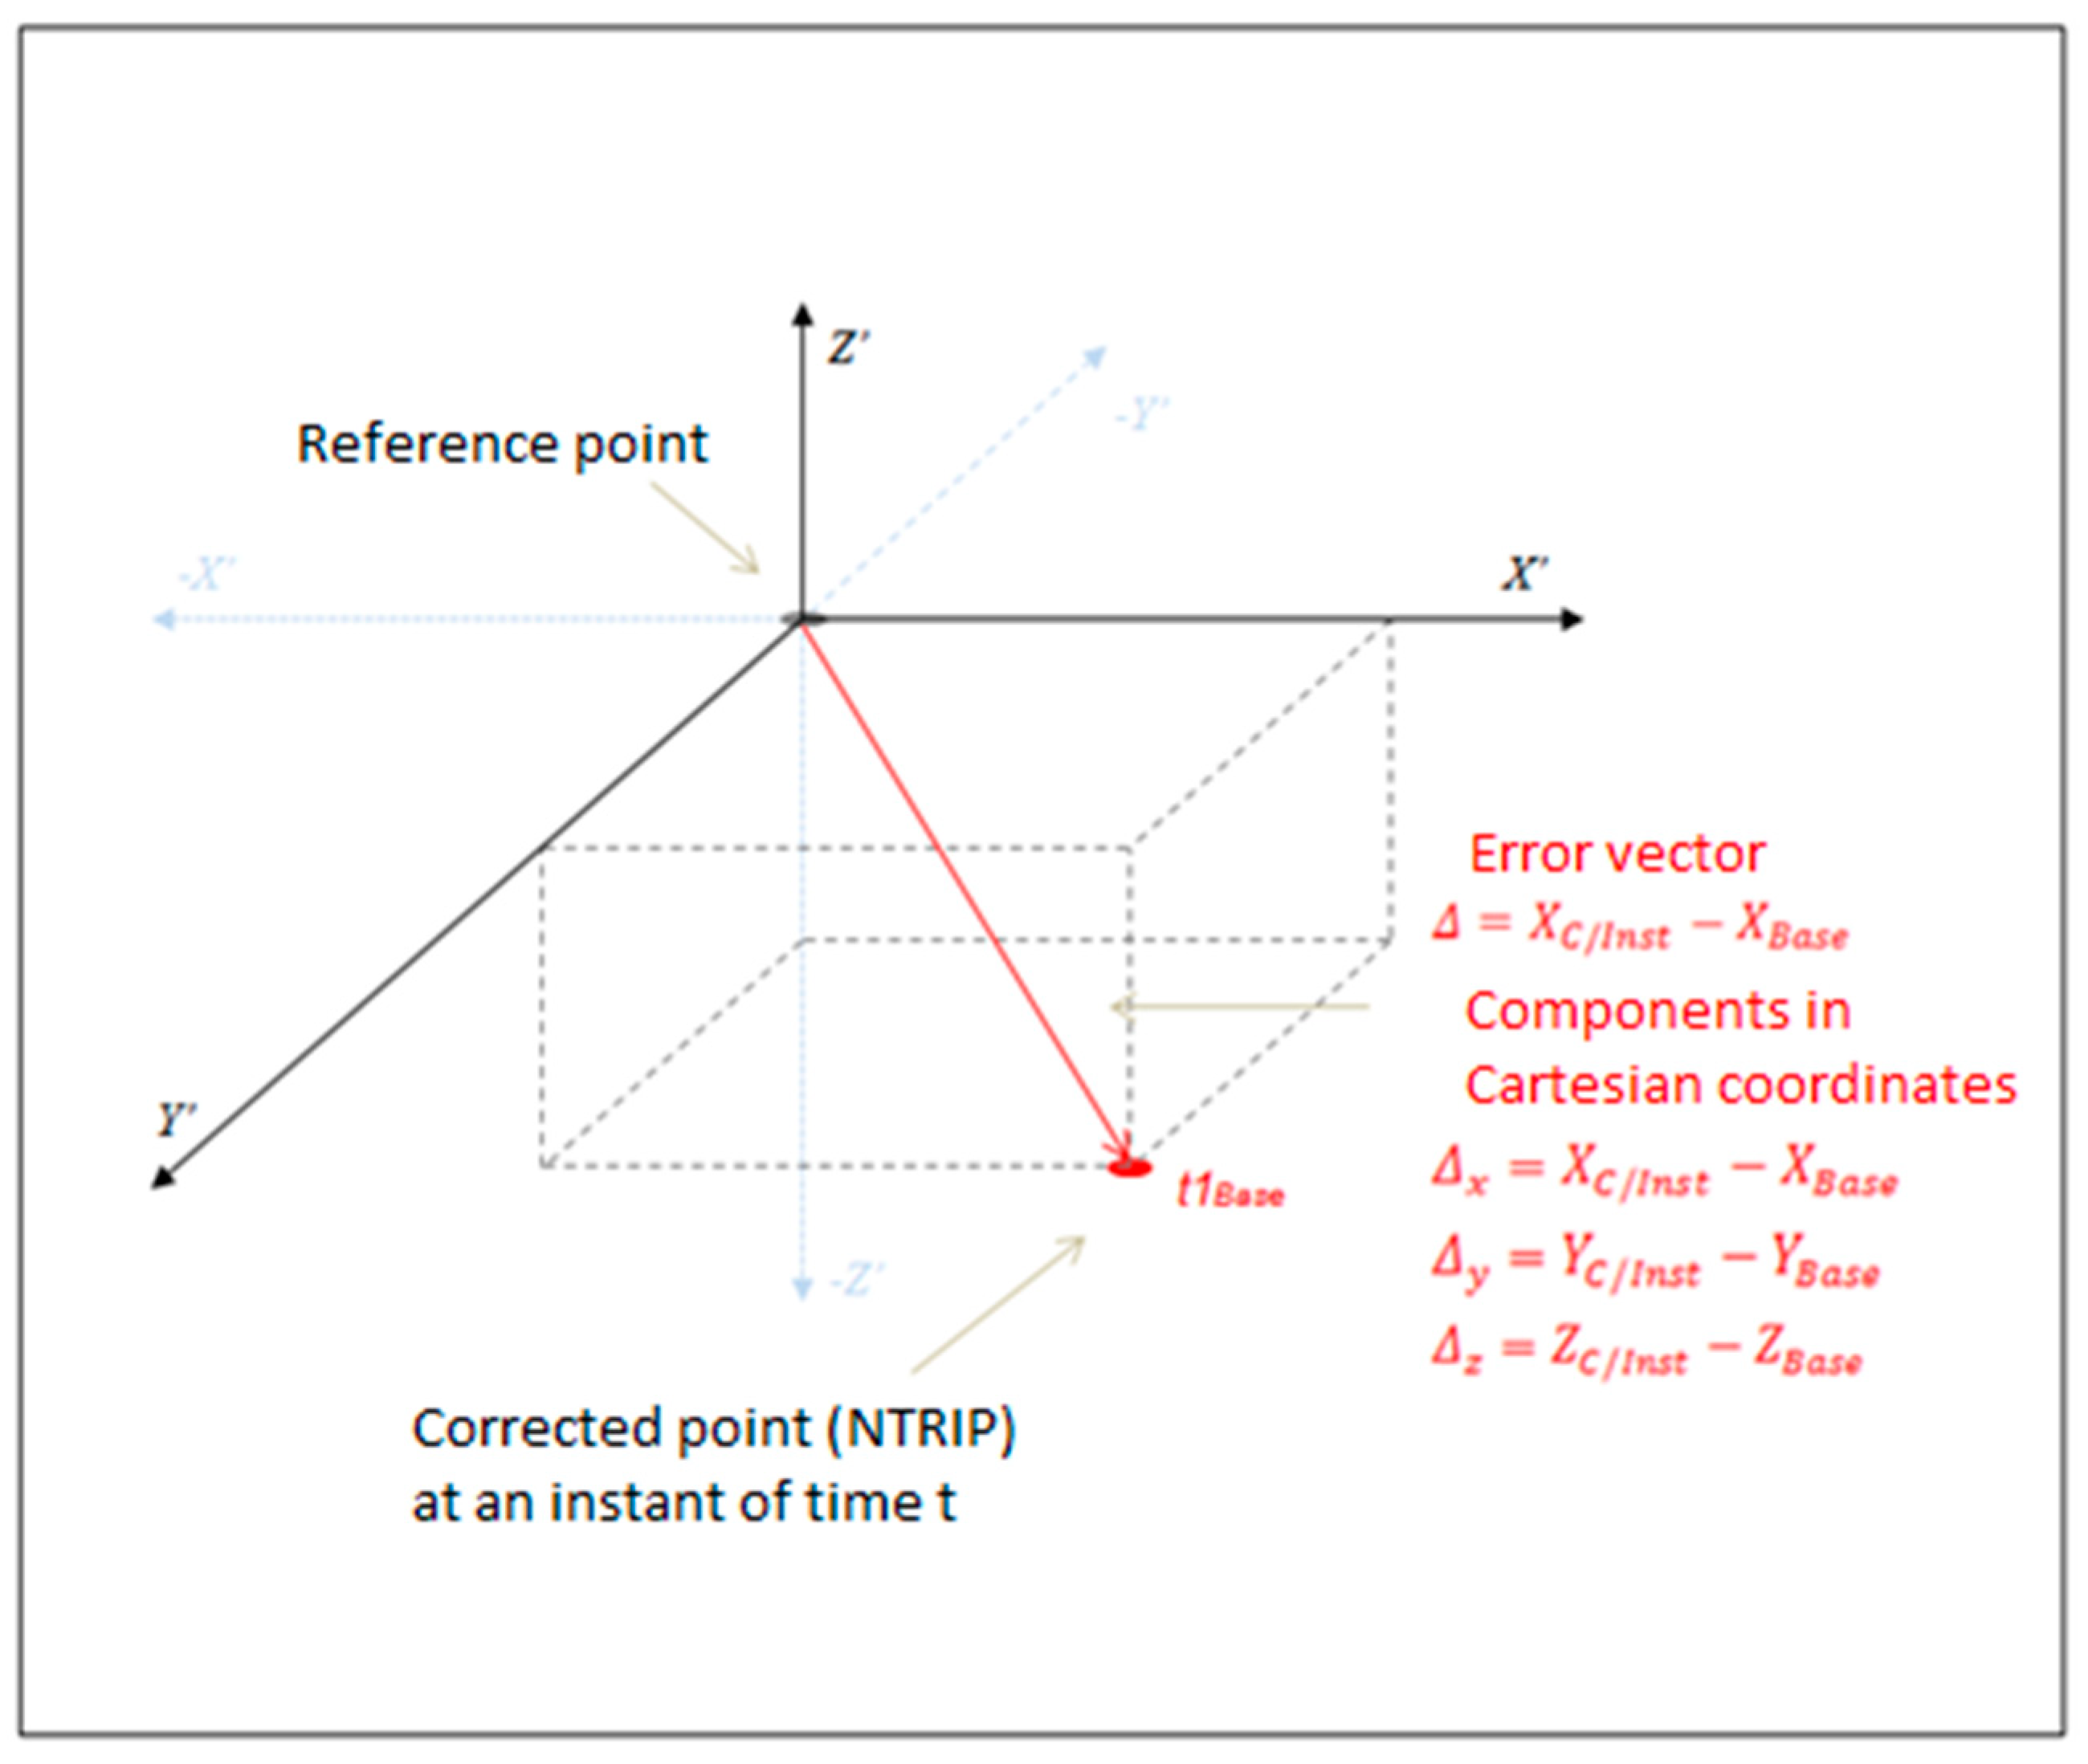
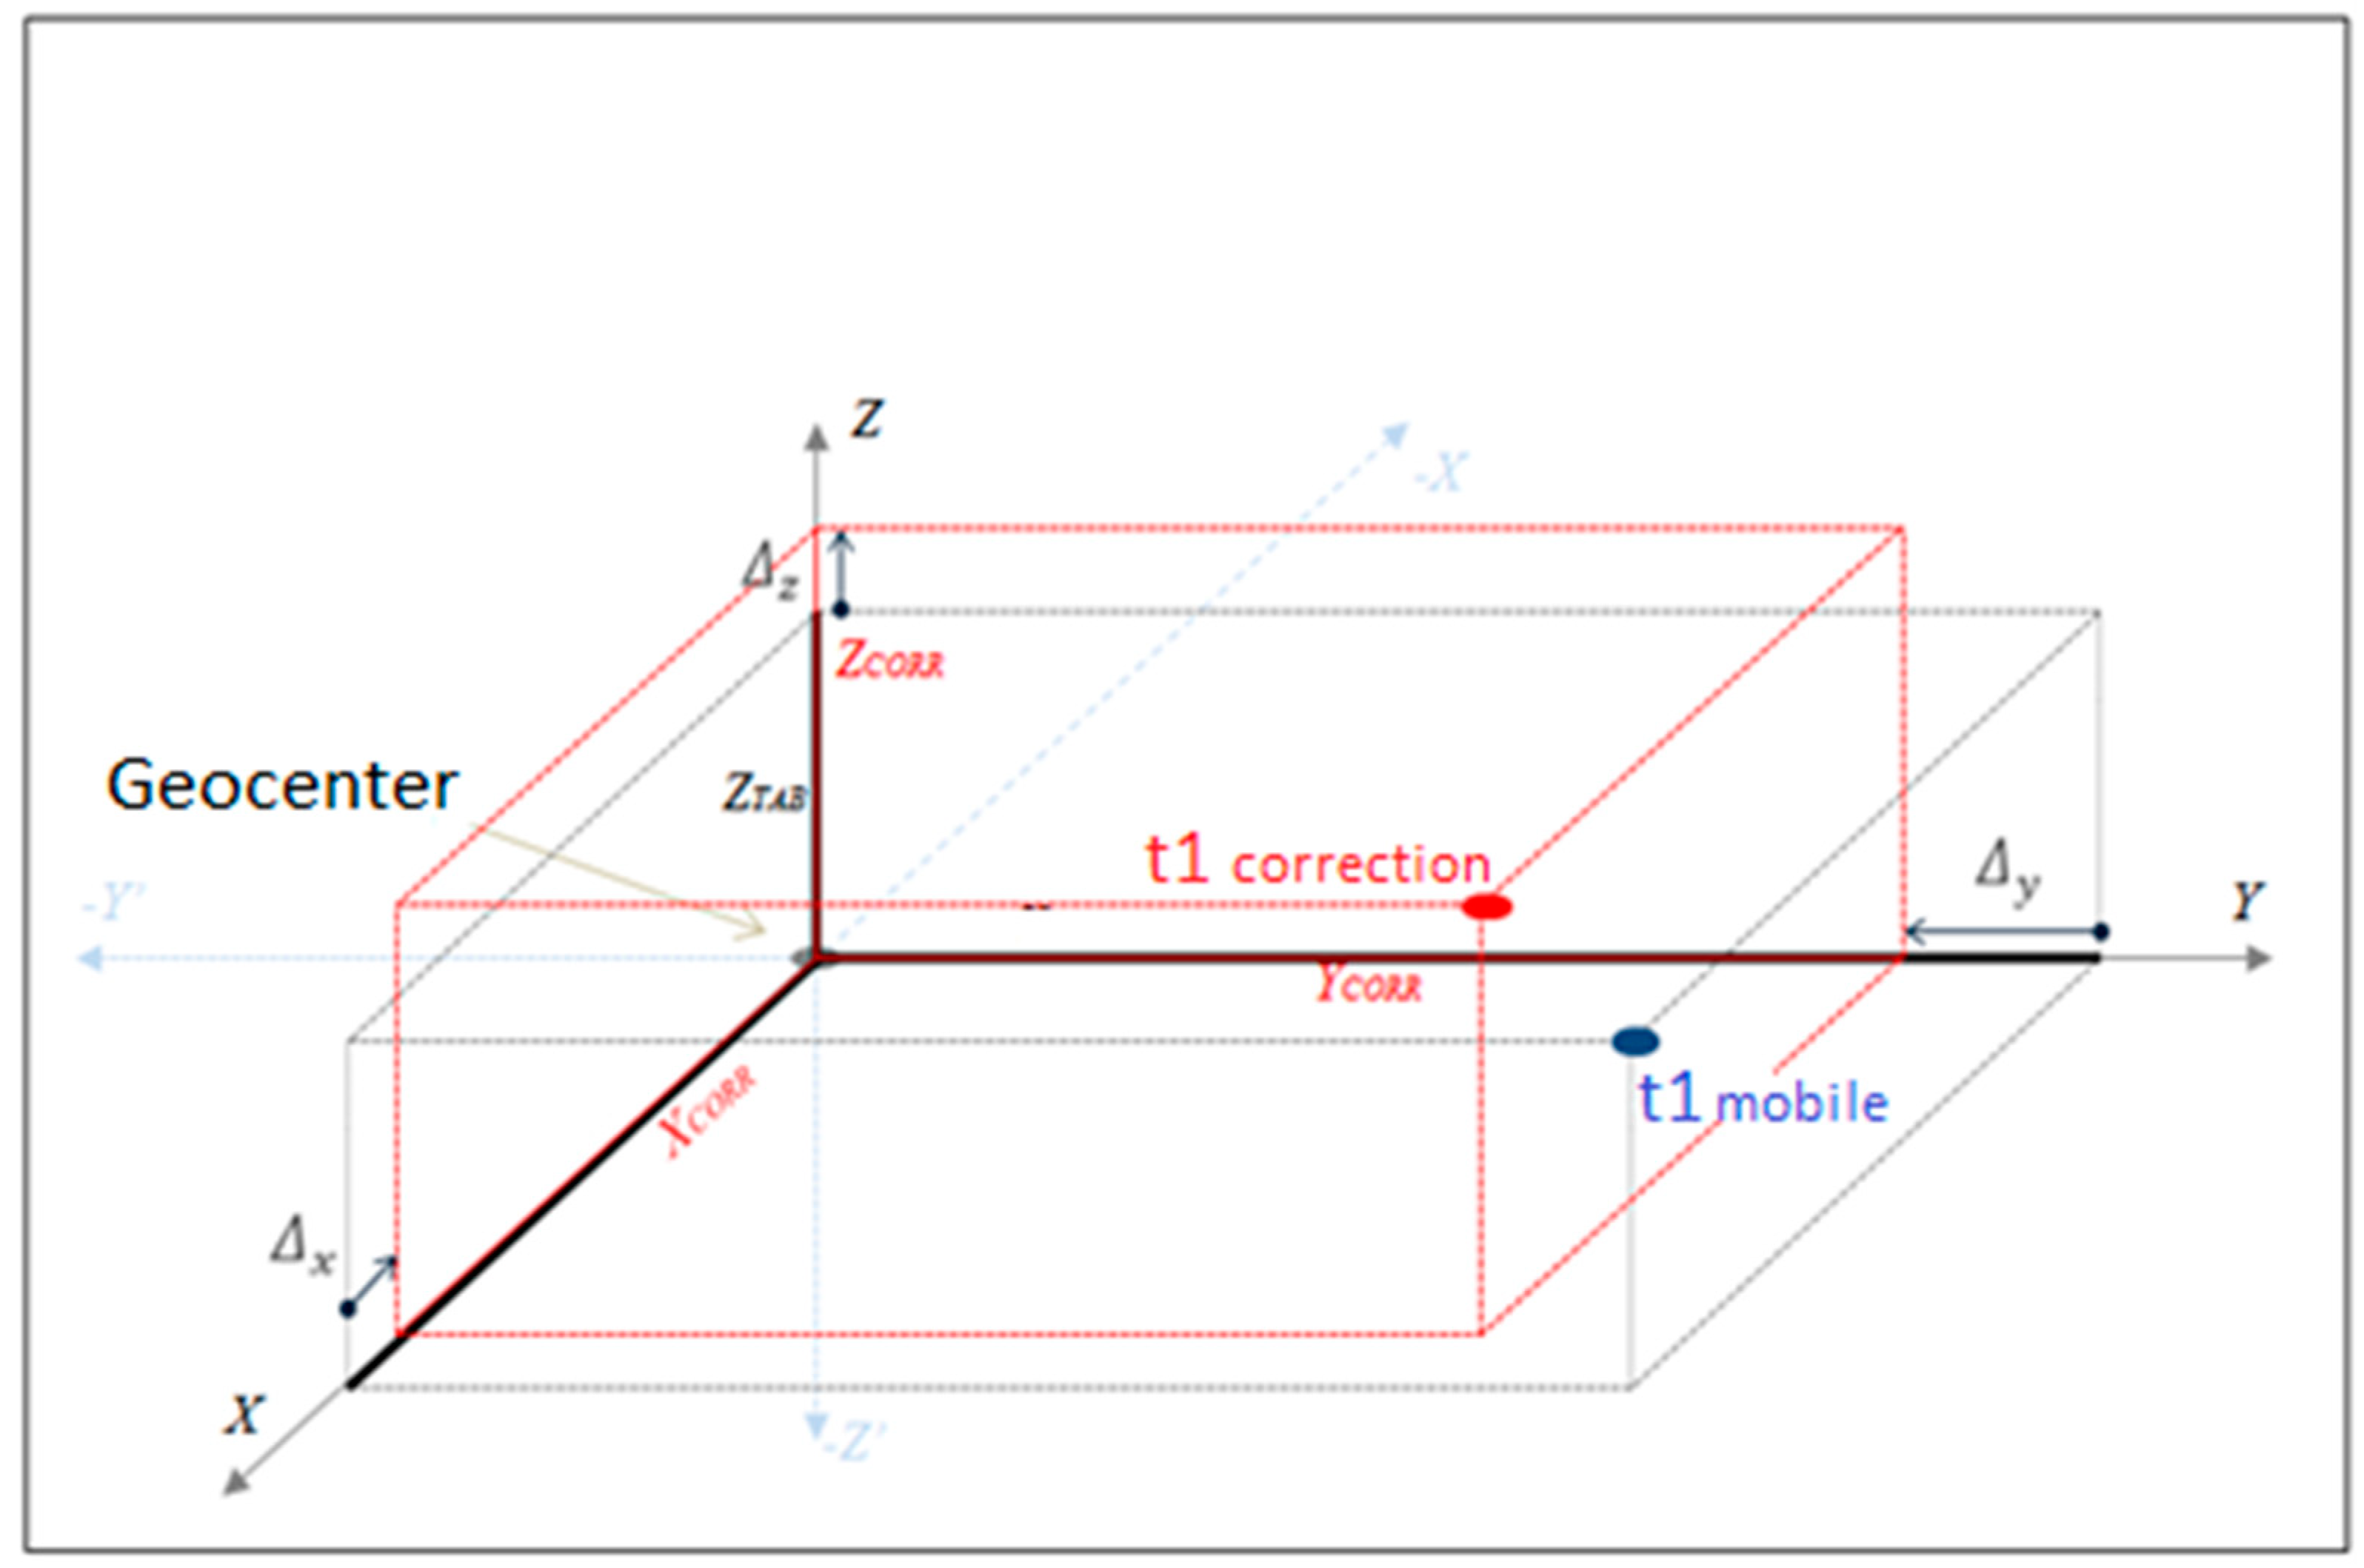
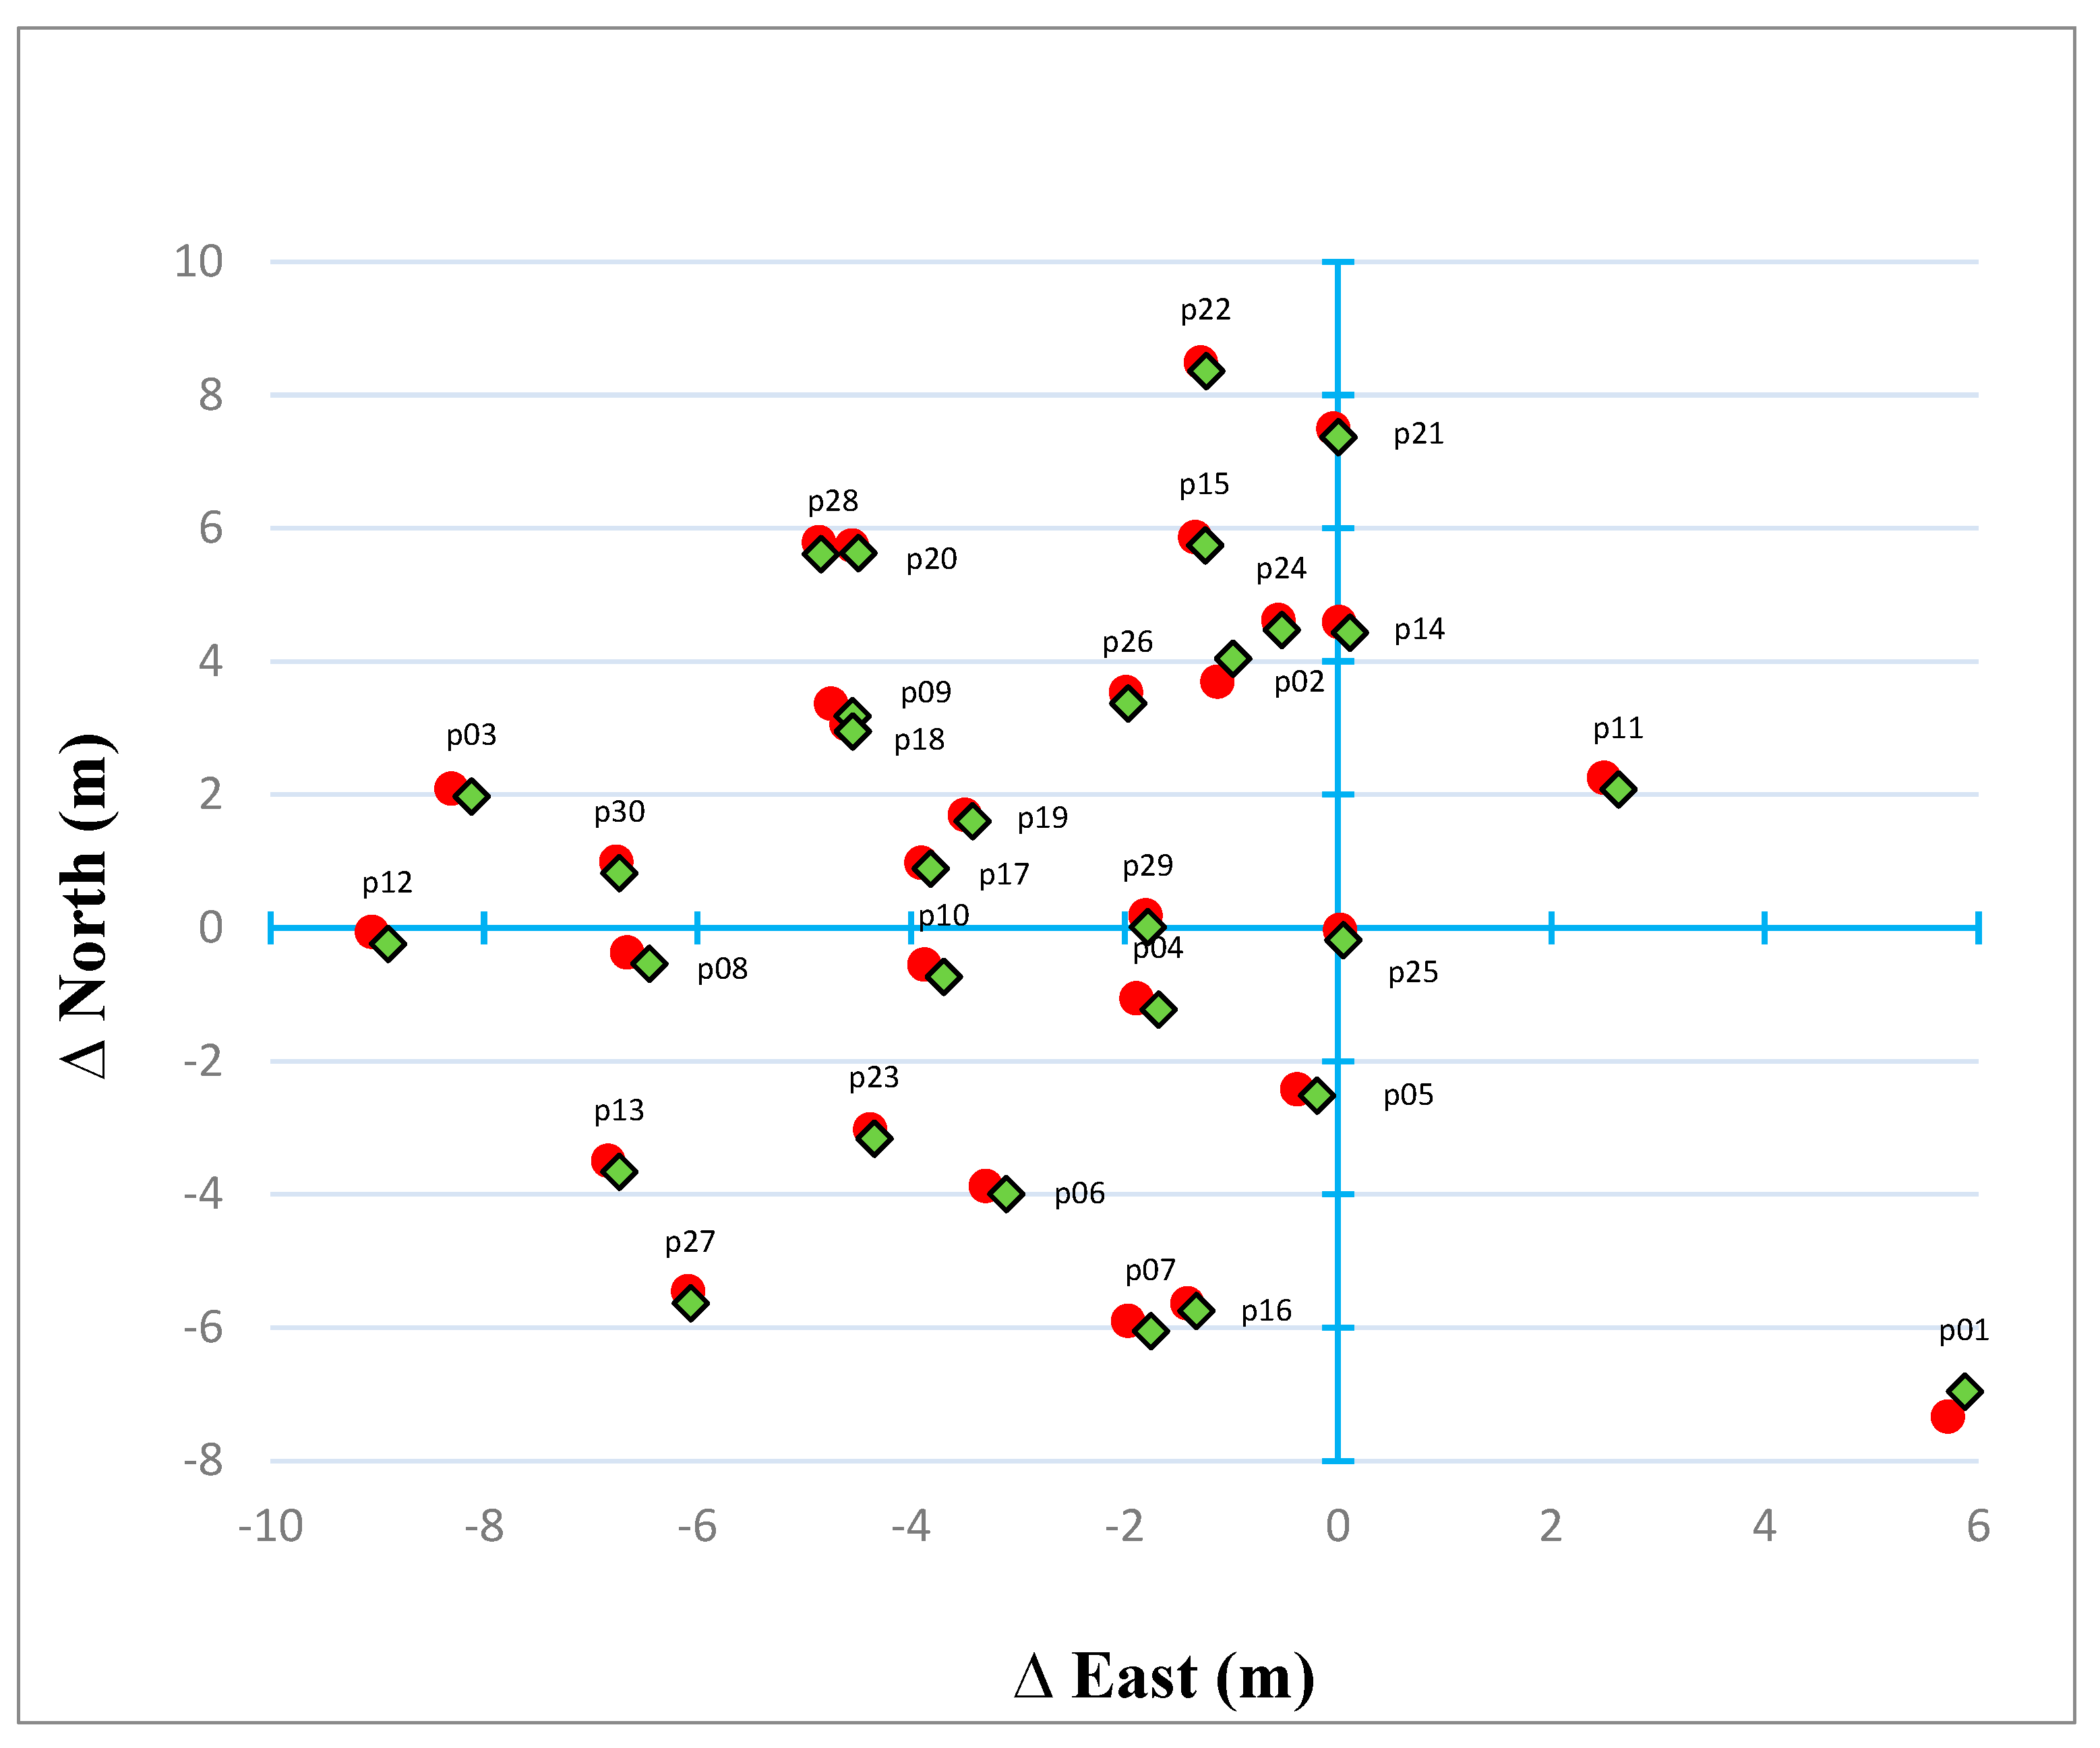
3.4. Error Vector
3.5. Design of the Mobile Application and Record of Observations of Mobile Devices
3.6. Adjusting GCP Control Points
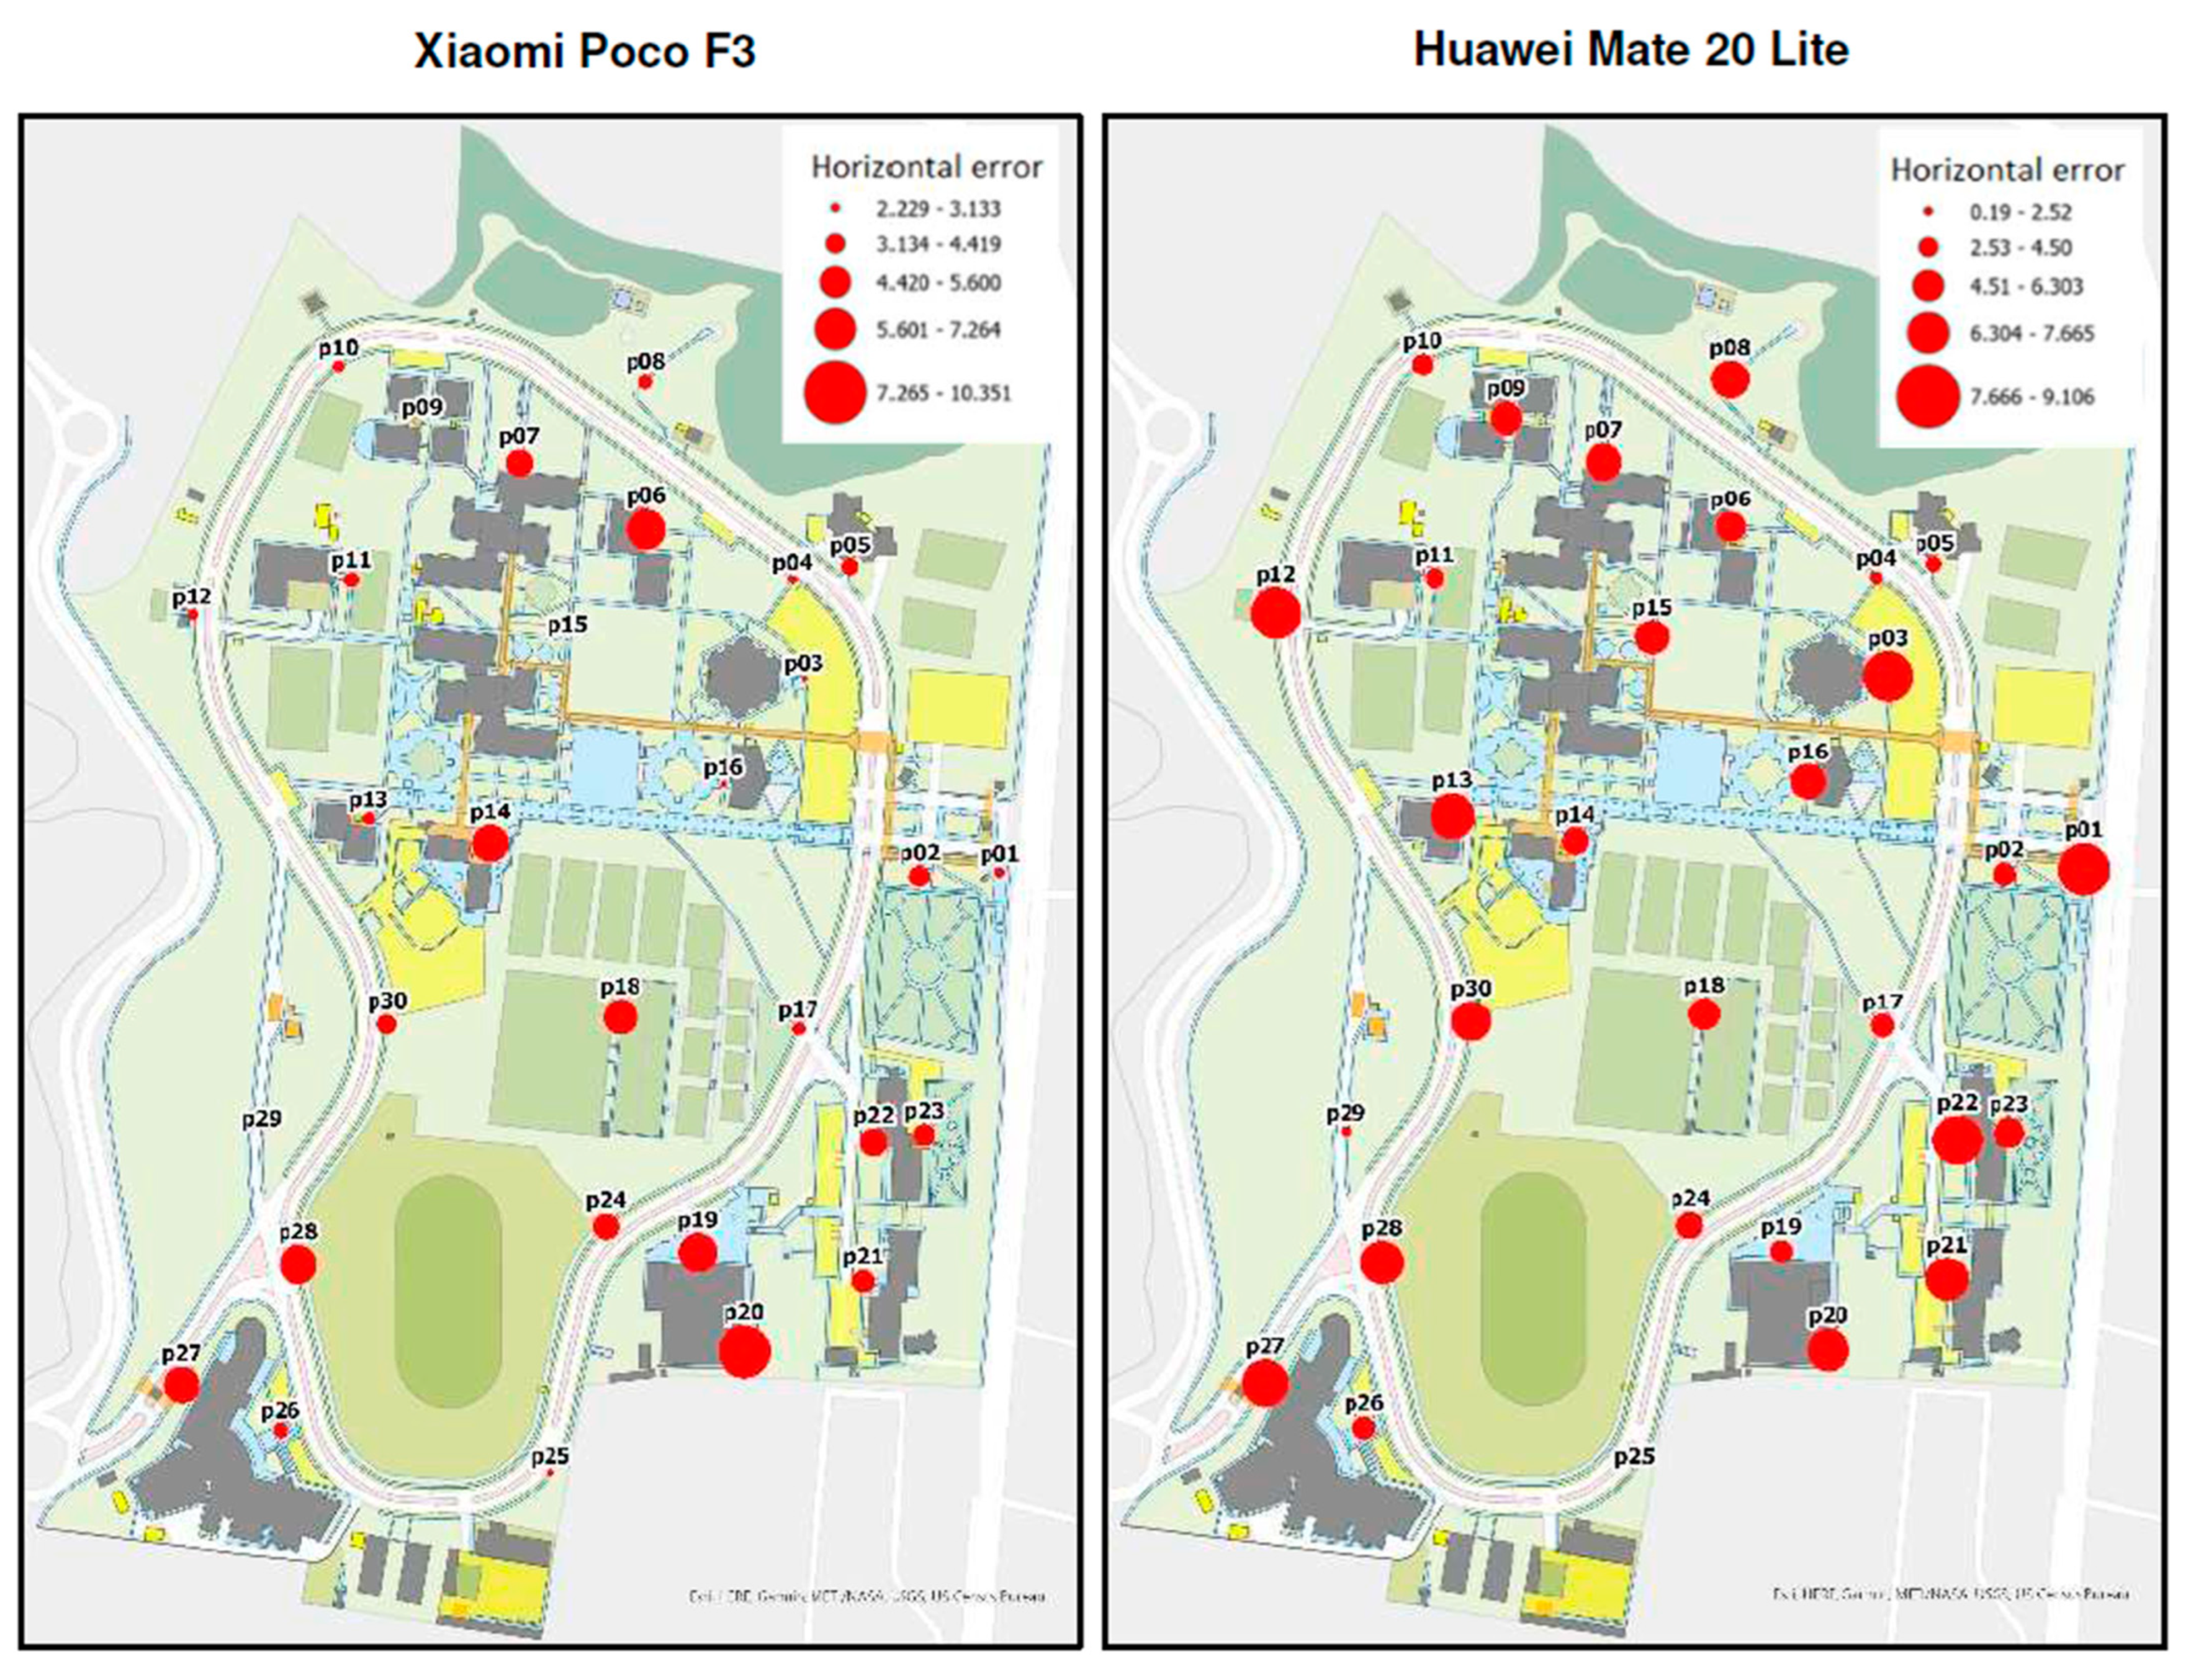
3.7. Horizontal Accuracy
4. Results
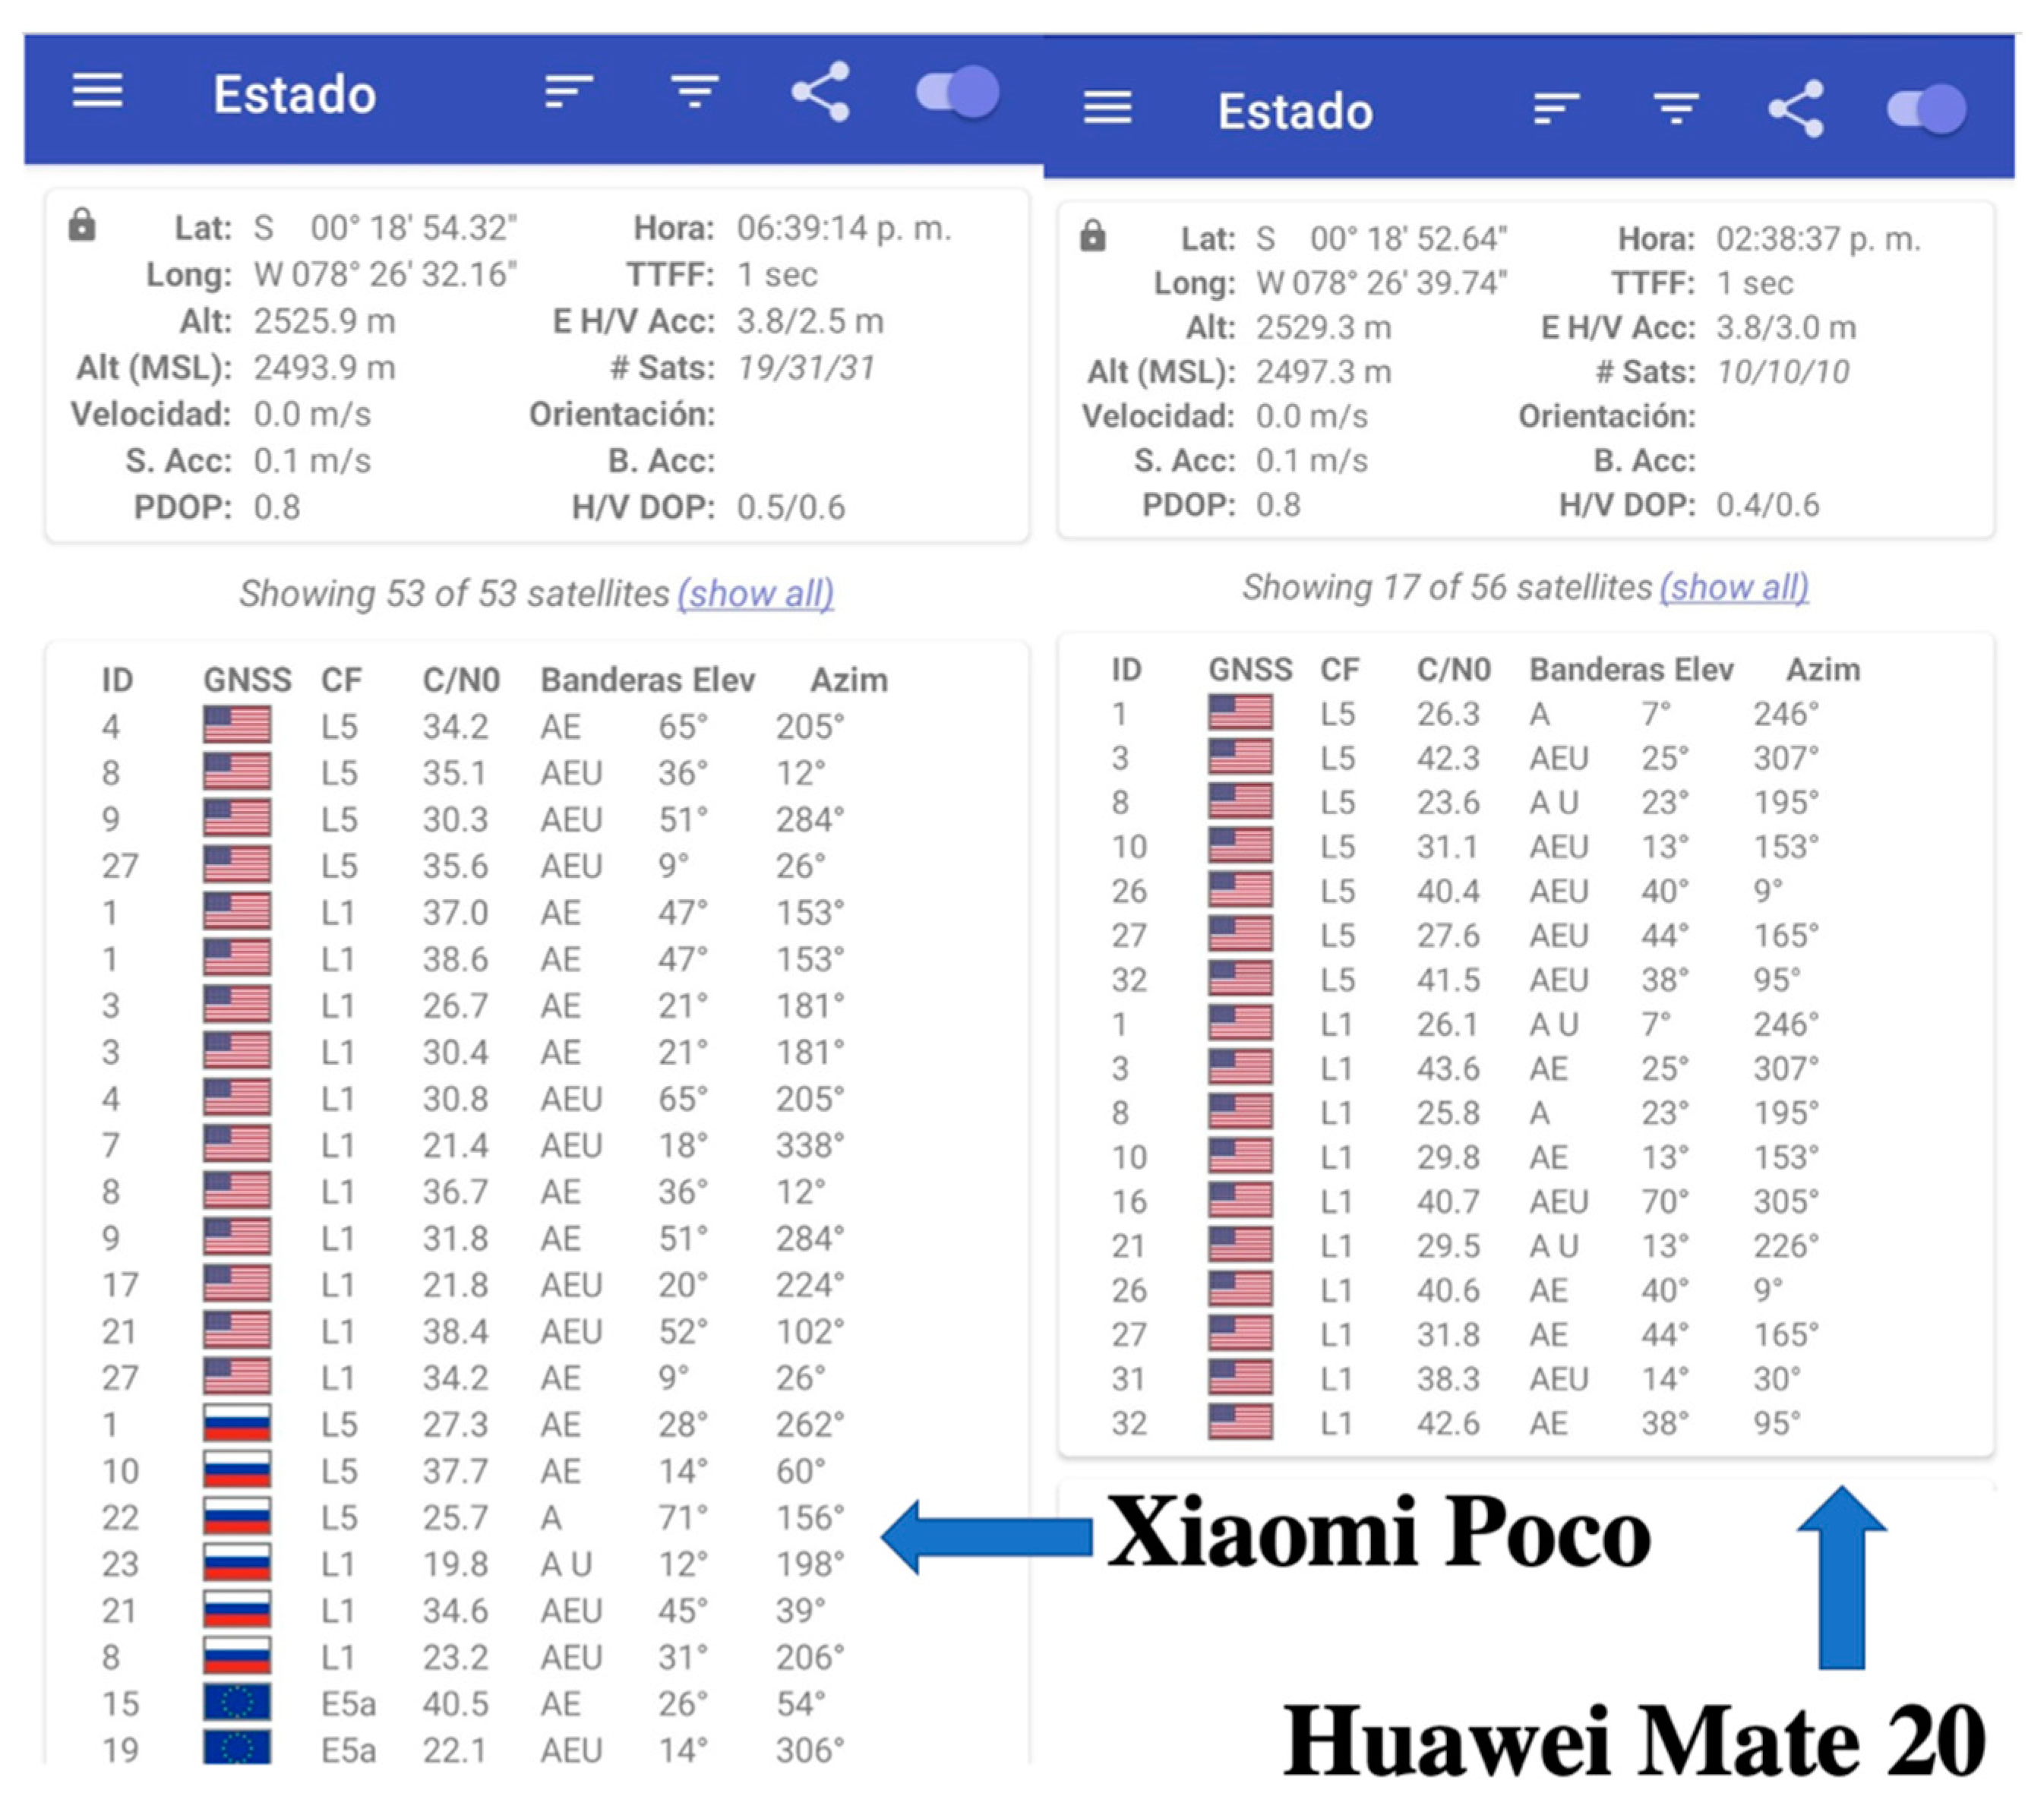
4.1. Static Positioning
4.1.1. The Case of Xiaomi Poco F3
4.1.2. The Case of Huawei Mate 20 Lite
4.2. Navigation
4.2.1. The Case of Xiaomi Poco F3
4.2.2. The Case of Huawei Mate 20 Lite
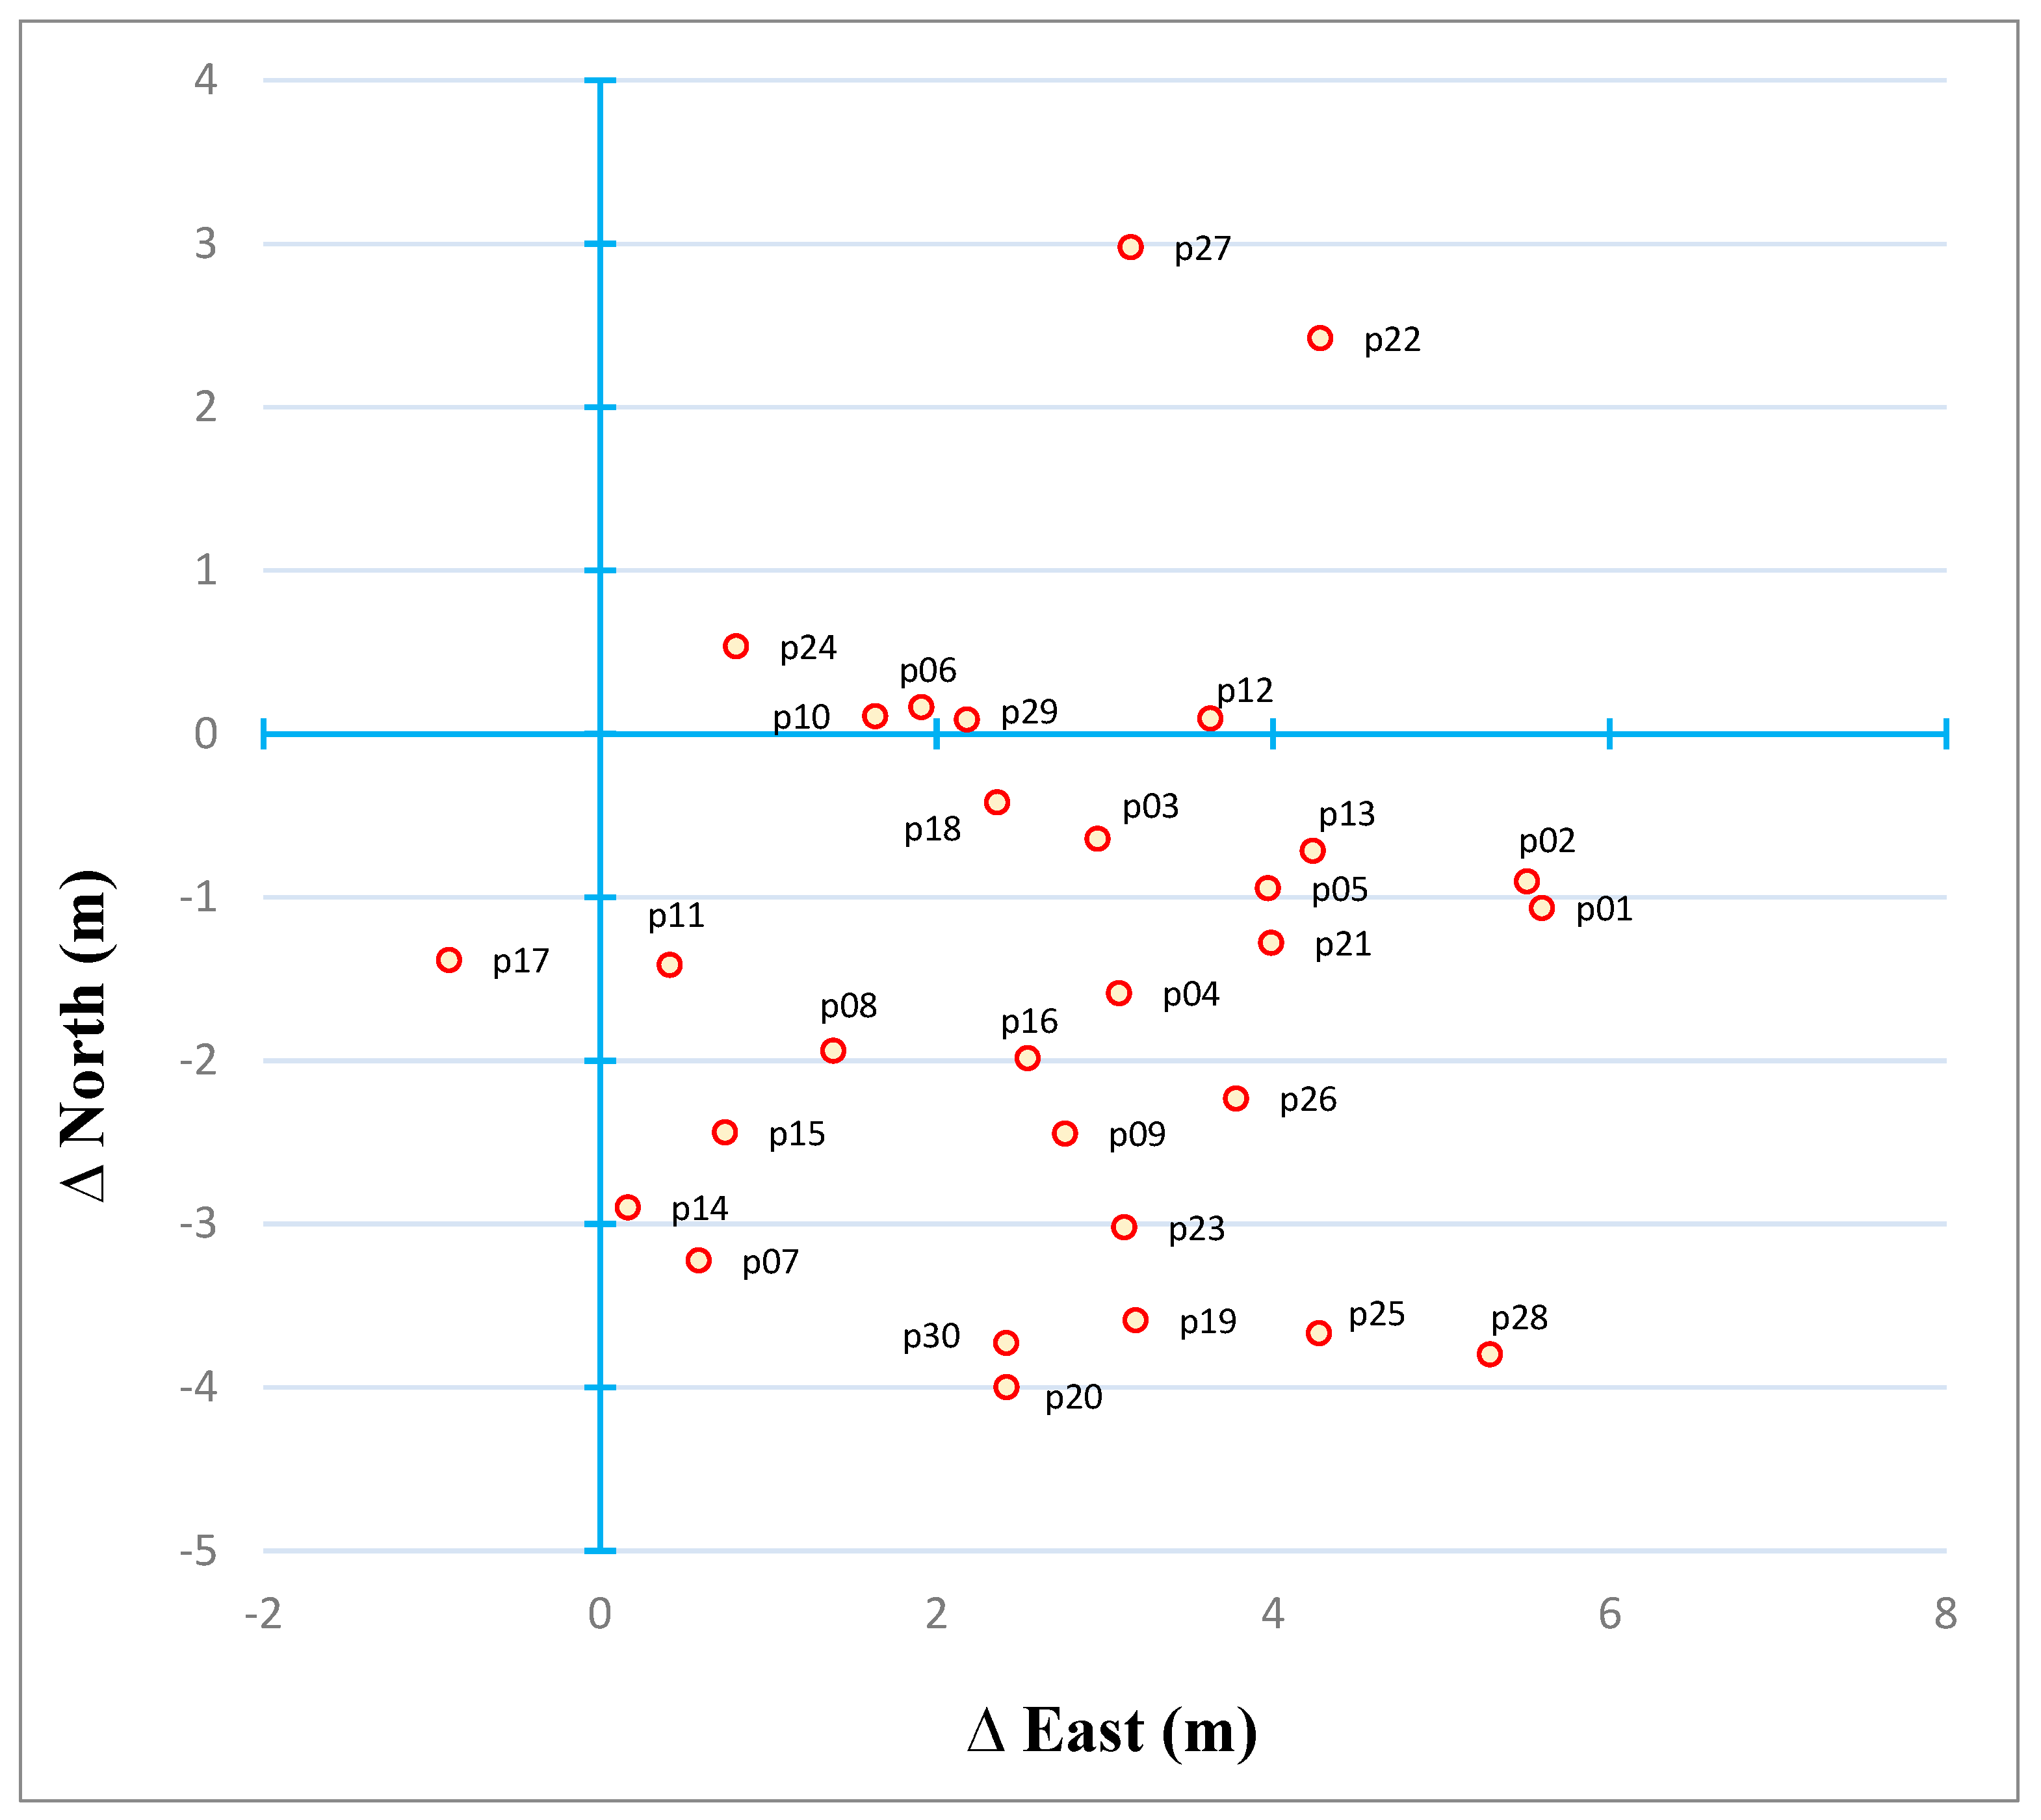
4.3. Horizontal Positional Accuracy
5. Discussion
6. Conclusions
Author Contributions
Funding
Institutional Review Board Statement
Informed Consent Statement
Data Availability Statement
Conflicts of Interest
References
- Garetti, M.; Taisch, M. Sustainable manufacturing: Trends and research challenges. Prod. Plan. Control 2012, 23, 83–104. [Google Scholar] [CrossRef]
- Chatti, M.A.; Dyckhoff, A.L.; Schroeder, U.; Thüs, H. A reference model for learning analytics. Int. J. Technol. Enhanc. Learn. 2012, 4, 318–331. [Google Scholar] [CrossRef]
- Yang, G.Z.; Bellingham, J.; Dupont, P.E.; Fischer, P.; Floridi, L.; Full, R.; Jacobstein, N.; Kumar, V.; McNutt, M.; Merrifield, R.; et al. The grand challenges of Science Robotics. Sci. Robot. 2018, 3, eaar7650. [Google Scholar] [CrossRef] [PubMed]
- Siemens, G. Learning analytics: The emergence of a discipline. Am. Behav. Sci. 2013, 57, 1380–1400. [Google Scholar] [CrossRef]
- Toulkeridis, T.; Porras, L.; Tierra, A.; Toulkeridis-Estrella, K.; Cisneros, D.; Luna, M.; Carrión, J.L.; Herrera, M.; Murillo, A.; Salinas, J.C.P.; et al. Two independent real-time precursors of the 7.8 Mw earthquake in Ecuador based on radioactive and geodetic processes—Powerful tools for an early warning system. J. Geodyn. 2019, 126, 12–22. [Google Scholar] [CrossRef]
- Baker, S.M.; Stephens, D.L.; Hill, R.P. Marketplace experiences of consumers with visual impairments: Beyond the Americans with Disabilities Act. J. Public Policy Mark. 2001, 20, 215–224. [Google Scholar] [CrossRef]
- Laforge, R.G.; Spector, W.D.; Sternberg, J. The relationship of vision and hearing impairment to one-year mortality and functional decline. J. Aging Health 1992, 4, 126–148. [Google Scholar] [CrossRef]
- Jessup, G.M.; Bundy, A.C.; Cornell, E. To be or to refuse to be? Exploring the concept of leisure as resistance for young people who are visually impaired. Leis. Stud. 2013, 32, 191–205. [Google Scholar] [CrossRef]
- Gelberg, L.; Andersen, R.M.; Leake, B.D. The Behavioral Model for Vulnerable Populations: Application to medical care use and outcomes for homeless people. Health Serv. Res. 2000, 34, 1273. [Google Scholar]
- Bourne, R.; Steinmetz, J.D.; Flaxman, S.; Briant, P.S.; Taylor, H.R.; Resnikoff, S.; Casson, R.J.; Abdoli, A.; Abu-Gharbieh, E.; Afshin, A.; et al. Trends in prevalence of blindness and distance and near vision impairment over 30 years: An analysis for the Global Burden of Disease Study. Lancet Glob. Health 2021, 9, e130–e143. [Google Scholar] [CrossRef]
- Fernandes, A.G.; Alves, M.; Valdrighi, N.Y.; de Almeida, R.C.; Nakano, C.T. Visual impairment and blindness in the Xingu Indigenous Park–Brazil. Int. J. Equity Health 2021, 20, 197. [Google Scholar] [CrossRef] [PubMed]
- Ackland, P.; Resnikoff, S.; Bourne, R. World blindness and visual impairment: Despite many successes, the problem is growing. Community Eye Health 2017, 30, 71. [Google Scholar] [PubMed]
- Hosoda, Y.; Yoshikawa, M.; Miyake, M.; Tabara, Y.; Shimada, N.; Zhao, W.; Oishi, A.; Nakanishi, H.; Hata, M.; Akagi, T.; et al. CCDC102B confers risk of low vision and blindness in high myopia. Nat. Commun. 2018, 9, 1782. [Google Scholar] [CrossRef]
- Reis, T.; Lansingh, V.; Ramke, J.; Silva, J.C.; Resnikoff, S.; Furtado, J.M. Cataract as a cause of blindness and vision impairment in Latin America: Progress made and challenges beyond 2020. Am. J. Ophthalmol. 2021, 225, 1–10. [Google Scholar] [CrossRef]
- Marques, A.P.; Ramke, J.; Cairns, J.; Butt, T.; Zhang, J.H.; Muirhead, D.; Jones, I.; Tong, B.A.A.; Swenor, B.K.; Faal, H.; et al. Global economic productivity losses from vision impairment and blindness. eClinicalMedicine 2021, 35, 100852. [Google Scholar] [CrossRef] [PubMed]
- CONADIS. Estadísticas de Discapacidad—Consejo Nacional para la Igualdad de Discapacidades. Ministerio de Salud Publica. 2021. Available online: https://www.consejodiscapacidades.gob.ec/estadisticas-de-discapacidad/ (accessed on 14 October 2021).
- Porter, M.E.; Heppelmann, J.E. How smart, connected products are transforming companies. Harv. Bus. Rev. 2015, 93, 96–114. [Google Scholar]
- Abdullah, A.; Ismael, A.; Rashid, A.; Abou-ElNour, A.; Tarique, M. Real time wireless health monitoring application using mobile devices. Int. J. Comput. Netw. Commun. 2015, 7, 13–30. [Google Scholar] [CrossRef]
- Sung, Y.T.; Chang, K.E.; Liu, T.C. The effects of integrating mobile devices with teaching and learning on students’ learning performance: A meta-analysis and research synthesis. Comput. Educ. 2016, 94, 252–275. [Google Scholar] [CrossRef]
- Zhang, H.; Yuan, Y.; Li, W.; Zhang, B.; Ou, J. A grid-based tropospheric product for China using a GNSS network. J. Geod. 2018, 92, 765–777. [Google Scholar] [CrossRef]
- Vendome, C.; Solano, D.; Liñán, S.; Linares-Vásquez, M. Can everyone use my app? An empirical study on accessibility in android apps. In Proceedings of the 2019 IEEE International Conference on Software Maintenance and Evolution (ICSME), Cleveland, OH, USA, 29 September–4 October 2019; IEEE: Piscataway, NJ, USA; 2019; pp. 41–52. [Google Scholar]
- Alshayban, A.; Ahmed, I.; Malek, S. Accessibility issues in android apps: State of affairs, sentiments, and ways forward. In Proceedings of the 2020 IEEE/ACM 42nd International Conference on Software Engineering (ICSE), Seoul, Republic of Korea, 16–24 July 2020; IEEE: Piscataway, NJ, USA, 2020; pp. 1323–1334. [Google Scholar]
- Damaceno, R.J.P.; Braga, J.C.; Mena-Chalco, J.P. Mobile device accessibility for the visually impaired: Problems mapping and recommendations. Univers. Access Inf. Soc. 2018, 17, 421–435. [Google Scholar] [CrossRef]
- Branham, S.M.; Mukkath Roy, A.R. Reading between the guidelines: How commercial voice assistant guidelines hinder accessibility for blind users. In The 21st International ACM SIGACCESS Conference on Computers and Accessibility; Association for Computing Machinery: New York, NY, USA, 2019; pp. 446–458. [Google Scholar]
- Costa, L.C.; Correa, A.G.; Dalmon, D.L.; Zuffo, M.K.; Lopes, R.D. Accessible educational digital book on tablets for people with visual impairment. IEEE Trans. Consum. Electron. 2015, 61, 271–278. [Google Scholar] [CrossRef]
- Bıyık, C.; Abareshi, A.; Paz, A.; Ruiz, R.A.; Battarra, R.; Rogers, C.D.; Lizarraga, C. Smart mobility adoption: A review of the literature. J. Open Innov. Technol. Mark. Complex. 2021, 7, 146. [Google Scholar] [CrossRef]
- Martínez-Cruz, S.; Morales-Hernández, L.A.; Pérez-Soto, G.I.; Benitez-Rangel, J.P.; Camarillo-Gómez, K.A. An Outdoor Navigation Assistance System for Visually Impaired People in Public Transportation. IEEE Access 2021, 9, 130767–130777. [Google Scholar] [CrossRef]
- Kuriakose, B.; Shrestha, R.; Sandnes, F.E. Smartphone navigation support for blind and visually impaired people-a comprehensive analysis of potentials and opportunities. In International Conference on Human-Computer Interaction; Springer: Cham, Switzerland, 2020; pp. 568–583. [Google Scholar]
- Khenkar, S.; Alsulaiman, H.; Ismail, S.; Fairaq, A.; Jarraya, S.K.; Ben-Abdallah, H. ENVISION: Assisted navigation of visually impaired smartphone users. Procedia Comput. Sci. 2016, 100, 128–135. [Google Scholar] [CrossRef]
- Tristán, G.D.; Arcia, A.; Montes Franceschi, H.; Pérez, R. Aplicación móvil para el monitoreo de personas con discapacidad visual. Tecnol. Accesibilidad 2016, 1, 93–100. [Google Scholar]
- Kuutti, S.; Fallah, S.; Katsaros, K.; Dianati, M.; Mccullough, F.; Mouzakitis, A. A survey of the state-of-the-art localization techniques and their potentials for autonomous vehicle applications. IEEE Internet Things J. 2018, 5, 829–846. [Google Scholar] [CrossRef]
- Kealy, A.; Retscher, G.; Toth, C.; Hasnur-Rabiain, A.; Gikas, V.; Grejner-Brzezinska, D.; Danezis, C.; Moore, T. Collaborative navigation as a solution for PNT applications in GNSS challenged environments–report on field trials of a joint FIG/IAG working group. J. Appl. Geod. 2015, 9, 244–263. [Google Scholar] [CrossRef]
- Forootan, E.; Dehvari, M.; Farzaneh, S.; Khaniani, A.S. A functional modelling approach for reconstructing 3 and 4 dimensional wet refractivity fields in the lower atmosphere using GNSS measurements. Adv. Space Res. 2021, 68, 4024–4038. [Google Scholar] [CrossRef]
- Li, X.; Ge, M.; Dai, X.; Ren, X.; Fritsche, M.; Wickert, J.; Schuh, H. Accuracy and reliability of multi-GNSS real-time precise positioning: GPS, GLONASS, BeiDou, and Galileo. J. Geod. 2015, 89, 607–635. [Google Scholar] [CrossRef]
- Li, X.; Zhang, X.; Ren, X.; Fritsche, M.; Wickert, J.; Schuh, H. Precise positioning with current multi-constellation global navigation satellite systems: GPS, GLONASS, Galileo and BeiDou. Sci. Rep. 2015, 5, 8328. [Google Scholar] [CrossRef]
- Pan, L.; Zhang, X.; Li, X.; Li, X.; Lu, C.; Liu, J.; Wang, Q. Satellite availability and point positioning accuracy evaluation on a global scale for integration of GPS, GLONASS, BeiDou and Galileo. Adv. Space Res. 2019, 63, 2696–2710. [Google Scholar] [CrossRef]
- Pan, L.; Zhang, X.; Liu, J.; Li, X.; Li, X. Performance evaluation of single-frequency precise point positioning with GPS, GLONASS, BeiDou and Galileo. J. Navig. 2017, 70, 465–482. [Google Scholar] [CrossRef]
- Bellone, T.; Dabove, P.; Manzino, A.M.; Taglioretti, C. Real-time monitoring for fast deformations using GNSS low-cost receivers. Geomat. Nat. Hazards Risk 2016, 7, 458–470. [Google Scholar] [CrossRef]
- Kasat, N.; Dharmappa, D.; Singh, F.B.; Ramakrishna, B.N. Static Coordinate Estimation Techniques Based on Satellite Navigation. In Proceedings of the 2019 4th International Conference on Electrical, Electronics, Communication, Computer Technologies and Optimization Techniques (ICEECCOT), Mysuru, India, 13–14 December 2019; IEEE: Piscataway, NJ, USA, 2019; pp. 64–69. [Google Scholar]
- Li, Z.; Zhang, J.; Li, T.; He, X.; Wu, M. Analysis of static and dynamic real-time precise point positioning and precision based on SSR correction. In Proceedings of the 2016 IEEE International Conference on Information and Automation (ICIA), Ningbo, China, 1–3 August 2016; IEEE: Piscataway, NJ, USA, 2016; pp. 2022–2027. [Google Scholar]
- Luna, M.P.; Staller, A.; Tierra, A.; Molina, X.; Toulkeridis, T. Analysis of statistical interpolation methods to generate the velocities model for continental Ecuador from GNSS data. Rev. Geogr. Venez. 2022; in press. [Google Scholar]
- Zhang, X.; Ross, A.S.; Fogarty, J. Robust annotation of mobile application interfaces in methods for accessibility repair and enhancement. In Proceedings of the 31st Annual ACM Symposium on User Interface Software and Technology, Berlin, Germany, 14–18 October 2018; Association for Computing Machinery: New York, NY, USA, 2018; pp. 609–621. [Google Scholar]
- Um, I.; Park, S.; Oh, S.; Kim, H. Analyzing Location Accuracy of Unmanned Vehicle According to RTCM Message Frequency of RTK-GPS. In Proceedings of the 2019 25th Asia-Pacific Conference on Communications (APCC), Ho Chi Minh City, Vietnam, 6–8 November 2019; IEEE: Piscataway, NJ, USA, 2019; pp. 326–330. [Google Scholar]
- Lee, Y.C. Assessing the Real-time Positioning Accuracy of Low-cost GPS Receiver using NTRIP-based Augmentation Service. J. Korean Soc. Geospat. Inf. Sci. 2015, 23, 31–39. [Google Scholar]
- Vana, S.; Aggrey, J.; Bisnath, S.; Leandro, R.; Urquhart, L.; Gonzalez, P. Analysis of GNSS correction data standards for the automotive market. Navigation 2019, 66, 577–592. [Google Scholar] [CrossRef]
- Stürze, A.; Mervart, L.; Weber, G.; Rülke, A.; Wiesensarter, E.; Neumaier, P. The new version 2.12 of BKG Ntrip Client (BNC). Geophys. Res. Abstr. 2016, 18, 12012. [Google Scholar]
- Erol, S.; Alkan, R.M.; Ozulu, İ.M.; İlçi, V. Performance analysis of real-time and post-mission kinematic precise point positioning in marine environments. Geod. Geodyn. 2020, 11, 401–410. [Google Scholar] [CrossRef]
- Wang, Z.; Li, Z.; Wang, L.; Wang, X.; Yuan, H. Assessment of multiple GNSS real-time SSR products from different analysis centers. ISPRS Int. J. Geo-Inf. 2018, 7, 85. [Google Scholar] [CrossRef]
- Carranza Carranza, A.A.; Reyes Orozco, J.A. Análisis en Implementación de Diferencial de GPS en Tiempo Real a Través de a Tecnología NTRIP para la EERSA [Escuela Superior Politécnica de Chimborazo]. 2017. Available online: http://dspace.espoch.edu.ec/handle/123456789/8434 (accessed on 6 February 2022).
- Cisneros, D.; Zabala, M.; Oñate, A. REGME-IP Real Time Project. In Proceedings of the The International Conference on Advances in Emerging Trends and Technologies, Riobamba, Ecuador, 26–31 October 2020; Springer: Cham, Switzerland, 2020; pp. 42–57. [Google Scholar]
- Liu, Q.; Hernández-Pajares, M.; Yang, H.; Monte-Moreno, E.; Roma-Dollase, D.; García-Rigo, A.; Li, Z.; Wang, N.; Laurichesse, D.; Blot, A.; et al. The cooperative IGS RT-GIMs: A reliable estimation of the global ionospheric electron content distribution in real time. Earth Syst. Sci. Data 2021, 13, 4567–4582. [Google Scholar] [CrossRef]
- Bornes, S.R.; Báez, J.C.; Castro, H.M.; Pichuante, I.P.; Norambuena, C.R. Red Geodésica Nacional y la transformación a SIRGAS–Chile, realización de 2013.0 a 2016.0 para cartografía y Sistemas de Información Geográfica. Rev. Geogr. Chile Terra Aust. 2021, 57, 88–94. [Google Scholar]
- IGM. A Finales 2020, Servicio de Correcciones Diferenciales en Tiempo Real, Protocolo NTRIP—Inicio. Instituto Geográfico Militar, 1. Available online: http://www.geograficomilitar.gob.ec/a-finales-2020-servicio-de-correcciones-diferenciales-en-tiempo-real-protocolo-ntrip/ (accessed on 21 November 2021).
- Silva Villacrés, O.F. Implementación de la Tecnología NTRIP en Dispositivos Móviles Navegadores, Mediante una Aplicación, para Obtener Coordenadas GPS con Mejor Presición en Tiempo Real [Universidad de las Fuerzas Armadas ESPE]. 2014. Available online: http://repositorio.espe.edu.ec/handle/21000/8479 (accessed on 21 November 2021).
- Kammoun, S.; Parseihian, G.; Gutierrez, O.; Brilhault, A.; Serpa, A.; Raynal, M.; Oriola, B.; Macé, M.M.; Auvray, M.; Denis, M.; et al. Navigation and space perception assistance for the visually impaired: The NAVIG project. IRBM 2012, 33, 182–189. [Google Scholar] [CrossRef]
- Real, S.; Araujo, A. Navigation systems for the blind and visually impaired: Past work, challenges, and open problems. Sensors 2019, 19, 3404. [Google Scholar] [CrossRef] [PubMed]
- Zimmermann-Janschitz, S. The application of geographic information systems to support wayfinding for people with visual impairments or blindness. In Visual Impairment and Blindness-What We Know and What We Have to Know; IntechOpen: London, UK, 2019. [Google Scholar]
- Ghali, N.I.; Soluiman, O.; El-Bendary, N.; Nassef, T.M.; Ahmed, S.A.; Elbarawy, Y.M.; Hassanien, A.E. Virtual reality technology for blind and visual impaired people: Reviews and recent advances. Adv. Robot. Virtual Real. 2012, 26, 363–385. [Google Scholar]
- Rizzo, J.R.; Beheshti, M.; Fang, Y.; Flanagan, S.; Giudice, N.A. COVID-19 and visual disability: Can’t look and now don’t touch. PM R 2021, 13, 415–421. [Google Scholar] [CrossRef]
- Legge, G.E.; Beckmann, P.J.; Tjan, B.S.; Havey, G.; Kramer, K.; Rolkosky, D.; Gage, R.; Chen, M.; Puchakayala, S.; Rangarajan, A. Indoor navigation by people with visual impairment using a digital sign system. PLoS ONE 2013, 8, e76783. [Google Scholar] [CrossRef]
- Li, X.; Cui, H.; Rizzo, J.R.; Wong, E.; Fang, Y. Cross-Safe: A computer vision-based approach to make all intersection-related pedestrian signals accessible for the visually impaired. In Proceedings of the Science and Information Conference, Las Vegas, NV, USA, 25–26 April 2019; Springer: Cham, Switzerland, 2019; pp. 132–146. [Google Scholar]
- Ross, R.; Hoque, R. Augmenting GPS with geolocated fiducials to improve accuracy for mobile robot applications. Appl. Sci. 2019, 10, 146. [Google Scholar] [CrossRef]
- Palen, L.; Salzman, M.; Youngs, E. Discovery and integration of mobile communications in everyday life. Pers. Ubiquitous Comput. 2001, 5, 109–122. [Google Scholar] [CrossRef]
- Dospinescu, O.; Perca, M. Technological integration for increasing the contextual level of information. An. Stiintifice Ale Univ. “Alexandru Ioan Cuza” Din Iasi-Stiinte Econ. 2011, 58, 571–581. [Google Scholar]
- Cai, G.S.; Lin, H.Y.; Kao, S.F. Mobile robot localization using gps, imu and visual odometry. In Proceedings of the 2019 International Automatic Control Conference (CACS), Keelung City, Taiwan, 13–16 November 2019; IEEE: Piscataway, NJ, USA, 2019; pp. 1–6. [Google Scholar]


| Characteristics | Xiaomi Poco F3 | Huawei Mate 20 Lite |
|---|---|---|
| Operating System | Android 11 | Android 8.1 |
| Navigation | GPS: L1 + L5 GLONASS: G1 Galileo: E1 + E5a BeiDou: B1I + B2a | GPS: L1 GLONASS: G1 |
| Network Capacity | 2G, 3G, 4G, 5G | 2G, 3G, 4G |
| SIRGAS Weekly Coordinates | |||
|---|---|---|---|
| Cartesian | Geographic | ||
| X | 1,277,936.90192 m | Length | 78°26′46.76360″ W |
| Y | −6,251,278.07054 m | Latitude | 00°18′53.60212″ S |
| Z | −34,832.36938 m | Ellipsoidal Height | 2522.9743 m |
| Parameters | ∆e | ∆n | ∆u | D. Horizontal |
|---|---|---|---|---|
| Mean (m) | 2.714 | −1.430 | 4.136 | 3.607 |
| Variance (m2) | 2.565 | 2.962 | 25.309 | 1.926 |
| Std. Dev. (m) | ±1.602 | ±1.721 | ±5.031 | ±1.388 |
| Maximum (m) | 5.596 | 2.979 | 16.211 | 6.509 |
| Minimum (m) | −0.900 | −3.998 | −5.196 | 0.969 |
| Range (m) | 6.496 | 6.977 | 21.407 | 5.539 |
| C. Asymmetry | −0.198 | 0.576 | 0.535 | 0.008 |
| C. Curtosis | −0.504 | 0.085 | −0.045 | −0.778 |
| Parameters | ∆e | ∆n | ∆u | D. Horizontal |
|---|---|---|---|---|
| Mean (m) | 0.863 | 0.0001 | 0.782 | 6.258 |
| Variance (m2) | 26.177 | 28.436 | 142.248 | 16.191 |
| Std. Dev. (m) | ±5.116 | ±5.333 | ±11.927 | ±4.024 |
| Maximum (m) | 11.906 | 16.432 | 24.779 | 19.182 |
| Minimum (m) | −12.824 | −8.013 | −22.152 | 0.700 |
| Range (m) | 24.731 | 24.445 | 46.931 | 18.482 |
| C. Asymmetry | −0.084 | 0.944 | 0.150 | 0.663 |
| C. Curtosis | 0.604 | 1.091 | −0.340 | −0.501 |
| Parameters | Variation of Observed Data | Variation of Corrected Data | ||
|---|---|---|---|---|
| ∆e | ∆n | ∆ec | ∆nc | |
| Mean (m) | −3.835 | 0.504 | −3.728 | 0.389 |
| Variance (m2) | 2.865 | 13.204 | 2.920 | 13.268 |
| Std. Dev. (m) | ±1.693 | ±3.634 | ±1.709 | ±3.643 |
| Maximum (m) | −0.459 | 8.681 | −0.357 | 8.569 |
| Minimum (m) | −7.798 | −7.167 | −7.772 | −7.262 |
| Range (m) | 7.339 | 15.848 | 7.415 | 15.831 |
| Parameters | Horizontal Dispersion | |
|---|---|---|
| Observed Data | Corrected Data | |
| Mean (m) | 5.193 | 5.103 |
| Variance (m2) | 4.061 | 4.192 |
| Std. Dev. (m) | ±2.015 | ±2.047 |
| Maximum (m) | 10.475 | 10.351 |
| Minimum (m) | 2.438 | 2.230 |
| Range (m) | 8.036 | 8.122 |
| C. Variation | 0.388 | 0.401 |
| Parameters | Observed Data Variation | Corrected Data Variation | ||
|---|---|---|---|---|
| ∆e | ∆n | ∆ec | ∆nc | |
| Mean (m) | −2.903 | 0.842 | −2.796 | 0.730 |
| Variance (m2) | 9.795 | 16.852 | 9.791 | 16.699 |
| Standard Dev. (m) | ±3.130 | ±4.105 | ±3.129 | ±4.086 |
| Maximum (m) | 5.709 | 8.490 | 5.872 | 8.363 |
| Minimum (m) | −9.054 | −7.339 | −8.901 | −6.960 |
| Range (m) | 14.763 | 15.828 | 14.773 | 15.323 |
| Parameters | Horizontal Dispersion | |
|---|---|---|
| Observed Data | Corrected Data | |
| Mean (m) | 5.531 | 5.463 |
| Variance (m2) | 5.194 | 4.992 |
| Standard Dev. (m) | ±2.279 | ±2.234 |
| Maximum (m) | 9.298 | 9.106 |
| Minimum (m) | 0.034 | 0.191 |
| Parameters | 9.263 | 8.916 |
| C. Variation | 0.412 | 0.409 |
| Parameters | Static | Navigation | Correction | |
|---|---|---|---|---|
| Xiaomi | RMSE East | 3.1513 | 4.1920 | 4.1006 |
| RMSE North | 2.2375 | 3.6685 | 3.6633 | |
| RMSE Horizontal | 3.8648 | 5.5705 | 5.4986 | |
| Accuracy Horizontal | 6.5950 | 9.6201 | 9.5019 | |
| Huawei | RMSE Este | 5.1887 | 4.2688 | 4.1960 |
| RMSE Norte | 5.3326 | 4.1906 | 4.1511 | |
| RMSE Horizontal | 7.4403 | 5.9820 | 5.9024 | |
| Accuracy Horizontal | 12.8764 | 10.3531 | 10.2157 |
Publisher’s Note: MDPI stays neutral with regard to jurisdictional claims in published maps and institutional affiliations. |
© 2022 by the authors. Licensee MDPI, Basel, Switzerland. This article is an open access article distributed under the terms and conditions of the Creative Commons Attribution (CC BY) license (https://creativecommons.org/licenses/by/4.0/).
Share and Cite
Beltrán-Iza, E.A.; Noroña-Meza, C.O.; Robayo-Nieto, A.A.; Padilla, O.; Toulkeridis, T. Creation of a Mobile Application for Navigation for a Potential Use of People with Visual Impairment Exercising the NTRIP Protocol. Sustainability 2022, 14, 17027. https://doi.org/10.3390/su142417027
Beltrán-Iza EA, Noroña-Meza CO, Robayo-Nieto AA, Padilla O, Toulkeridis T. Creation of a Mobile Application for Navigation for a Potential Use of People with Visual Impairment Exercising the NTRIP Protocol. Sustainability. 2022; 14(24):17027. https://doi.org/10.3390/su142417027
Chicago/Turabian StyleBeltrán-Iza, Emilio Alejandro, Cristian Oswaldo Noroña-Meza, Alexander Alfredo Robayo-Nieto, Oswaldo Padilla, and Theofilos Toulkeridis. 2022. "Creation of a Mobile Application for Navigation for a Potential Use of People with Visual Impairment Exercising the NTRIP Protocol" Sustainability 14, no. 24: 17027. https://doi.org/10.3390/su142417027
APA StyleBeltrán-Iza, E. A., Noroña-Meza, C. O., Robayo-Nieto, A. A., Padilla, O., & Toulkeridis, T. (2022). Creation of a Mobile Application for Navigation for a Potential Use of People with Visual Impairment Exercising the NTRIP Protocol. Sustainability, 14(24), 17027. https://doi.org/10.3390/su142417027