Article

Application of Long-Range Cross-Hole Acoustic Wave Detection Technology in Geotechnical Engineering Detection: Case Studies of Tunnel-Surrounding Rock, Foundation and Subgrade

1
State Key Laboratory of Geohazard Prevention and Geoenvironment Protection, Chengdu University of Technology, Chengdu 610059, China
2
China Railway Chengdu Research Institute, Science and Technology Co., Ltd., Chengdu 610066, China
3
School of Civil Engineering and Transportation, South China University of Technology, Guangzhou 510640, China
4
State Key Laboratory of Subtropical Building Science, South China University of Technology, Guangzhou 510640, China
5
State Key Laboratory of Hydroscience and Engineering, Tsinghua University, Beijing 100084, China
6
School of Civil Engineering, Northeast Forestry University, Harbin 150006, China
*
Author to whom correspondence should be addressed.
Sustainability 2022, 14(24), 16947; https://doi.org/10.3390/su142416947
Submission received: 25 October 2022 / Revised: 11 December 2022 / Accepted: 12 December 2022 / Published: 17 December 2022
(This article belongs to the Special Issue Sustainability in Geology and Civil Engineering)

Abstract

:
The adverse geological conditions of soil cave, karst cave and goaf in deep foundation directly affect the safety and economy of geotechnical engineering construction. It is a difficult problem in geotechnical engineering detection to detect the distribution of bad geological conditions efficiently and accurately. Aiming at the problems of short penetrating distance and low resolution of cross-hole acoustic wave detection in rock-soil mass, based on the characteristics of acoustic wave propagation in rock and soil layers and comprehensively utilizing the spark source and data acquisition device, a long-distance cross-hole acoustic wave detection technology is proposed. According to the indoor concrete model test and field tests of geotechnical engineering, the applicability of the long-distance cross-hole acoustic wave detection technology in the detection of geotechnical structure and adverse geological phenomena under complex geological conditions is verified. The results show that acoustic wave CT imaging can accurately detect the cavities in the indoor concrete model test. In addition, the field tests of the grouting effect of tunnel-surrounding rock, high-rise building foundation and subgrade further verify the rapidity, accuracy and intuitiveness of the long-distance cross-hole acoustic wave detection technology. This work provides a reference for eliminating the potential safety problems caused by adverse geological conditions and similar geotechnical engineering investigation.

1. Introduction

With the development of social economy and the progress of engineering construction technology, underground and surface construction projects present a booming trend. The construction of engineering projects is developing towards high, large and deep directions [1,2]. In the underground and surface engineering construction area, karst caves, water inrush, goaf and other bad geological phenomena not only hinder the construction progress of engineering construction, but also cause serious potential safety hazards [3,4,5]. The detection of rock and soil structure and bad geological phenomena under complex geological conditions before the construction of the project is not only conducive to the analysis of geological structure and the guidance of engineering building design, but also provides a geological basis for the elimination of potential safety hazards caused by bad geological conditions in the key and difficult areas [6,7]. Hence, the precise detection of geotechnical engineering is a necessary basic procedure in the construction of engineering projects, and the urgent need and degree of attention to this procedure is becoming higher and higher.
Due to the concealment and uncertainty of bad geological conditions, traditional rock drilling technology not only has a high cost and long construction period, but it is also difficult to detect the size, scale and spatial distribution of bad geological conditions [8,9]. When encountering complex topographic and geomorphic conditions, it is necessary to scientifically and reasonably design the drilling pressure and speed based on the structural characteristics of the rock stratum. With the development of science and technology, more and more detection methods have been widely used in engineering practice, including the transient electromagnetic method, ground penetrating radar (GPR) method and full-wave inversion method [10,11,12,13]. The transient electromagnetic method is a time-domain electromagnetic method based on resistivity difference. Lin et al. [14] used the water sensitivity of this method to detect water-sealed underground caverns. However, this method has the problems of low measurement efficiency and signal delay. Sun et al. [15] combined full-waveform inversion and reverse time migration methods to achieve the goal of refined detection of cracks in tunnel walls by cross-hole radar. The reliability of the method is verified by the practical engineering data processing. Nevertheless, the imaging effect of the research method for high-angle fractures is not ideal. GPR is a detection method based on the propagation time, propagation velocity and dynamic characteristics of underground electromagnetic waves. Ye et al. [16], based on the principle of self-developed transient electromagnetic radar, proposed technology for detecting the cavities behind the shield tunnel lining segment. This method makes up for the limitations of the transient electromagnetic method and ground penetrating radar method. However, these studies are mainly aimed at short distance shallow adverse geological bodies, and the resolution of the detection methods is highly related to the structure of rock and soil layers and the depth of adverse geological bodies.
Cross-hole acoustic detection is a method of nondestructive reconstruction and analysis of rock and soil structures with the aid of computer technology to detect the characteristics of internal structures. Because it has the characteristics of low cost, high precision and fast detection and has a good detection effect on abnormal bodies in engineering, such as cracks, cavities and unknown buried objects, it is a widely used exploration method in geotechnical engineering detection. Liu et al. [17], focusing on the threat of karst caves at or near the pile foundation to the underground engineering construction, proposed technology using low-frequency acoustic waves to detect karst cavities and high-frequency acoustic waves to detect the integrity of surrounding rock around the borehole wall. In the experimental scale, the wave velocity of sand samples with different gradations and particle shapes distinguished was measured using bender elements, and the test results were interpreted [18,19]. Ma, J.J. et al. [20,21,22] established a fully coupled flow deformation model for elastoplastic damage of saturated fractured porous media. The governing differential equations satisfying damage state and integrity state are derived. The feasibility of wetting compaction and the specific conditions of wetting collapse are analyzed under different stress states. Duan et al. [23] used cross-hole seismic CT technology to obtain field test data and obtained the relationship between P-wave velocity and geological anomalies through inversion of first-arrival travel time. The applicability of this technology in detecting foundation caves in karst areas was discussed, and suggestions for karst cave treatment in different regions were put forward. However, the penetration distance of cross-hole acoustic detection in the rock mass is generally not more than 50 m, and the penetration distance in soil and relatively broken rock mass is shorter. In addition, there are few field tests on long-range acoustic detection at present, and it is particularly necessary to study long-range, high-precision and high-resolution field tests of adverse geological phenomena under complex conditions.
This work comprehensively utilizes the characteristics of acoustic wave propagation in the rock–soil layer. The spark source and data acquisition device, a long-distance cross-hole acoustic wave detection technology, is proposed based on curved ray fast tracking and full-waveform inversion. The feasibility of cross-hole acoustic wave detection is verified by indoor concrete model test. By combining the application and improvement, the long-distance cross-hole acoustic wave detection method is further applied to the investigation of typical geotechnical engineering, such as the grouting effect of tunnel-surrounding rock, high-rise building foundation and subgrade. It realizes the high-resolution reception of vibration signals under long-distance conditions and further verified the rapidity, accuracy and intuitiveness of the long-distance cross-hole acoustic detection technology under complex geological conditions. This work can provide a scientific geological basis for effectively detecting the spatial distribution of abnormal geological bodies, engineering design and safe construction in similar geotechnical engineering investigations.

2. Long-Distance Cross-Hole Acoustic Wave Detection

2.1. Cross-Hole Acoustic Wave Detection System

The hardware system of cross-hole acoustic wave detection is mainly composed of a sparker source and geophone. As a commonly used sparker source, the traditional sparker source is mainly composed of an energy storage system, boost system, control system and power supply system [24]. The new large-energy controllable acoustic wave sparker source uses a special circuit mode to integrate energy storage, voltage boost, control and power supply systems, which solves problems, such as size, weight and waterproof, which prevent the traditional sparker sources from being widely used. The basic principle of the new large-energy controllable sparker acoustic source is that the power source forms high-voltage energy through the boost system, and the energy storage system composed of capacitors is used to store high-voltage electric energy. High-frequency high-power emission technology can release high-voltage electric energy quickly through an acoustic emission probe in an instant. The pressure generated is transformed into seismic waves acting on geological bodies. The large-energy controllable sparker source generator is shown in Figure 1.
The acceleration type geophone is a piezoelectric geophone developed based on the piezoelectric effect. It is mainly composed of a base, shell, signal output circuit and core body. The core body is composed of a piezoelectric sheet, an inertia rod fixed on the center point of the piezoelectric sheet at the bottom and a constraint spring sheet connected between the core body shell and the upper end of the inertia rod. The core body and the signal output circuit are connected through lines and embedded in the upper cover and the inner part of the shell. The output of the signal output circuit is led out from the upper cover. The geophone directly acts on the center point of the piezoelectric sheet by using the inertia rod. A large force arm is formed between the action line of the force and the fulcrum (fixed end of the edge of the piezoelectric sheet). Therefore, when subjected to slight vibration, the inertial rod exerts an external force on the center of the piezoelectric ceramic sheet under the combined action of the inertial force and the elastic force of the constraint spring sheet. The piezoelectric ceramic sheet produces large bending and torsion deformation and generates a large piezoelectric signal, which improves the resolution and sensitivity of the geophone. The piezoelectric geophone is shown in Figure 2.

2.2. Principle of Cross-Hole Acoustic Detection

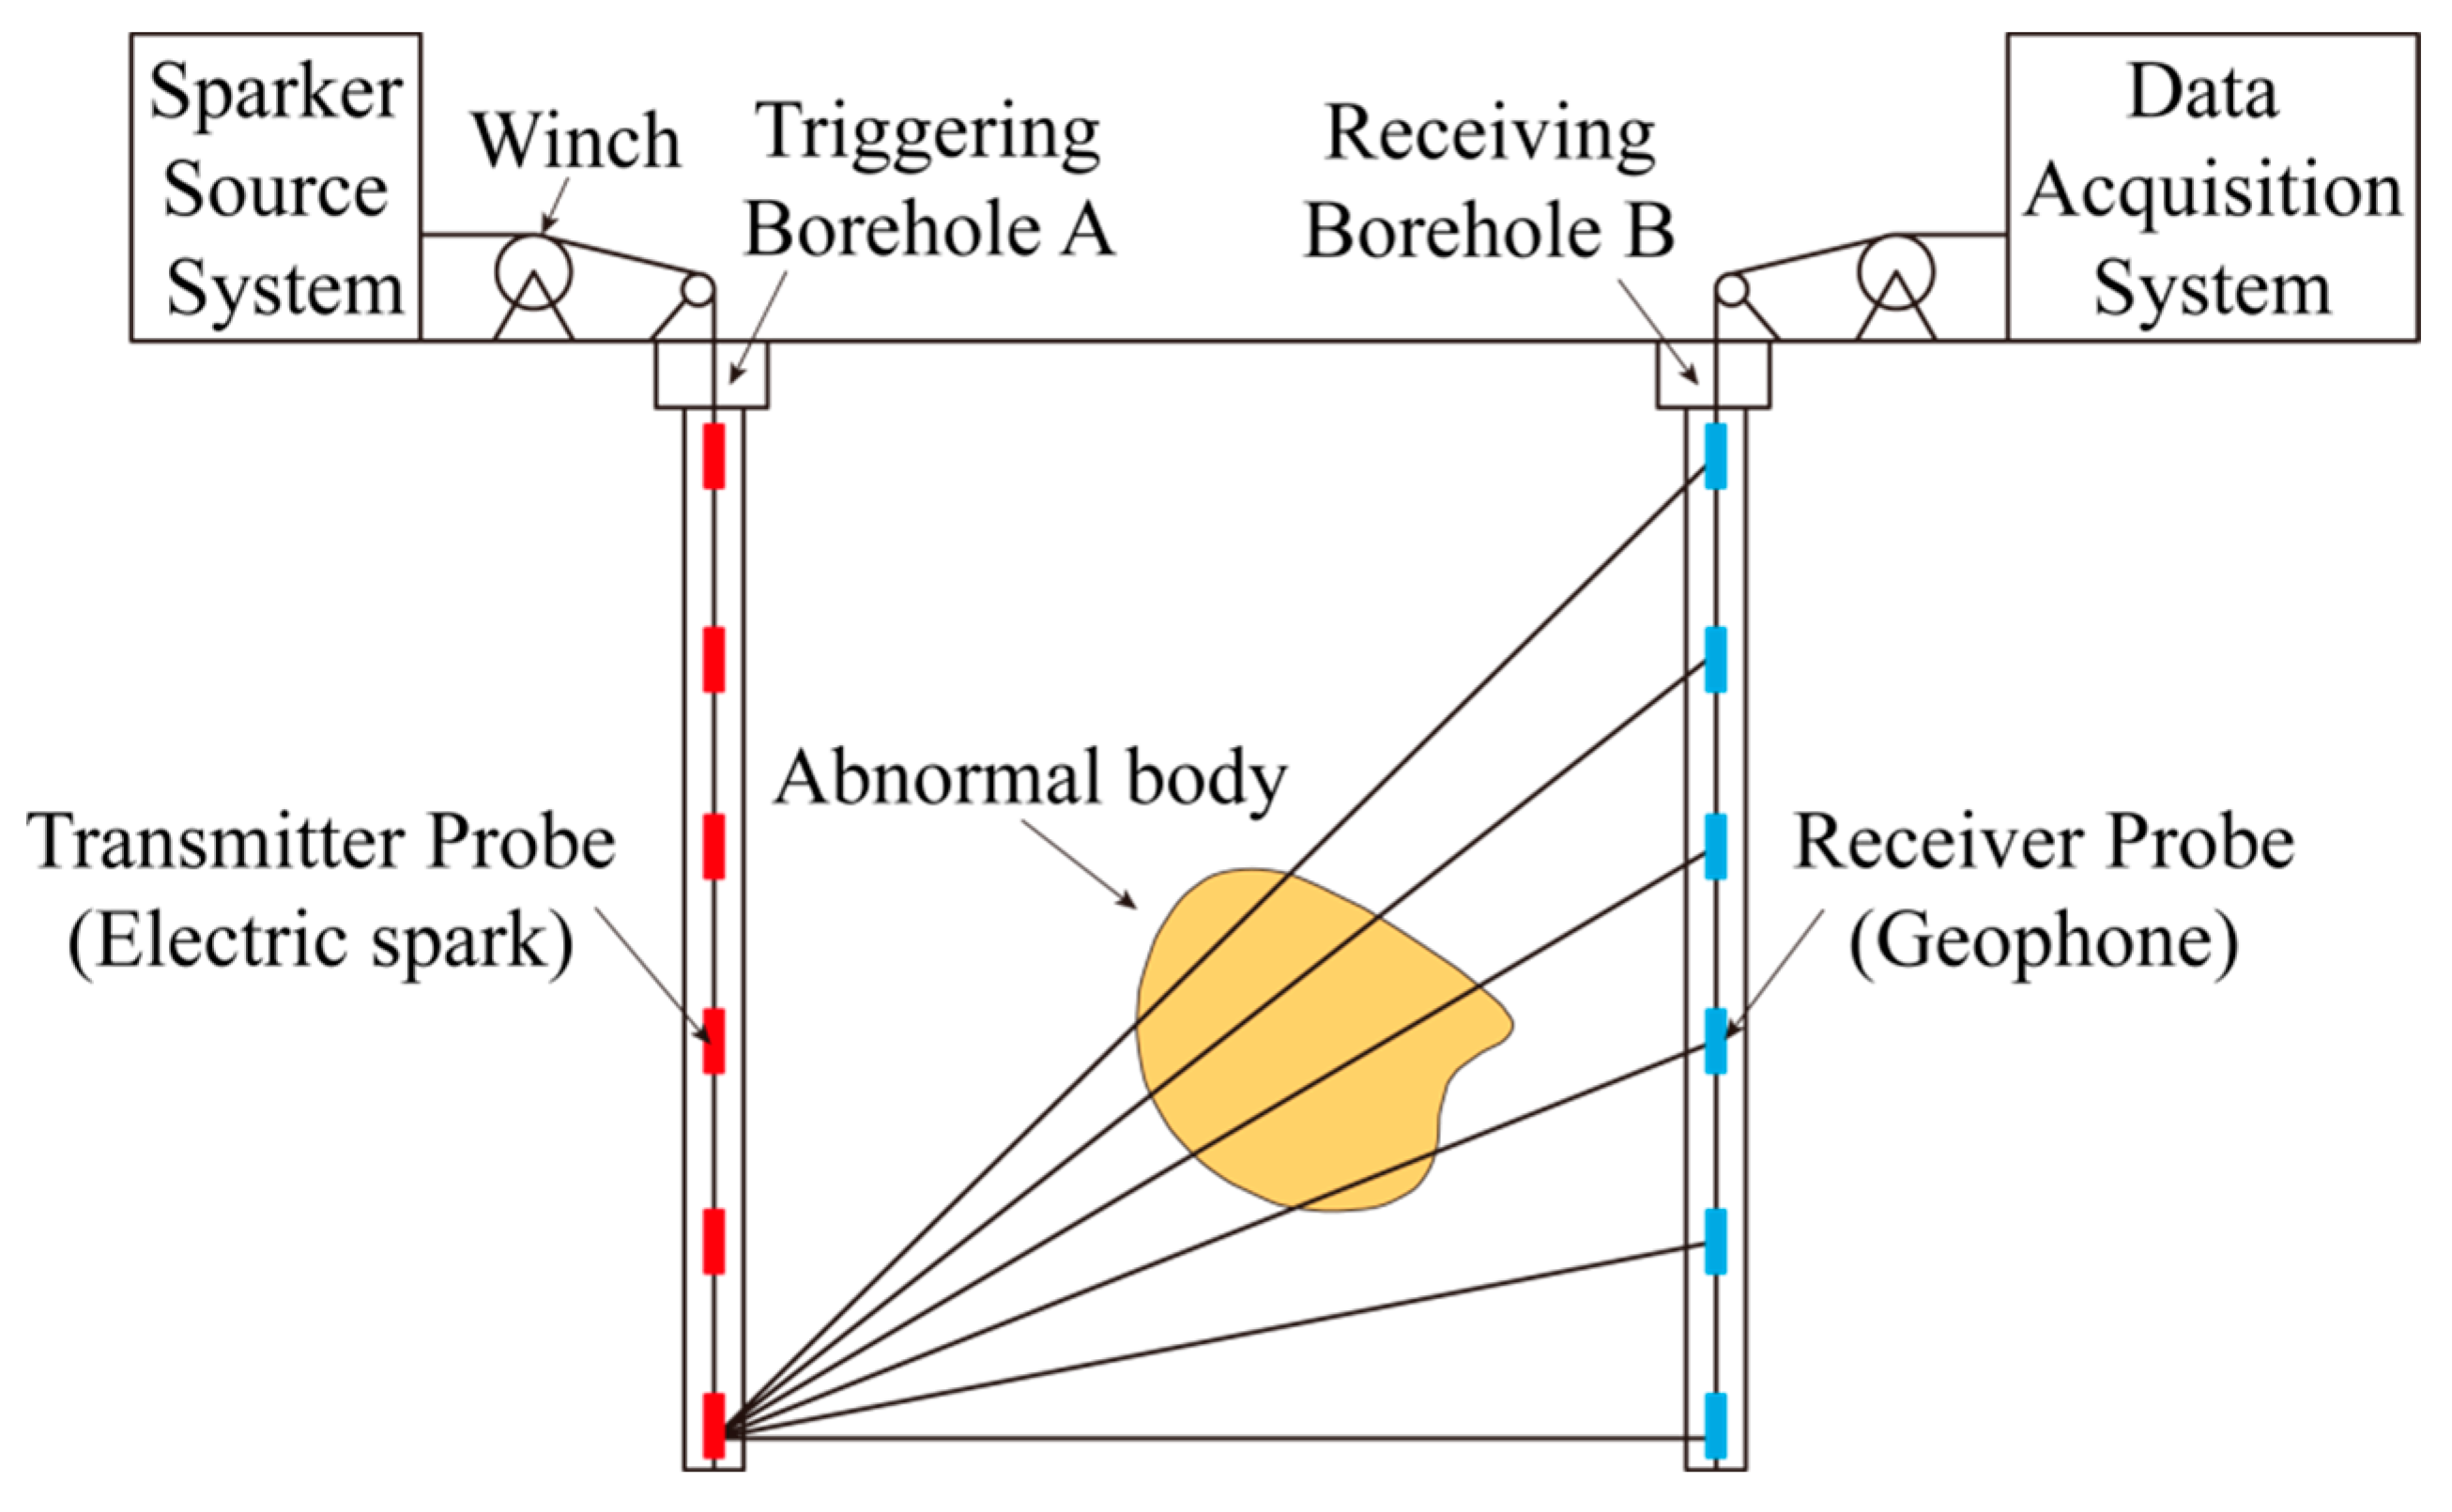
In the process of wave propagation, when the wave moves from one medium into another medium, its impedance changes. On the interface, the wave will incur reflection, refraction and other phenomena. The receiver can receive the reflected wave and then obtain the comprehensive image of the detection area in the computer through full-wave inversion and signal processing, thus reversing the boundary information of the abnormal body. Cross-hole acoustic CT tomography is a kind of underground geophysical exploration method. In the triggering of the borehole by an acoustic wave, different wave fields propagate along the rock around the borehole. At the rock wall, some waves have serious refraction, and the path of the first wave is the critical refraction path along the borehole wall. In the receiving borehole, the receiver digitizes the signal received and sends it to a control unit, which determines the velocities of the P- and S-waves by the path of the wave traveling through the rock. The velocity profile image is obtained by studying the propagation characteristics of acoustic waves in the rock stratum. The fine structure of the underground medium in the detection area is inversed. The location, spatial shape and size of anomalous bodies in the detection area are identified. This provides technical support for solving the construction safety problems existing in the project [25]. Cross-hole acoustic wave CT detection usually adopts the fan-shaped penetration mode of single-point excitation and multi-point reception for acoustic wave excitation and reception. Therefore, it has the following advantages: (a) Reduce the human error caused by sensor cable lifting; (b) Reduce the difference in the time frequency spectrum caused by the excitation of the source at different times; (c) Reduce the system error caused by system delay. The data acquisition mode of one transmitter and multiple receivers for cross-hole acoustic CT detection is shown in Figure 3. The specific detection process is as follows: (a) Determine the depth of the detection profile and the interval of available depth of the drilling in the test area; (b) A transmitting probe of the DC spark source system is lowered into the triggering borehole A using the ground support device, the geophone (receiving probe) of the data acquisition system is lowered into the different detection intervals of the receiving borehole B, and the frequency of the geophone is 100 Hz. The transmitting probe and receiving probe form a dense ray crossing network [26]; (c) The transmitter probe is raised from the bottom of triggering borehole A to the top with a velocity of 0.1 m/s, and acoustic waves are triggered and received every 0.5 m in depth. After the first round of experiments was completed, the receiving probe position was raised by 0.5 m, and the above process was repeated to generate sufficient detection profile rays.

2.3. CT Tomography and Data Inversion

According to the inversion physical parameters, the most commonly used tomography method of wave velocity CT is the series expansion method based on ray theory. In the series expansion method, it is necessary to quickly calculate the distance of each ray passing through each element, and the ray path matrix is determined by tracking the first wave propagation path and travel time. In order to avoid the problem of first wave propagation path bending caused by approximating the propagation path to a straight line, bending ray tracing is one of the key techniques to realize tomography. According to Fermat’s principle, the first wave from the source transmitting point to the vibration signal receiving point is the least time-consuming propagation path. Therefore, it is only necessary to transform the continuous bending ray tracing problem into a discrete problem and apply the best path algorithm to realize the fast tracing of the bending head wave ray path.
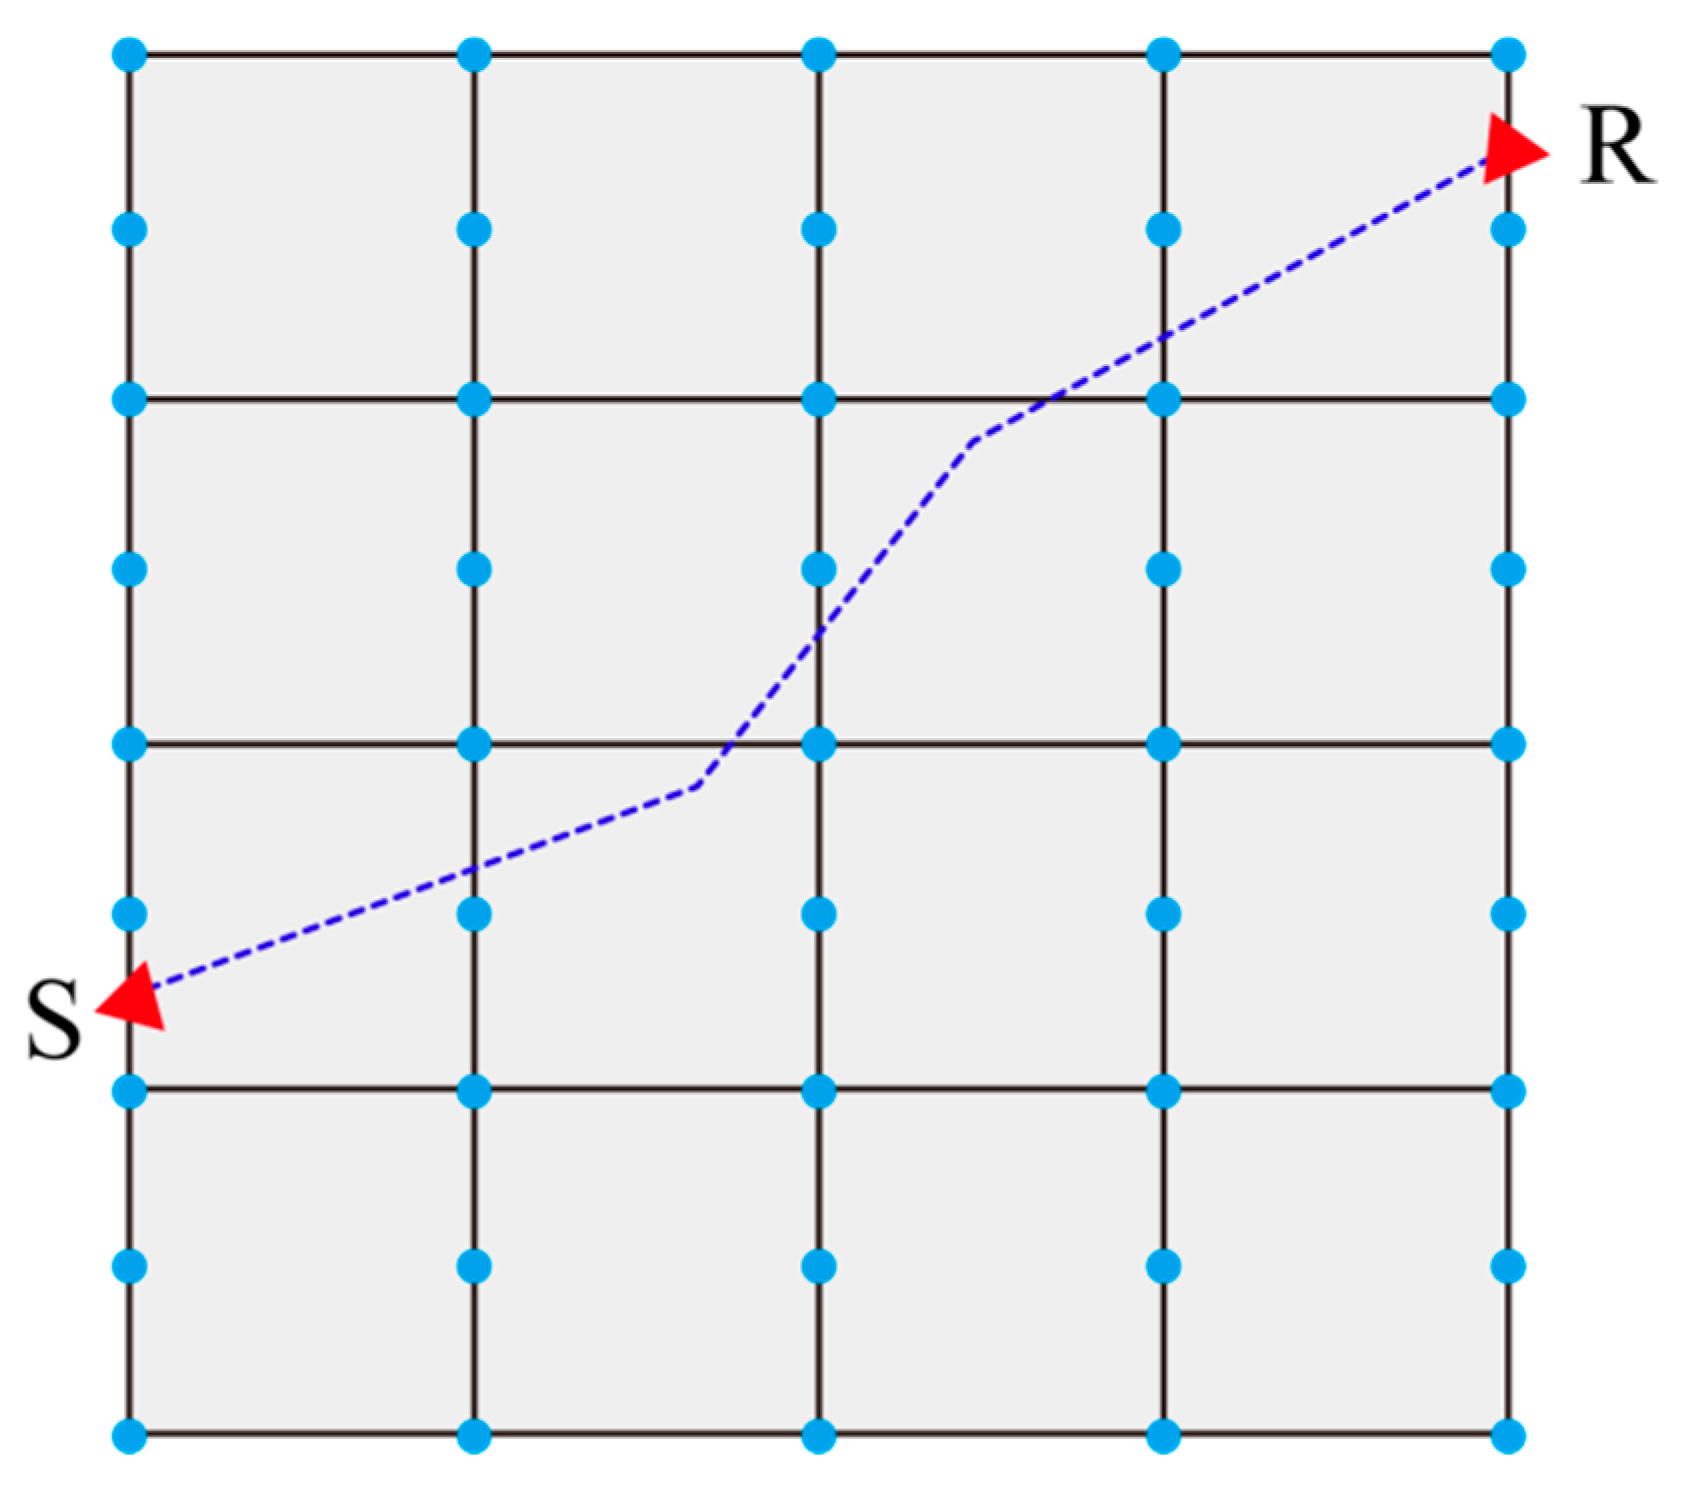
In the imaging process of acoustic CT, the imaging profile is composed of several regular grids, and the medium wave velocity in each grid is assumed to be constant, as shown in Figure 4. In Figure 4, the element boundary is discretized into points P1, P2, …, Pn. Calculate the acoustic travel time between any two points in S, P1, P2, …, Pn and R. If the connection between two points is in a uniform medium, the travel time of the ray is the distance between two points divided by the wave velocity of the medium. If the connection between two points is on the interface, the travel time of the ray is the distance between two points divided by the maximum wave velocity. If the connection between two points passes through different elements, that is, it is not in a uniform medium, the straight path approximation should be used to calculate the travel time of the ray [27,28]. Assuming S point is taken as the starting point, the optimal path algorithm is used to calculate the optimal path and travel time from each point to S point. Then, the optimal path and travel time from R point to S point are separated, and the calculation results can be obtained.
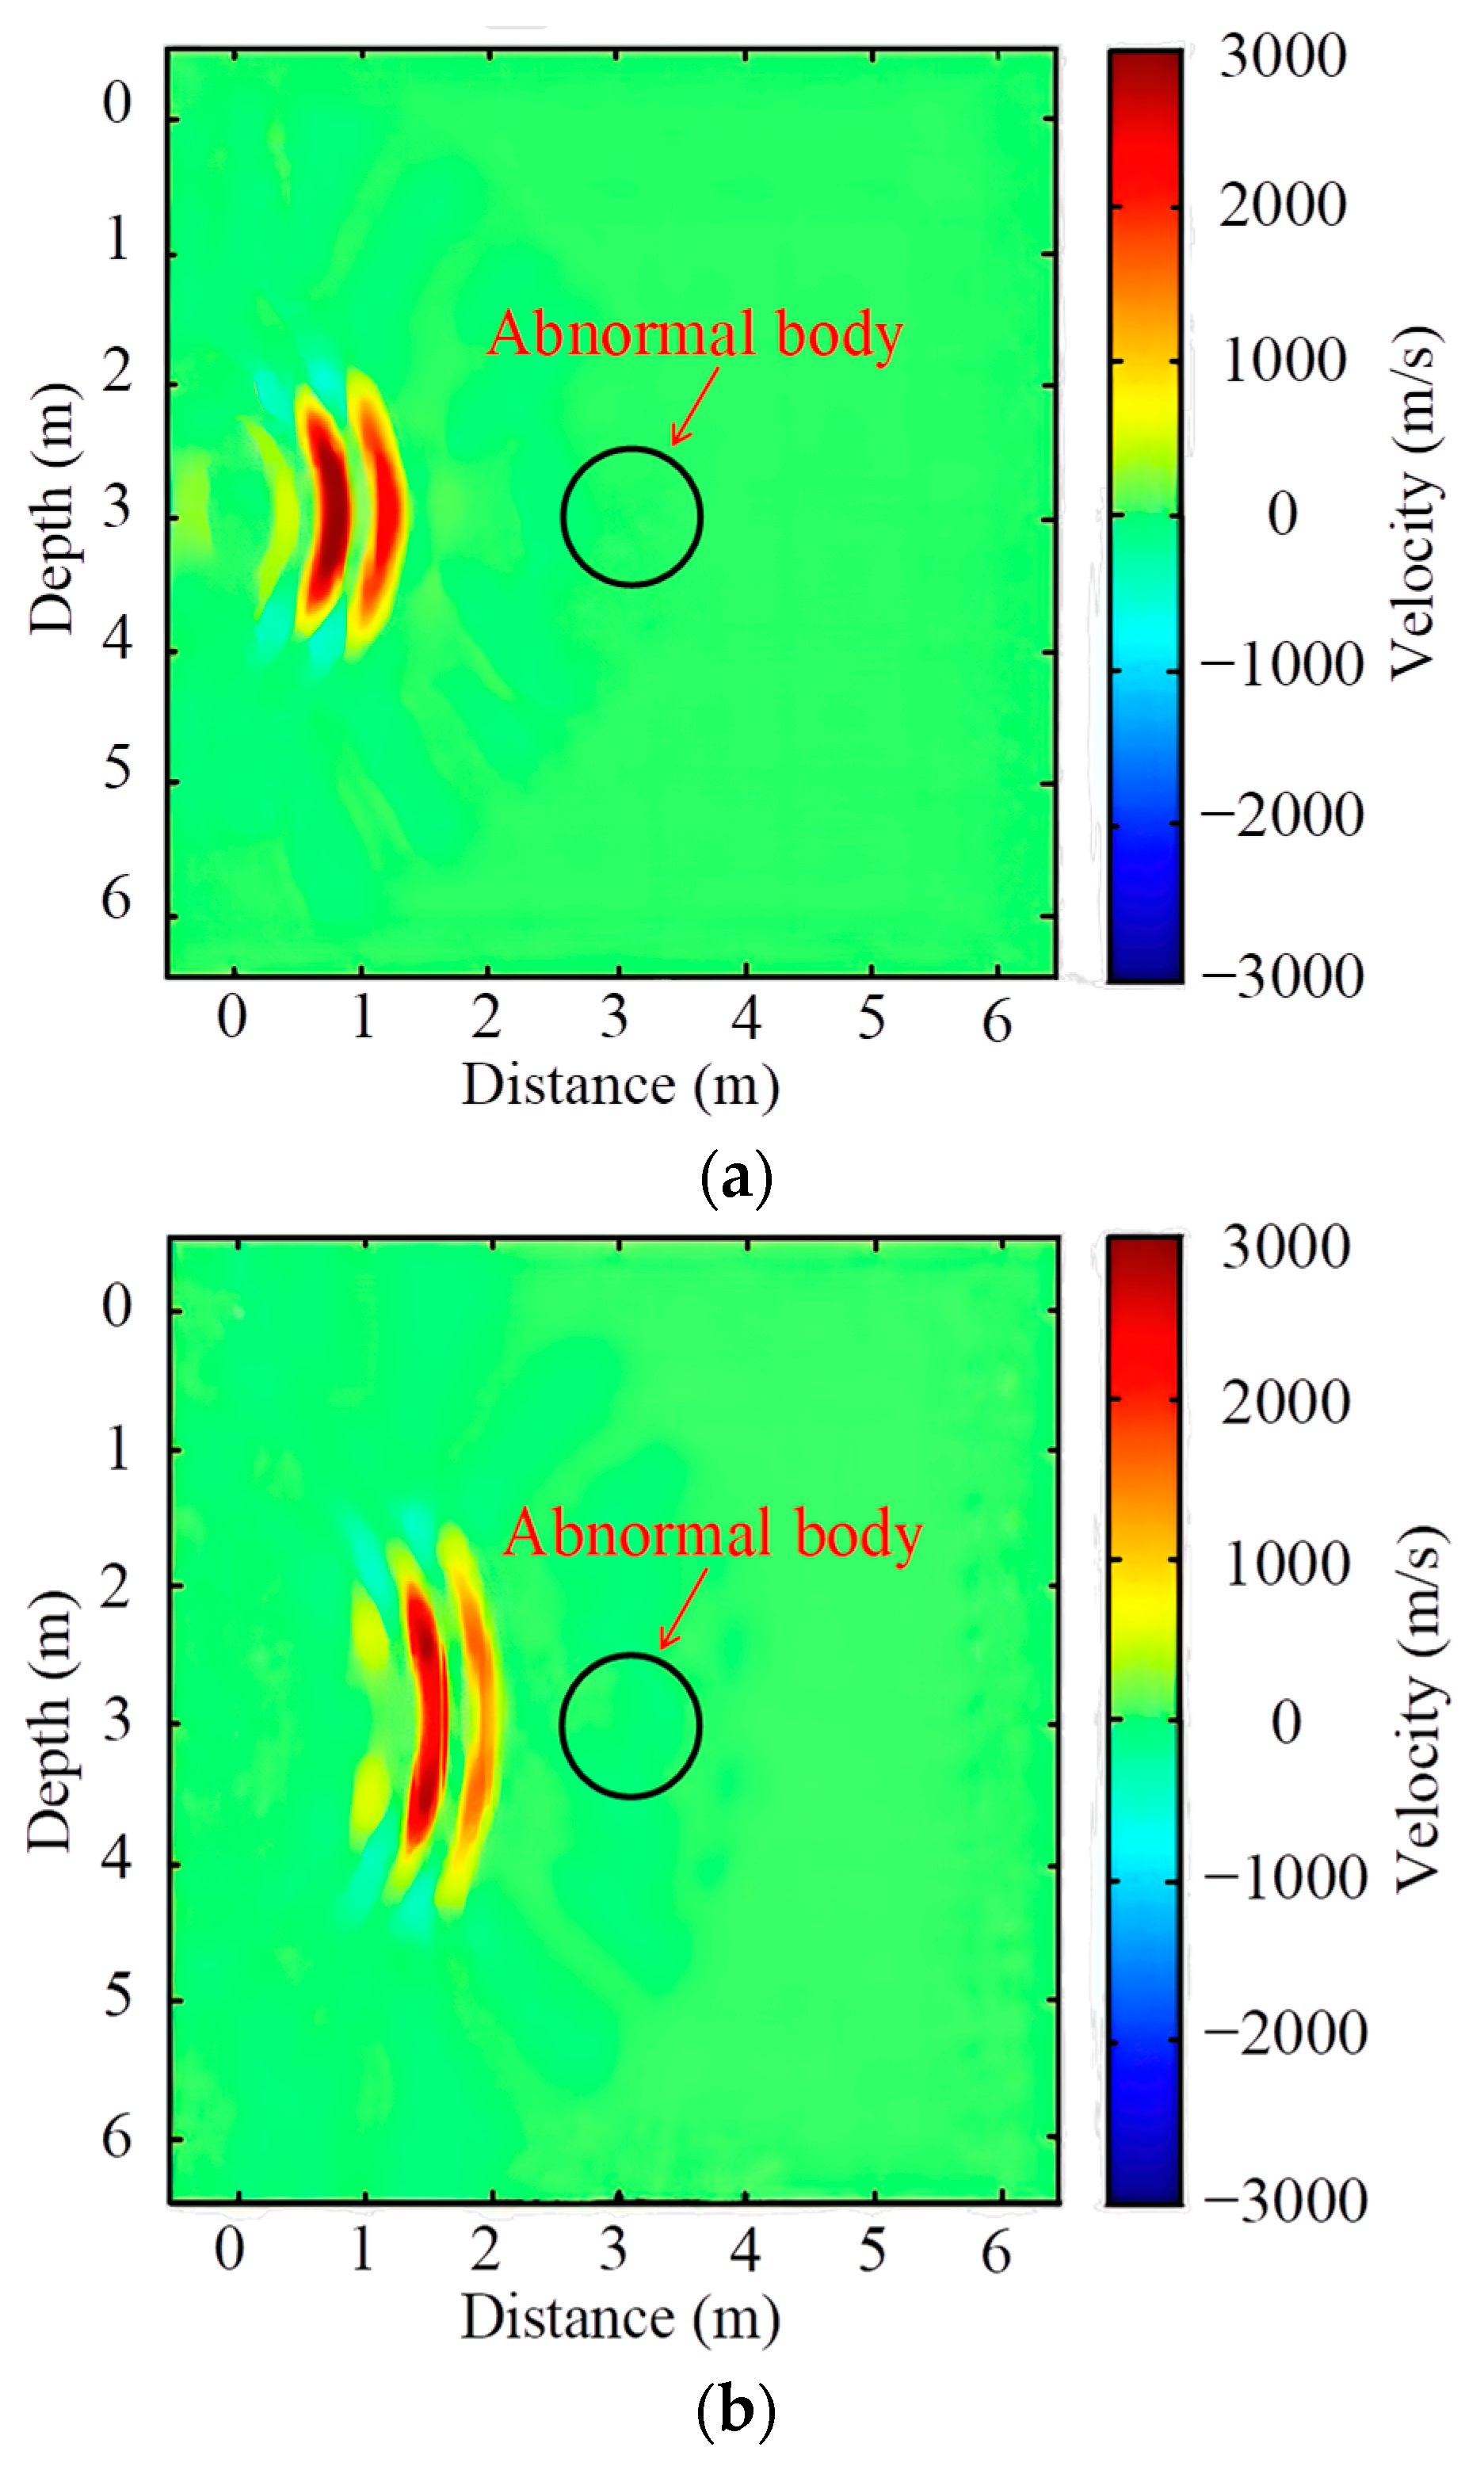
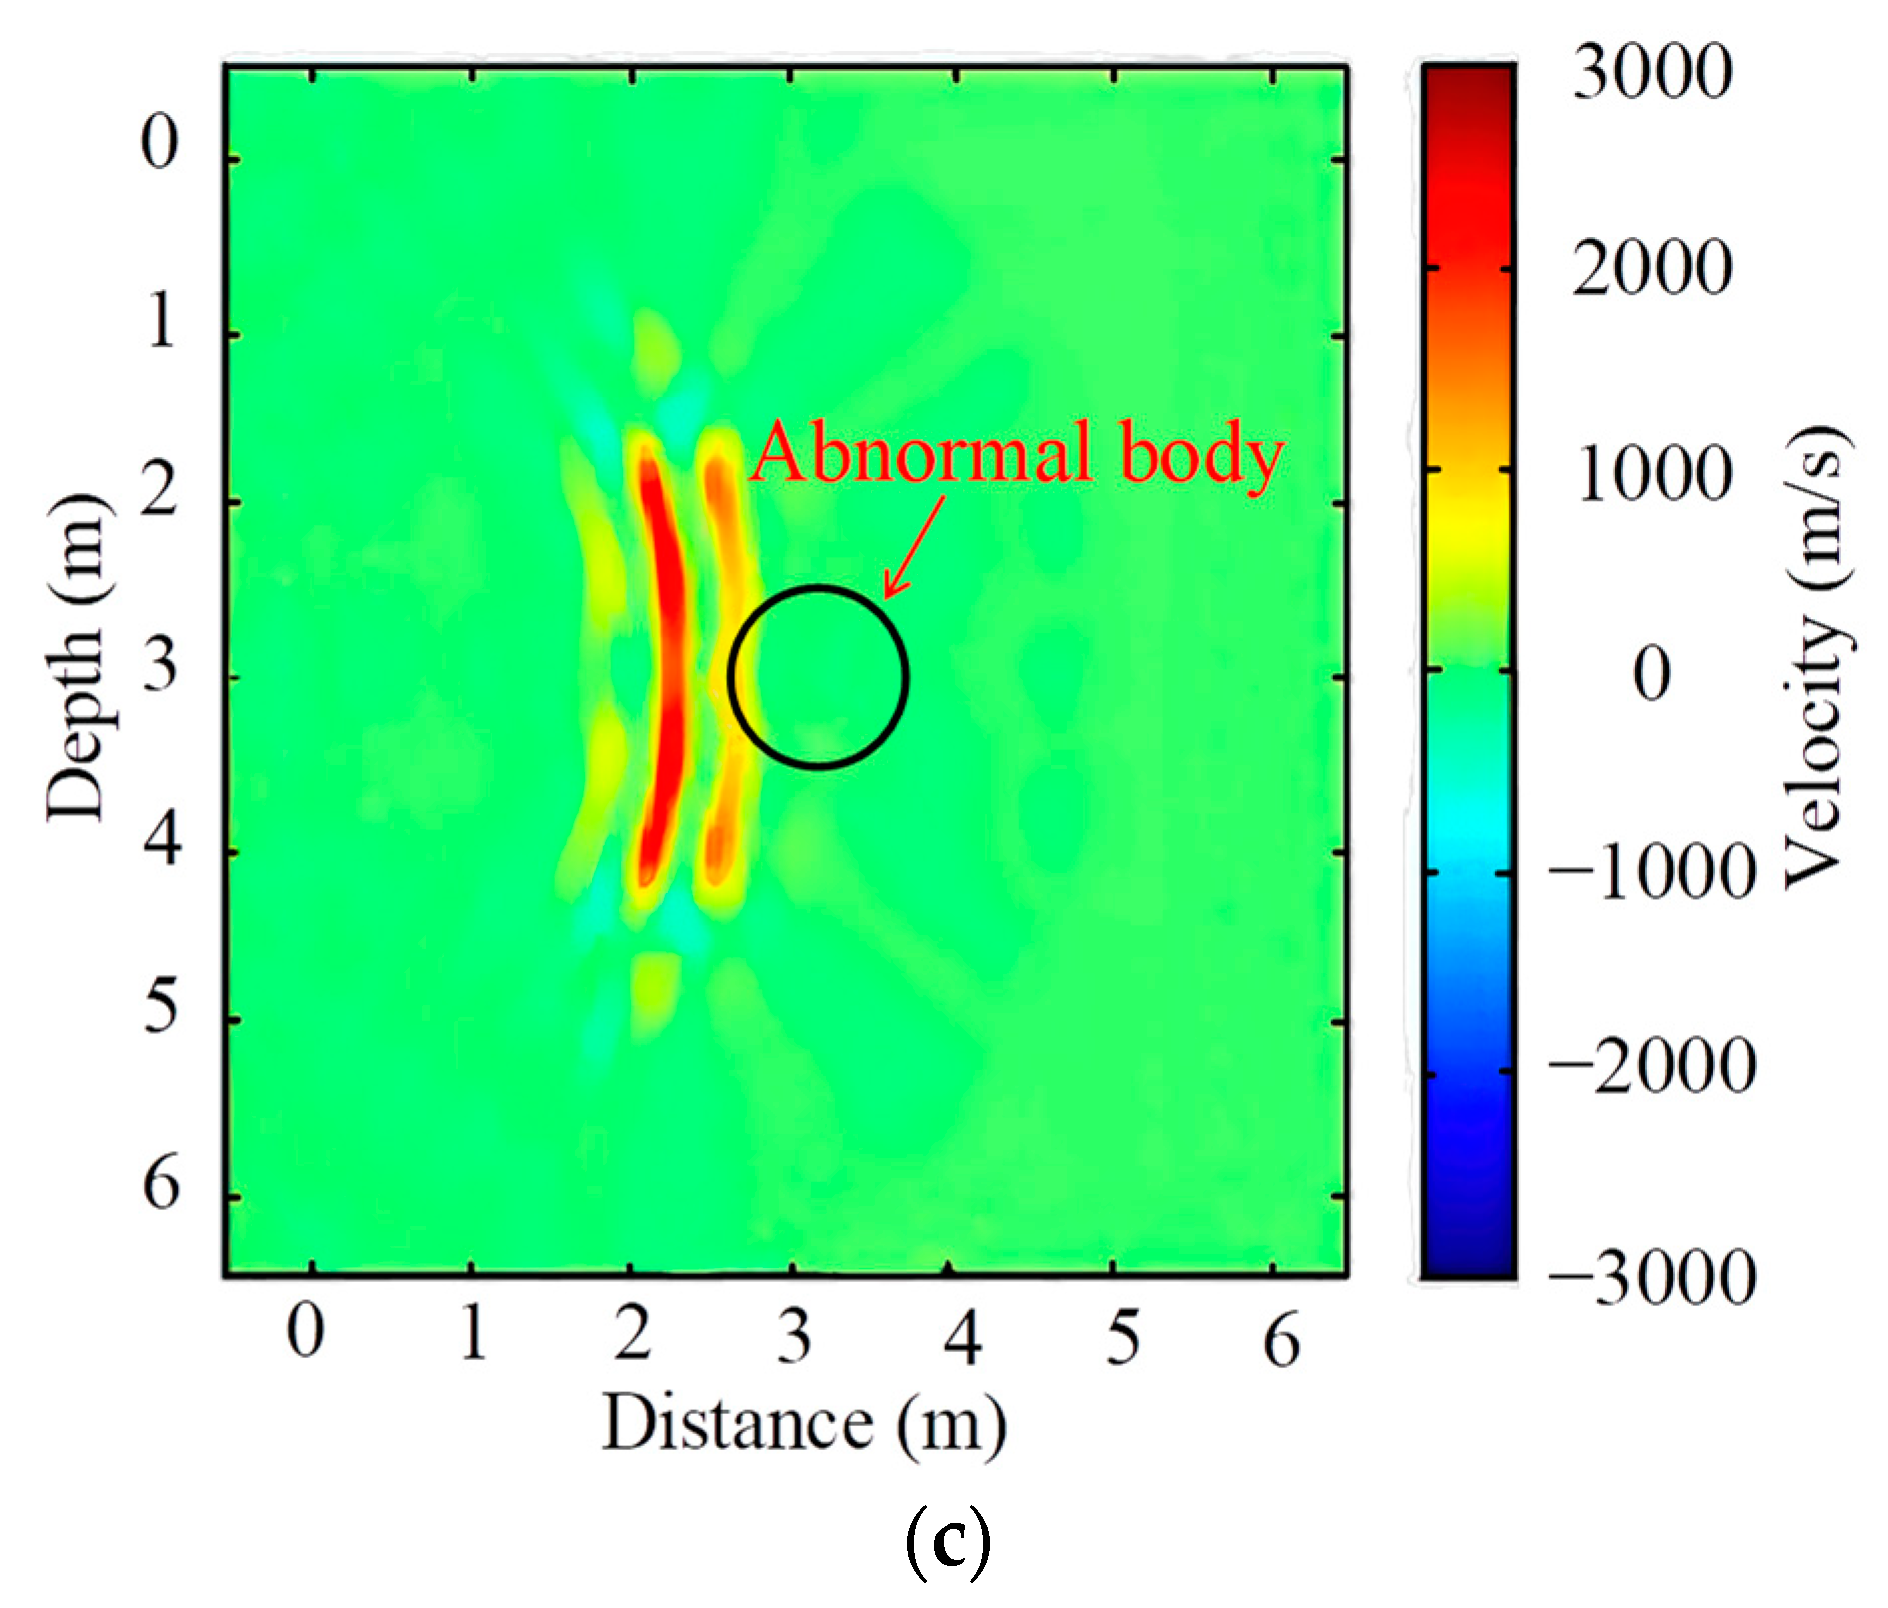
In order to better reflect the dynamic characteristics of the wave field and reveal the structure and lithology information under the complex geological background, the kinematics and dynamics information of the prestack wave field are used to realize the full-waveform inversion, and the inversion principle is shown in Figure 5 [29]. According to the research needs, full-waveform inversion can be carried out not only in the time domain, but also in the frequency domain. Therefore, based on ray tracing CT imaging and combined with a full-waveform inversion algorithm, it can not only improve the accuracy of cross-hole acoustic CT imaging, but also reduce the identification and separation of wave fields and the multi-solution of inversion [30,31]. This is helpful to improve the accuracy of the inversion solution. Figure 6 and Figure 7 show wave field diagram and information grid results of full-waveform inversion.

3. Indoor Concrete Model Test

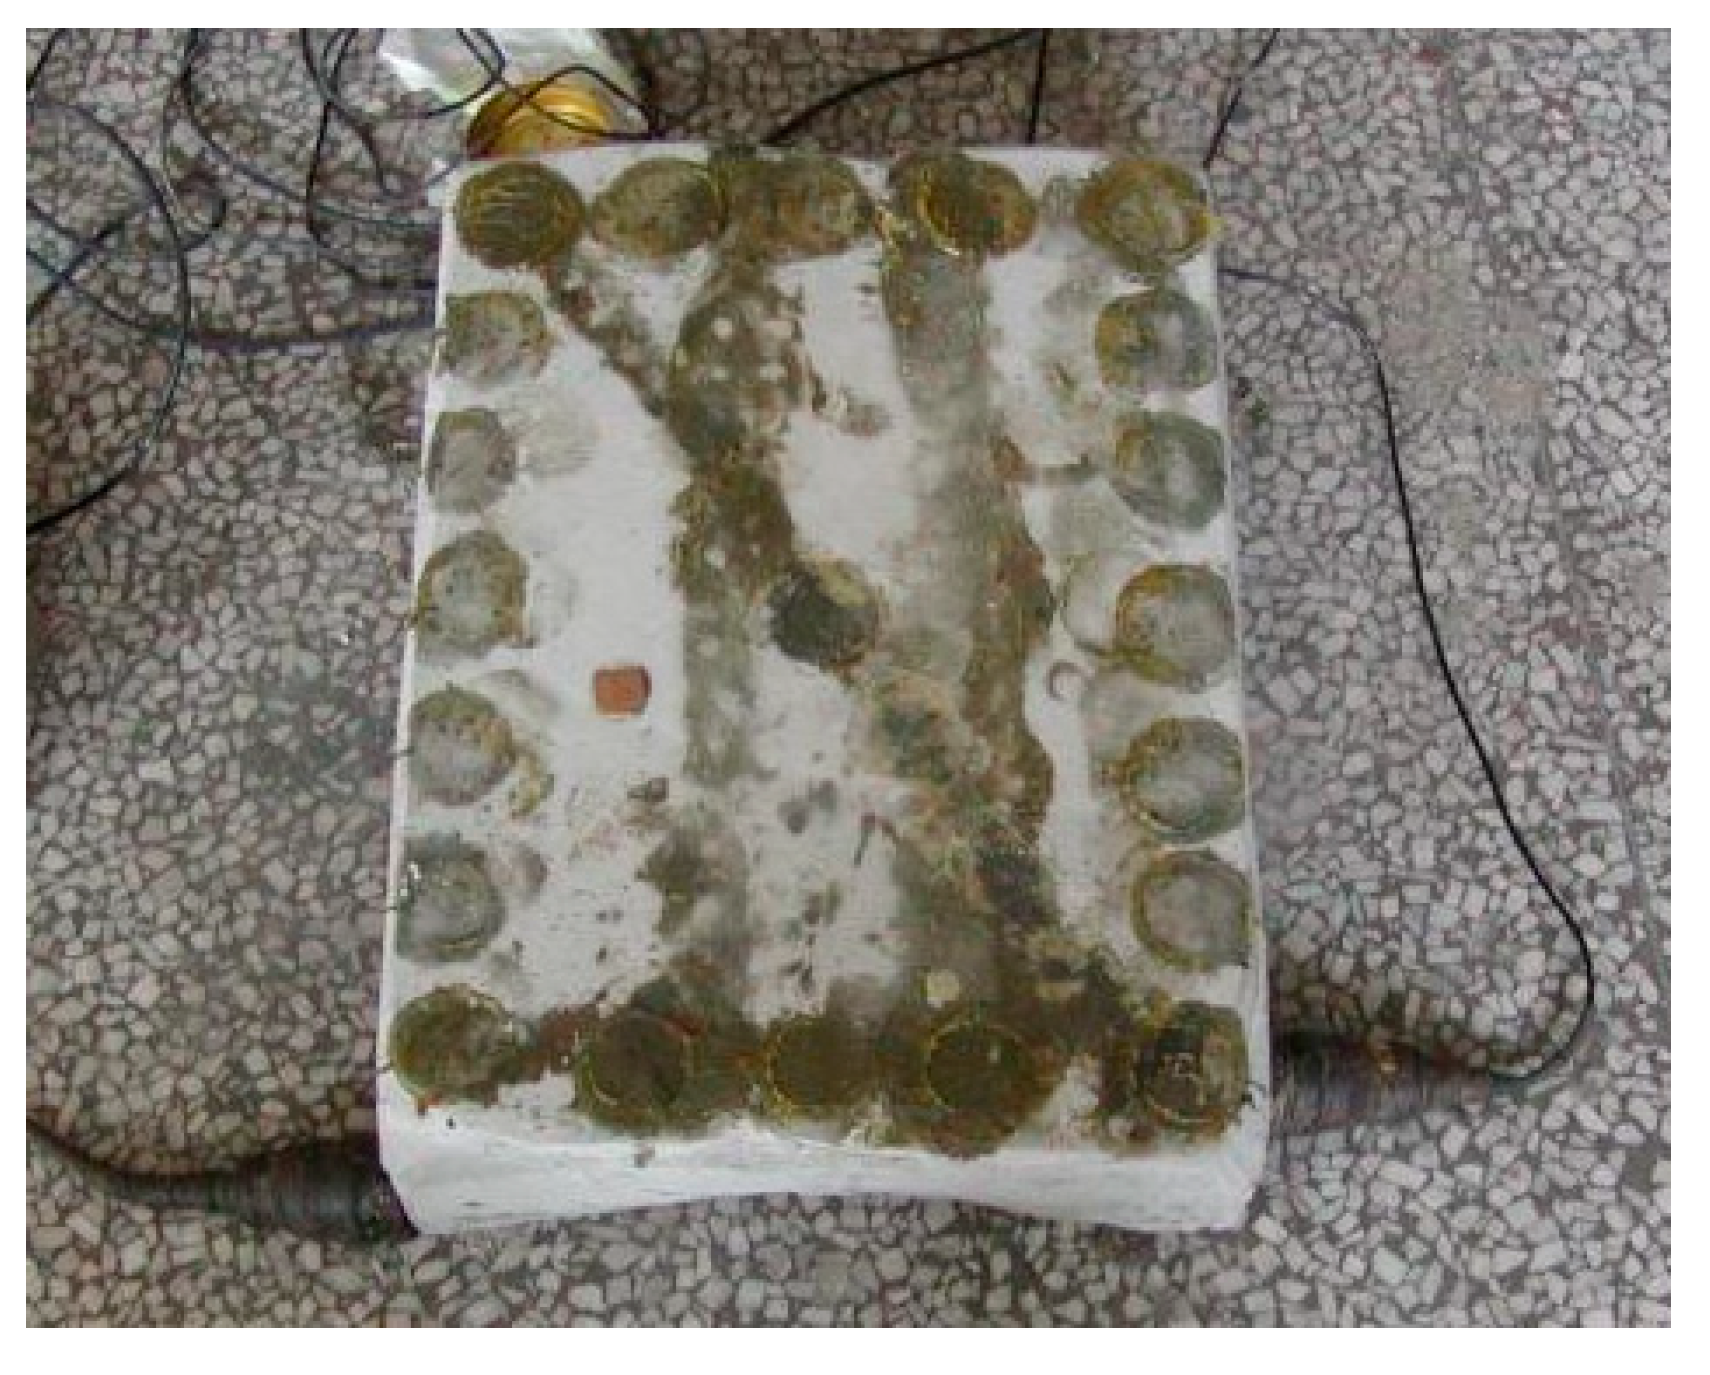
Wave velocity is one of the most critical factors in acoustic detection, so it is necessary to test the wave velocity of specific models. Acoustic CT detection technology can not only reflect the distribution of P-wave velocity on the profile of the object to be measured, but also reflect the properties of the medium in the profile of the object to be measured. Next, acoustic CT imaging technology will be used to detect the indoor concrete model. The design size of the indoor concrete model sample is 420 mm × 310 mm × 130 mm, and the defect size of the shallow circular cavity is 110 mm × 110 mm. The model was made of C30 strength cement and relatively uniform medium sand, and the ratio of cement to medium sand is 1:2. Before the pouring of the model, it is necessary to wash the base iron plate of the sample and conduct an oil brushing. Before pouring the model sample, it is necessary to fix the iron plates at the bottom and around the model according to the design size of the model sample, and then oil should be brushed on the iron plates after the iron plates are washed clean. Firstly, the layered pouring method was used to pour the cushion part of the model. In order to ensure the full discharge of bubbles in the concrete and the quality of the model sample, it is necessary to fully vibrate the cushion after the completion of the pouring. Then, the defective mold was placed and fixed after the cushion was solidified, and the cavity of the concrete model sample was poured until the concrete covered the circular defective mold. After pouring and vibrating, the model sample must be watered and cured every 2 h to make the model reach a certain strength. The test model is shown in Figure 8.
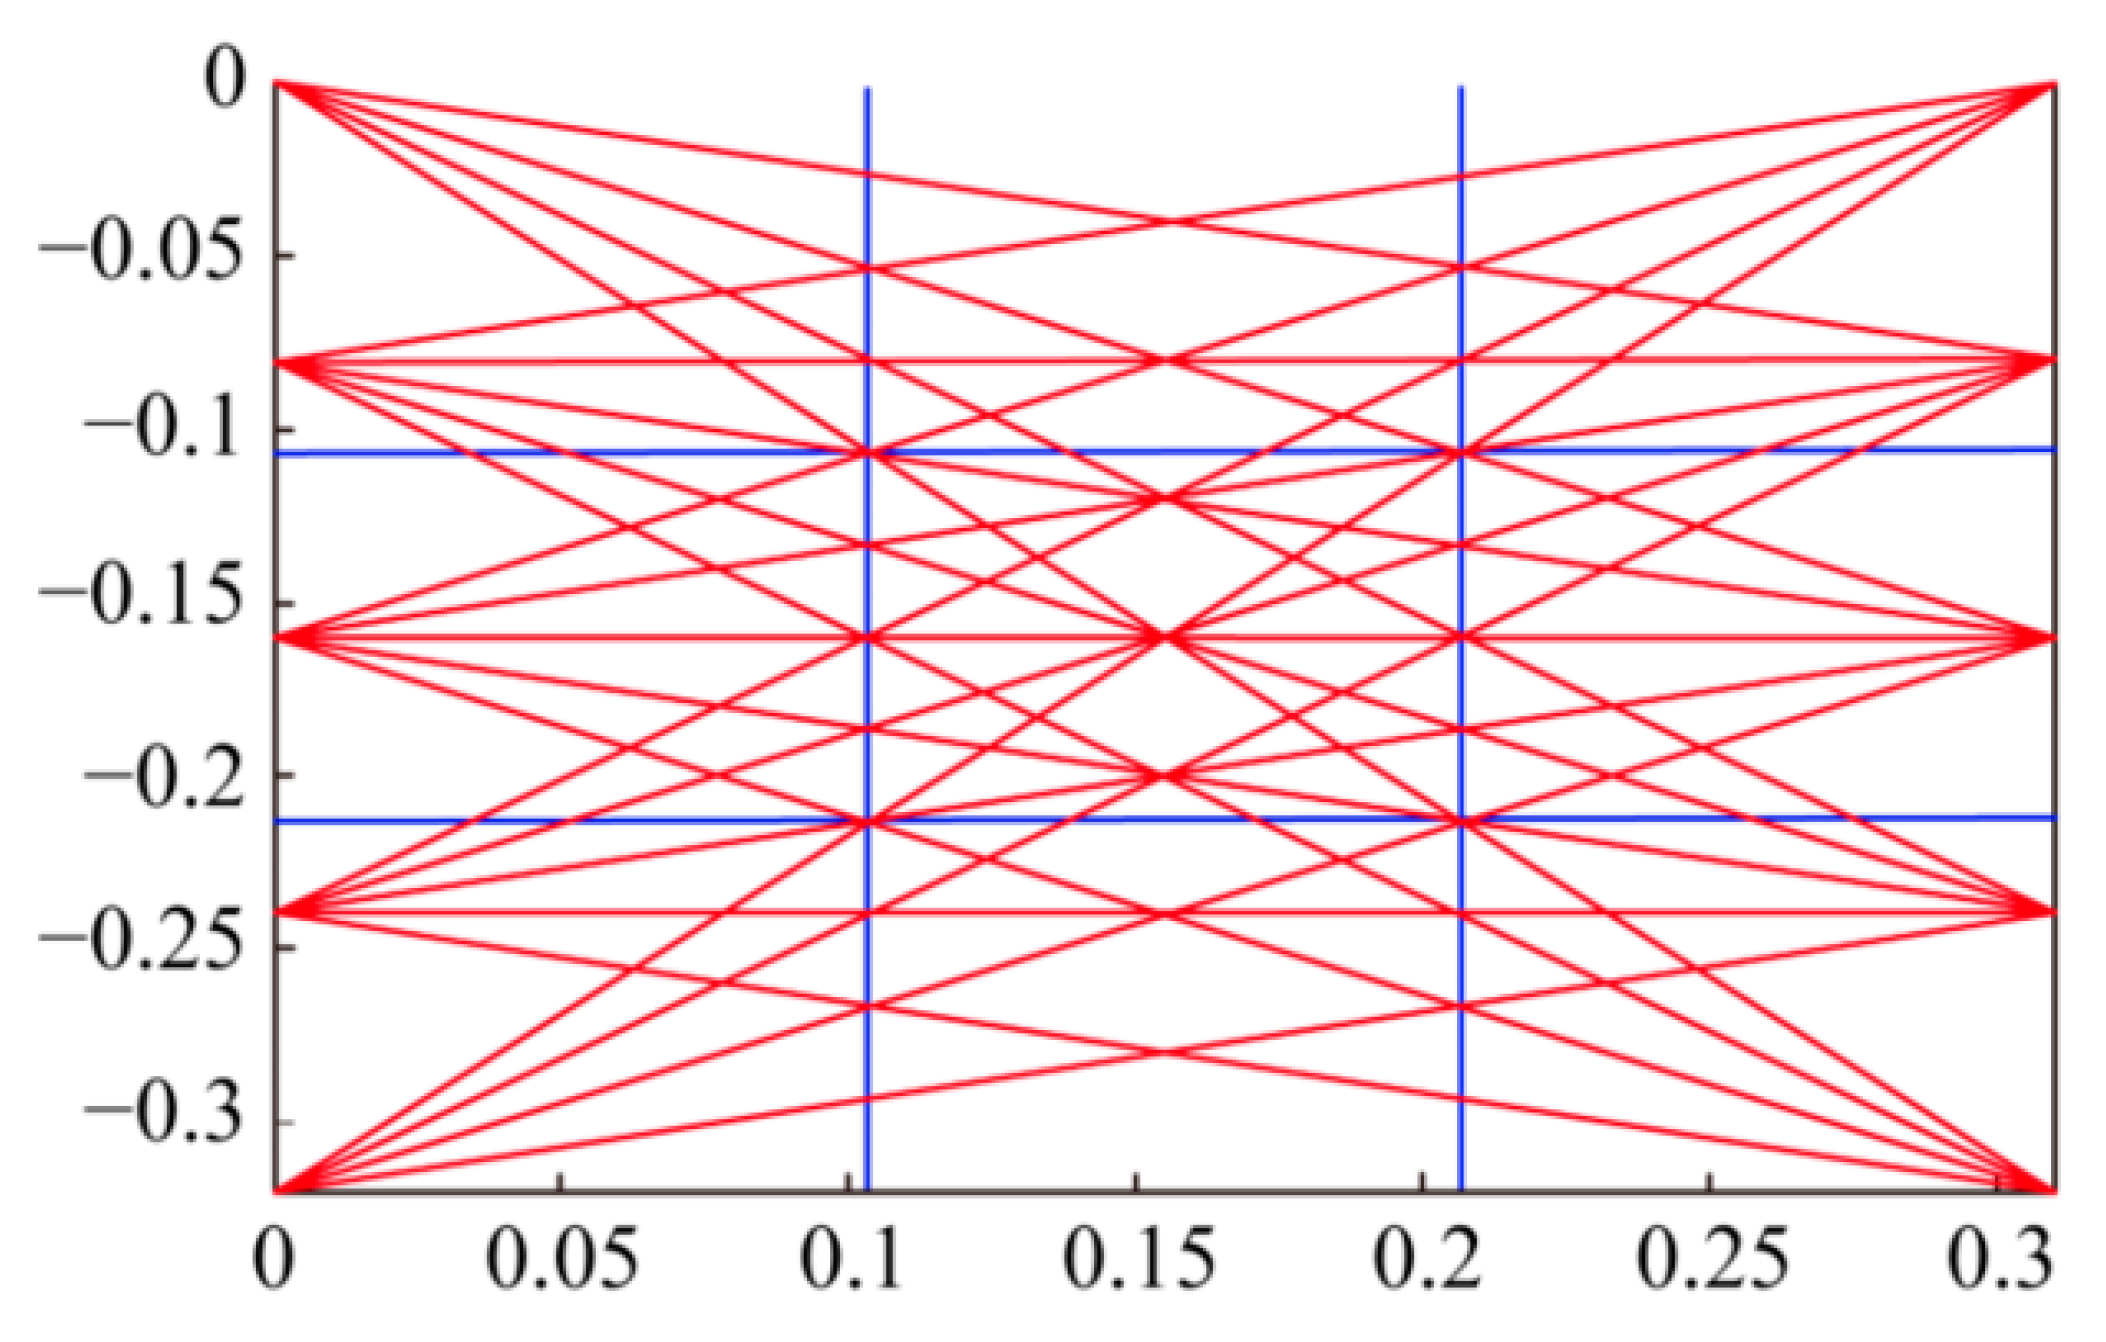
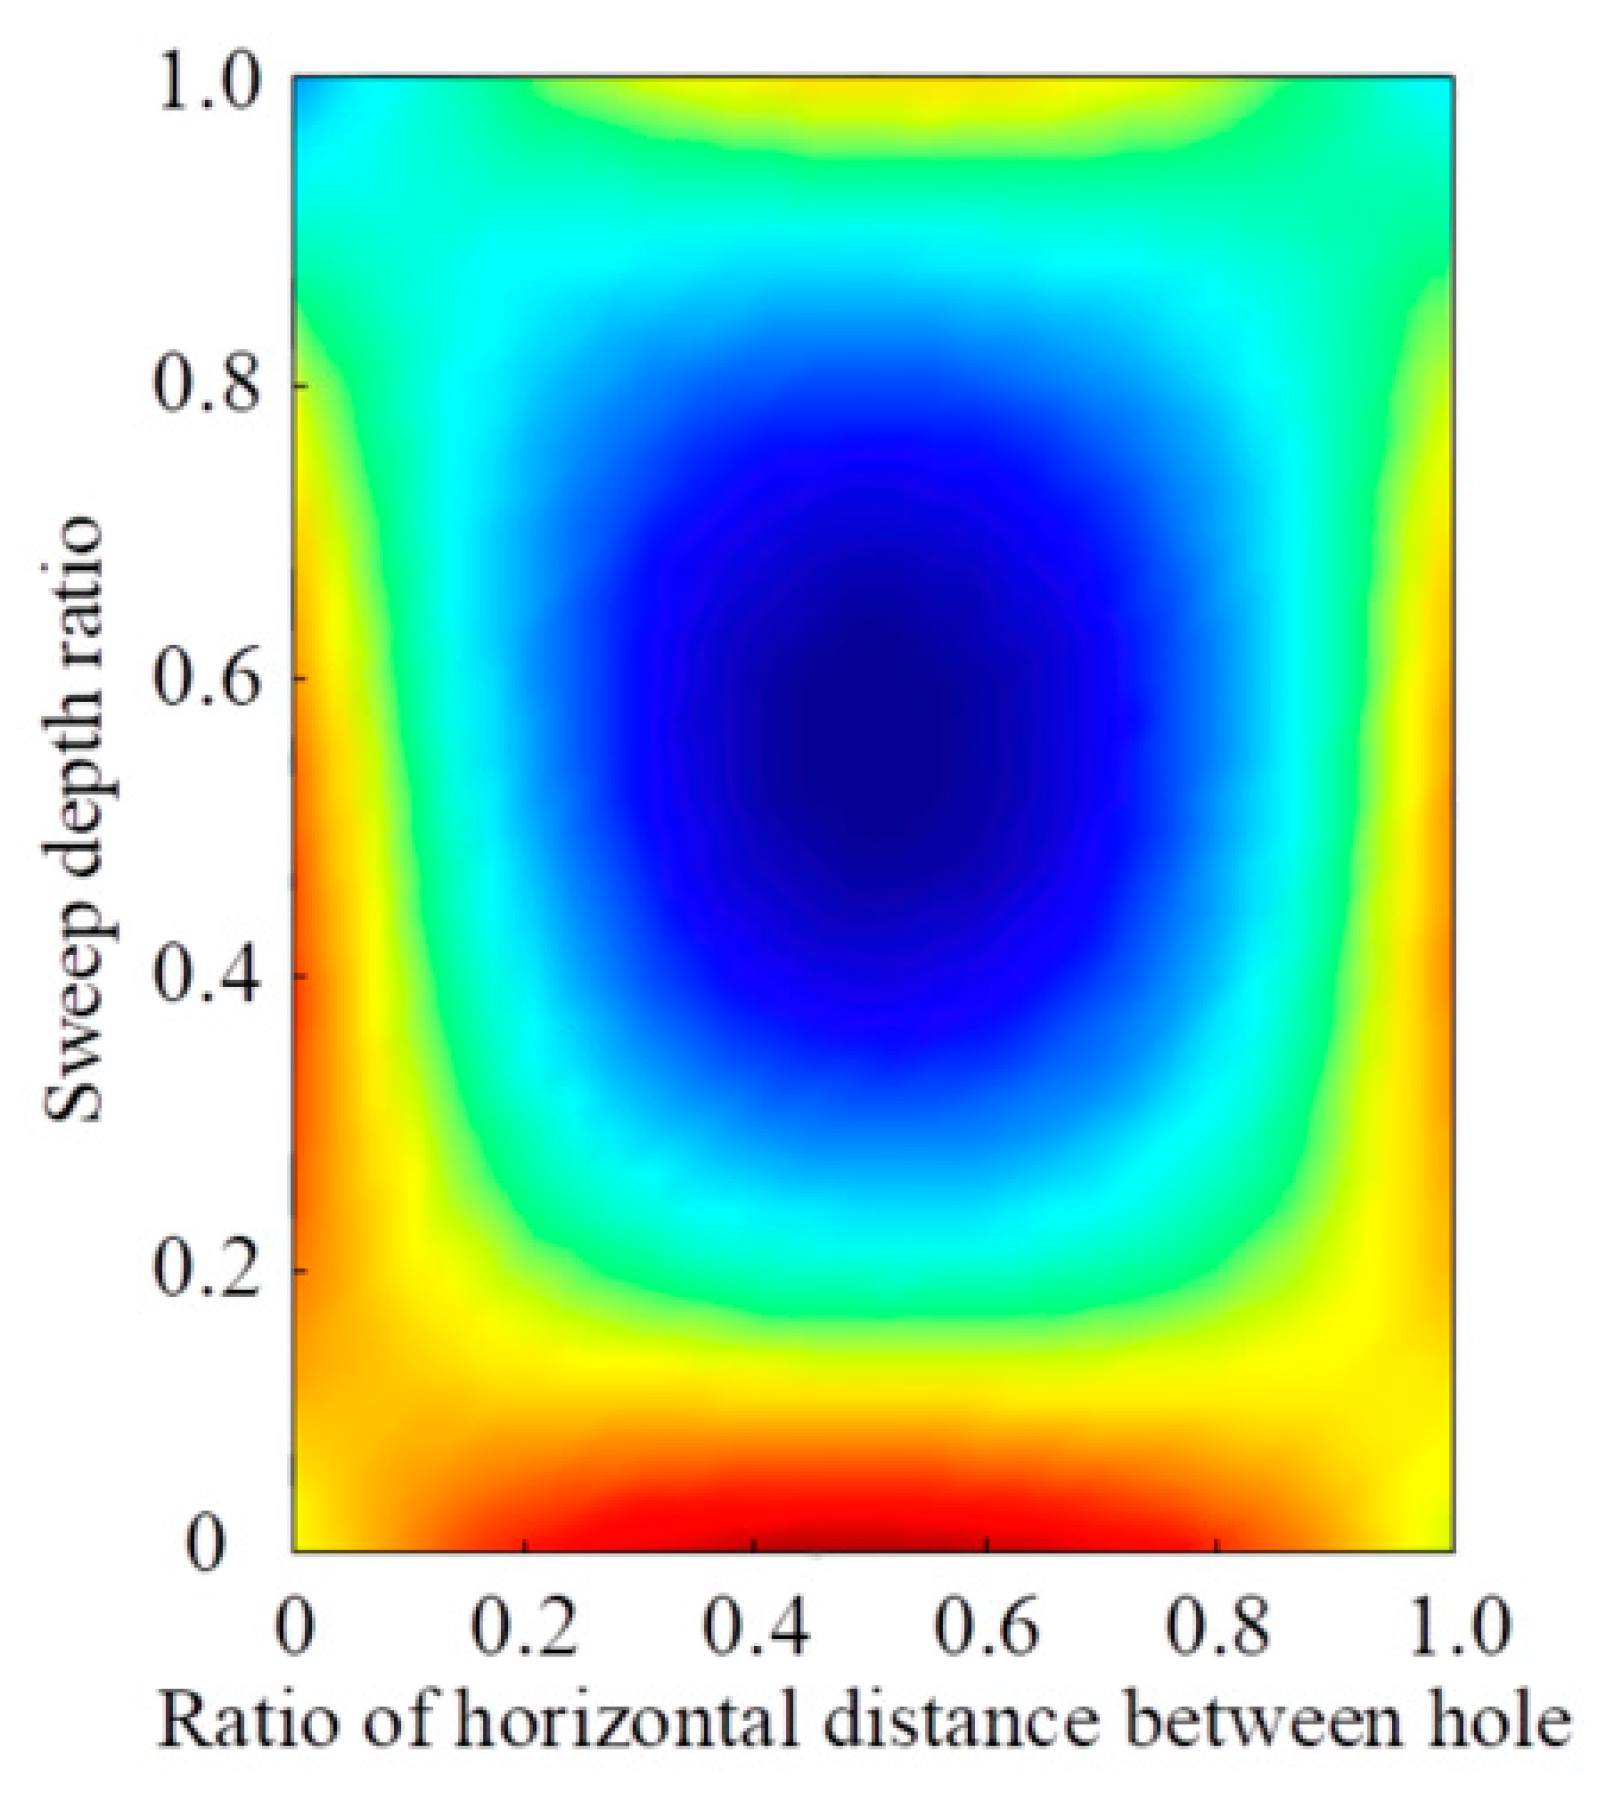
The test method is as follows. The two long parallel sides of the hemispherical interface model are taken as the test surface; the layout of the measuring point is shown in Figure 9. The CT test unit and measurement rays are shown in Figure 10. In order to avoid the influence of the concrete model boundary reflection on the accuracy of the test results, the measuring rays’ layout should be as far away from the edge of the concrete model as possible. The wave velocity distribution of the acoustic CT imaging of the concrete model is shown in Figure 11. The color in the figure represents the relative size of the wave velocity, the warm color represents the large wave velocity value, and the cold color represents the small wave velocity value. It can be seen from Figure 11 that the high wave velocity area is mainly distributed around the measured model, and the maximum wave velocity is mainly concentrated in the lower part of the model. At the same time, there is a cold-colored circular area in the middle of the wave velocity distribution map, indicating that the wave velocity is low in this area. The overall wave velocity is characterized by a lower velocity distribution as it gets closer to the middle area. This is because there is a spherical cavity in the central area of the concrete model, which leads to the decrease in wave propagation speed in this area.
Combined with Figure 8 and Figure 11, it can be seen that acoustic CT imaging can better and intuitively reflect the existence of cavities in the measured object. The detection effect is good and has certain theoretical and practical significance. However, due to the non-uniformity of concrete model materials and the difference in material impedance, it is easy to cause reflection and other interference phenomena in the process of wave propagation, and the location of the cavity cannot be accurately determined. In addition, the indoor model test needs to complete the penetration test on two test surfaces, while the test profile needs to be probed by drilling in the engineering application. In order to further verify the applicability of long-range cross-hole acoustic wave detection technology in engineering applications, it is necessary to carry out a series of field tests.

4. Field Experiments of Cross-Hole Acoustic Wave Detection

Although the indoor concrete model test has verified the feasibility of cross-hole acoustic wave detection, the model test needs to be completed on two test surfaces compared with the engineering application. Therefore, it is necessary to study the cross-hole acoustic wave detection technology in an engineering application. Relying on the tunnel grouting project, high-rise building project and subgrade project, the cross-hole acoustic wave detection method is used to detect the grouting effect, building foundation and subgrade diseases in the engineering site. The original data are collected by single-point excitation and multi-point reception. The results of tomography inversion imaging verify the feasibility and applicability of cross-hole acoustic CT tomography technology in practical engineering exploration.

4.1. Tunnel-Surrounding Rock Grounting Detection

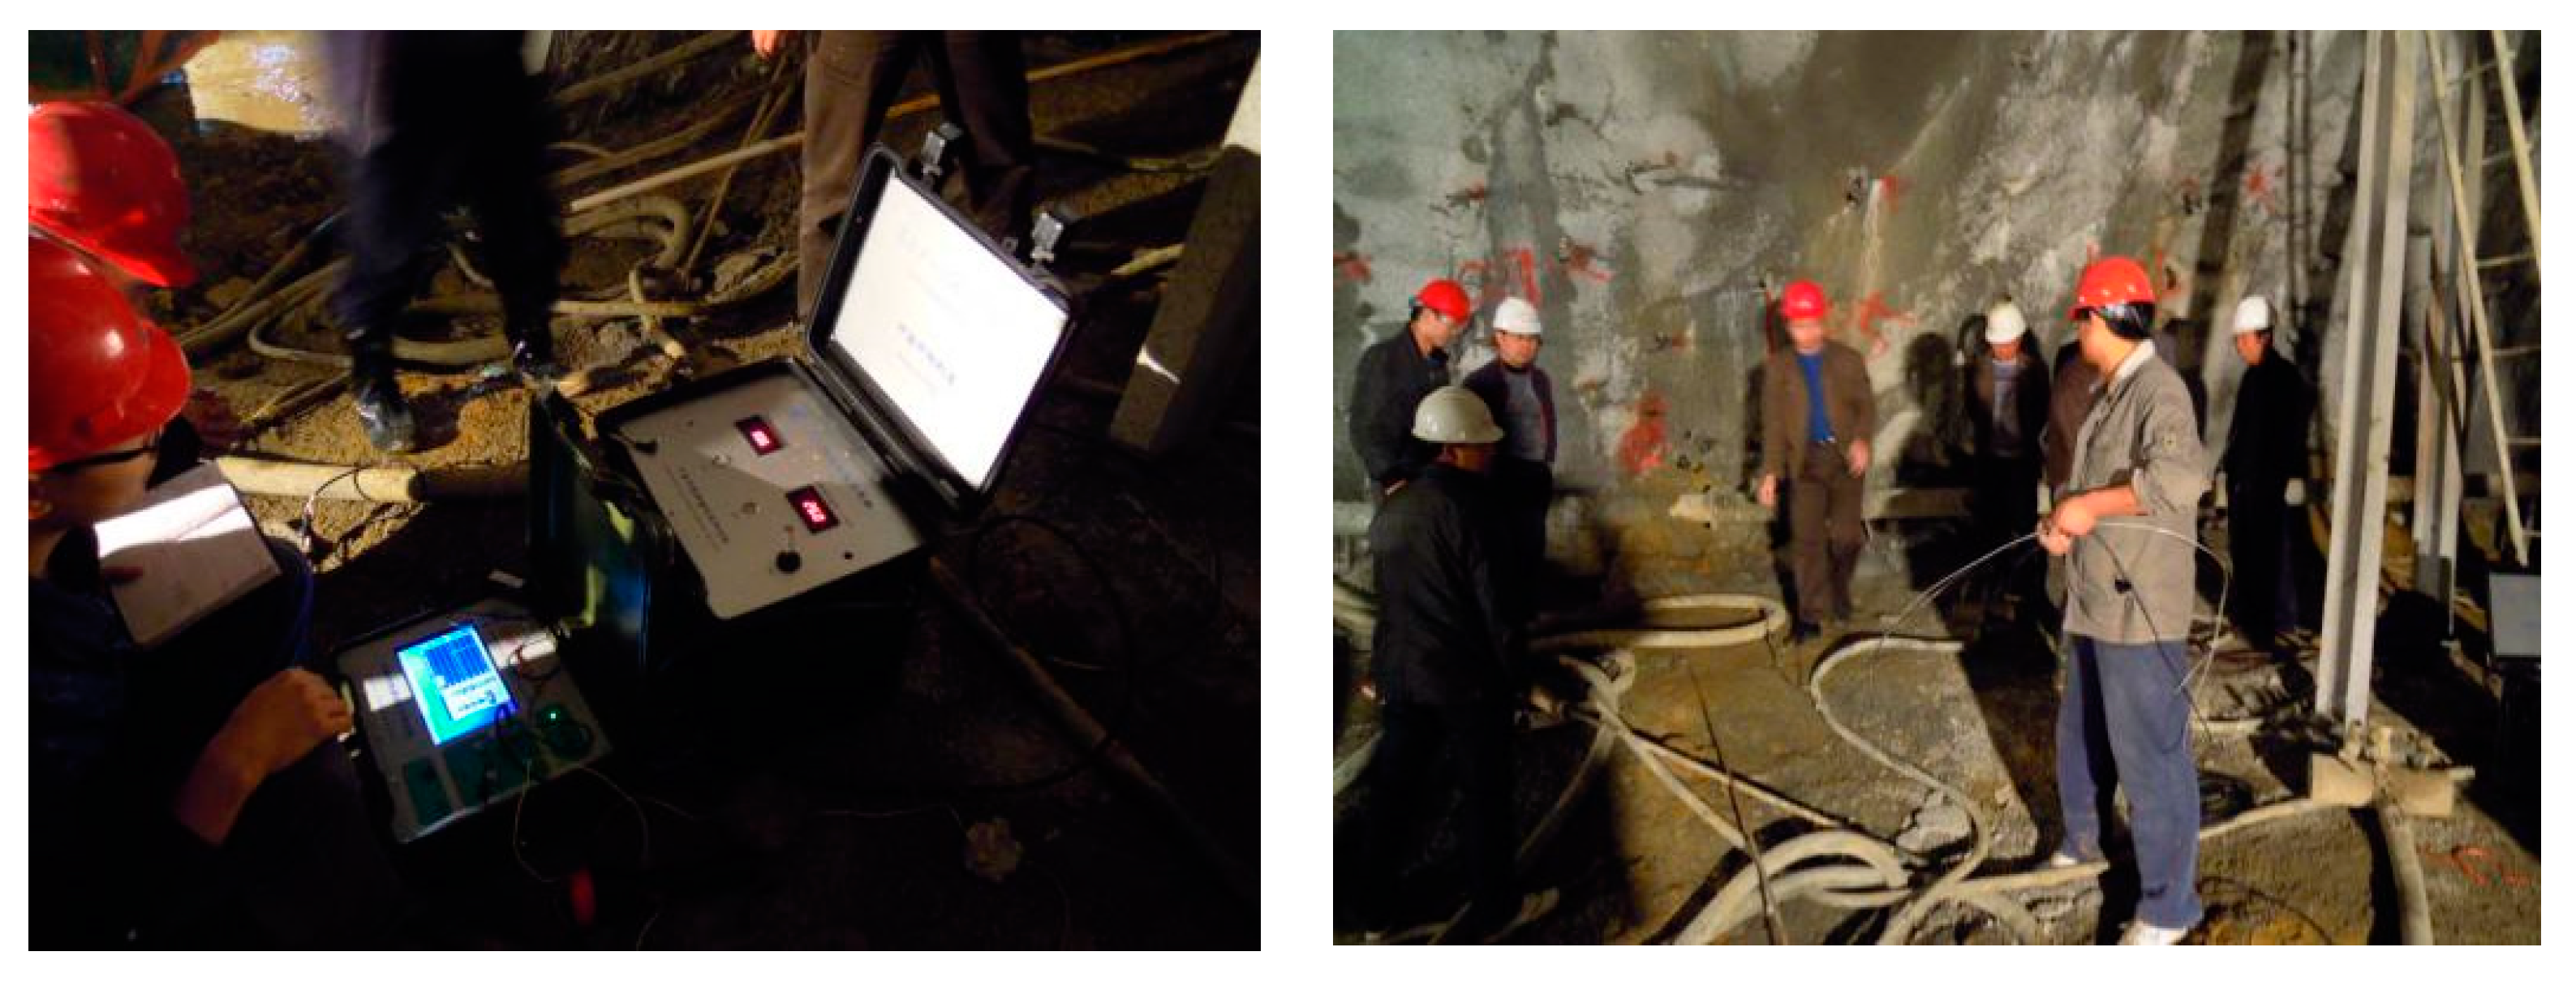
A tunnel in southwest China is located in the development zone of dissolution. The bedrock is layer argillaceous limestone with horizontal distribution. The rock quality is hard, joints and fractures are developed, and the rock mass is loose and broken. In the process of tunnel excavation, it is easy to cause collapse and falling of the tunnel top, and there is a high risk of large deformation of the support. In order to reduce the risk level of construction, advance grouting is adopted to reinforce rock layer. In order to detect the quality effect of advance grouting and determine the next excavation measures of the tunnel, the long-distance cross-hole acoustic CT detection technology is used to detect the reinforcement section of advance grouting. The field collection test is shown in Figure 12.
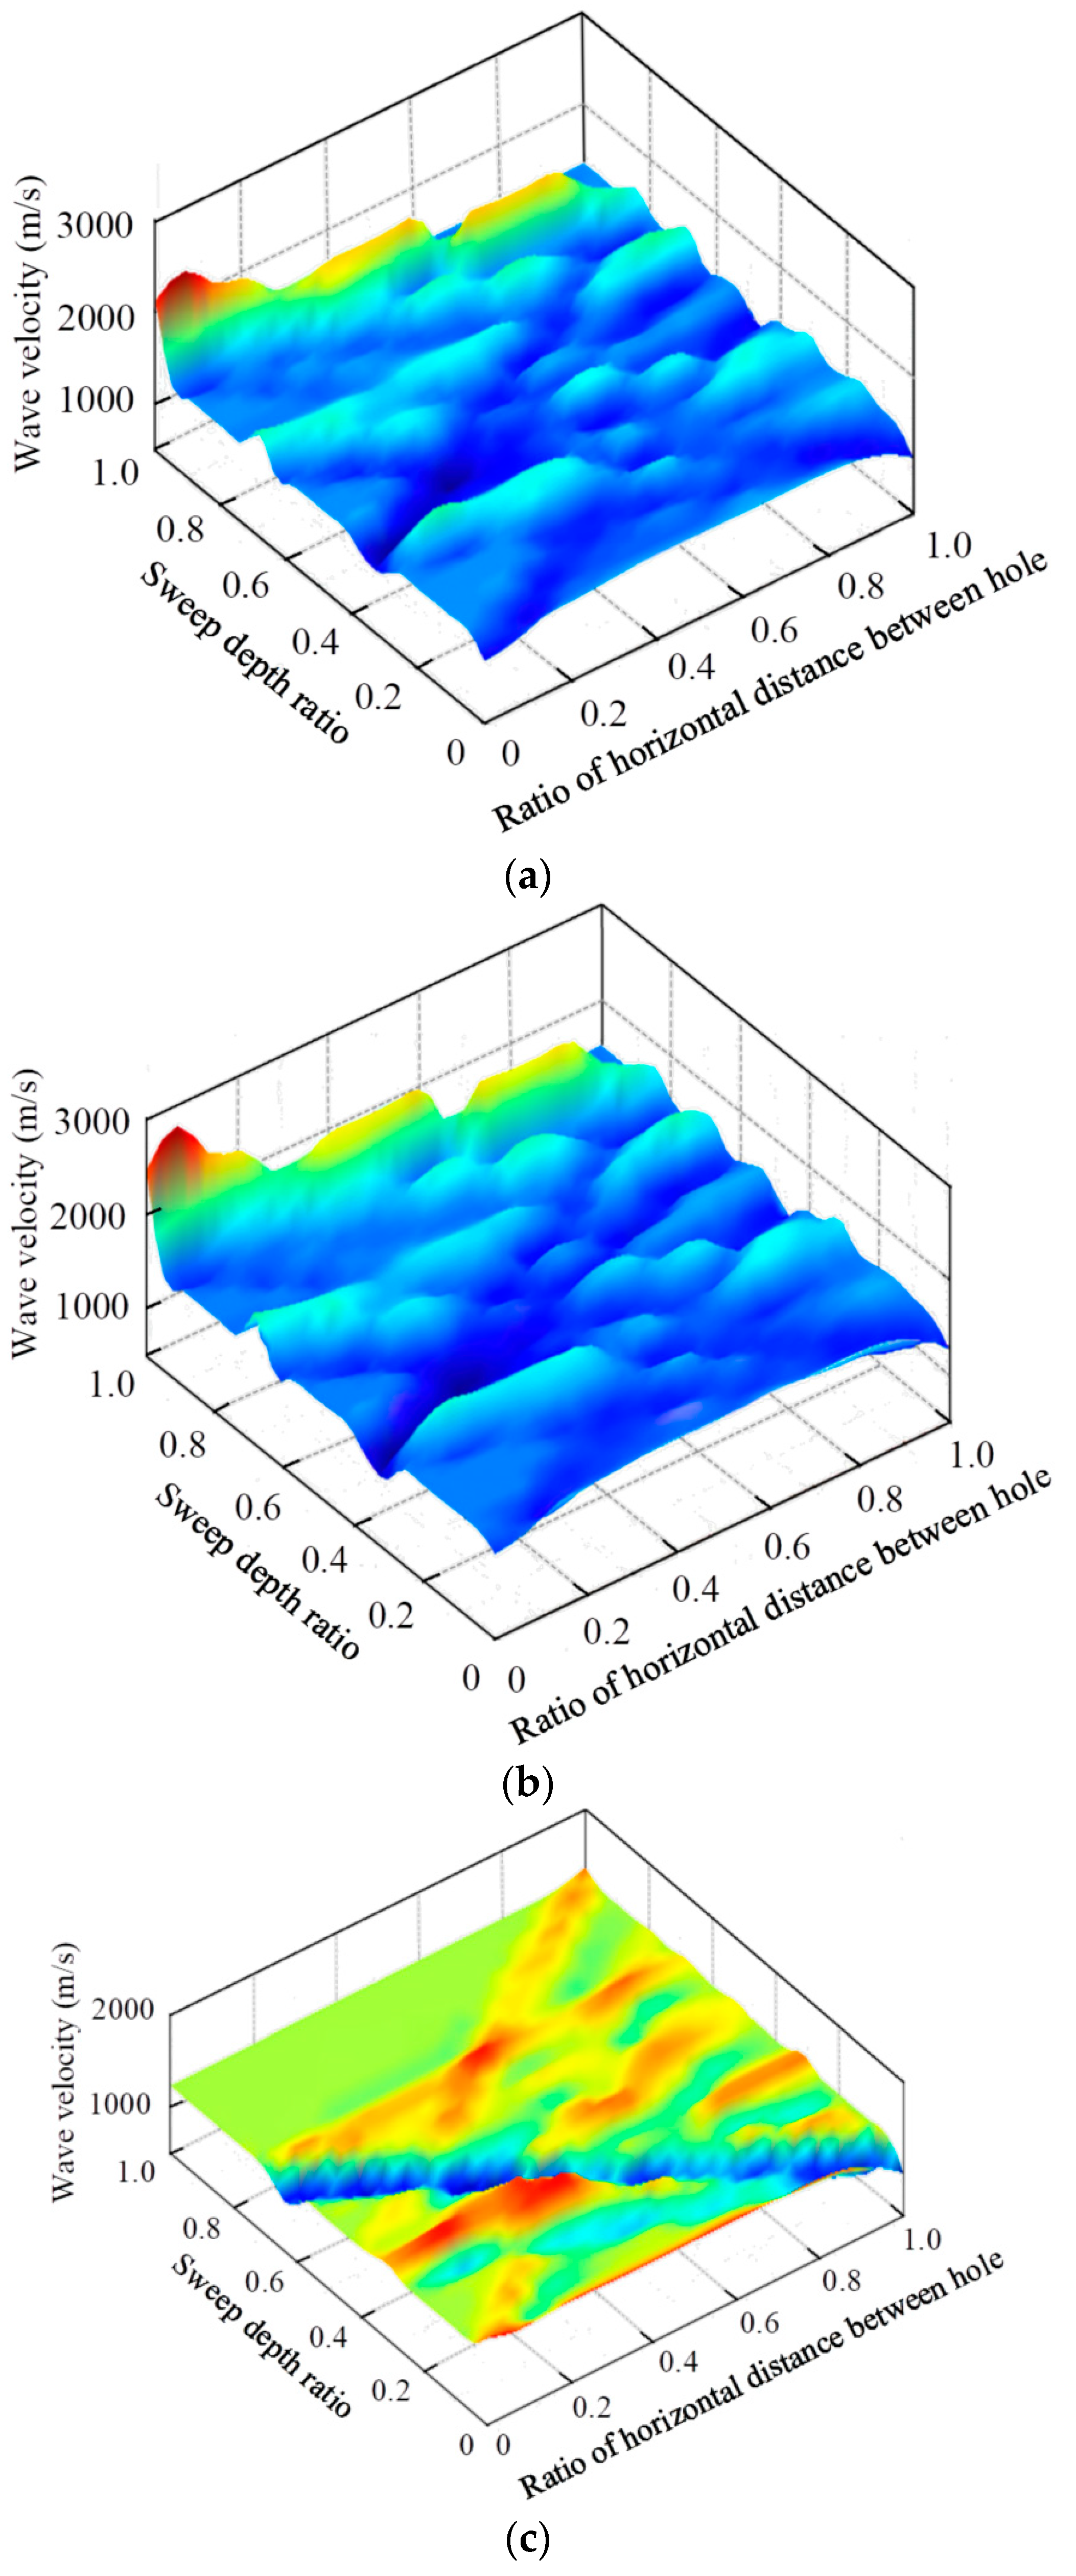
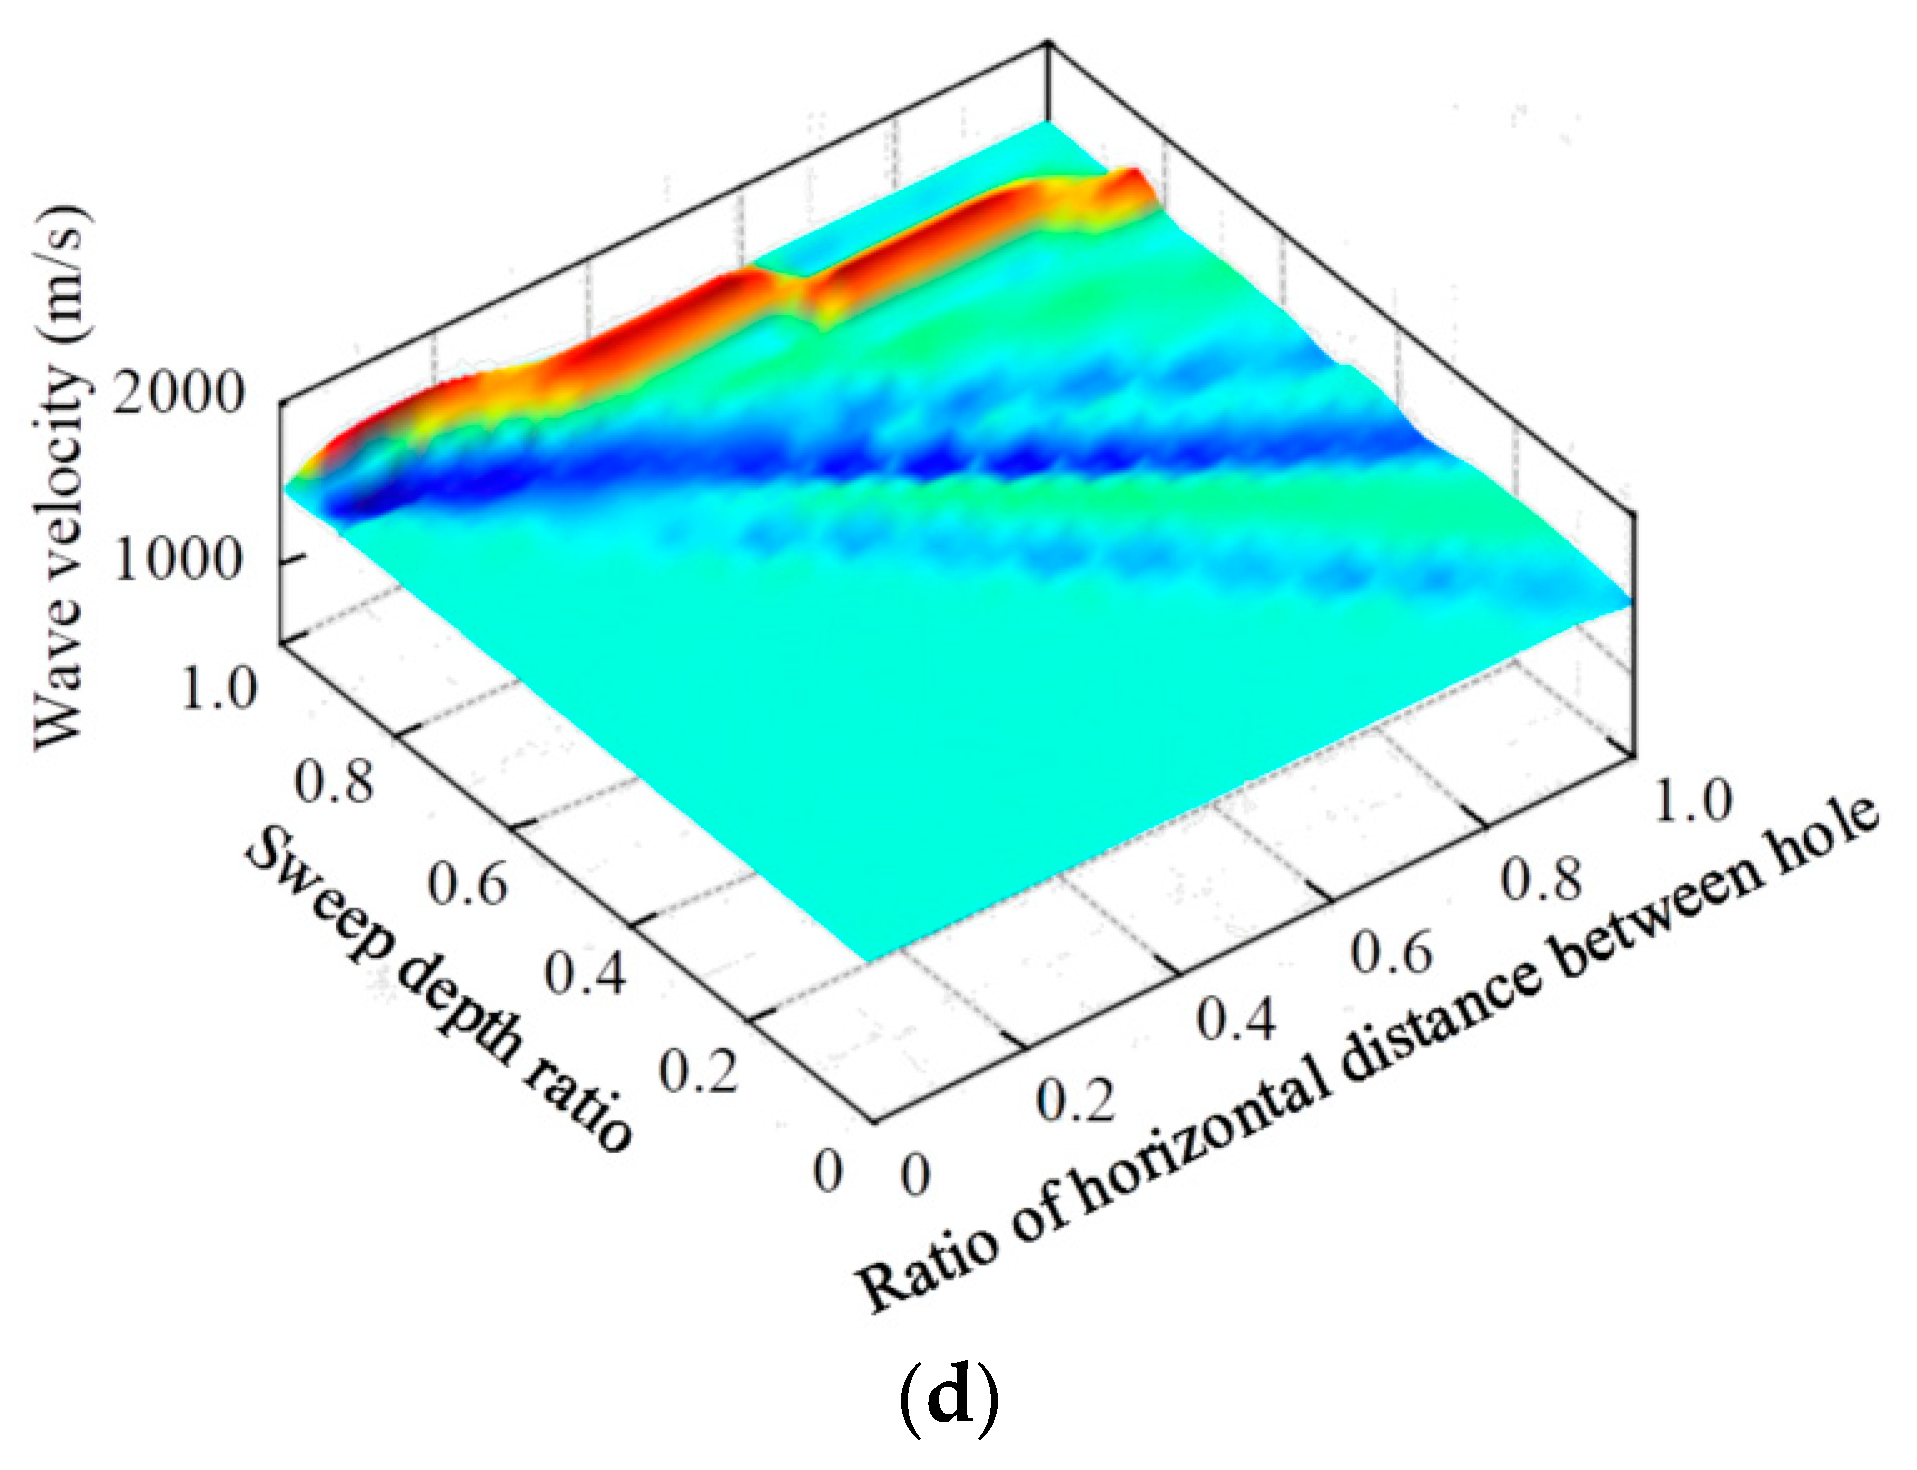
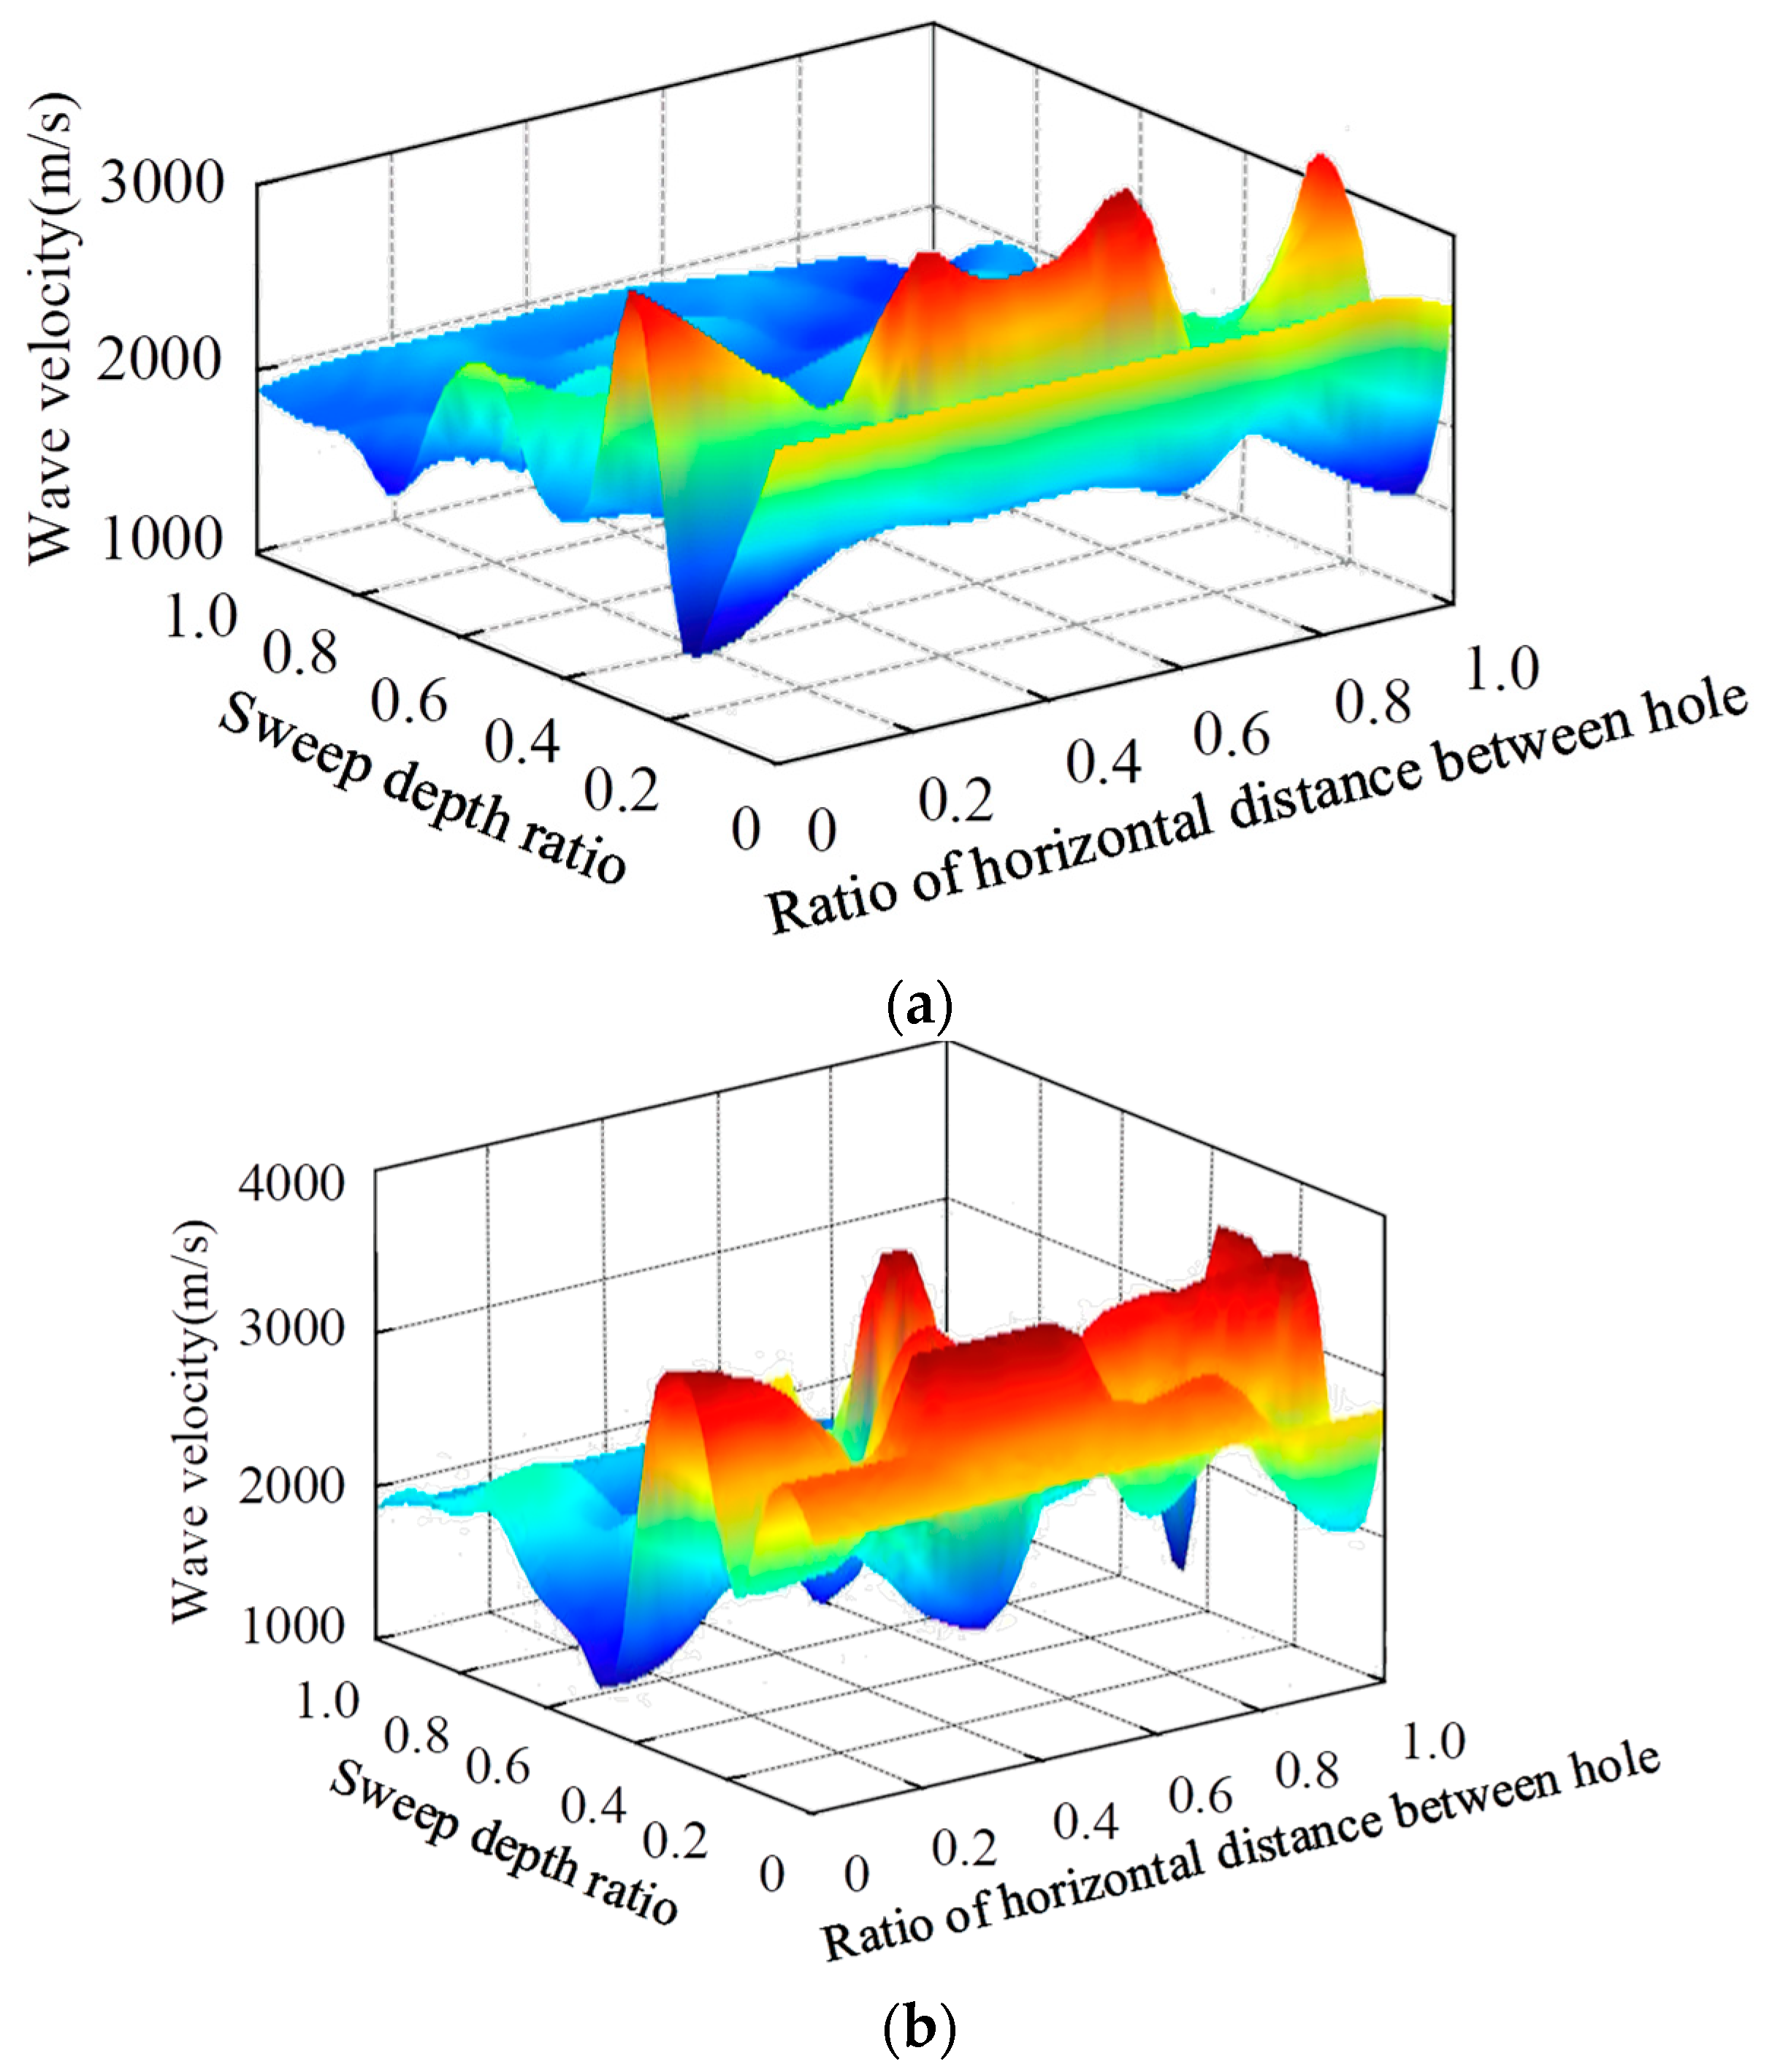
The three-dimensional contour map of wave velocity is shown in Figure 13. The red area in the figure represents the abnormal area of wave velocity. It can be seen from Figure 13a that the ratio of wave velocity to the maximum wave velocity of the profile is 1, and the maximum wave velocity is 2200 m/s. The wave velocity of rock and soil mass below and above the abnormal wave velocity area is 1000–1500 m/s and 1500–2200 m/s, respectively. In general, the wave velocity above the anomaly area is higher than that below the abnormal area. It can be seen from Figure 13b that the ratio of wave velocity to the maximum wave velocity of the profile is 0.9–1.0, and the maximum wave velocity is 2800 m/s. The rock and soil mass wave velocities below and above the abnormal area are 1000–2000 m/s and 2000–2800 m/s, respectively. The wave velocity distribution characteristics of the profile are similar to Figure 13a. According to Figure 13c, the ratio of wave velocity to the maximum wave velocity of the profile is 0.4 to 0.5, and the maximum wave velocity is 1200 m/s. The rock and soil mass wave velocity above and below the abnormal area is about 1000 m/s. The wave velocity distribution characteristics of the profile are different from those in Figure 13a,b. On the whole, the wave velocity distribution features are high in the middle and low in the upper and lower parts. It can be seen from Figure 13d that the ratio of wave velocity to the maximum wave velocity of the profile is 0.8–1.0, and the maximum wave velocity is 1800 m/s. The rock and soil mass wave velocities below and above the abnormal area are 1000–1500 m/s and 1500–1800 m/s, respectively. The high wave velocity of the profile is mainly concentrated in the sweep depth between 0.9–1.0, and the rest of the profile is mainly the bottom wave velocity distribution.
Combined with the three-dimensional contour map of the exploration profile and the on-site excavation results, the following results can be obtained: (a) The poor geological condition of the tunnel grouting section is not conducive to the penetration of the grouting slurry, resulting in the slurry mainly located in the shallow part of the tunnel-surrounding rock, and the slurry in the deep surrounding rock is discrete; (b) The grouting effect in the small area outside the lining is good, which has a good reinforcement effect on the rock and soil mass. However, there is sporadic grout outside the 1.2 m range, which basically fails to achieve the expected grouting effect. Therefore, in order to ensure construction safety, it is necessary to strengthen the grouting measures for the construction section and adopt certain measures, such as changing the arch and strengthening the support for the initial penetration limit section. At the same time, measures such as shortening the excavation footage, keeping the invert arch close, closing in time and strengthening the support should be taken to ensure the safety of tunnel excavation.

4.2. High-Rise Building Foundation Detection

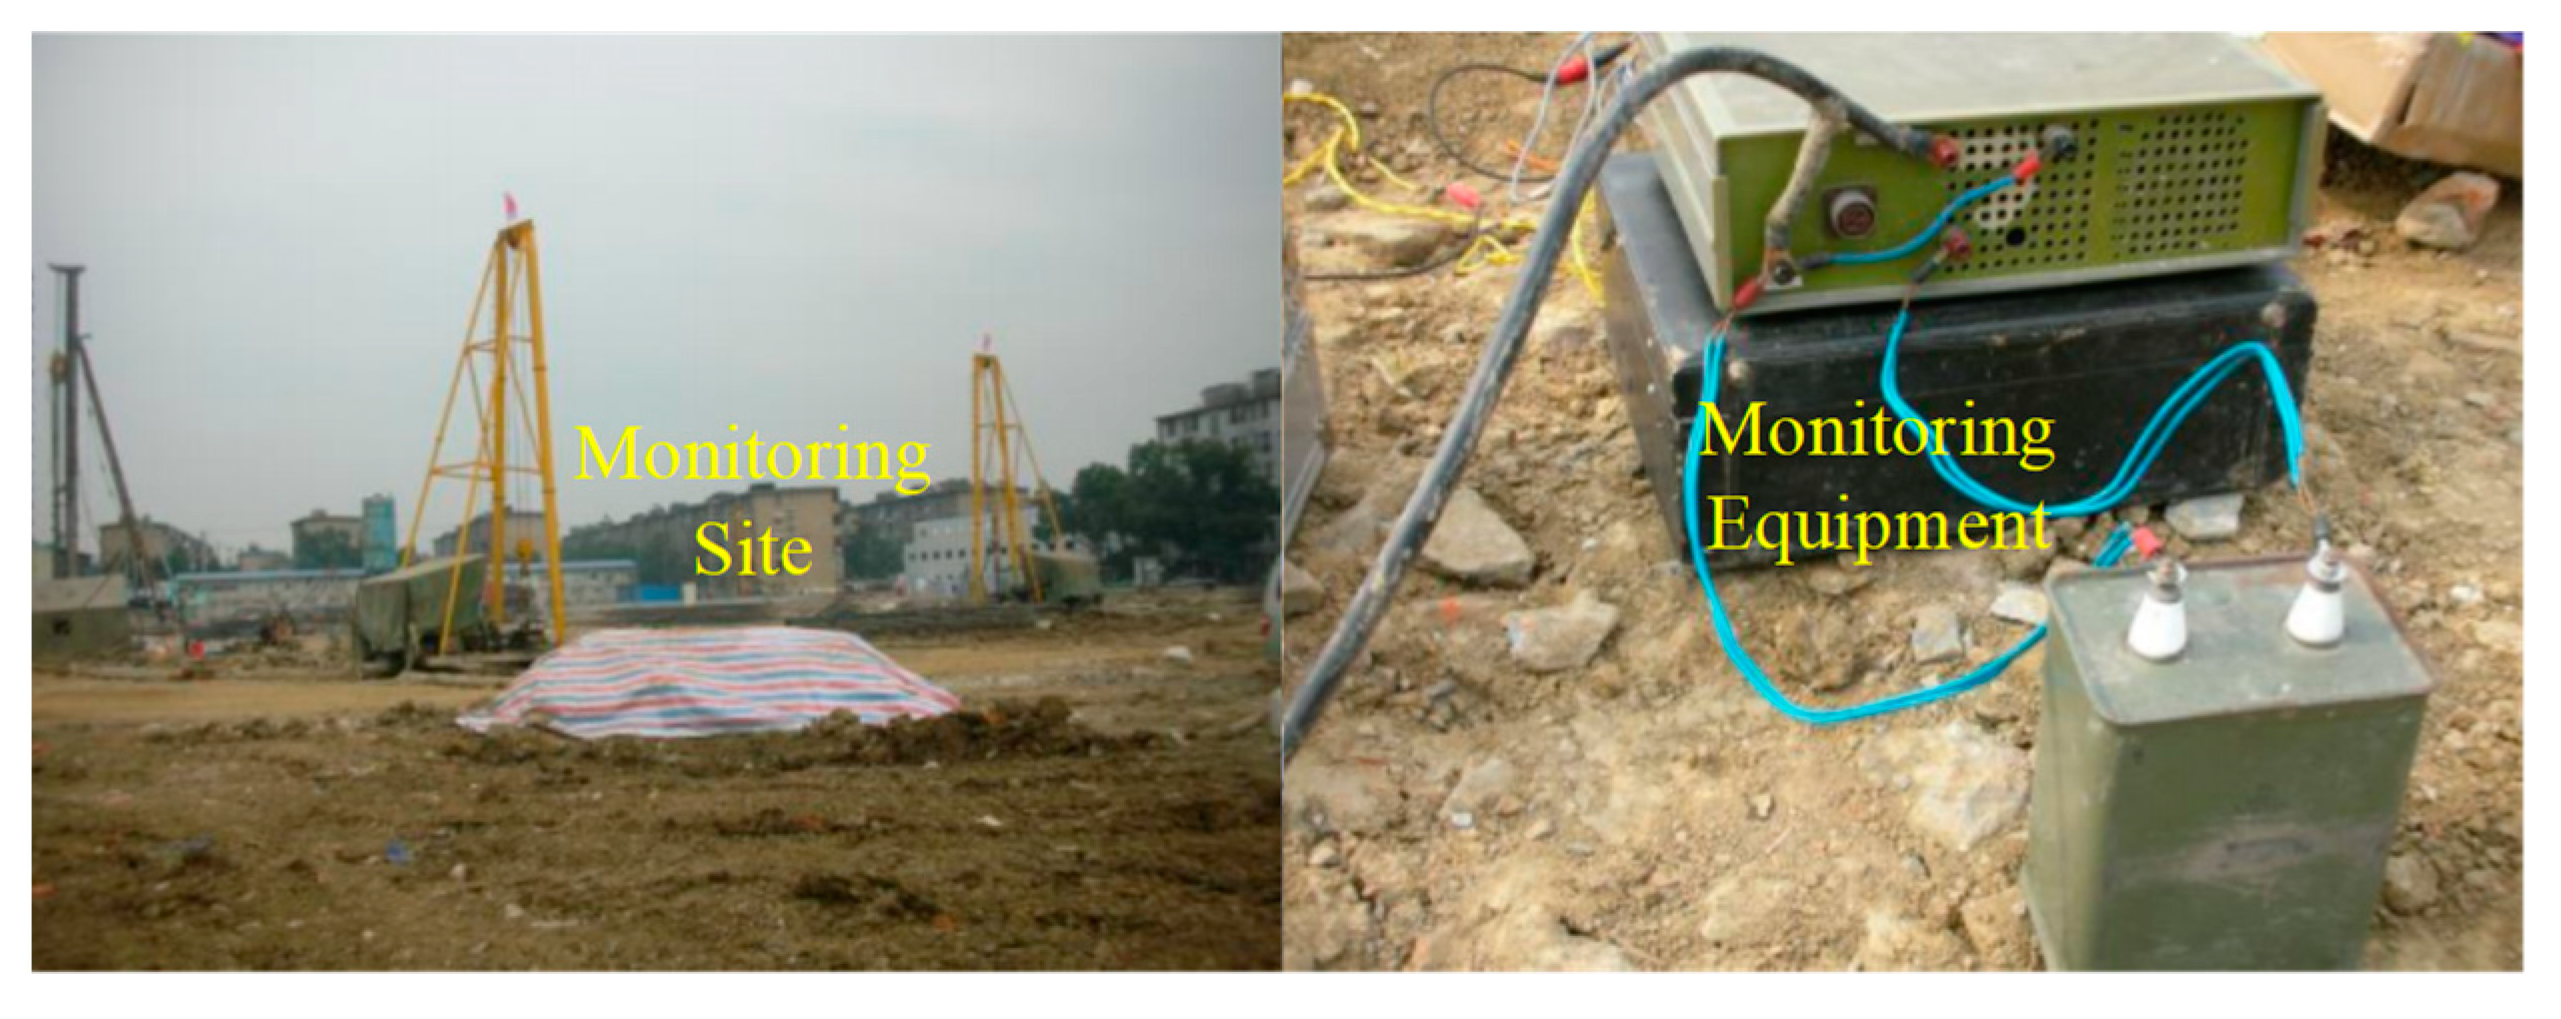
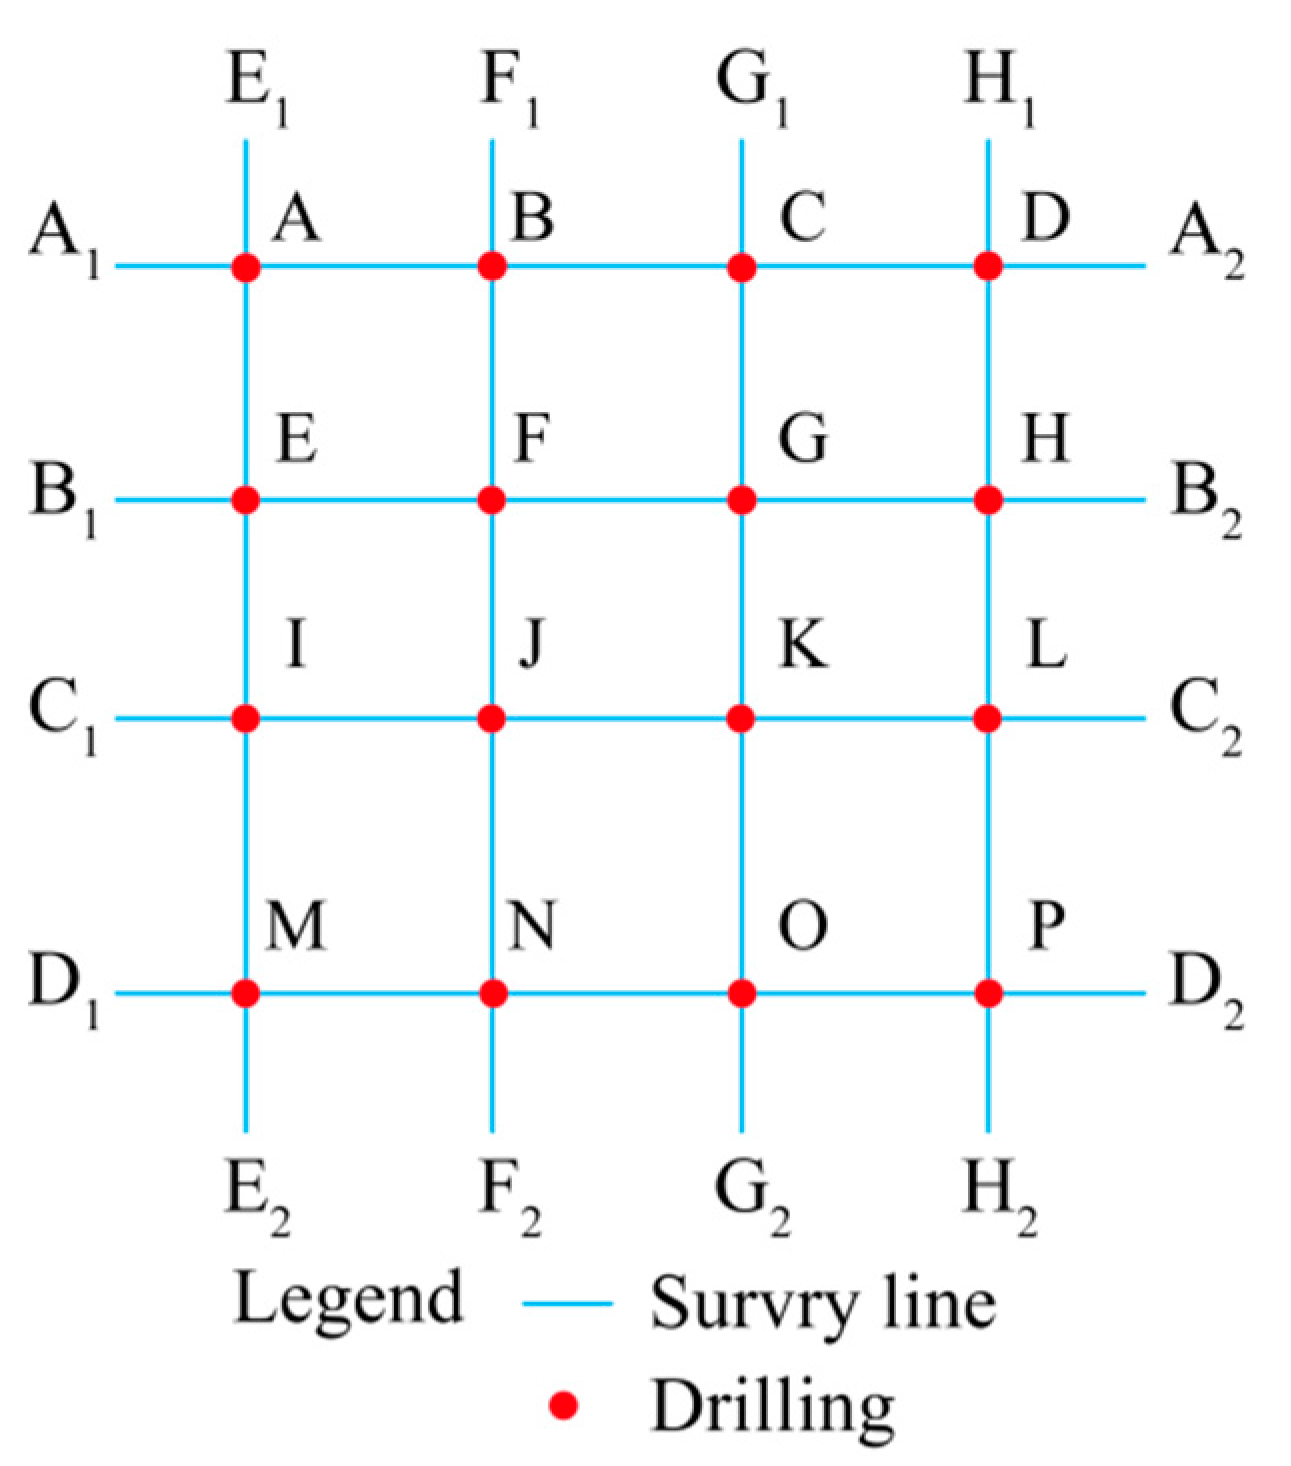
The design height of the main building of a high-rise building is 200 m, and the excavation depth of the underground foundation pit is about 12 m. The construction site belongs to the alluvial lacustrine geomorphic unit of Taihu Lake. The overall terrain is flat, the climate is mild and humid, and the rainfall is sufficient. It belongs to the monsoon climate zone. In order to determine the spatial distribution and homogeneity of the rock and soil mass inside the foundation of the high-rise building, CT tomography geophysical testing was carried out for the additional exploration holes in the construction site of high-rise buildings. In order to ensure the safety of the field test and the reliability of data transmission, the field monitoring of this test is shown in Figure 14, combined with the characteristics of the rock and soil material composition of the exploration site and the preliminary supplementary exploration borehole data. On the premise of ensuring the imaging accuracy, observation points shall be arranged every 50 cm below −70 m inside the 16 additional exploration holes in the construction site, and acoustic CT test profiles shall be set. The field test survey line and drilling layout are shown in Figure 15.
According to the steps of data filtering, computer inversion and CT image mapping, the collected data were processed. The longitudinal wave velocities of soil cave, empty karst cave, semi-filled karst cave, clay, relatively broken limestone and relatively complete limestone are, respectively, 800–1100 m/s, 1100–1400 m/s, 1400–1800 m/s, 1800–2600 m/s, 2600–3000 m/s and 3000–3600 m/s. Then, the material composition of the P-wave velocity between drillings is inferred, and the integrity of the rock and soil mass of the profile and the development of karst fractures are defined. The three-dimensional contour map of the wave velocity of partial profiles is shown in Figure 16. The test depth in Figure 16a is between 70 m and 100 m, and the width of the profile is about 22 m. The average P-wave velocity between measuring points in the profile is 2411 m/s, the minimum P-wave velocity is 1630 m/s, and the maximum P-wave velocity is 3242 m/s. The P-wave velocity in the profile generally shows that the distribution characteristics of the upper wave velocity are smaller than the lower wave velocity, and the wave velocity boundary is about 88 m. The upper part of the wave velocity interface is a clay layer with relatively uniform wave velocity distribution; no cavity is found. The lower part of the wave velocity interface is a weathered limestone with a low-speed area, and the karst is developed and mostly filled with clay. The test depth in Figure 16b is between 70 m and 90 m, and the width of the profile is about 31 m. The average P-wave velocity between measuring points in the profile is 2487 m/s, the minimum P-wave velocity is 1644 m/s, and the maximum P-wave velocity is 3477 m/s. The distribution characteristics and geological conditions of P-wave velocity in the profile are consistent with Figure 16a. Combined with the analysis results of all cross-hole acoustic wave CT tests, it can be concluded that: (a) The average P-wave velocity in the test profile is 2300–2500 m/s. 41% of the wave velocities are greater than 3000 m/s, 53% are between 1700–3000 m/s, and 6% are less than 1700 m/s; (b) Most of the soil layers within the detection range are uniformly distributed, and there are only some empty holes. Therefore, the clay layer should be considered as the supporting layer of the foundation of the high-rise building. At the same time, the stability of the soil layer needs to be calculated.

4.3. Subgrade Detection

A newly built railway needs to pass through abandoned coal mines. The goaf and subsidence area, as well as a large number of edge fractures, have been formed in a coal mine roadway. These have seriously affected the stability and integrity of the safety coal pillar, which will inevitably bring potential safety hazards to the construction of the new railway and the stable operation of the train. Although the mining of the abandoned coal mine has been stopped for more than 20 years, the upper part of the coal mining area has not obviously collapsed, and most of the settlements have occurred, but compared with the theoretical calculation of the settlement value, 0.8 m has not been completed. Therefore, it is necessary to remediate and treat the settlement control requirements of the coal mine goaf according to the railway construction standards. The specific stratum conditions of the new railway crossing area are as follows: the surface layer of 0~5 m is silty clay, 3~10 m is completely weathered sand mudstone, 10~20 m is strongly weathered mudstone and argillaceous sandstone, and weakly weathered muddy sandstone is below 20 m in depth. The regional geological profile is shown in Figure 17. The range of wave velocity variation of different rock and soil media is shown in Table 1.
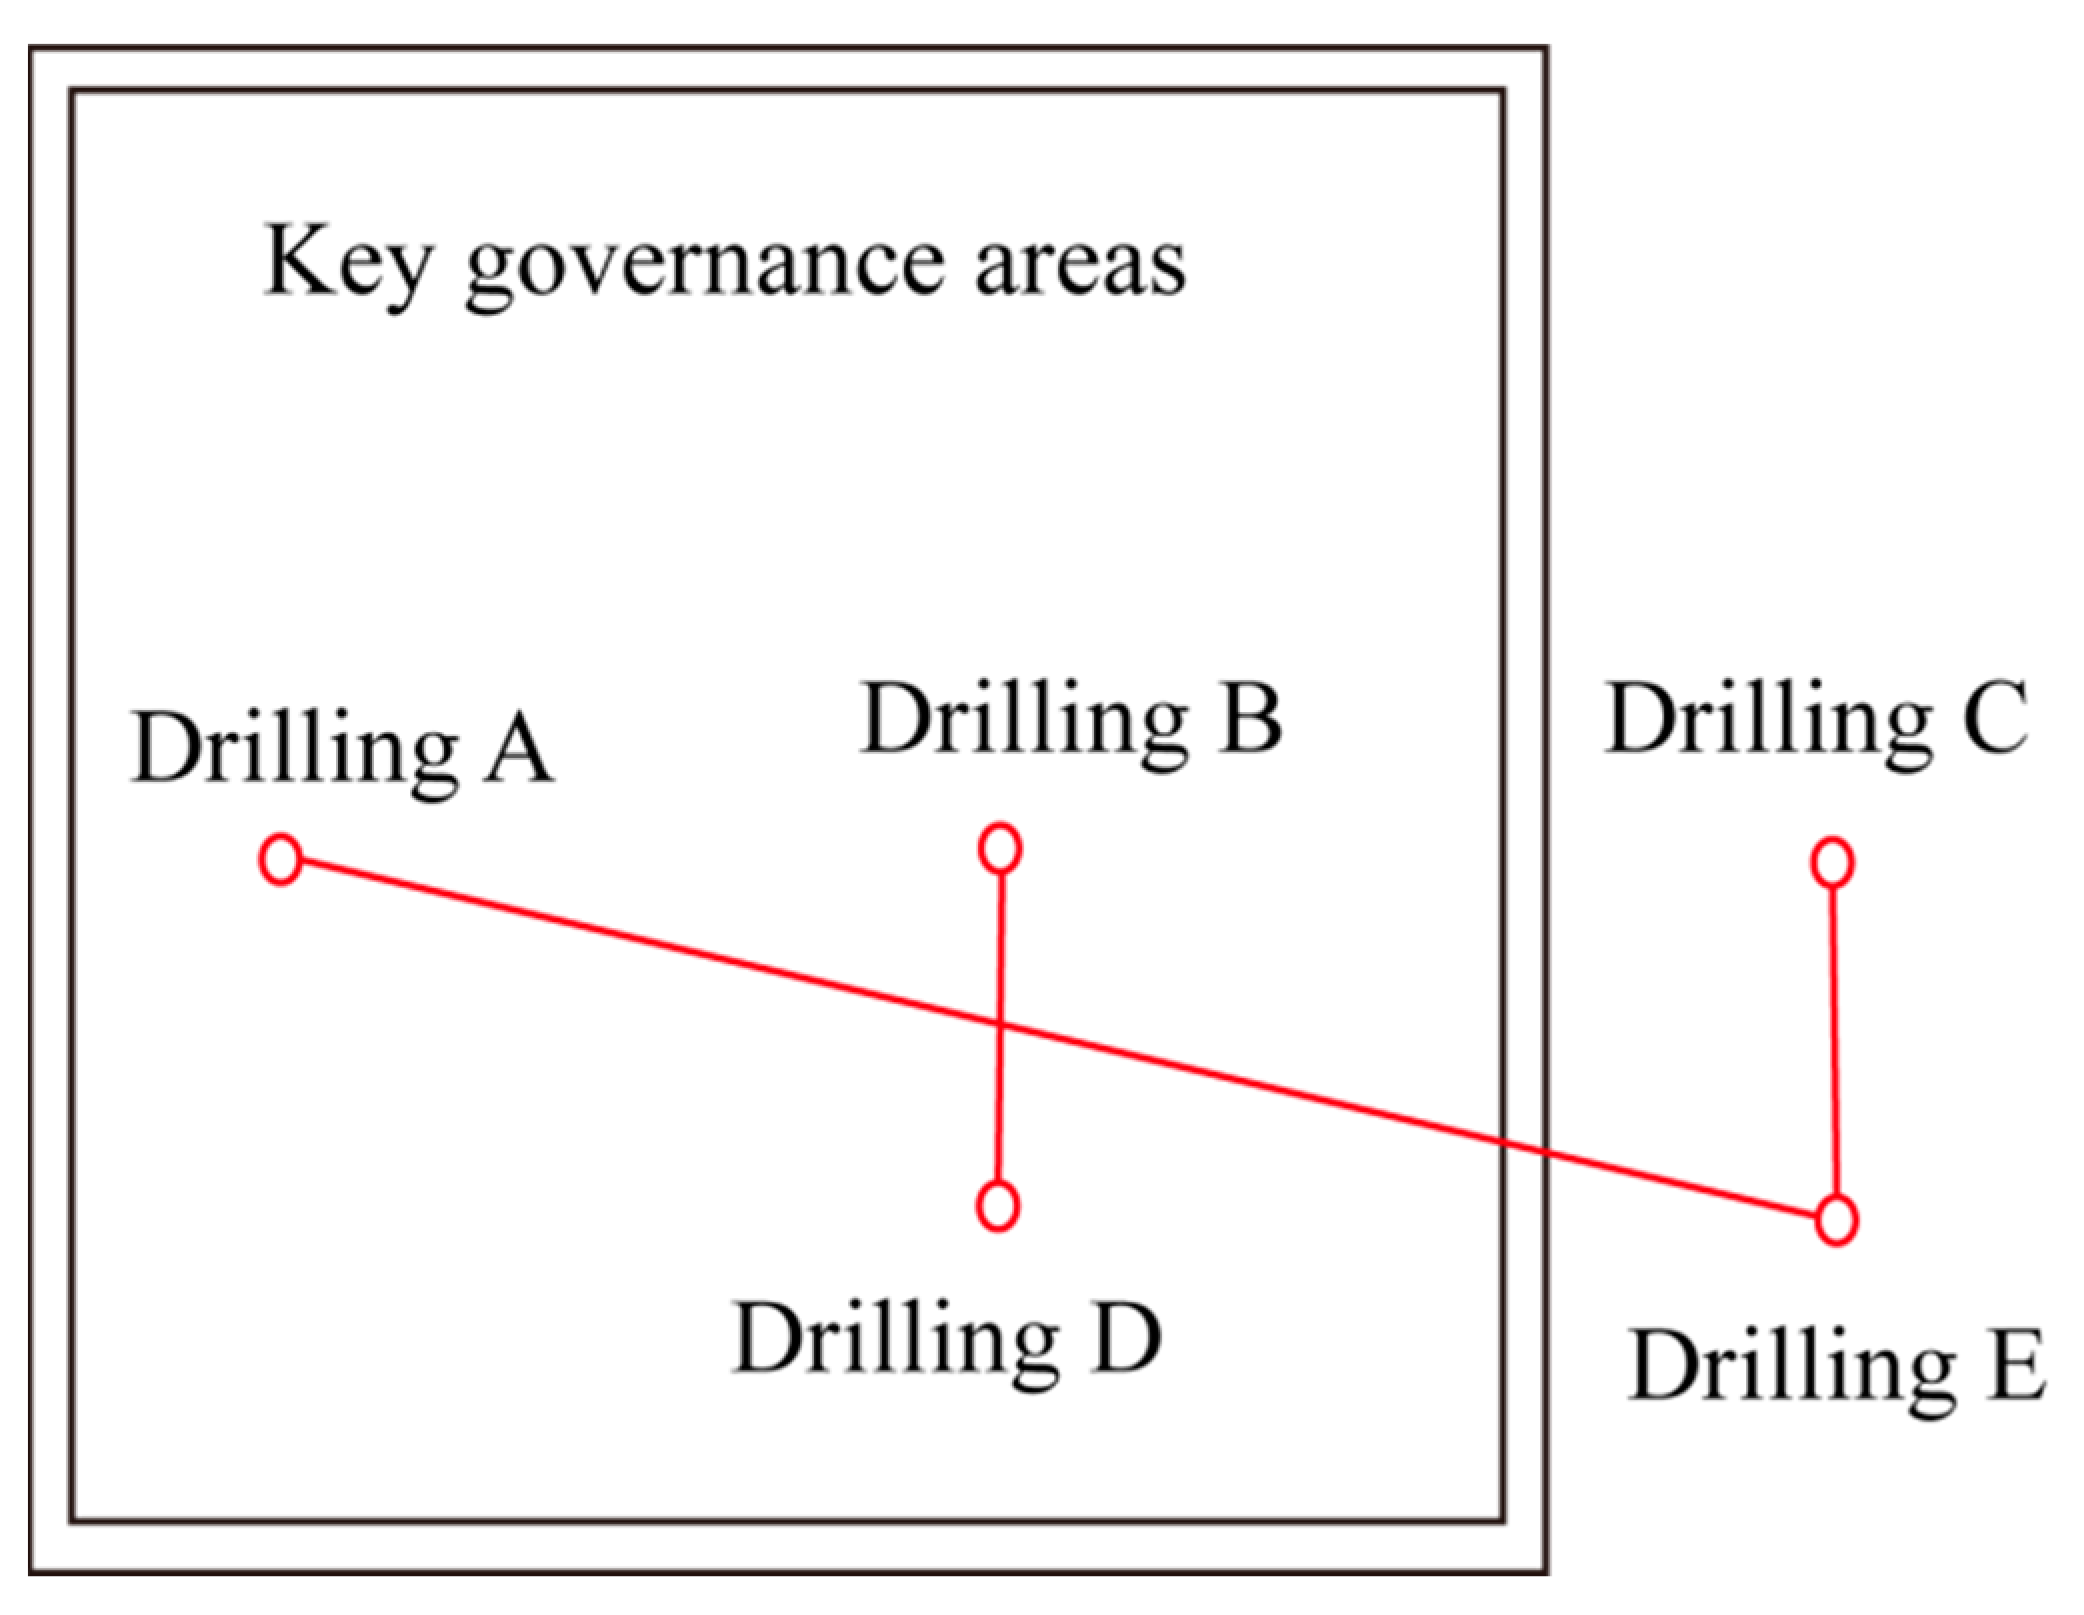
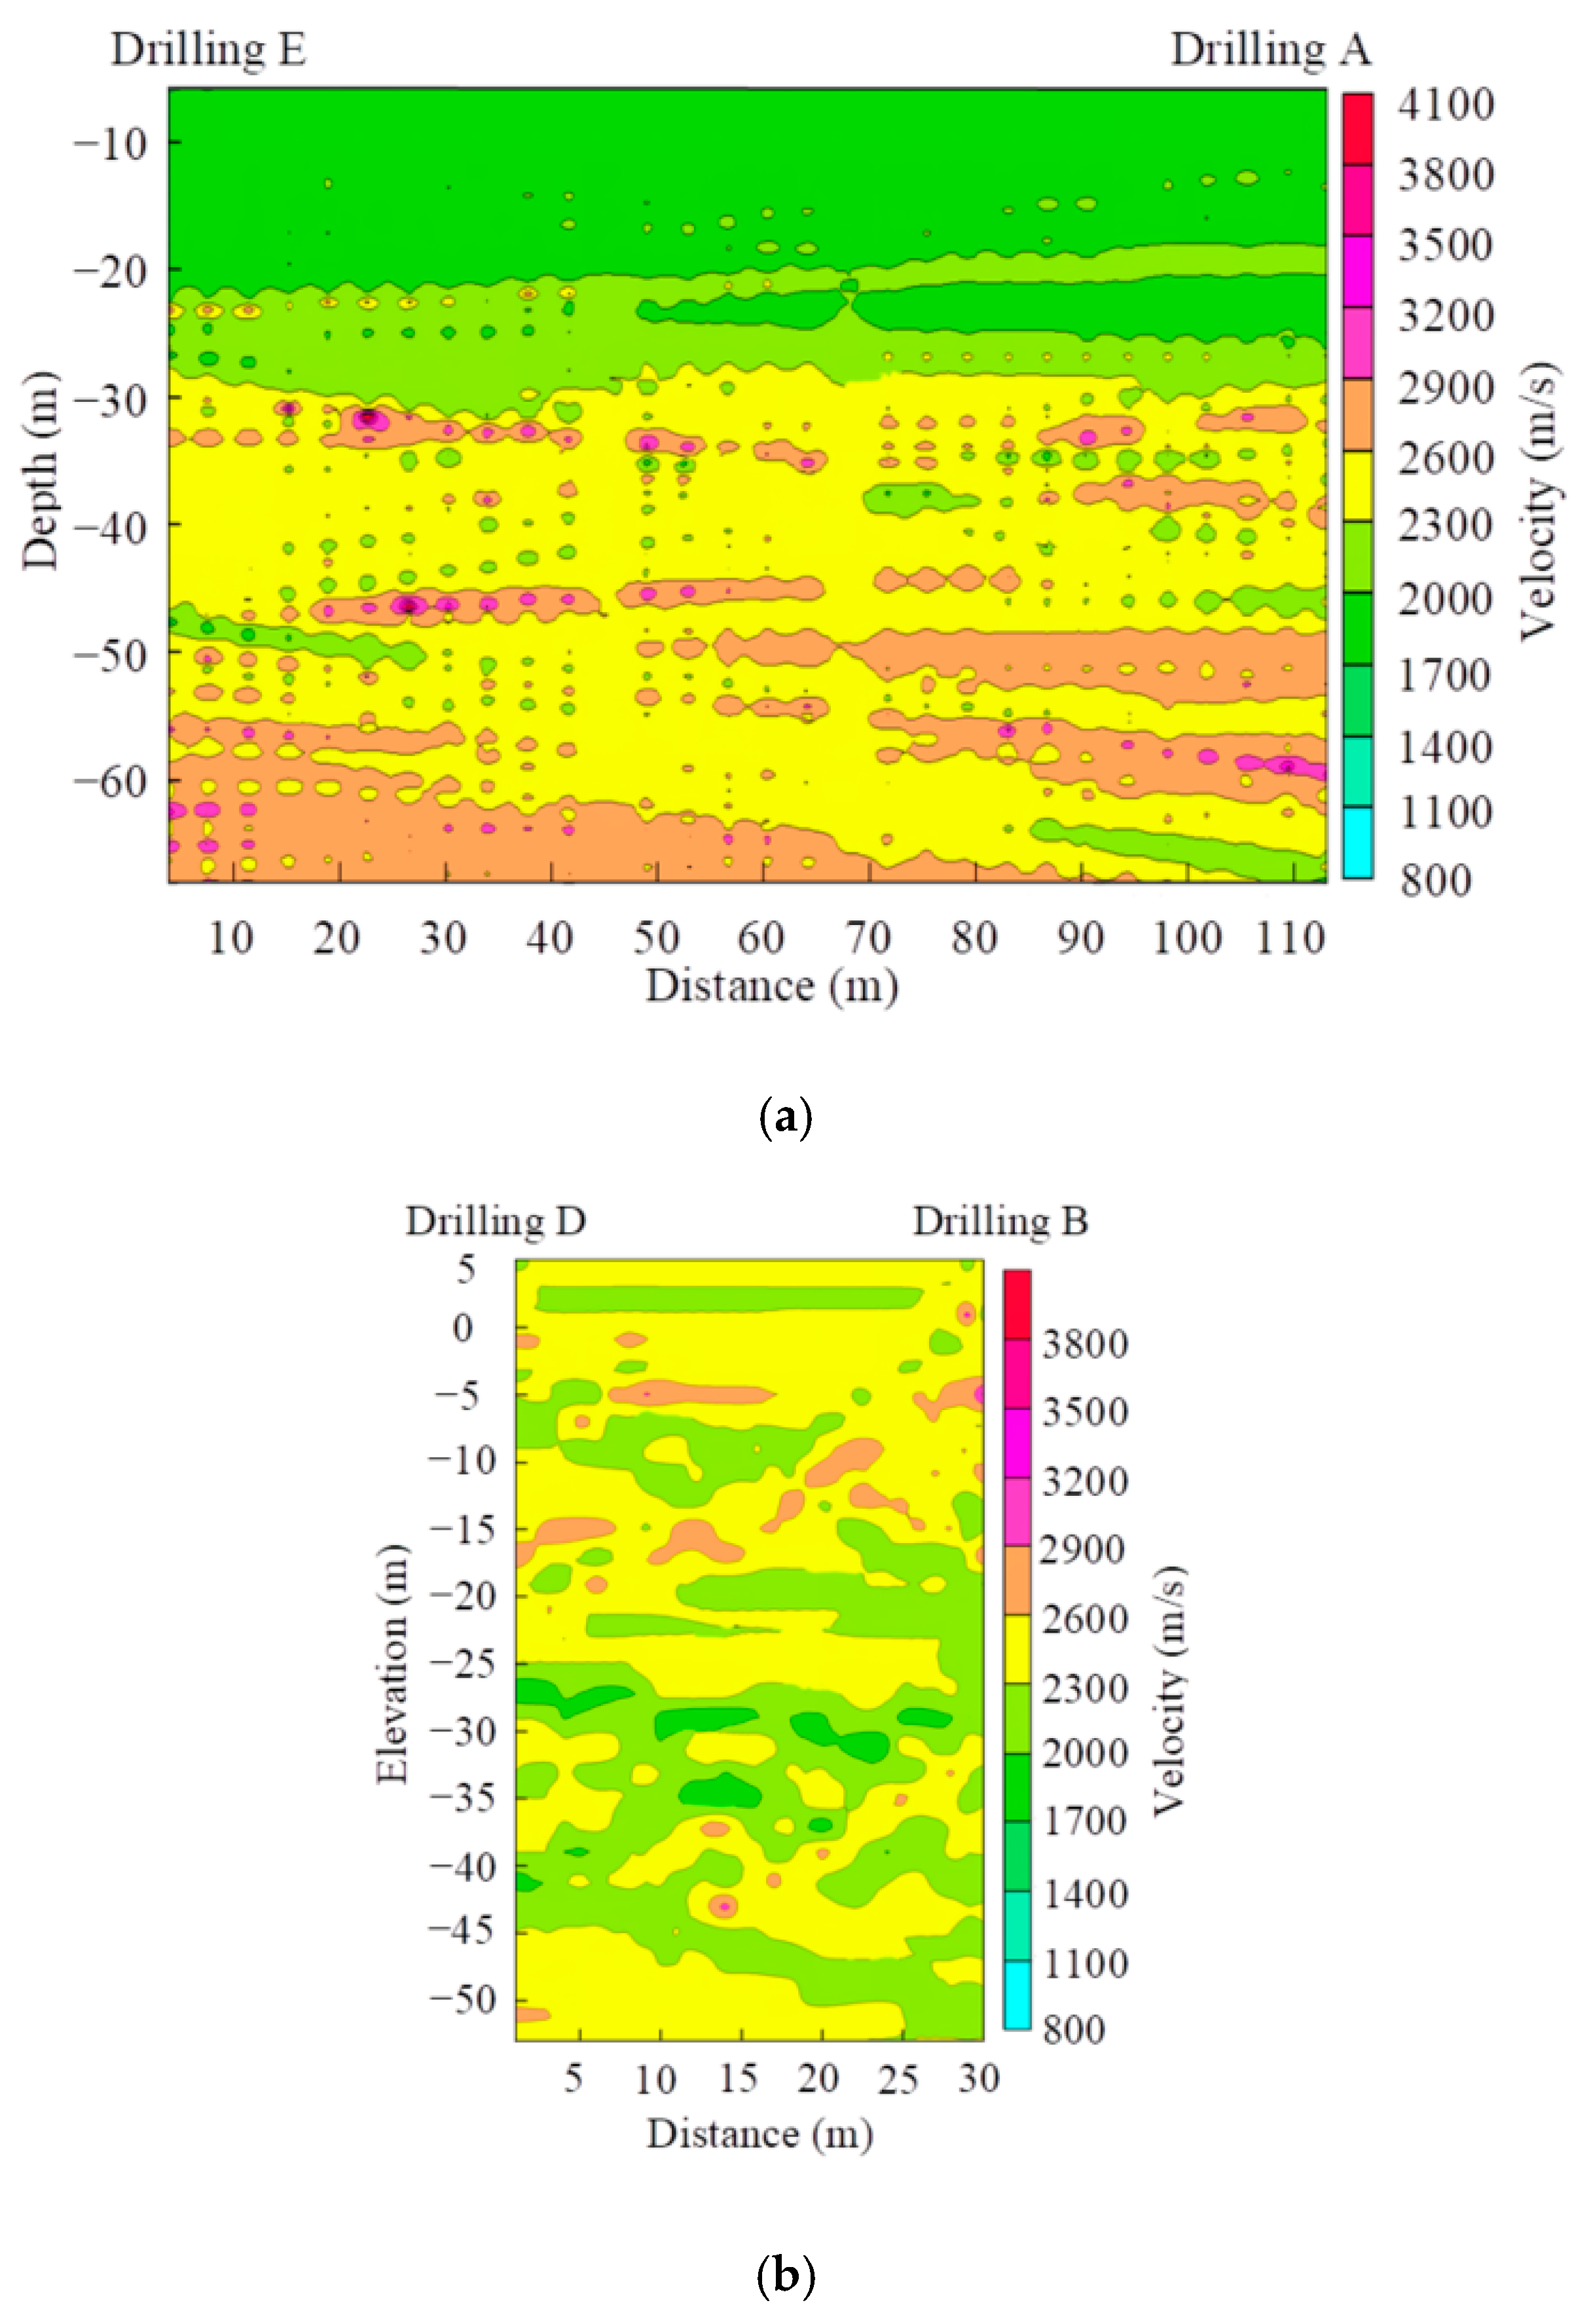
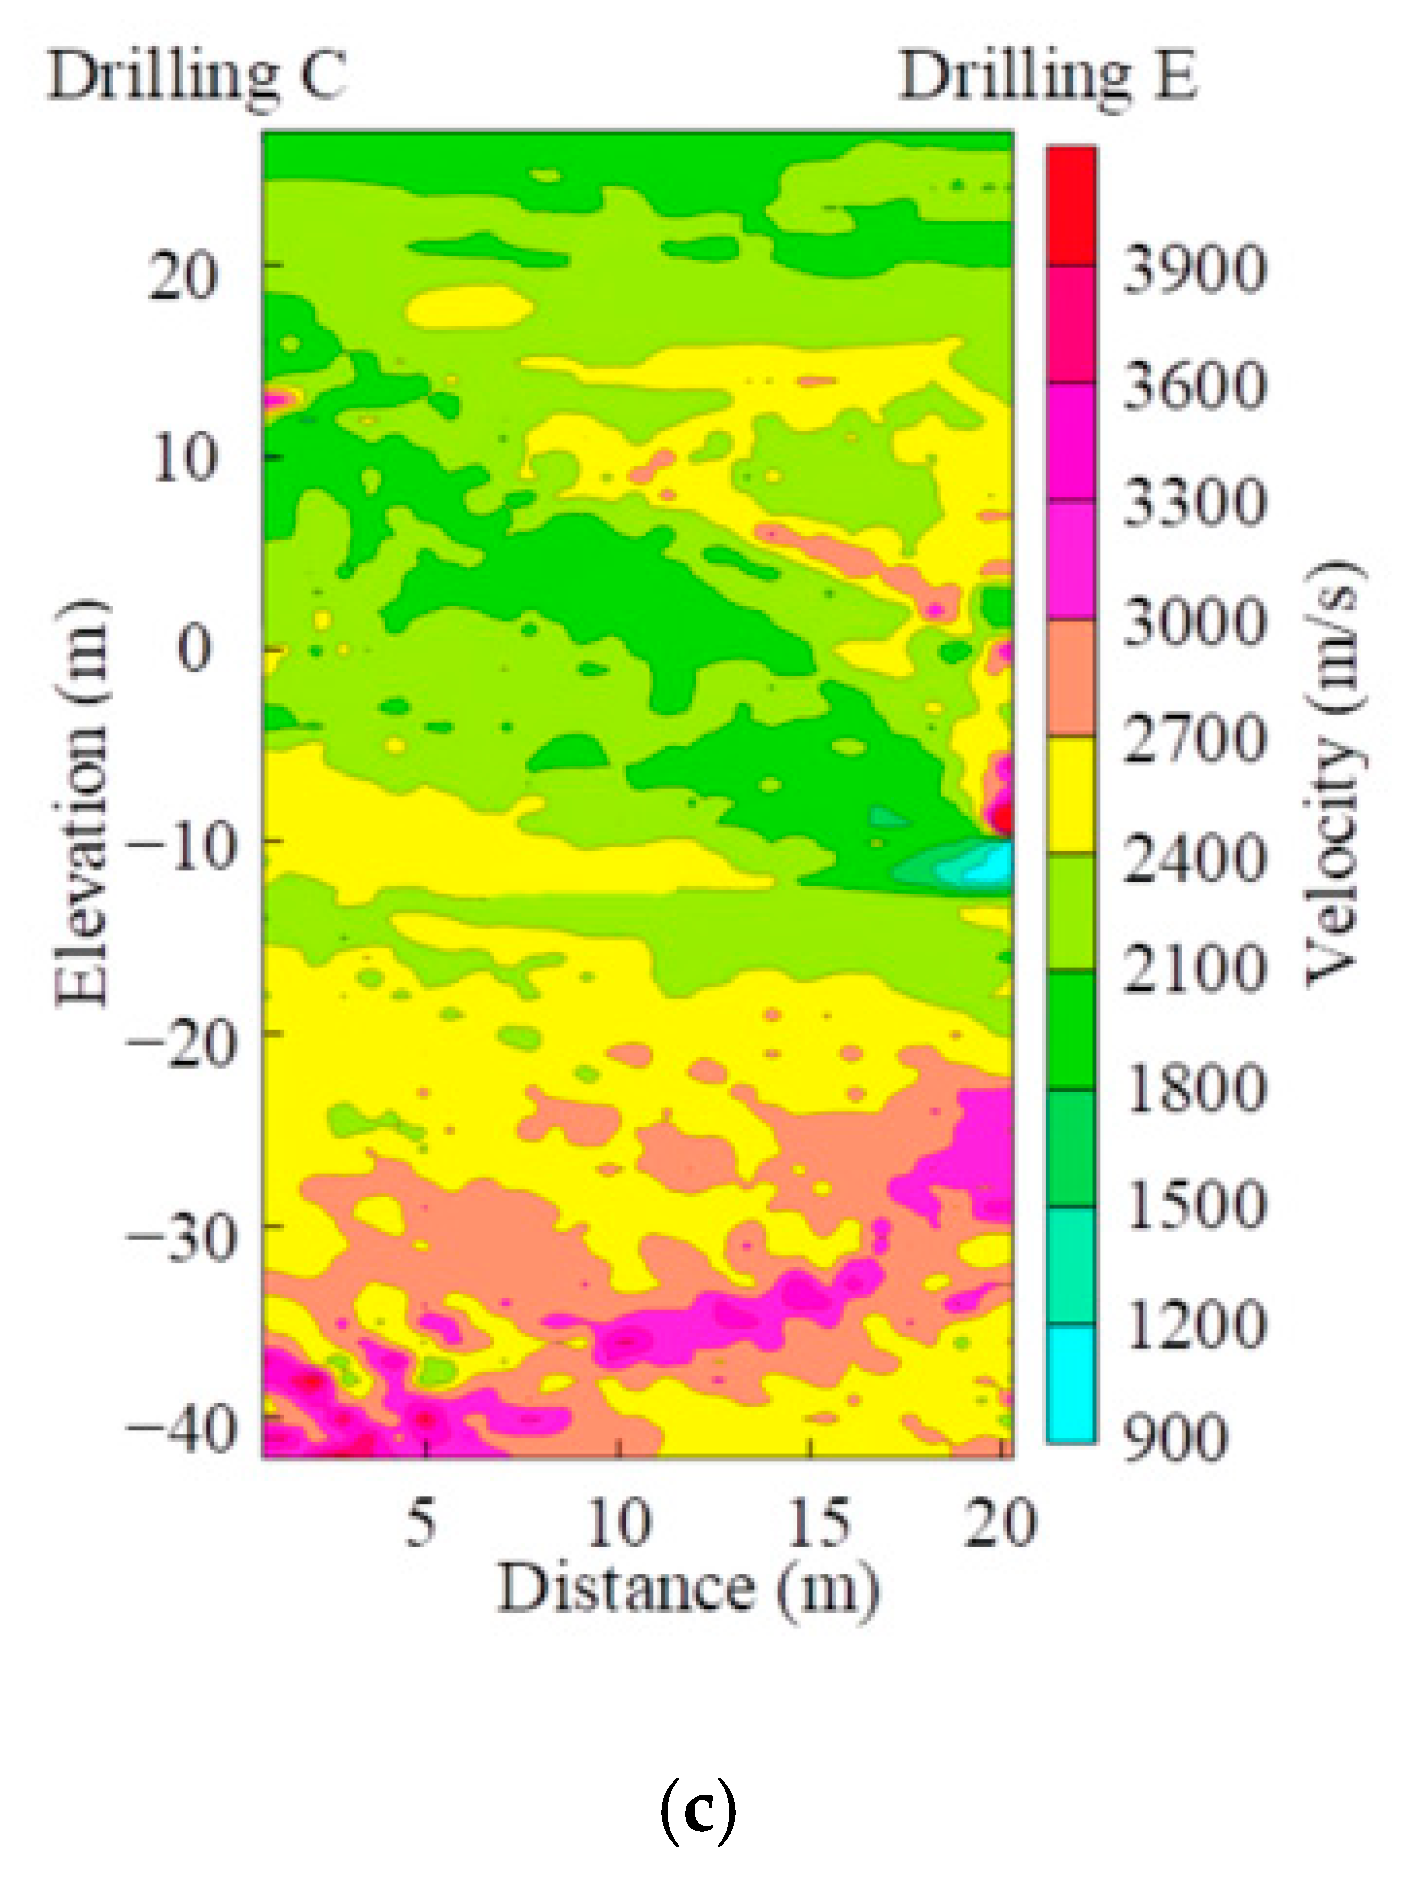
A total of three cross-hole CT detection profiles were designed for the scale detection of the newly built railway disease, and the location of detection profiles is shown in Figure 18. A DC-controlled sparker source transmitter and 24-bit acoustic wave detector receiver are used, and the transmitter and receiver are located in the CT detection hole. Profile E-A is a 120 m span profile and 20° oblique across the railway. Profile D-B and profile E-C are 21 m span profiles, which are perpendicular to the railway. The results of CT tomography are shown in Figure 19.
It can be seen from Figure 19a that the average P-wave velocity of the rock mass in the E-A profile is 2312 m/s. The minimum P-wave velocity of the rock mass is 1385 m/s, and the maximum P-wave velocity of the rock mass is 4242 m/s. In the profile, the wave velocity of the rock mass in the upper part is generally smaller than that in the lower part. The bedrock surface is between −28 m and −22 m above altitude. The upper part of the bedrock surface is composed of quaternary silty clay and completely weathered sand mudstone, which are distributed evenly without any loose abnormal cavity. The lower part is weakly weathered argillaceous sandstone, and there are local low-speed abnormal areas, which are speculated to be the collapse area of abandoned coal mines. It can be seen from Figure 19b that the average P-wave velocity of the rock mass in the D-B profile is 2332 m/s. The minimum and maximum P-wave velocities of the rock mass are 1698 m/s and 3294 m/s, respectively. The bedrock surface of the D-B profile is not obvious, which is seriously affected by the collapse of abandoned coal mines, and the low-speed abnormal loose area is widely distributed. Therefore, in the construction of the new railway, it needs to be treated as a key area. It can be seen from Figure 19c that the average P-wave velocity of the rock mass in the E-C profile is 2426 m/s. The minimum and maximum P-wave velocities of the rock mass are 1365 m/s and 4103 m/s, respectively. In general, the wave velocity of the upper layer is smaller than that of the lower layer. The bedrock surface is located at about −25 m altitude. The upper part is composed of quaternary silty clay and completely weathered sandstone mudstone, which are evenly distributed, and no loose abnormal cavities are found. The lower part is weakly weathered argillaceous sandstone, and there is no low-velocity abnormal area. Therefore, it can be treated as a non-key area in the construction of new railways.

5. Discussion

Aiming at the problems of short detection range, poor accuracy and low efficiency in cross-hole acoustic CT detection, a long-distance cross-hole acoustic detection method is proposed in this paper. The feasibility of this technology in detecting bad geological conditions is verified by the indoor concrete model test. In addition, the application of this technology in the detection of the tunnel-surrounding rock grouting effect, high-rise buildings and subgrade can effectively reflect the information of slurry distribution and stratum distribution in the detection area. It is verified that the technology can quickly and accurately detect the hidden adverse geological danger of complex rock soil mass. However, the accuracy of cross-hole acoustic detection technology and the limitations of data inversion methods need to be discussed as follows:
(a)
In the indoor concrete model test, the acoustic CT detection can directly and vividly reflect the existence of large-sized cavity disease through the distribution of P-wave velocity on the model profile. Due to the limitation of test conditions, the size of cavity disease and the spacing of measuring points in the model made are large so that the disease and its location can be found accurately during the test. However, for the determination of the location, shape and size of the diseases with smaller size, more detailed information is needed, such as the use of smaller measuring point spacing for detection.
(b)
In order to reduce the impact of size error, location error, detection target and surrounding environment on the propagation wave velocity, and to ensure the detection accuracy of cross-hole acoustic CT in practical engineering, the source should be selected in combination with the actual situation of the detection area. Stratum lithology should be comprehensively considered in the layout of survey lines and spacing of drillings. In addition, the circulating noise of groundwater and the quality of data collected by geophones in receiving boreholes are the main sources of the test results and the practice errors.
(c)
High-resolution detection is of great significance for determining the bearing stratum of a deep foundation. In order to improve the prediction resolution, it is necessary to compress the continuance of the seismic wavelet. The research on “wavelet removal” and “deconvolution” technology can further improve the resolution ability of long-range cross-hole acoustic technology in the detection of karst caves, concrete cracks and other areas.
(d)
Although long-range cross-hole acoustic detection has the advantages of high frequency, short residual vibration and large power, the data processing and inversion algorithms are immature and subjective. In the future, research on data inversion algorithms, such as the full-wave inversion algorithm in the time domain and frequency domain based on the iterative mismatched construction of the objective function, shows good prospects in shallow acoustic data inversion.

6. Conclusions

In this paper, a long-range cross-hole acoustic detection technology is introduced. The indoor concrete model test and geotechnical engineering field test were carried out by the method of combining application and improvement. Some main conclusions can be drawn:
(1)
According to the different characteristics of acoustic wave velocity propagation in rock and soil layer, a long-range cross-hole acoustic detection method suitable for engineering geological exploration and disease detection is proposed by comprehensively using a spark source and data acquisition device. The bending ray tracing technique and the full-wave data inversion algorithm adopted in this method realize the optimal path of wave velocity CT tomography and improve the accuracy and resolution of CT imaging.
(2)
Tunnel-surrounding rock grouting detection shows that the grouting effect is better in a small area of tunnel lining. However, the slurry in the deep tunnel-surrounding rock shows a strong dispersion, which does not achieve the expected grouting effect. In order to ensure construction safety, the measures of strong support, short footage and reasonable grouting slurry should be taken during the excavation of the face.
(3)
The detection of the foundation of high-rise buildings shows that the distribution uniformity of most soil layers is good, and there are partially empty karst caves and semi-filled karst caves. Therefore, it is suggested to take the soil layer with well distributed uniformity and poor development condition as the pile-foundation-bearing layer in the high-rise buildings. The safety thickness should be reserved for the soil layer and checking the stability.
(4)
The detection of road subgrade shows that the abnormal wave velocity areas are mainly in the goaf and subsidence area, and the upper wave velocity is smaller than the lower wave velocity distribution characteristics. Therefore, it is suggested to take the loose area, goaf and subsidence area with abnormal wave velocity and unobvious bedrock surface as key construction sections. The road sections with normal and uniform wave speed distribution can be treated as non-key road sections.

Author Contributions

L.D.: Conceptualization, Methodology, Writing—original draft. J.C.: Data curation, Software. D.S.: Writing—review & editing. M.L. and C.W.: Supervision, Writing—review. X.L.: Funding acquisition, Resources, Validation, Writing—review & editing. E.W.: Supervision, Writing—review. All authors have read and agreed to the published version of the manuscript.

Funding

Supported by the National Natural Science Foundation of China (52109125 and 52090081), the independent research project of State key Laboratory of Hydroscience and Engineering (2022-KY-02), the Open Research Fund of SINOPEC Key Laboratory of Geophysics (WX2021-01-12), the China Postdoctoral Science Foundation (2020M680583), the National Postdoctoral Program for Innovative Talent of China (BX20200191) and the Natural Science Foundation of Jiangsu Province (BK20130481).

Institutional Review Board Statement

Not applicable.

Informed Consent Statement

Not applicable.

Data Availability Statement

The data used to support the findings of this study are available from the corresponding author upon request.

Conflicts of Interest

The authors declare that they have no known competing financial interests or personal relationships that could have appeared to influence the work reported in this paper.

References

  1. She, S.G.; Lin, P. Some developments and challenging issues in rock engineering field in China. Chin. J. Rock Mech. Eng. 2014, 33, 433–457. [Google Scholar]
  2. Dong, L.J.; Pei, Z.W.; Xie, X.; Zhang, Y.H.; Yan, X.H. Early identification of abnormal regions in rock-mass using traveltime tomography. Engineering 2022, in press. [Google Scholar] [CrossRef]
  3. Lai, W.W.-L.; Derobert, X.; Annan, P. A review of ground penetrating radar application in civil engineering: A 30-year journey from locating and testing to imaging and diagnosis. NDT E Int. 2018, 96, 58–78. [Google Scholar]
  4. Yan, S.; Xue, G.Q.; Qiu, W.Z.; Li, H.; Zhong, H.S. Feasibility of central loop TEM method for prospecting multilayer water-filled goaf. Appl. Geophys. 2016, 13, 587–597. [Google Scholar] [CrossRef]
  5. Li, S.C.; Liu, B.; Xu, X.J.; Nie, L.C.; Liu, Z.Y.; Song, J.; Sun, H.F.; Chen, L.; Fan, K.R. An overview of ahead geological prospecting in tunneling. Tunn. Undergr. Space Technol. 2017, 63, 69–94. [Google Scholar] [CrossRef]
  6. Ma, J.; Dong, L.J.; Zhao, G.Y.; Li, X.B. Discrimination of seismic sources in an underground mine using full waveform inversion. Int. J. Rock Mech. Min. Sci. 2018, 106, 213–222. [Google Scholar] [CrossRef]
  7. Song, D.Q.; Liu, X.L.; Huang, J.; Zhang, J.M. Energy-based analysis of seismic failure mechanism of a rock slope with discontinuities using Hilbert-Huang Transform and Marginal Spectrum in the time-frequency domain. Landslides 2021, 18, 105–123. [Google Scholar] [CrossRef]
  8. Hasan, M.; Shang, Y.J.; Jin, W.J. Delineation of weathered/fracture zones for aquifer potential using an integrated geophysical approach: A case study from South China. J. Appl. Geophys. 2018, 157, 47–60. [Google Scholar] [CrossRef]
  9. Song, D.Q.; Liu, X.L.; Huang, J.; Zhang, Y.F.; Zhang, J.M.; Nkwenti, B.N. Seismic cumulative failure effects on a reservoir bank slope with a complex geological structure considering plastic deformation characteristics using shaking table tests. Eng. Geol. 2021, 286, 106085. [Google Scholar] [CrossRef]
  10. Amanatidou, E.; Vargemezis, G.; Tsourlos, P. Combined application of seismic and electrical geophysical methods for karst cavities detection: A case study at the campus of the new University of Western Macedonia, Kozani, Greece. J. Appl. Geophys. 2022, 196, 104499. [Google Scholar] [CrossRef]
  11. Dong, Q.Y.; Cheng, J.L.; Li, F.; Xue, J.J.; Dong, Y.; Wen, L.F. Fine detection of water-bearing collapse column based on information fusion of seismic exploration and TEM. J. Appl. Geophys. 2022, 206, 104806. [Google Scholar] [CrossRef]
  12. Xie, L.Y.; Xia, Z.H.; Xue, S.T.; Fu, X.L. Detection of setting time during cement hydration using ground penetrating radar. J. Build. Eng. 2022, 60, 105166. [Google Scholar] [CrossRef]
  13. Hasan, M.; Shang, Y.J. Hard-rock investigation using a non-invasive geophysical approach. J. Appl. Geophys. 2018, 206, 104808. [Google Scholar] [CrossRef]
  14. Lin, F.; Chen, S.G.; Ma, G.M. Transient electromagnetic detection method in water-sealed underground storage caverns. Undergr. Space 2016, 1, 44–61. [Google Scholar] [CrossRef] [Green Version]
  15. Sun, F.H.; Wang, J.X.; Ma, C.Y.; Li, W.H.; Zhang, F.K.; Fan, K.R. Cross-hole radar fractures detection of tunnel side wall based on full waveform inversion and reverse time igration. Geotech. Geol. Eng. 2022, 40, 1225–1236. [Google Scholar] [CrossRef]
  16. Ye, Z.J.; Ye, Y. Comparison of detection effect of cavities behind shield tunnel segment using transient electromagnetic radar and ground penetration radar. Geotech. Geol. Eng. 2019, 37, 4391–4403. [Google Scholar] [CrossRef]
  17. Liu, L.; Shi, Z.M.; Peng, M.; Tsoflias, G.P.; Liu, C.C.; Tao, F.J.; Liu, C.S. A borehole multifrequency acoustic wave system for karst detection near piles. J. Appl. Geophys. 2020, 177, 104051. [Google Scholar] [CrossRef]
  18. Payan, M.; Khoshghalb, A.; Senetakis, K.; Khalili, N. Small-strain stiffness of sand subjected to stress anisotropy. Soil Dyn. Earthq. Eng. 2016, 88, 143–151. [Google Scholar] [CrossRef]
  19. Payan, M.; Senetakis, K.; Khoshghalb, A.; Khalili, N. Characterization of the small-strain dynamic behaviour of silty sands; contribution of silica non-plastic fines content. Soil Dyn. Earthq. Eng. 2017, 102, 232–240. [Google Scholar] [CrossRef]
  20. Ma, J.J.; Guan, J.W.; Gui, Y.L.; Huang, L.C. Anisotropic bounding surface plasticity model for porous media. Int. J. Geomech. 2021, 21, 04021033. [Google Scholar] [CrossRef]
  21. Ma, J.J.; Zhao, G.F.; Khalili, N. A fully coupled flow deformation model for elasto-plastic damage analysis in saturated fractured porous media. Int. J. Plast. 2016, 76, 29–50. [Google Scholar] [CrossRef]
  22. Ma, J.J. Wetting collapse analysis on partially saturated oil chalks by a modified cam clay model based on effective stress. J. Pet. Sci. Eng. 2018, 167, 44–53. [Google Scholar] [CrossRef]
  23. Duan, C.L.; Yan, C.H.; Xu, B.T.; Zhou, Y.K. Crosshole seismic CT data field experiments and interpretation for karst caves in deep foundations. Eng. Geol. 2017, 228, 180–196. [Google Scholar] [CrossRef]
  24. Yue, H.Y.; Zhang, B.W.; Wang, K.; Wang, D.Y.; Wang, G.K.; Wang, X.J.; Zhang, K.; Li, J.L. A towed-type shallow high-resolution seismic detection system for coastal tidal flats and its application in Eastern China. J. Geophys. Eng. 2020, 17, 967–979. [Google Scholar] [CrossRef]
  25. Ding, Y.S.; Hu, H.; Malallah, A.; Fehler, M.C.; Huang, L.J.; Malehmir, A.; Zheng, Y.C. Mapping subsurface karsts and voids using directional elastic wave packets. Geophysics 2021, 86, S405–S416. [Google Scholar] [CrossRef]
  26. Kanda, Y. Well-to-well seismic measurements. J. Jpn. Soc. Eng. Geol. 1973, 14, 159–168. [Google Scholar] [CrossRef]
  27. Moser, T.J. Shortest path calculation of seismic rays. Geophysics 1991, 56, 59–67. [Google Scholar] [CrossRef]
  28. Duan, Y.; Luo, X.; Si, G.Y.; Canbulat, I. Seismic source location using the shortest path method based on boundary discretisation scheme for microseismic monitoring in underground mines. Int. J. Rock Mech. Min. Sci. 2021, 149, 104982. [Google Scholar] [CrossRef]
  29. Hu, L.Z.; McMechan, G.A.; Harris, J.M. Acoustic prestack migration of cross-hole data. Geophysics 1988, 53, 1015–1023. [Google Scholar] [CrossRef]
  30. Chen, J.; Wang, H.; Song, D.Q.; Ge, X.R. A frequency-domain full waveform inversion method of elastic waves in quantitative defection investigation. Indian J. Geo-Mar. Sci. 2019, 48, 739–746. [Google Scholar]
  31. Vanderkruk, J.; Gueting, N.; Klotzsche, A.; He, G.W.; Rudolph, S.; Vonhebel, C.; Yang, X.; Weihermuller, L.; Mester, A.; Vereecken, H. Quantitative multi-layer electromagnetic induction inversion and full-waveform inversion of crosshole ground penetrating radar data. J. Earth Sci. 2015, 26, 844–850. [Google Scholar] [CrossRef]
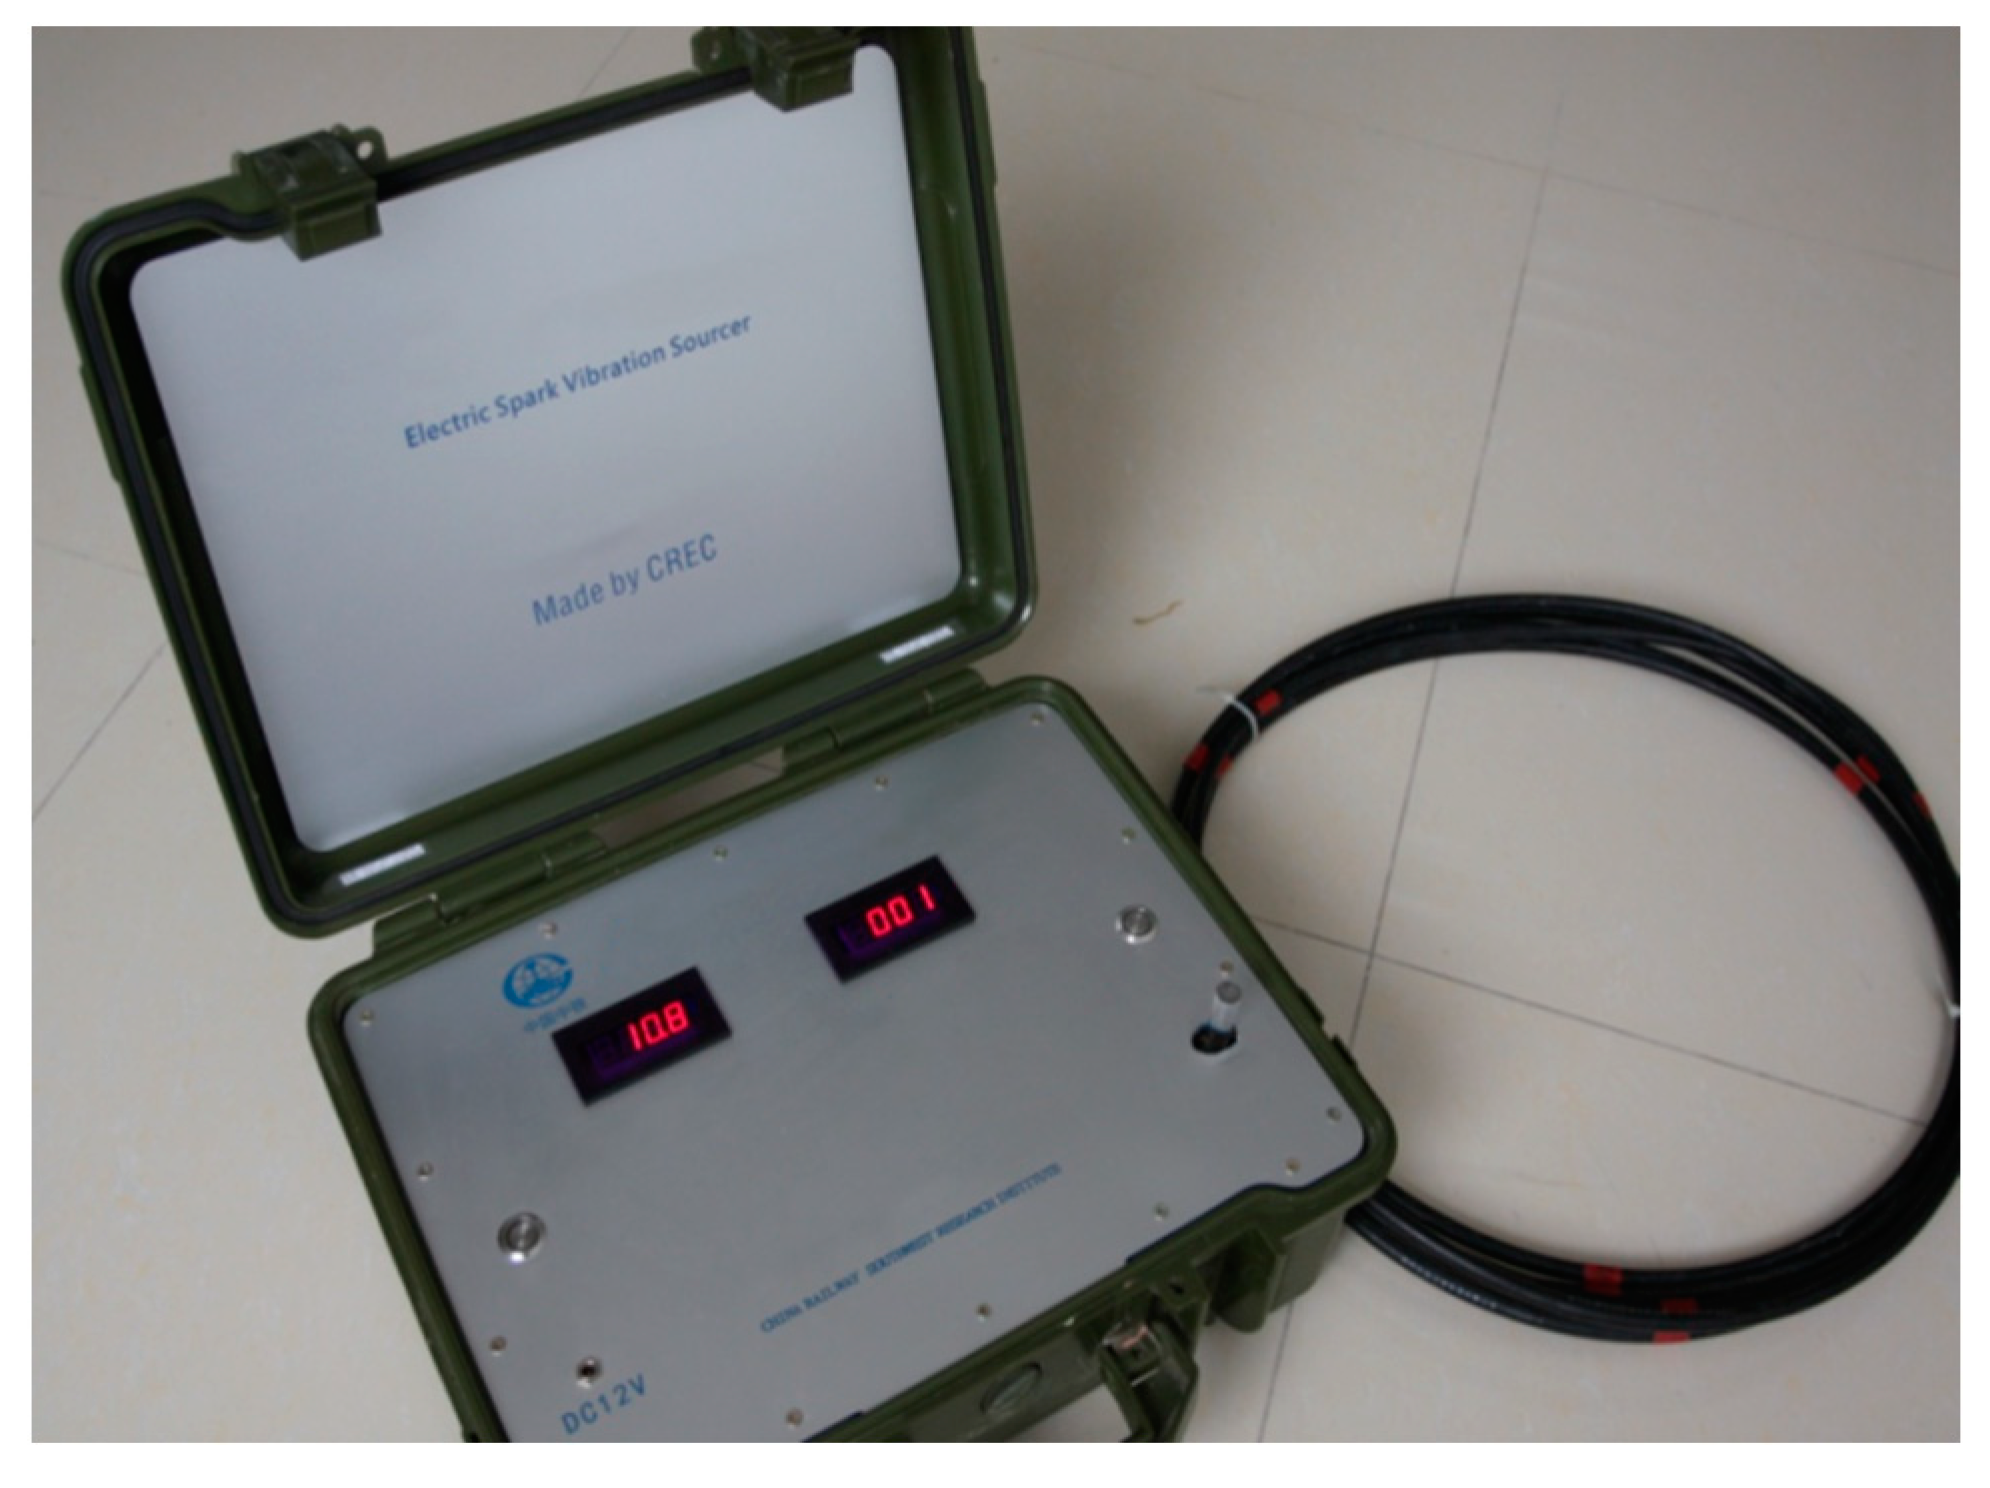
Figure 1. The large-energy controllable sparker source generator.
Sustainability 14 16947 g001
Figure 2. The piezoelectric geophone: (a) core body structure; (b) bending-torsion piezoelectric detectors.
Sustainability 14 16947 g002
Figure 3. One transmitter and multiple receivers’ data collection mode.
Sustainability 14 16947 g003
Figure 4. Grid points of the cell.
Sustainability 14 16947 g004
Figure 5. The principle of full-waveform inversion.
Sustainability 14 16947 g005
Figure 6. CT full-waveform inversion wave field diagram. (a) 17.5 ns; (b) 23.5 ns; (c) 29.5 ns.
Sustainability 14 16947 g006aSustainability 14 16947 g006b
Figure 7. Results of CT full-waveform inversion information gridding.
Sustainability 14 16947 g007
Figure 8. The test model of concrete.
Sustainability 14 16947 g008
Figure 9. The acoustic CT test layout.
Sustainability 14 16947 g009
Figure 10. The CT test unit and fluoroscopic ray distribution.
Sustainability 14 16947 g010
Figure 11. The distribution of wave velocity of indoor concrete model.
Sustainability 14 16947 g011
Figure 12. Field collection test.
Sustainability 14 16947 g012
Figure 13. The three-dimensional contour map of wave velocity: (a) Profile 1; (b) Profile 2; (c) Profile 3; (d) Profile 4.
Sustainability 14 16947 g013aSustainability 14 16947 g013b
Figure 14. Monitoring site and equipment.
Sustainability 14 16947 g014
Figure 15. The survey line and drilling layout.
Sustainability 14 16947 g015
Figure 16. The three-dimensional contour map of wave velocity of partial profiles: (a) Profile A–E; (b) Profile L–O.
Sustainability 14 16947 g016
Figure 17. The regional geological profile.
Sustainability 14 16947 g017
Figure 18. Location of CT detection profile of a railway disease.
Sustainability 14 16947 g018
Figure 19. The results of CT tomography: (a) Profile E-A; (b) Profile D-B; (c) Profile C-E.
Sustainability 14 16947 g019aSustainability 14 16947 g019b
Table 1. Wave velocities of different rock and soil.
NameWave Velocities (m/s)
Silty clay1200~2500
Sandy clay300~900
Sandstone2400~4200
Conglomerate1600~4200
Argillaceous limestone2000~4400
Granite4500~6500
Publisher’s Note: MDPI stays neutral with regard to jurisdictional claims in published maps and institutional affiliations.