Study on Identification and Prevention of Traffic Congestion Zones Considering Resilience-Vulnerability of Urban Transportation Systems
Abstract
1. Introduction
1.1. Background
1.2. Literature Review
1.2.1. Machine Learning Algorithms Related to Traffic Zoning
1.2.2. Research on Traffic Congestion Influencing Factors and Prediction Models
1.2.3. Distribution Patterns of Spatial and Temporal Characteristics of Traffic Congestion
1.2.4. Traffic Congestion Evaluation Index and System Optimization Method
1.3. Objective
2. Study Area and Research Methodology
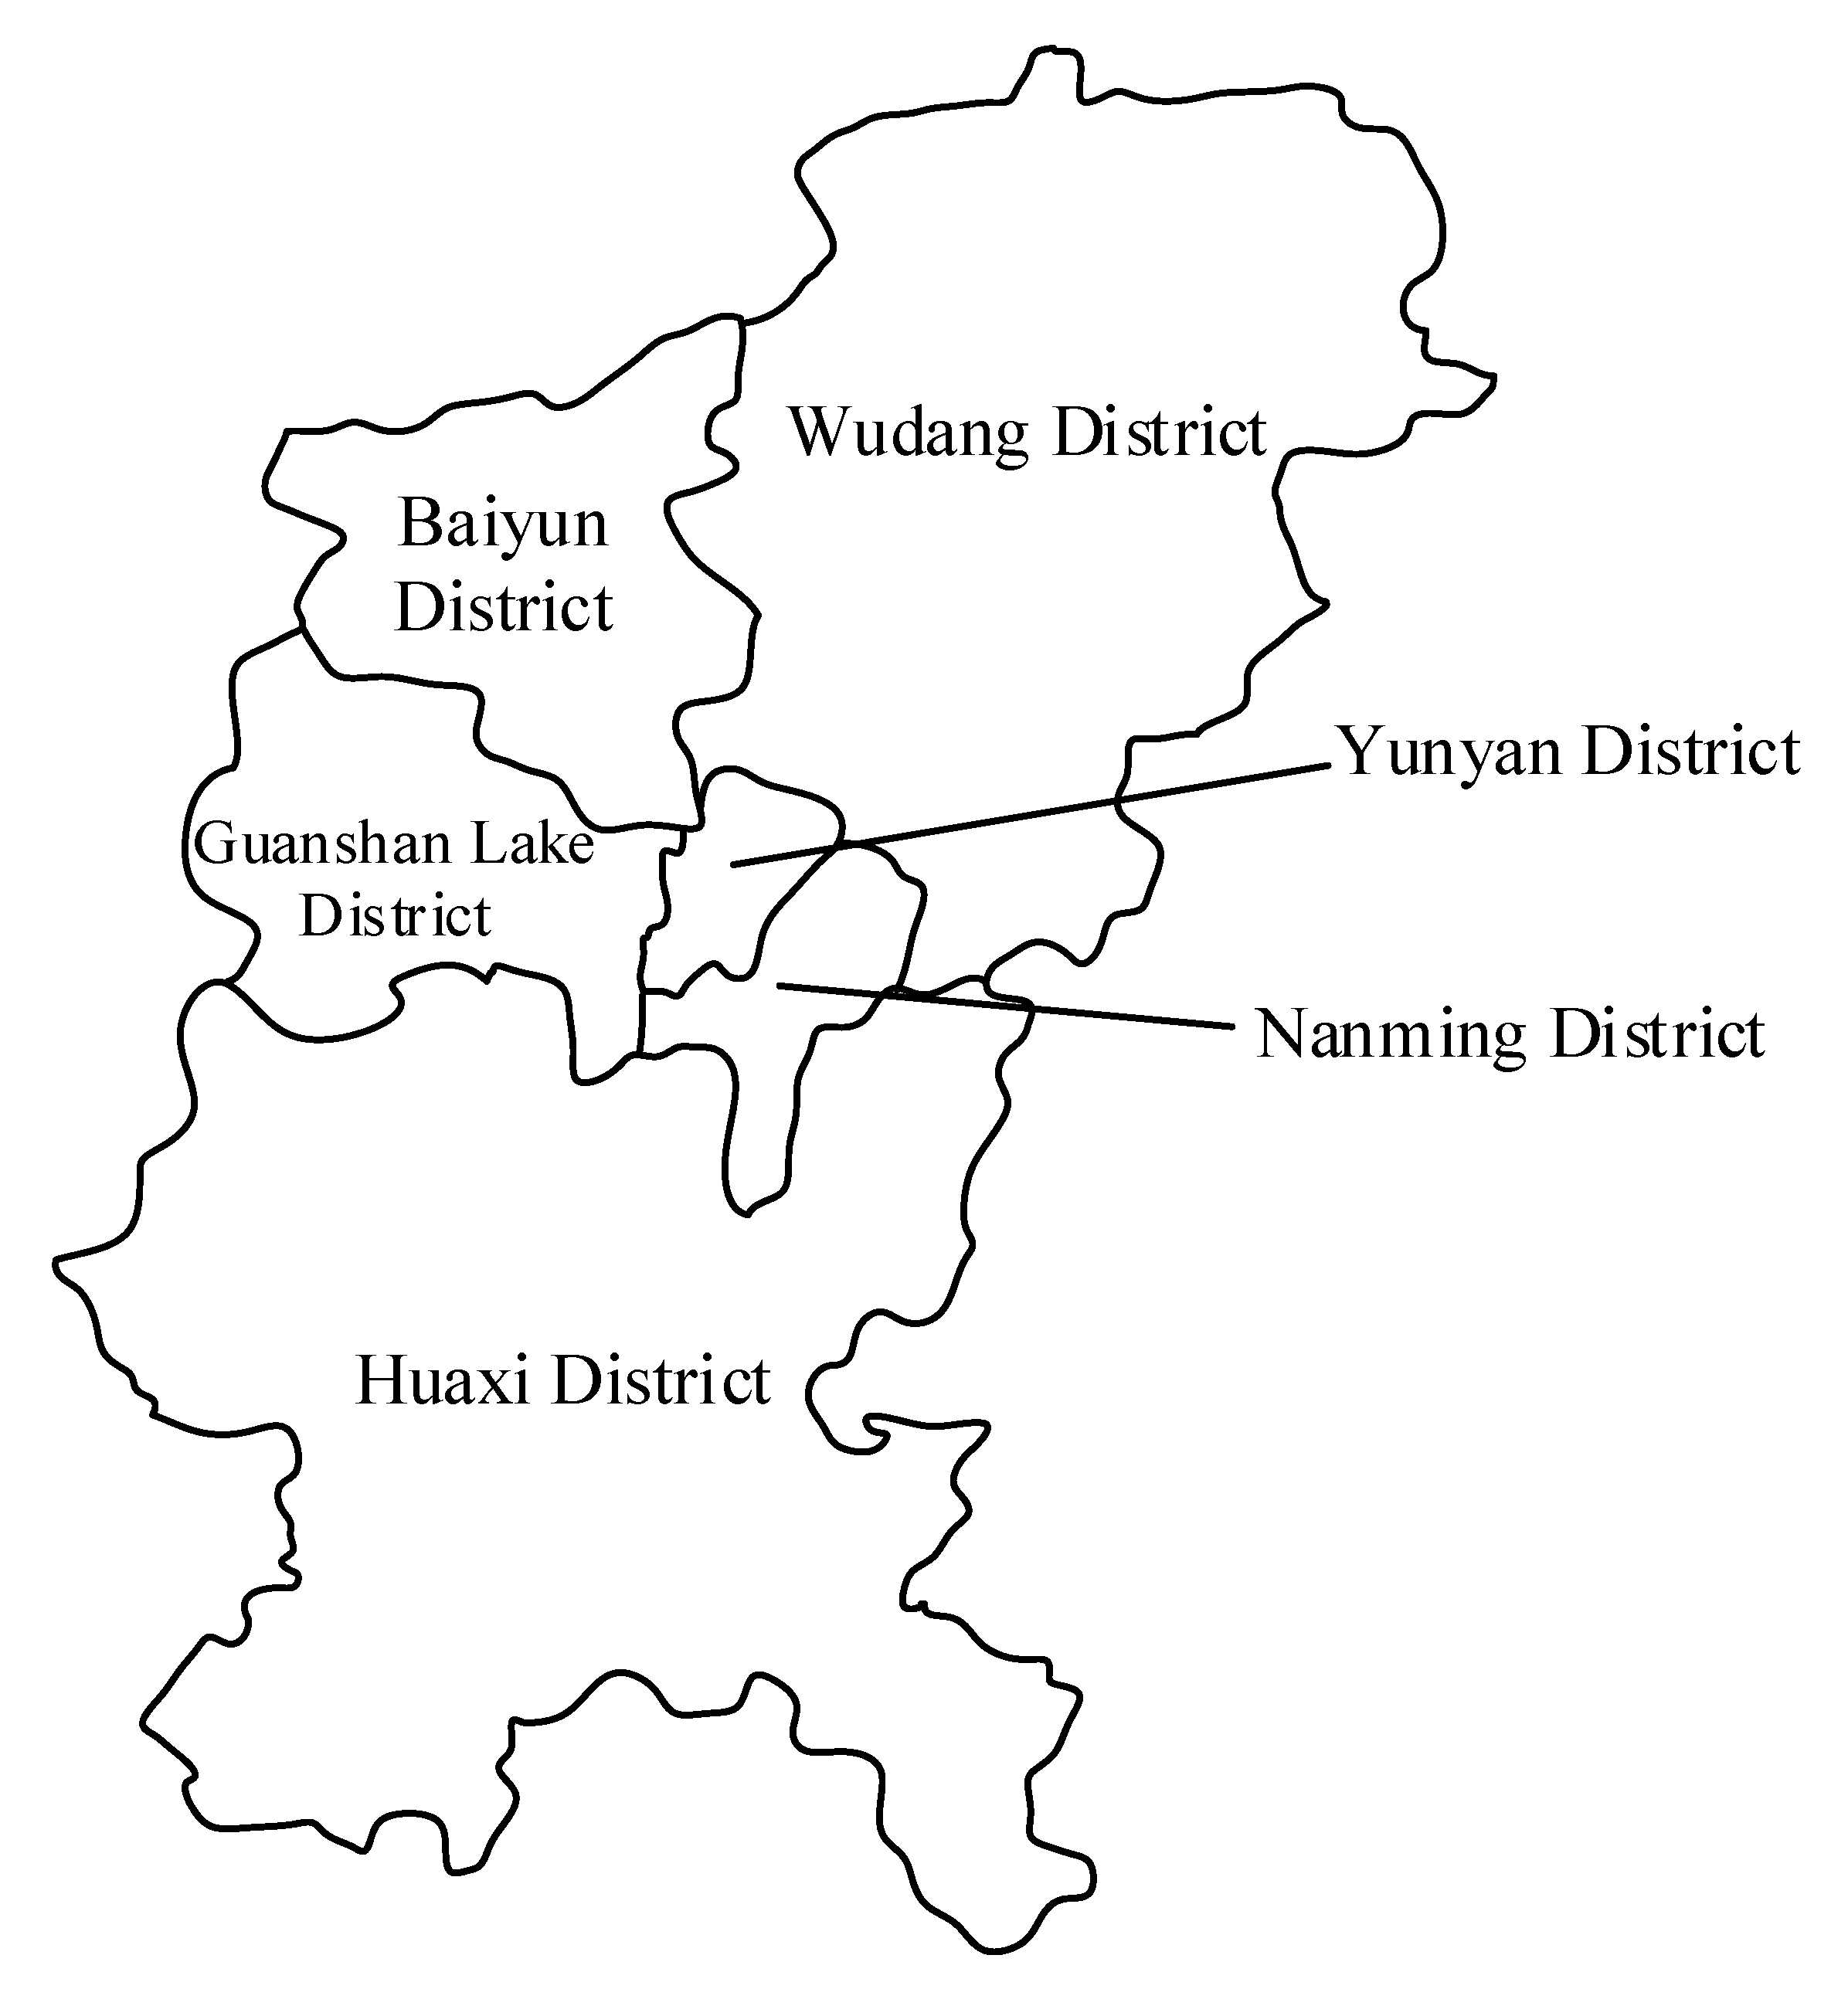
2.1. Study Area Overview
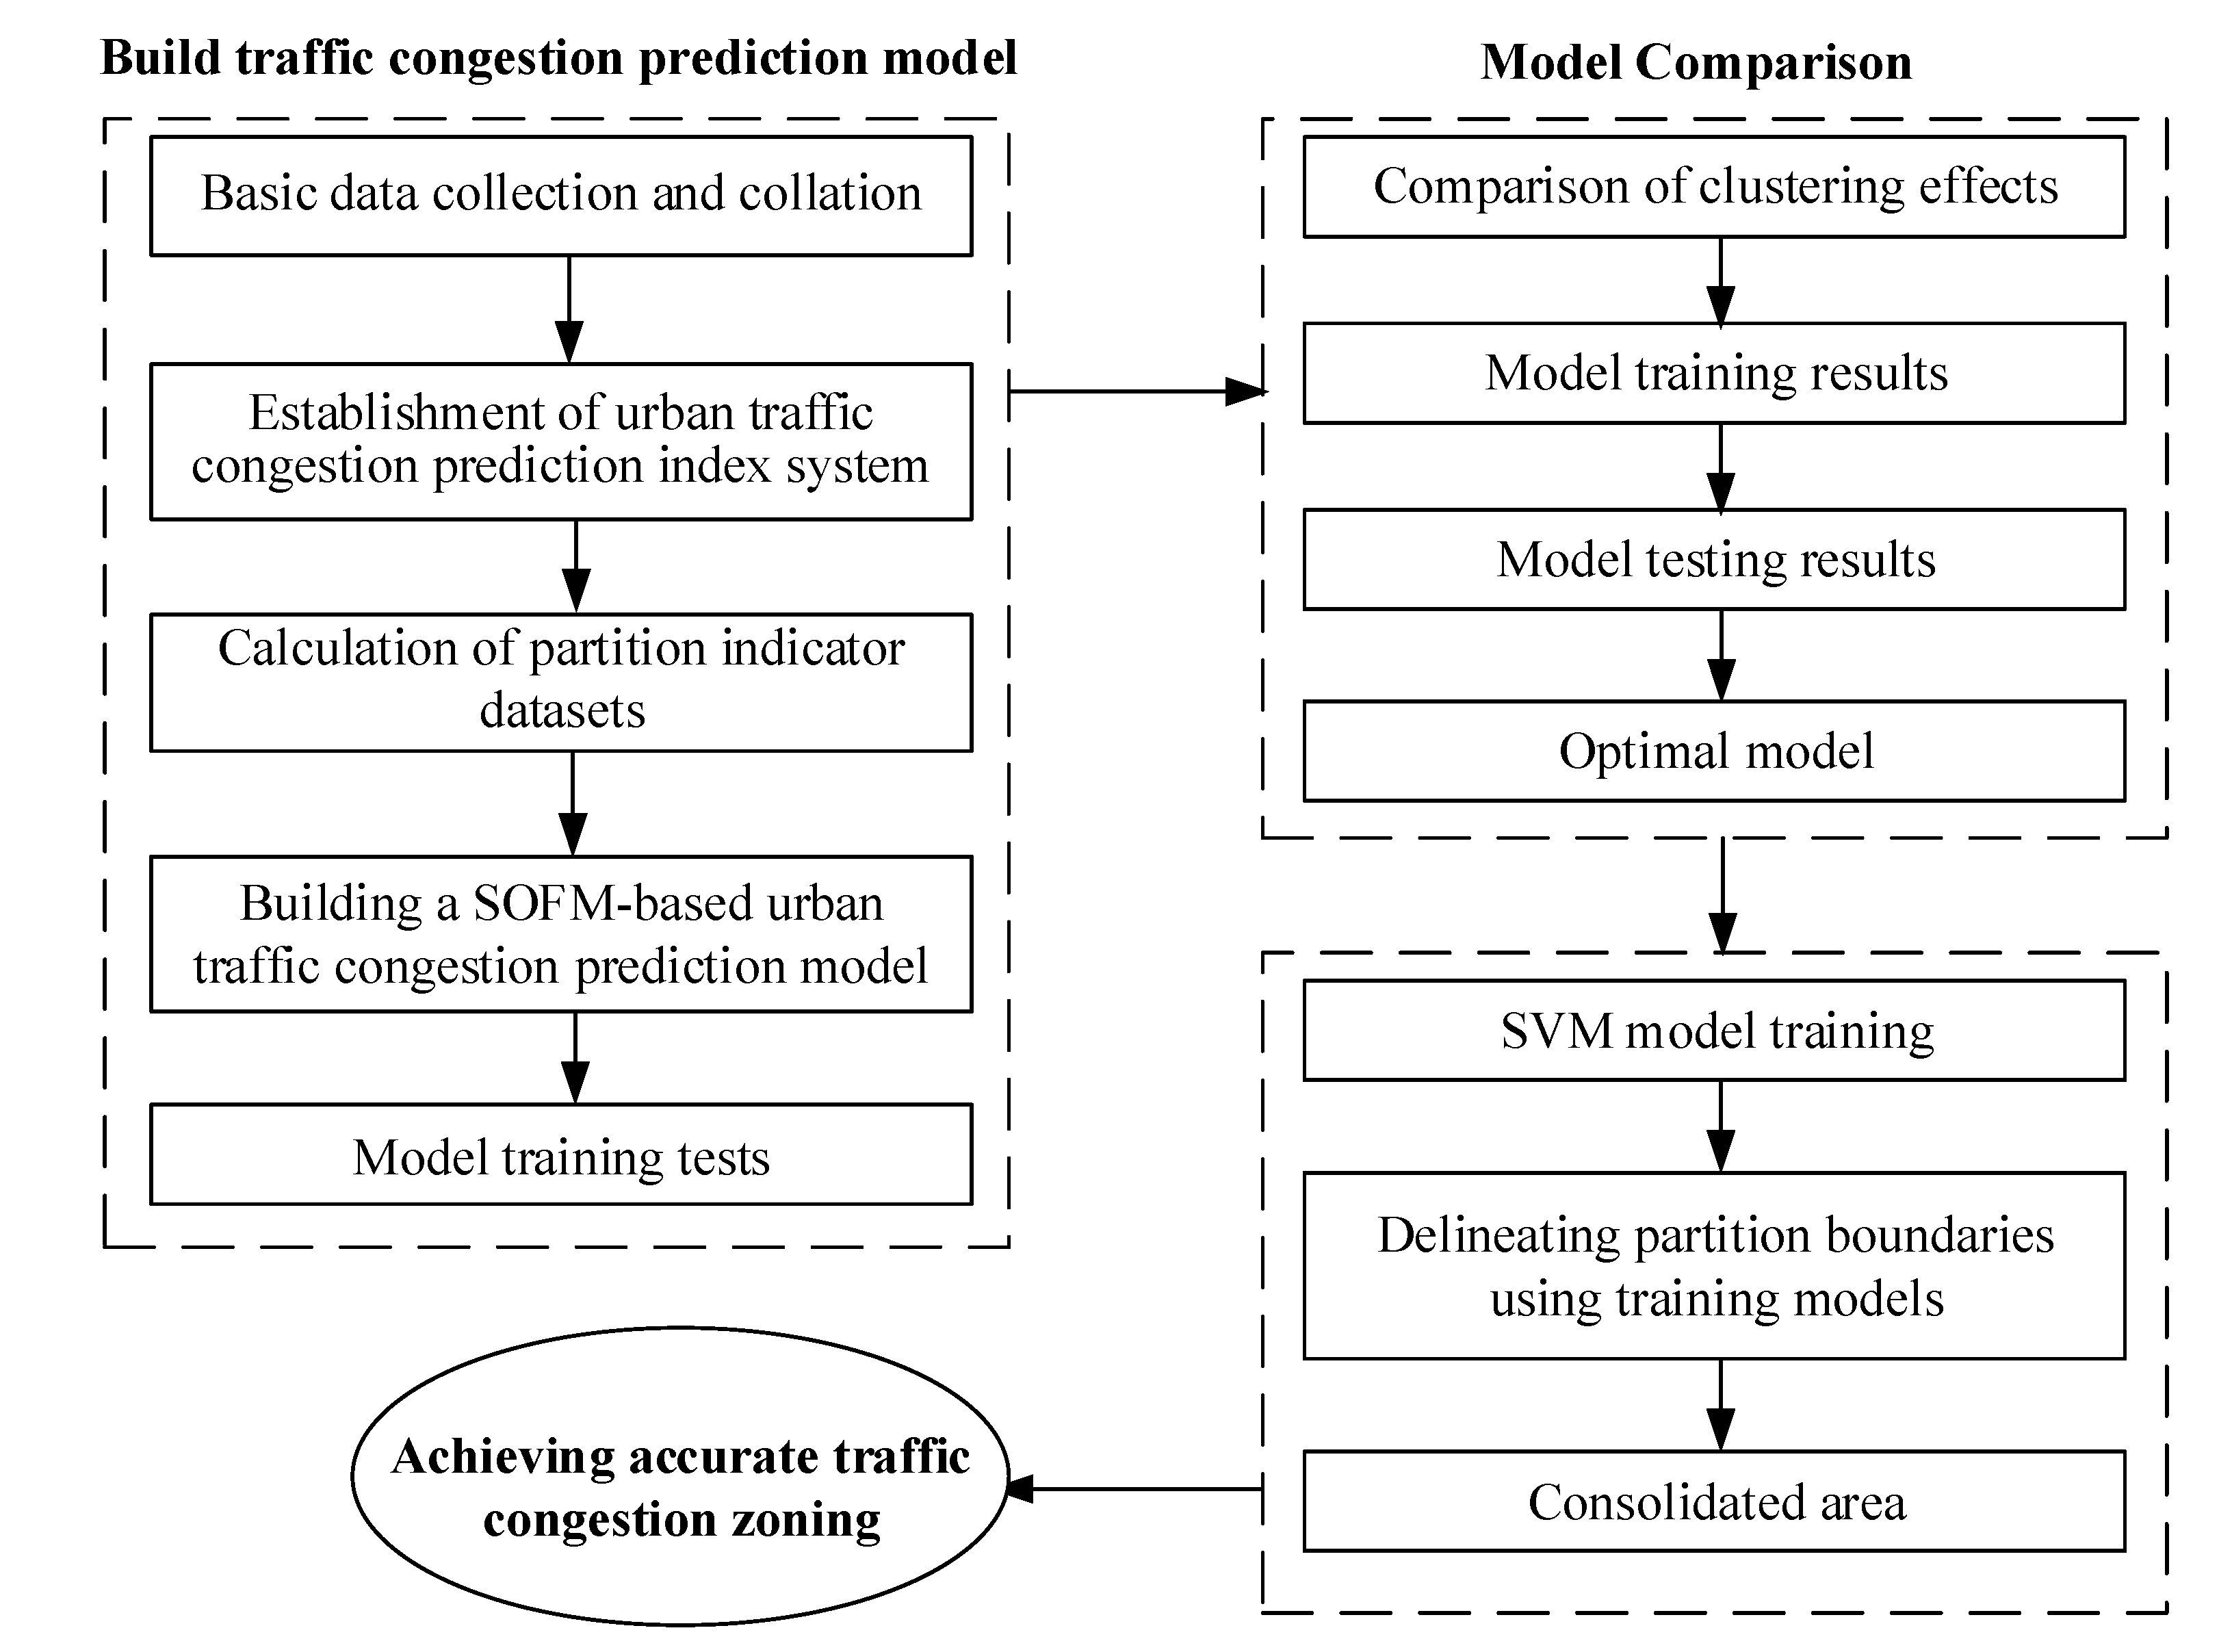
2.2. Research Method
3. SOFM-SVM-Based Urban Traffic Congestion Zoning Model
3.1. Data Source and Processing
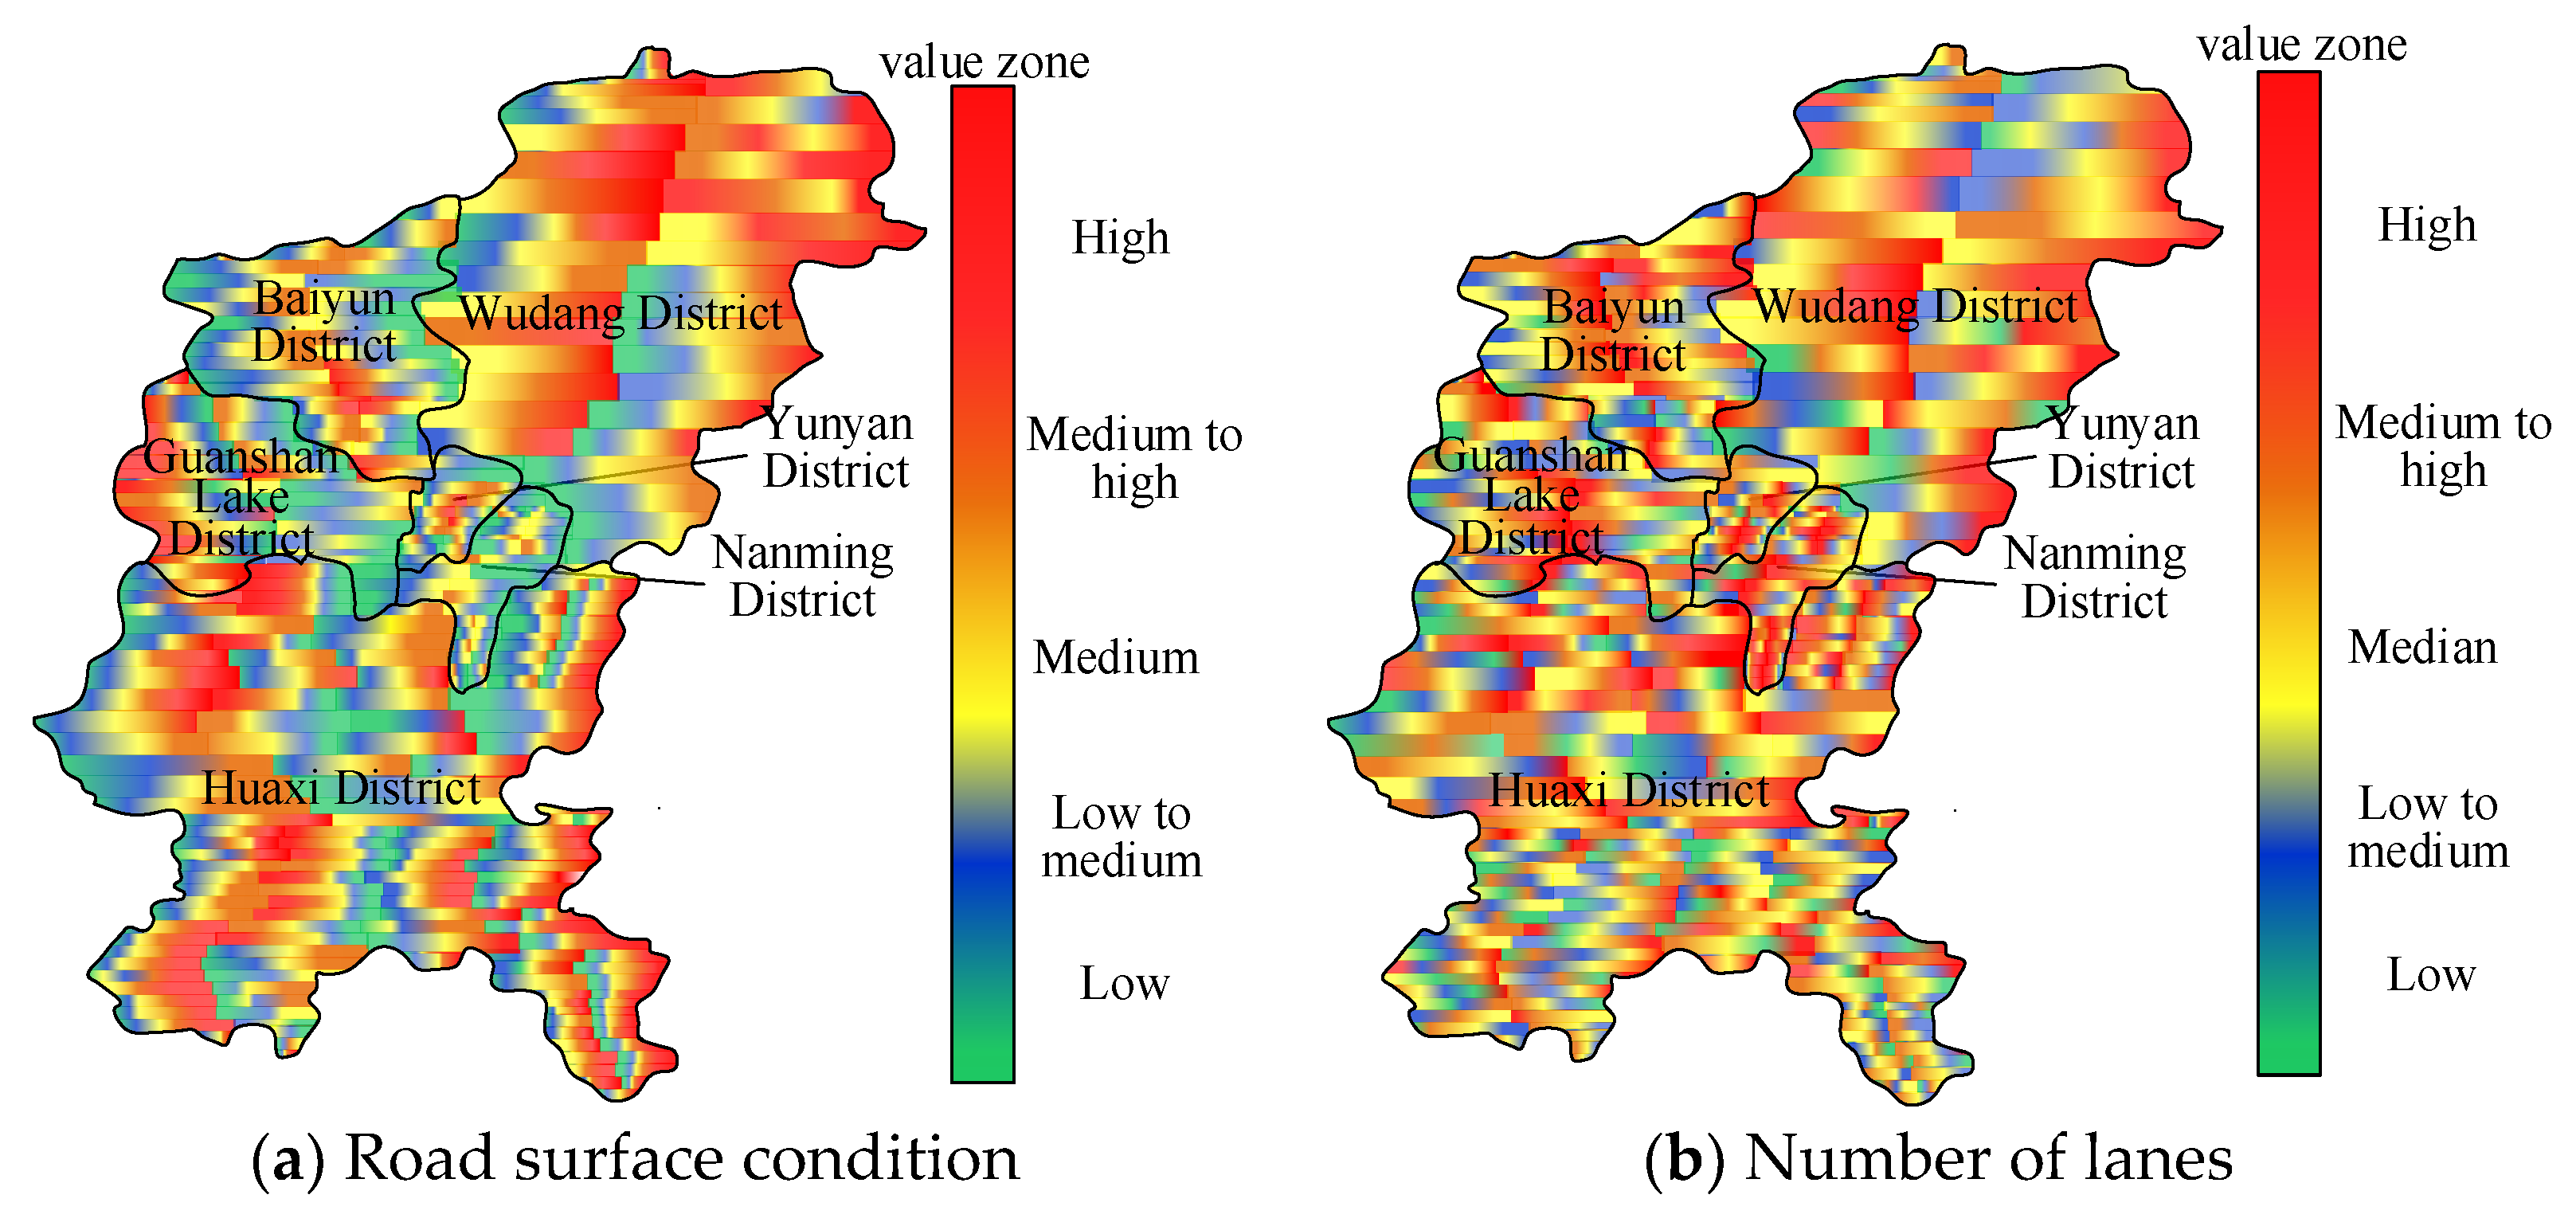
3.2. Establishment of Urban Traffic Congestion Zoning Index System
3.3. Establishing SOFM-Based Urban Traffic Congestion Category Zone Model
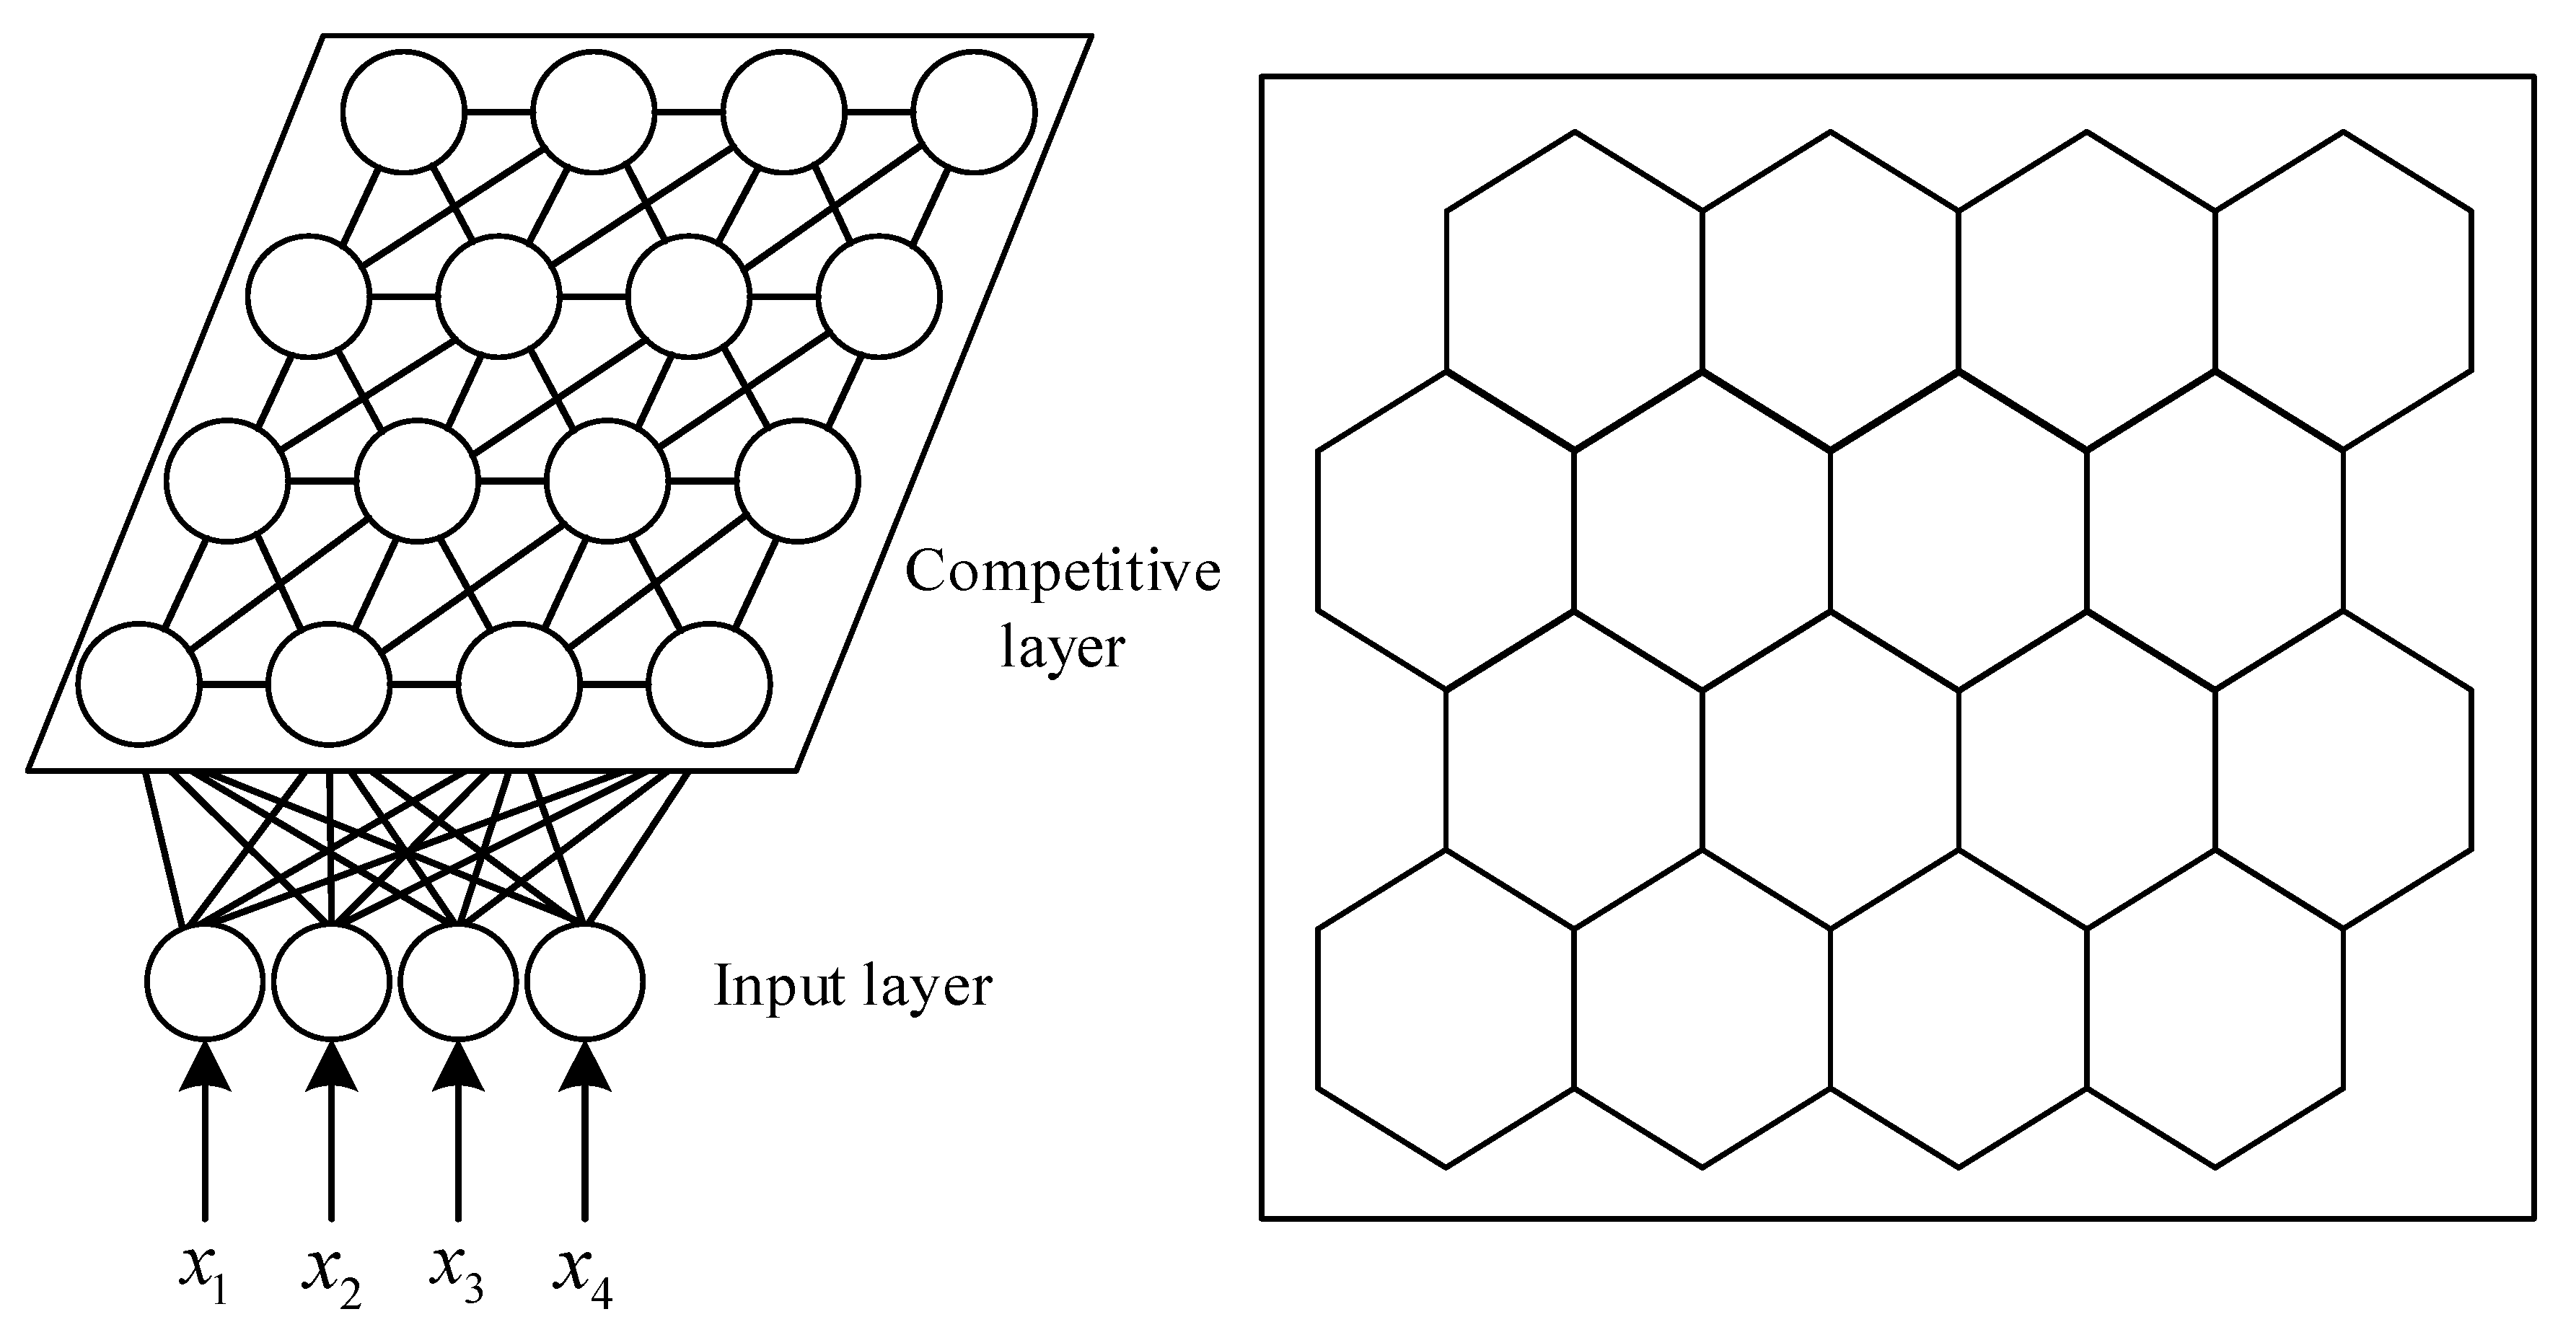
3.3.1. Building the Model
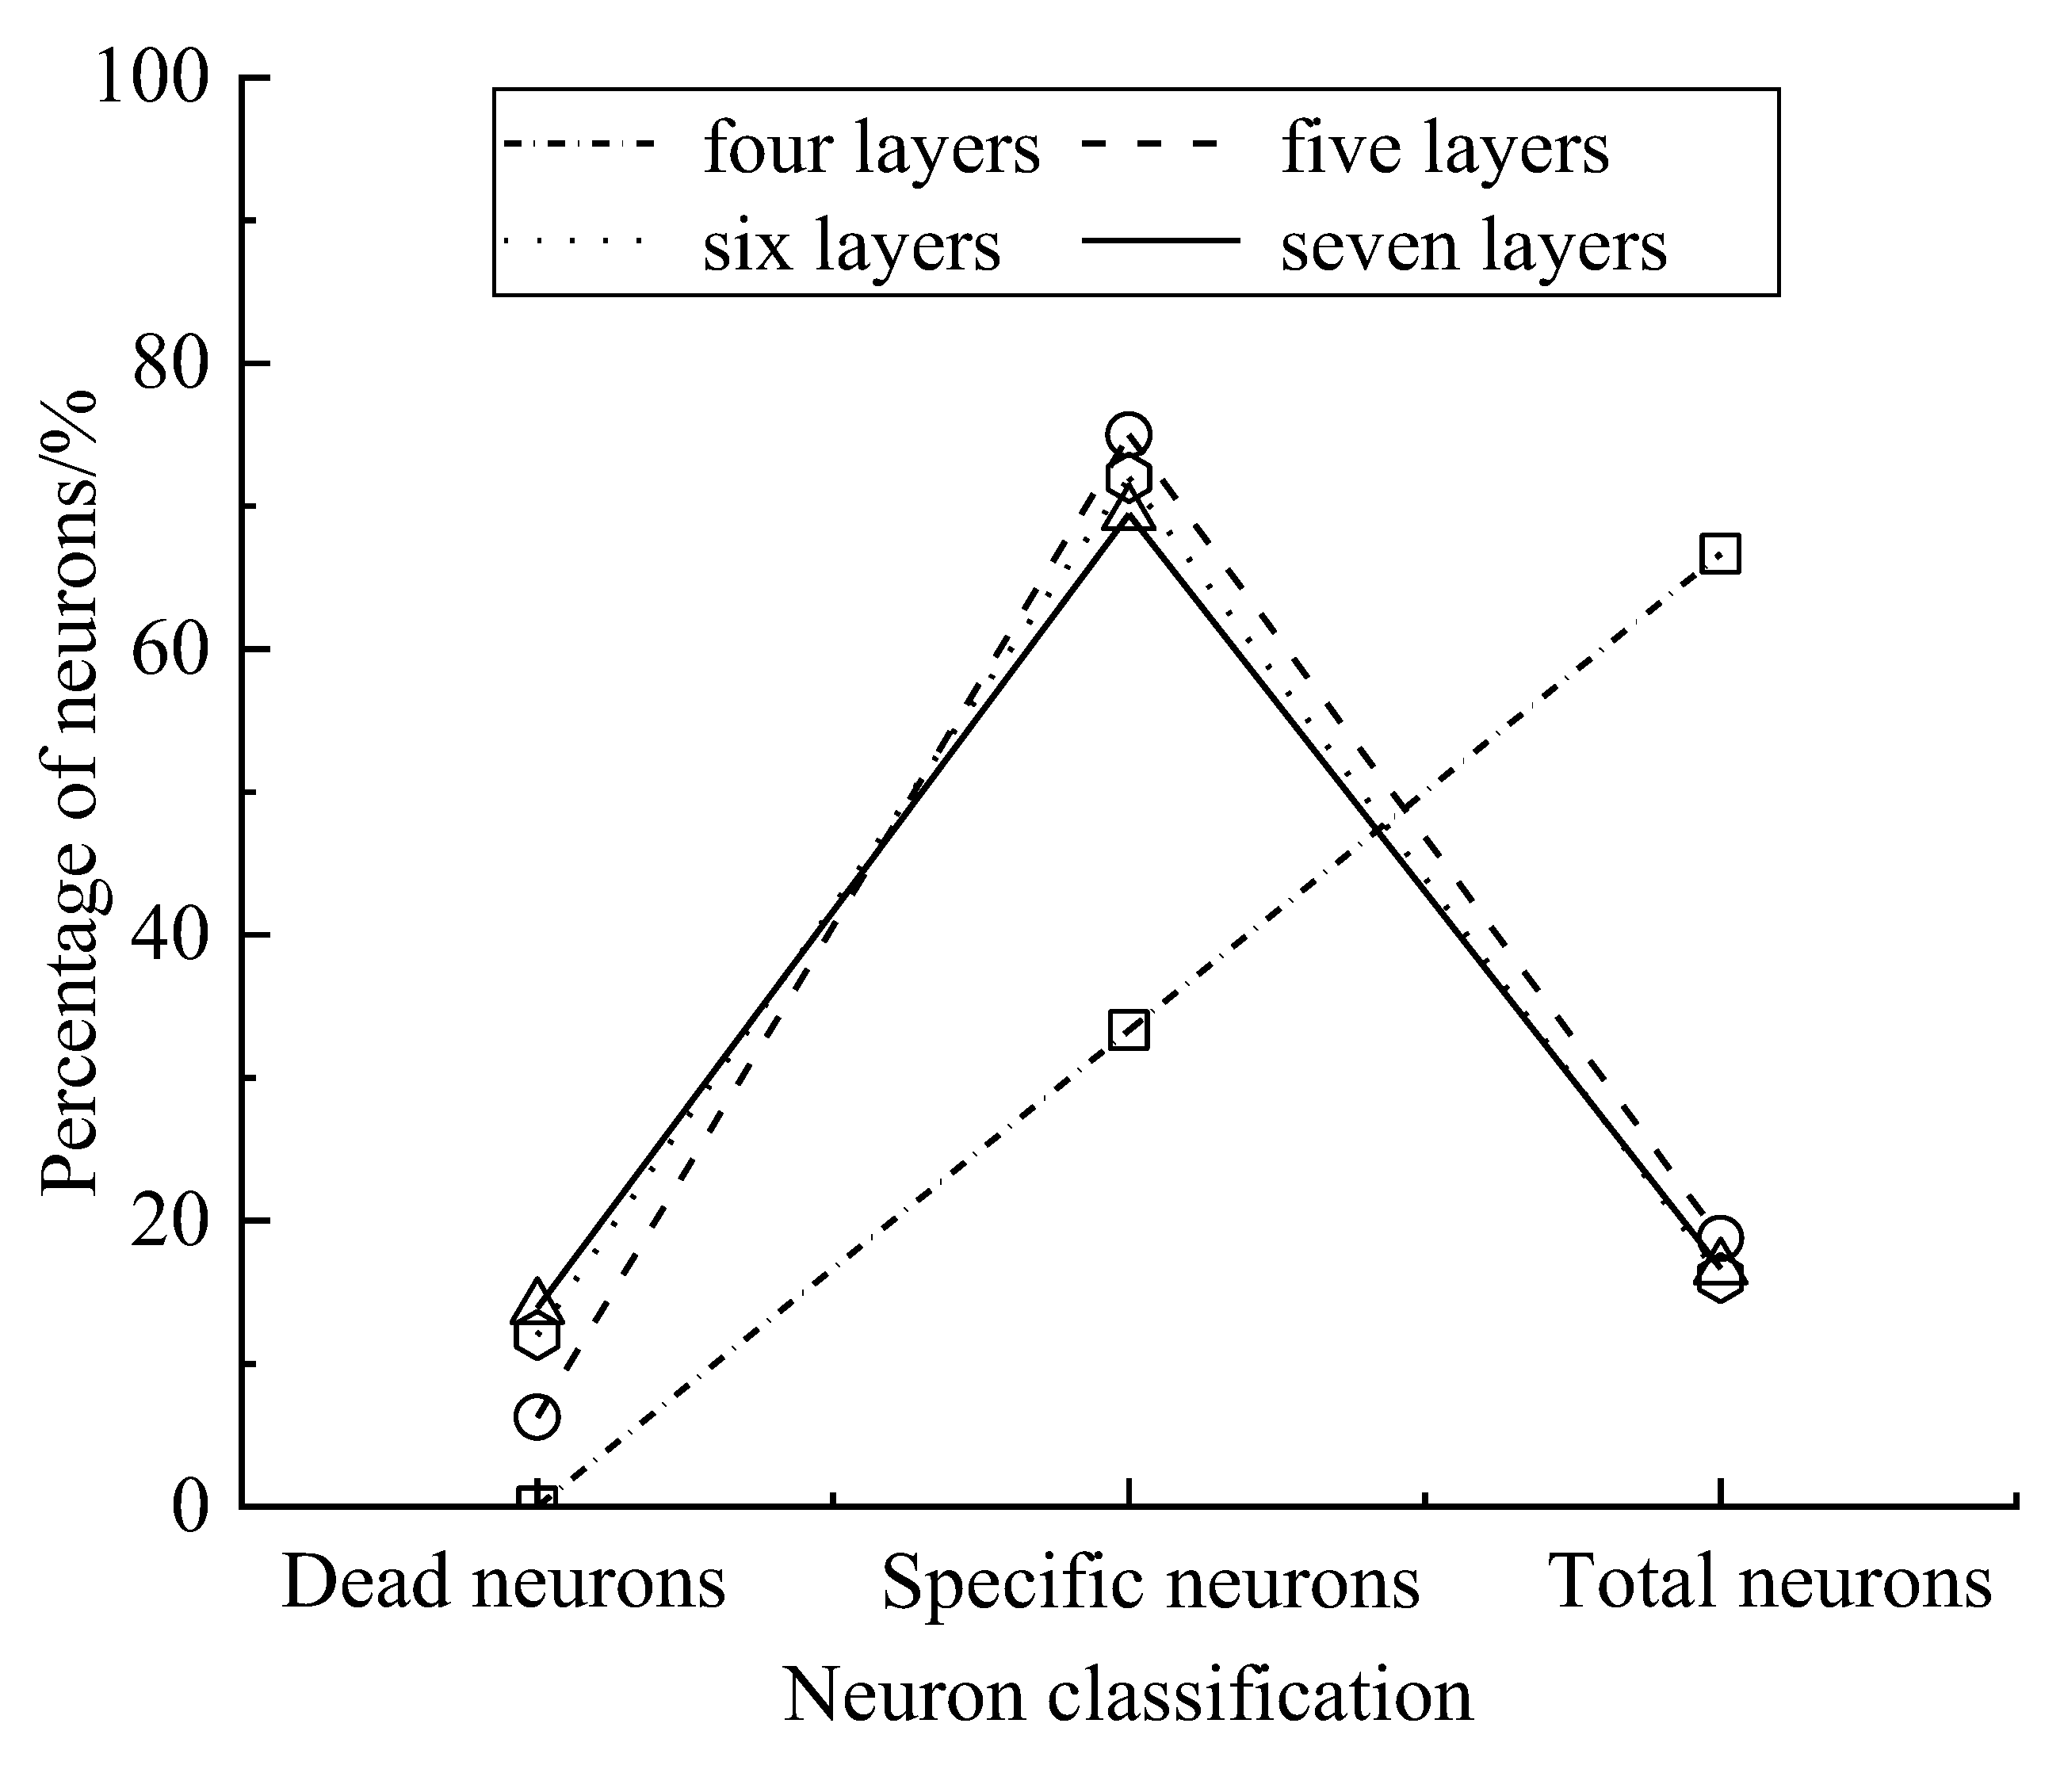
3.3.2. Model Comparison
3.4. Establishing an SVM-Based Zoning Model for Urban Traffic Congestion Prevention and Control Types
4. Analysis of Results
4.1. Spatial Distribution of Resilience in Urban Transportation Systems
4.2. Spatial Distribution of Urban Transportation System Vulnerability
4.3. Classification of Urban Traffic Congestion Category Zones
4.3.1. Model Testing
4.3.2. Model Comparison
4.3.3. Model Division Results
4.4. Division of Urban Traffic Congestion Prevention and Control Type Zoning
4.4.1. Model Parameter Selection
4.4.2. Model Comparison
4.4.3. Model Division Results
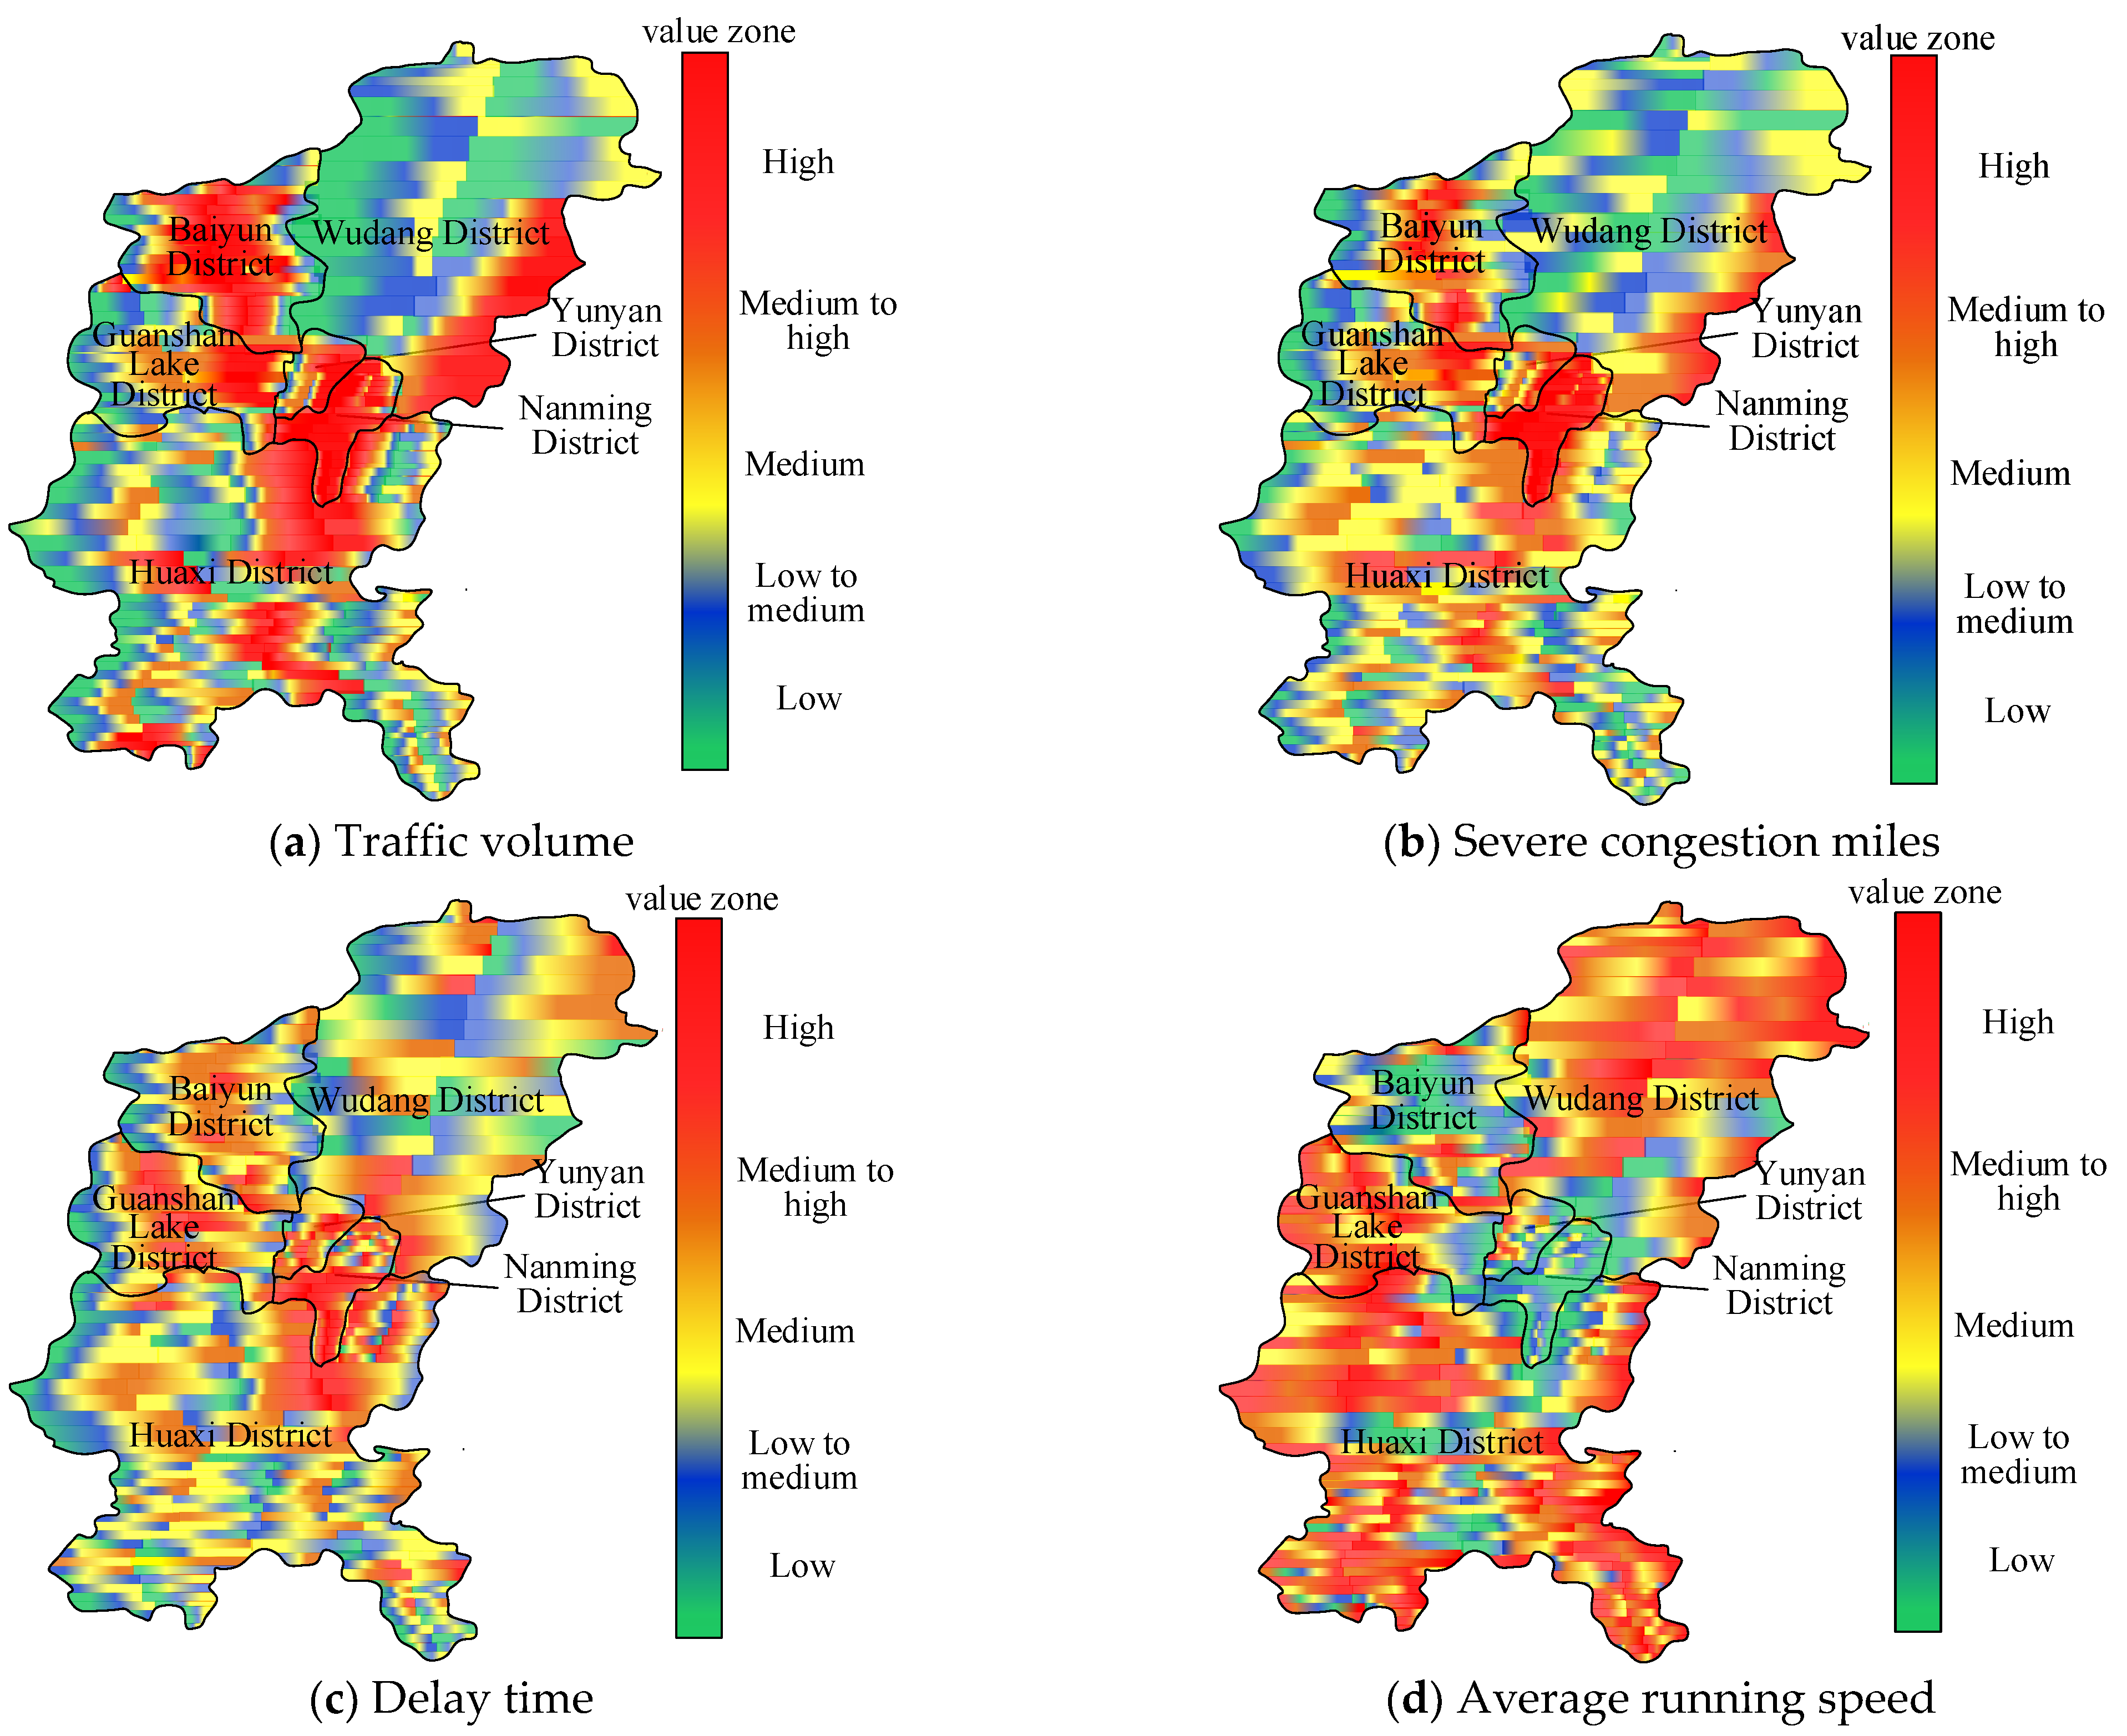
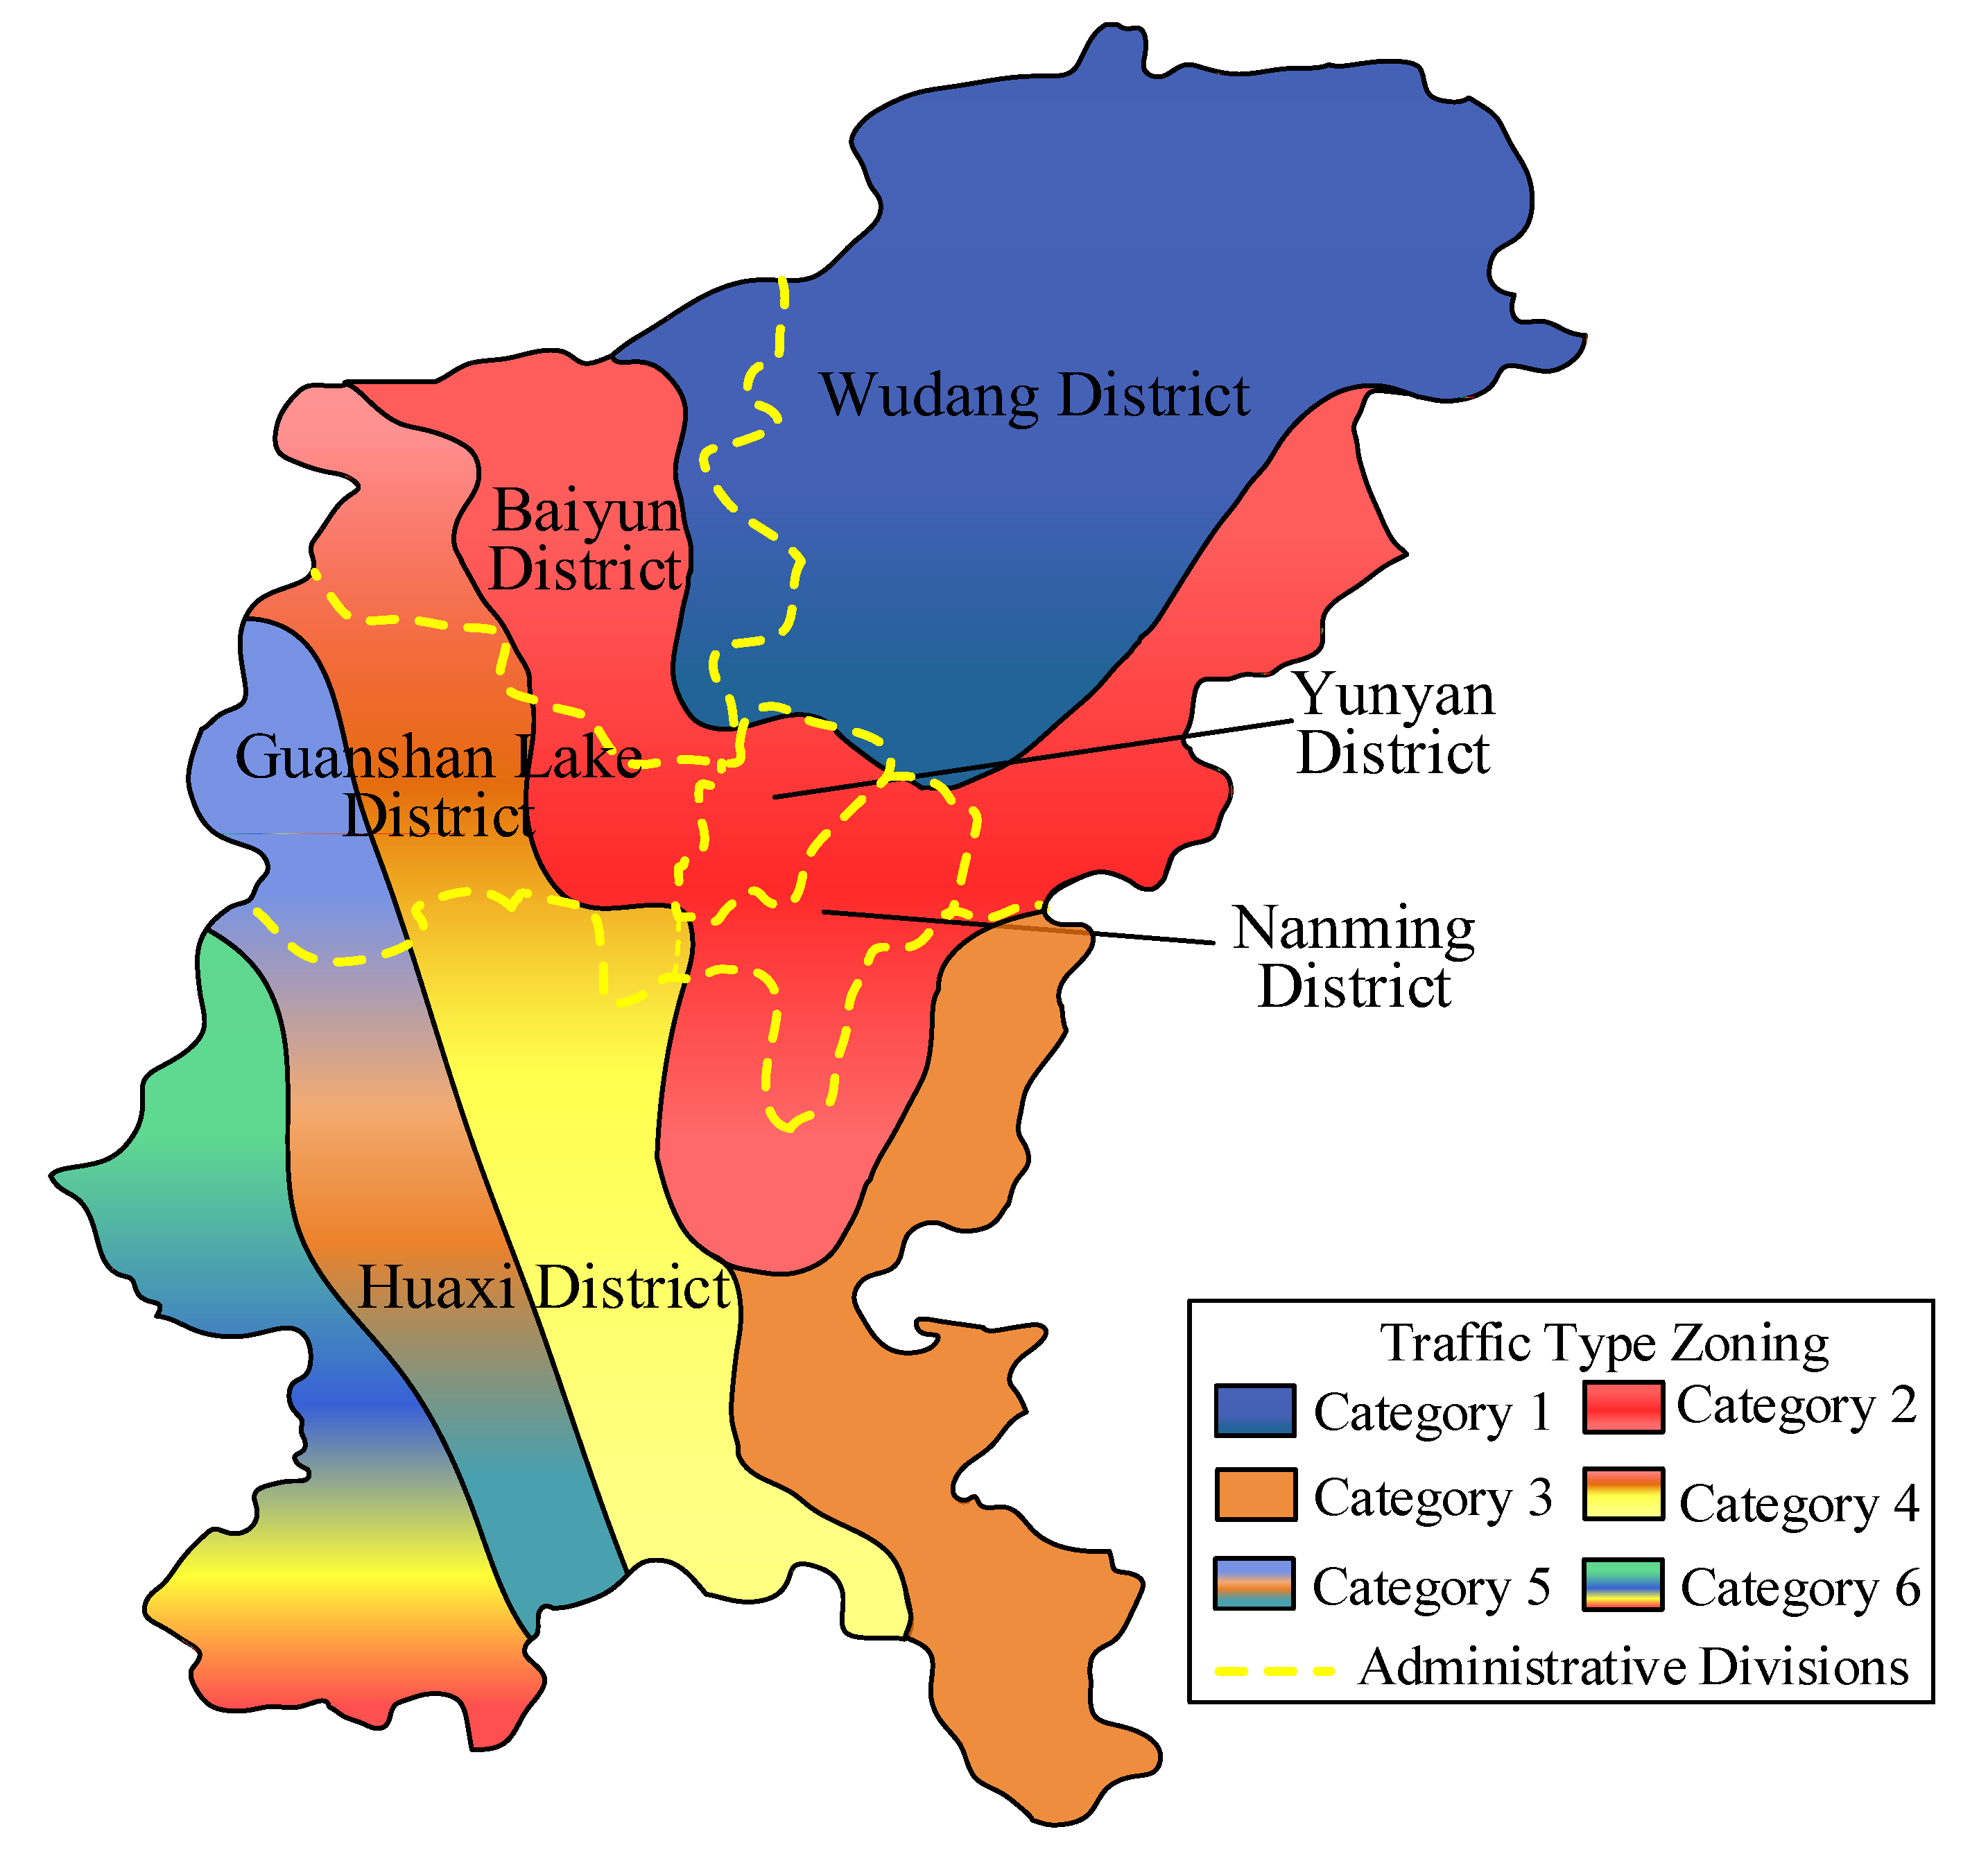
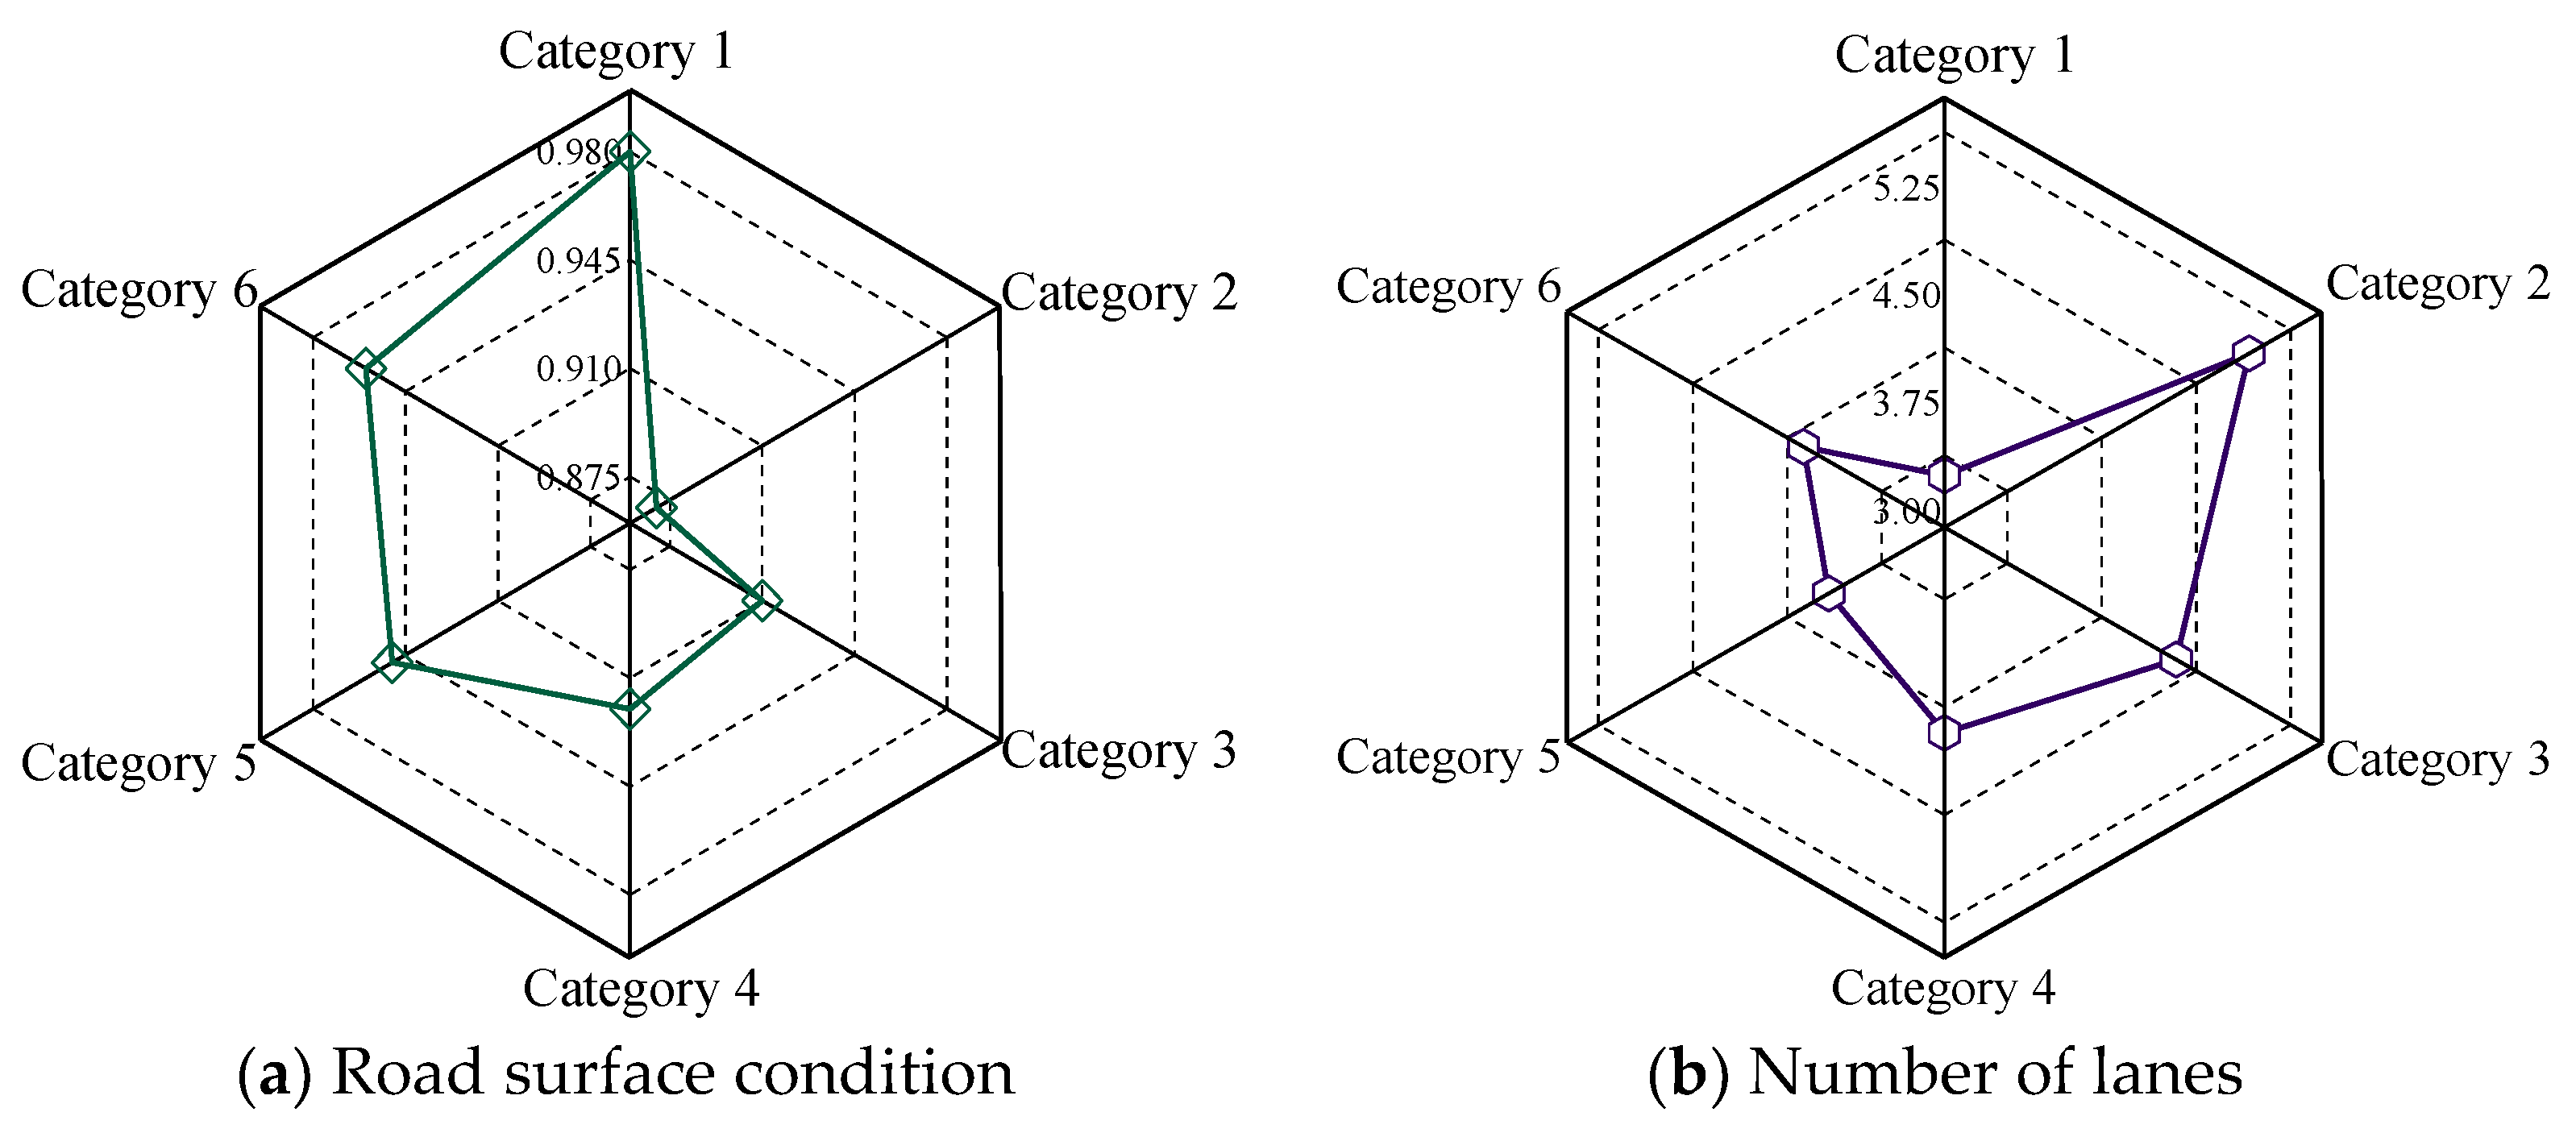
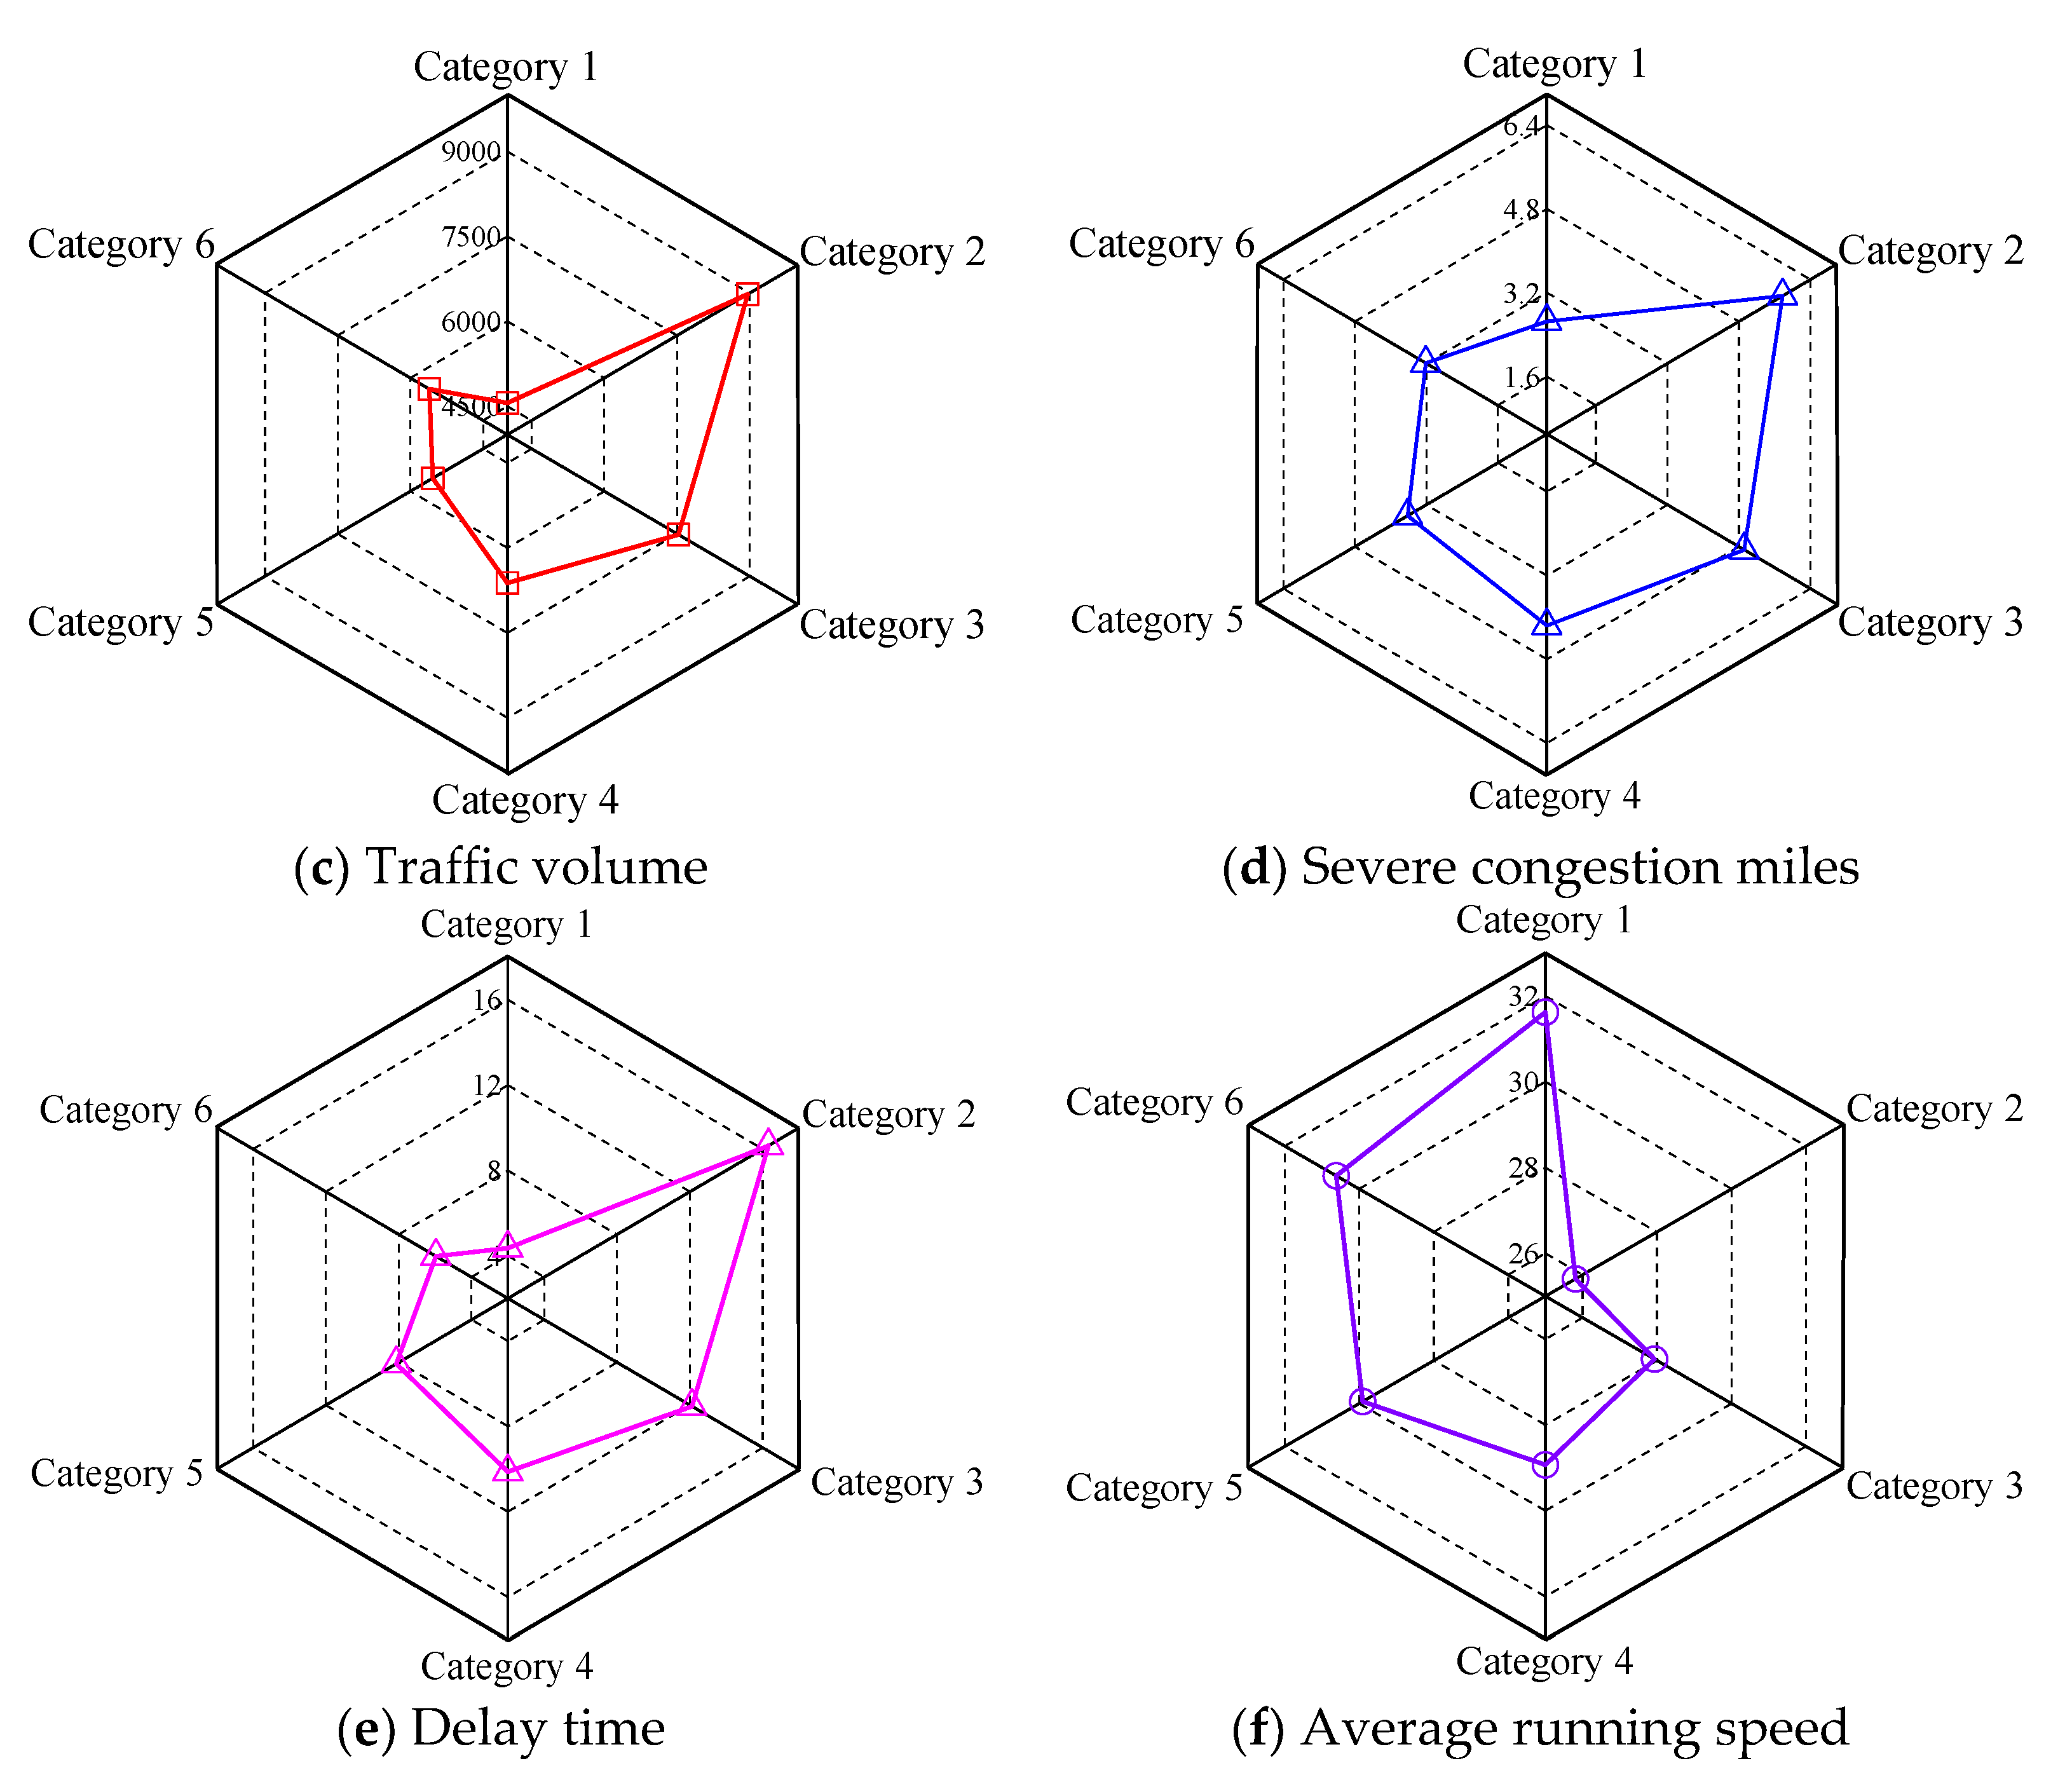
- I North Important Precautionary Zone (Category 1). The zone is located in the central northeast-southwest area of the Wudang District, which is generally free of congestion and has relatively low traffic volume. It belongs to the medium level of the urban study area. II Northwest General Precautionary Zone (Category 1). The zone is located in the northern core of Guiyang and the regional average delays, severe congestion miles, and other transportation system vulnerabilities are at low levels. III Northeast Secondary Precautionary Zone (Category 1). The zone is located in the northeastern part of Guiyang, with medium-to-high traffic volume, and at the city boundary. This area has good road surface conditions and high potential for traffic development.
- IV Northern Important Control Zone (Category 2). The zone is located in the core area in the north of Guiyang; in the middle and middle east of the Baiyun District, the economic development in the area is better. There are more jobs available, the traffic volume is on the high side, and the construction of transportation infrastructure is more complete, but the contradiction between the transportation supply and demand is more prominent. V Central Special Control Zone (Category 2). The zone is located in the economic, political, and cultural center of Guiyang, with regular traffic congestion, an average operating speed below 25km/h, and a peak congestion delay index above 1.72. It is the most vulnerable area of Guiyang’s urban transportation system. VI Central and Central-Eastern Secondary Control Zone (Category 2). The zone is located in the west-central Huaxi District and the east of the Wudang District, with a large volume of external traffic and a decrease in severe congestion miles and delays.
- VII Southeast Special Precautionary Zone (Category 3). The zone is located in the southeastern fringe zone of the city, which mainly consists of the eastern fringe zone of the Huaxi District. There is a lot of transit traffic in the region and the inter-regional connection should be strengthened and the road network should be reasonably laid out. Enhance the stability of the transportation system.
- VIII Northwest Important Control Area (Category 4). It consists of the western area of the Baiyun District and part of the northern area of the Guanshan Lake District. The regional economy is well developed and well connected with the outside region, but the traffic system is more sensitive, with larger traffic volume and delay time. IX Western Secondary Control Area (Category 4). The zone is located in the central area of the Guanshan Lake District, the contradiction between the traffic supply and demand is not prominent and the industrial-type traffic dominance is more prominent. X Central Important Control Area (Category 4). The zone is located in the central core area of the Huaxi District, mainly with educational land and relatively well-constructed transportation. XI Southern Secondary Control Area (Category 4). The zone is located in the southernmost part of the study area, with better traffic infrastructure construction.
- XII Western Secondary Precautionary Zone (Category 5). The zone is located in the western part of the Guanshan Lake District and the central and western part of the Huaxi District, with low volume of external traffic in the region and an average level of economic development. XIII Western Secondary Control Zone (Category 5). The zone is located in the central core of the Huaxi district, with overall low delays and an average running speed of 34 km/h or more. XIV Southern Critical Precautionary Zone (Category 5). The zone is located in the southernmost part of the study area and the overall carrying capacity of the road network is high.
- XV Southwest Secondary Precautionary Area (Category 6). The zone is located in the western core area of the Huaxi District, with good external transportation links and a relatively good road network. XVI Southern Critical Control Area (Category 6). The zone is located in the southernmost part of the study area, with unreasonable signal control at some intersections, low average operating speeds, a high percentage of severely congested miles, and a low level of traffic system vulnerability, which requires further improvement of traffic system stability.
5. Conclusions
Author Contributions
Funding
Institutional Review Board Statement
Informed Consent Statement
Data Availability Statement
Acknowledgments
Conflicts of Interest
References
- Xing, X.X.; Huang, W.H.; Song, G.; Xie, K.Q. Traffic Zone Division Using Mobile Billing Data. In Proceedings of the 2014 11th International Conference on Fuzzy Systems and Knowledge Discovery (FSKD), Xiamen, China, 19–21 August 2014; pp. 692–697. [Google Scholar]
- Kong, X.J.; Xu, Z.Z.; Shen, G.J.; Wang, J.Z.; Yang, Q.Y.; Zhang, B.S. Urban traffic congestion estimation and prediction based on floating car trajectory data. Futur. Gener. Comp. Syst. 2016, 61, 97–107. [Google Scholar] [CrossRef]
- Cox, T.; Thulasiraman, P. A zone-based traffic assignment algorithm for scalable congestion reduction. ICT Express 2017, 3, 204–208. [Google Scholar] [CrossRef]
- Sun, G.D.; Chang, B.F.; Zhu, L.; Wu, h.; Zheng, K.; Liang, R.H. TZVis: Visual analysis of bicycle data for traffic zone division. J. Vis. 2019, 22, 1193–1208. [Google Scholar] [CrossRef]
- Sadollah, A.; Gao, K.Z.; Zhang, Y.C.; Zhang, Y.; Su, R. Management of traffic congestion in adaptive traffic signals using a novel classification-based approach. Eng. Optimiz. 2019, 51, 1509–1528. [Google Scholar] [CrossRef]
- Niu, X.; Zhu, J.; Wu, C.Q.; Wang, S. On a clustering-based mining approach for spatially and temporally integrated traffic sub-area division. Eng. Appl. Artif. Intell. 2020, 96, 103932. [Google Scholar] [CrossRef]
- Li, L.X.; Lin, H.; Wan, J.X.; Ma, Z.Q.; Wang, H. MF-TCPV: A machine learning and fuzzy comprehensive evaluation-based framework for traffic congestion prediction and visualization. IEEE Access 2020, 8, 227113–227125. [Google Scholar] [CrossRef]
- Ranjan, N.; Bhandari, S.; Zhao, H.P.; Kim, N.; Khan, P. City-wide traffic congestion prediction based on CNN, LSTM and transpose CNN. IEEE Access 2020, 8, 2169–3536. [Google Scholar] [CrossRef]
- Gu, Y.Y.; Wang, Y.D.; Dong, S.H. Public traffic congestion estimation using an artificial neural network. ISPRS Int. J. Geoinf. 2020, 9, 152. [Google Scholar] [CrossRef]
- Kang, M.; Yang, G.; Yoo, Y.; Yoo, C. Proactive congestion avoidance for distributed deep learning. Sensors 2020, 21, 174. [Google Scholar] [CrossRef]
- Tu, Y.; Lin, S.k.; Qiao, J.z.; Liu, B. Deep traffic congestion prediction model based on road segment grouping. Appl. Intell. 2021, 51, 8519–8541. [Google Scholar] [CrossRef]
- Huang, C.J.; Hu, K.W.; Ho, H.Y.; Xie, B.Z.; Feng, C.C.; Chuang, H.W. A distributed urban traffic congestion prevention mechanism for mixed flow of human-driven and autonomous electric vehicles. Int. J. Comput. Intell. Syst. 2021, 14, 1714–1727. [Google Scholar] [CrossRef]
- Cai, M.; Hong, L.; Xiong, C. Data-driven traffic zone division in smart city: Framework and technology. Sustain. Energy Technol. Assess. 2022, 52, 102251. [Google Scholar] [CrossRef]
- Yu, Y.; Cui, Y.L.; Zeng, J.Q.; He, C.G.; Wang, D.H. Identifying traffic clusters in urban networks based on graph theory using license plate recognition data. Physica A 2022, 591, 126750. [Google Scholar] [CrossRef]
- Dokuz, A.S. Weighted spatio-temporal taxi trajectory big data mining for regional traffic estimation. Physica A 2022, 589, 126645. [Google Scholar] [CrossRef]
- Weng, J.X.; Meng, Q. Incorporating work zone configuration factors into speed-flow and capacity models. J. Adv. Transp. 2015, 49, 371–384. [Google Scholar] [CrossRef]
- Dadashova, B.; Li, X.; Turner, S.; Koeneman, P. Multivariate time series analysis of traffic congestion measures in urban areas as they relate to socioeconomic indicators. Socio-Econ. Plan. Sci. 2021, 75, 100877. [Google Scholar] [CrossRef]
- Wang, M.; Debbage, N. Urban morphology and traffic congestion: Longitudinal evidence from US cities. Comput. Environ. Urban Syst. 2021, 89, 101676. [Google Scholar] [CrossRef]
- Jin, J.; Rafferty, P. Externalities of auto traffic congestion growth: Evidence from the residential property values in the US Great Lakes megaregion. J. Transp. Geogr. 2018, 70, 131–140. [Google Scholar] [CrossRef]
- Marshall, W.E.; Dumbaugh, E. Revisiting the relationship between traffic congestion and the economy: A longitudinal examination of US metropolitan areas. Transportation 2020, 47, 275–314. [Google Scholar] [CrossRef]
- Jia, R.; Jiang, P.C.; Liu, L.; Cui, L.Z.; Shi, Y.L. Data driven congestion trends prediction of urban transportation. IEEE Internet Things J. 2017, 5, 581–591. [Google Scholar] [CrossRef]
- Nguyen, D.B.; Dow, C.R.; Hwang, S.F. An efficient traffic congestion monitoring system on internet of vehicles. Wirel. Commun. Mob. Comput. 2018, 2018, 9136813. [Google Scholar] [CrossRef]
- Hu, W.B.; Wang, H.; Qiu, Z.Y.; Yan, L.P.; Nie, C.; Du, B. An urban traffic simulation model for traffic congestion predicting and avoiding. Neural Comput. Appl. 2018, 30, 1769–1781. [Google Scholar] [CrossRef]
- Chen, M.; Yu, X.H.; Liu, Y. PCNN: Deep convolutional networks for short-term traffic congestion prediction. IEEE Trans. Intell. Transp. Syst. 2018, 19, 3550–3559. [Google Scholar] [CrossRef]
- Lee, C.G.; Kim, Y.J.; Jin, S.G.; Kim, D.M.; Maciejewski, R.; Ebert, D.; Ko, S. A visual analytics system for exploring, monitoring, and forecasting road traffic congestion. IEEE Trans. Vis. Comput. Graph. 2019, 26, 3133–3146. [Google Scholar] [CrossRef] [PubMed]
- Wen, F.; Zhang, G.; Sun, L.F.; Wang, X.Q.; Xu, X.W. A hybrid temporal association rules mining method for traffic congestion prediction. Comput. Ind. Eng. 2019, 130, 779–787. [Google Scholar] [CrossRef]
- Luo, Z.W.; Zhang, Y.; Li, L.; He, B.; Li, C.M.; Zhu, H.H.; Wang, W.; Ying, S.; Xi, Y.L. A hybrid method for predicting traffic congestion during peak hours in the subway system of Shenzhen. Sensors 2019, 20, 150. [Google Scholar] [CrossRef]
- Sun, T.T.; Huang, Z.F.; Zhu, H.D.; Huang, Y.H.; Zheng, P.J. Congestion pattern prediction for a busy traffic zone based on the Hidden Markov Model. IEEE Access 2020, 9, 2390–2400. [Google Scholar] [CrossRef]
- Chaurasia, B.K.; Manjoro, W.S.; Dhakar, M. Traffic congestion identification and reduction. Wirel. Pers. Commun. 2020, 114, 1267–1286. [Google Scholar] [CrossRef]
- Elleuch, W.; Wali, A.; Alimi, A.M. Neural congestion prediction system for trip modelling in heterogeneous spatio-temporal patterns. Int. J. Syst. Sci. 2020, 51, 1373–1391. [Google Scholar] [CrossRef]
- Zhu, S.X.; Ding, R.Y.; Zhang, M.H.; Hentenryck, P.V.; Xie, Y. Spatio-temporal point processes with attention for traffic congestion event modeling. IEEE Trans. Intell. Transp. Syst. 2021, 23, 7298–7309. [Google Scholar] [CrossRef]
- Yue, W.W.; Li, C.L.; Chen, Y.; Duan, P.B.; Mao, G.Q. What Is the Root Cause of Congestion in Urban Traffic Networks: Road Infrastructure or Signal Control? IEEE Trans. Intell. Transp. Syst. 2021, 23, 8662–8679. [Google Scholar] [CrossRef]
- Chiabaut, N.; Faitout, R. Traffic congestion and travel time prediction based on historical congestion maps and identification of consensual days. Transp. Res. Pt. C-Emerg. Technol. 2021, 124, 102920. [Google Scholar] [CrossRef]
- Mehdi, M.Z.; Kammoun, H.M.; Benayed, N.G.; Sellami, D.; Masmoudi, A.D. Entropy-Based Traffic Flow Labeling for CNN-Based Traffic Congestion Prediction from Meta-Parameters. IEEE Access 2022, 10, 16123–16133. [Google Scholar] [CrossRef]
- Wu, Y.X.; Lin, Y.L.; Hu, R.; Wang, Z.L.; Zhao, B.; Yao, Z.H. Modeling and Simulation of Traffic Congestion for Mixed Traffic Flow with Connected Automated Vehicles: A Cell Transmission Model Approach. J. Adv. Transp. 2022, 2022, 8348726. [Google Scholar] [CrossRef]
- Jiang, P.; Liu, Z.K.; Zhang, L.F.; Wang, J.Z. Advanced traffic congestion early warning system based on traffic flow forecasting and extenics evaluation. Appl. Soft. Comput. 2022, 118, 108544. [Google Scholar] [CrossRef]
- Maniccam, S. Adaptive decentralized congestion avoidance in two-dimensional traffic. Physica A 2006, 363, 512–526. [Google Scholar] [CrossRef]
- Yu, X.H.; Xiong, S.W.; He, Y.; Wong, W.E.; Zhao, Y. Research on campus traffic congestion detection using BP neural network and Markov model. J. Inf. Secur. Appl. 2016, 31, 54–60. [Google Scholar] [CrossRef]
- Pi, M.Y.; Yeon, H.; Son, H.; Jang, Y. Visual cause analytics for traffic congestion. IEEE Trans. Vis. Comput. Graph. 2019, 27, 2186–2201. [Google Scholar] [CrossRef]
- ShirMohammadi, M.M.; Esmaeilpour, M. The traffic congestion analysis using traffic congestion index and artificial neural network in main streets of electronic city (case study: Hamedan city). Program. Comput. Softw. 2020, 46, 433–442. [Google Scholar] [CrossRef]
- Gan, H.C.; Wei, J.; Wang, G. A generic work zone evaluation tool driven by a macroscopic traffic simulation model. Int. J. Mob. Commun. 2021, 19, 1–21. [Google Scholar] [CrossRef]
- Wang, R.M.; Xu, Z.G.; Zhao, X.M.; Hu, J.C. V2V-based method for the detection of road traffic congestion. IET Intell. Transp. Syst. 2019, 13, 880–885. [Google Scholar] [CrossRef]
- Harrou, F.; Zeroual, A.; Sun, Y. Traffic congestion monitoring using an improved kNN strategy. Measurement 2020, 156, 107534. [Google Scholar] [CrossRef]
- Yong, L.; Liu, Y.L.; Zou, K. Research on the critical value of traffic congestion propagation based on coordination game. Procedia Eng. 2016, 137, 754–761. [Google Scholar] [CrossRef][Green Version]
- Fei, W.P.; Song, G.H.; Zhang, F.; Gao, Y.; Yu, L. Practical approach to determining traffic congestion propagation boundary due to traffic incidents. J. Cent. South Univ. 2017, 24, 413–422. [Google Scholar] [CrossRef]
- Shan, Z.Y.; Pan, Z.G.; Li, F.W.; Xu, H.H. Visual analytics of traffic congestion propagation path with large scale camera data. CHINESE J. Election. 2018, 27, 934–941. [Google Scholar] [CrossRef]
- Chen, Y.T.; Mao, J.N.; Zhang, Z.; Huang, H.; Lu, W.K.; Yan, Q.P.; Liu, L. A quasi-contagion process modeling and characteristic analysis for real-world urban traffic network congestion patterns. Physica A 2022, 603, 127729. [Google Scholar] [CrossRef]
- Liu, Y.; Yan, X.D.; Wang, Y.; Yang, Z.; Wu, J.W. Grid mapping for spatial pattern analyses of recurrent urban traffic congestion based on taxi GPS sensing data. Sustainability 2017, 9, 533. [Google Scholar] [CrossRef]
- Han, F.; Xie, R.; Lai, M. Traffic density, congestion externalities, and urbanization in China. Spat. Econ. Anal. 2018, 13, 400–421. [Google Scholar] [CrossRef]
- Li, C.L.; Yue, W.W.; Mao, G.Q.; Xu, Z.G. Congestion propagation based bottleneck identification in urban road networks. IEEE Trans. Veh. Technol. 2020, 69, 4827–4841. [Google Scholar] [CrossRef]
- Yan, C.D.; Wei, X.B.; Liu, X.; Liu, Z.G.; Guo, J.X.; Li, Z.W.; Lu, Y.; He, X.H. A new method for real-time evaluation of urban traffic congestion: A case study in Xi’an, China. Geocarto Int. 2020, 35, 1033–1048. [Google Scholar] [CrossRef]
- Moyano, A.; Stępniak, M.; Moya-Gómez, B.; García-Palomares, J.C. Traffic congestion and economic context: Changes of spatiotemporal patterns of traffic travel times during crisis and post-crisis periods. Transportation. 2021, 48, 3301–3324. [Google Scholar] [CrossRef] [PubMed]
- Shi, Y.; Wang, D.; Tang, J.B.; Deng, M.; Liu, H.M.; Liu, B.J. Detecting spatiotemporal extents of traffic congestion: A density-based moving object clustering approach. Int. J. Geogr. Inf. Sci. 2021, 35, 1449–1473. [Google Scholar] [CrossRef]
- Li, J.C.; Ma, M.Q.; Xia, X.; Ren, W.H. The Spatial Effect of Shared Mobility on Urban Traffic Congestion: Evidence from Chinese Cities. Sustainability 2021, 13, 14065. [Google Scholar] [CrossRef]
- Wei, X.X.; Ren, Y.T.; Shen, L.Y.; Shu, T.H. Exploring the spatiotemporal pattern of traffic congestion performance of large cities in China: A real-time data based investigation. Environ. Impact Assess. Rev. 2022, 95, 106808. [Google Scholar] [CrossRef]
- Serok, N.; Havlin, S.; Lieberthal, E.B. Identification, cost evaluation, and prioritization of urban traffic congestions and their origin. Sci. Rep. 2022, 12, 13026. [Google Scholar] [CrossRef] [PubMed]
- Qin, J.Y.; Mei, G.; Xiao, L. Building the traffic flow network with taxi GPS trajectories and its application to identify urban congestion areas for traffic planning. Sustainability 2020, 13, 266. [Google Scholar] [CrossRef]
- Han, X.; Shen, G.J.; Yang, X.; Kong, X.J. Congestion recognition for hybrid urban road systems via digraph convolutional network. Transp. Res. Pt. C-Emerg. Technol. 2020, 121, 102877. [Google Scholar] [CrossRef]
- Wang, W.X.; Guo, R.J.; Yu, J. Research on road traffic congestion index based on comprehensive parameters: Taking Dalian city as an example. Adv. Mech. Eng. 2018, 10, 482. [Google Scholar] [CrossRef]
- Yang, S.X.; Ji, Y.; Zhang, D.; Fu, J. Equilibrium between road traffic congestion and low-carbon economy: A case study from Beijing, China. Sustainability 2019, 11, 219. [Google Scholar] [CrossRef]
- Loo, B.P.Y.; Huang, Z.R. Delineating traffic congestion zones in cities: An effective approach based on GIS. J. Transp. Geogr. 2021, 94, 103108. [Google Scholar] [CrossRef]
- Pei, Y.L.; Cai, X.X.; Song, K.K.; Liu, R.; Li, J. Identification method of main road traffic congestion situation in cold-climate cities based on potential energy theory and GPS data. Symmetry 2022, 14, 227. [Google Scholar] [CrossRef]
- Huang, Y.S.; Weng, Y.S.; Wu, W.M.; Chen, B.Y. Control strategies for solving the problem of traffic congestion. IET Intell. Transp. Syst. 2016, 10, 642–648. [Google Scholar] [CrossRef]
- Afrin, T.; Yodo, N. A survey of road traffic congestion measures towards a sustainable and resilient transportation system. Sustainability 2020, 12, 4660. [Google Scholar] [CrossRef]
- Zhang, W. Countermeasures for urban traffic congestion in China from the perspective of system dynamics. Comput. Intell. Neurosci. 2022, 2022, 3509902. [Google Scholar] [CrossRef] [PubMed]
- Salarvandian, F.; Dijst, M.; Helbich, M. Impact of traffic zones on mobility behavior in Tehran, Iran. J. Transp. Land Use 2017, 10, 965–982. [Google Scholar] [CrossRef][Green Version]
- Zhang, G.L.; Jia, H.F.; Yang, L.L.; Li, J.L.; Yang, J.L. Research on a model of node and path selection for traffic network congestion evacuation based on complex network theory. IEEE Access. 2019, 8, 7506–7517. [Google Scholar] [CrossRef]
- Zhang, H.G.; Wang, Z.; Tang, M.Z.; Lv, X.S.; Luo, H.; Liu, Y.N. Dynamic Memory Memetic Algorithm for VRPPD With Multiple Arrival Time and Traffic Congestion Constraints. IEEE Access. 2020, 8, 167537–167554. [Google Scholar] [CrossRef]
- Zhang, J.; Lu, J.Q.; Cao, J.D.; Huang, W.; Guo, J.H.; Wei, Y. Traffic congestion pricing via network congestion game approach. Discret. Contin. Dyn. Syst.-Ser. S. 2021, 14, 1553–1567. [Google Scholar] [CrossRef]
- Dimon, C.; Teme, M.; Popescu, D. Optimization of Road Traffic Using Intelligent Traffic Light Systems. Int. J. Comput. Commun. Control. 2022, 17, 4886. [Google Scholar] [CrossRef]
- Akhtar, M.; Moridpour, S. A review of traffic congestion prediction using artificial intelligence. J. Adv. Transp. 2021, 2021, 8878011. [Google Scholar] [CrossRef]
- Ma, C.X.; Zhou, J.B.; Xu, X.C.; Xu, J. Evolution regularity mining and gating control method of urban recurrent traffic congestion: A literature review. J. Adv. Transp. 2020, 2020, 5261580. [Google Scholar] [CrossRef]
- Cvetek, D.; Muštra, M.; Jelušić, N.; Tišljarić, L. A survey of methods and technologies for congestion estimation based on multisource data fusion. Appl. Sci. 2021, 11, 2306. [Google Scholar] [CrossRef]

| Rank | Region | Functional Positioning | Peak Congestion Delay Index | Peak Average Travel Speed (km/h) |
|---|---|---|---|---|
| 1 | Nanming District | Residential, Commercial Areas | 1.77 | 25.69 |
| 2 | Yunyan District | Residential, Commercial Areas | 1.67 | 28.46 |
| 3 | Guanshan Lake District | Technology, Education Area | 1.66 | 27.72 |
| 4 | Wudang District | Tourism, Industrial Area | 1.62 | 30.27 |
| 5 | Huaxi District | Tourism, Education Area | 1.51 | 33.03 |
| 6 | Baiyun District | Industrial Area | 1.48 | 29.96 |
| Urban Transportation System Division | Traffic Congestion Zoning Level Relationship | Low Value Zone | From Low to Medium Value Zone | Medium Zone | From Medium to High Value Zone | High Value Zone |
|---|---|---|---|---|---|---|
| Representative Colors |  Green Green |  Blue Blue |  Yellow Yellow |  Orange Orange |  Red Red | |
| Transportation System Vulnerability | The relationship between the actual traffic volume and the traffic volume in the free flow case | |||||
| Relationship between the length of road congestion and the actual length of the road | ||||||
| The relationship between the actual travel time and the travel time in the free-flow case | ||||||
| The relationship between the average travel speed and the free-flowing vehi-cle speed | ||||||
| Transportation System Resilience | Relationship between pavement mass index and free flow under con-gestion and | |||||
| Relationship between the number of lanes in congestion and the number of lanes in free flow | ||||||
| Traffic Congestion Rating Index | ||||||
| Rank | Traffic Volume (pcu/h) | Severe Congestion Miles (km) | Delay Time (min) | Average Running Speed (km/h) | Road Quality Index | Number of Lanes | Traffic Congestion Zoning Level |
|---|---|---|---|---|---|---|---|
| 1 | 5260 | 3.30 | 6.93 | 30.56 | 0.96 | 3.28 | Medium |
| 2 | 4860 | 2.91 | 8.32 | 31.36 | 0.97 | 2.98 | From low to medium |
| 3 | 7862 | 4.93 | 13.58 | 27.23 | 0.90 | 4.44 | High |
| 4 | 8926 | 5.62 | 16.26 | 25.89 | 0.87 | 4.93 | High |
| 5 | 6842 | 4.56 | 9.13 | 26.31 | 0.91 | 4.15 | From medium to high |
| 6 | 5968 | 3.63 | 8.16 | 30.03 | 0.95 | 3.48 | Medium |
| 7 | 7986 | 5.04 | 13.83 | 27.46 | 0.89 | 4.52 | High |
| 8 | 7536 | 4.81 | 12.76 | 27.85 | 0.90 | 4.36 | From medium to high |
| 9 | 6935 | 4.26 | 10.62 | 28.59 | 0.92 | 3.98 | From medium to high |
| 10 | 5968 | 3.76 | 8.61 | 29.93 | 0.94 | 3.65 | Medium |
| 11 | 4569 | 2.75 | 4.59 | 31.55 | 0.98 | 2.86 | From low to medium |
| 12 | 5623 | 3.12 | 6.10 | 30.91 | 0.96 | 3.15 | Medium |
| 13 | 4968 | 2.76 | 4.26 | 31.86 | 0.98 | 2.89 | Low |
| 14 | 5856 | 3.59 | 7.89 | 30.13 | 0.95 | 3.48 | Medium |
| 15 | 4762 | 2.86 | 5.31 | 31.59 | 0.98 | 2.96 | From low to medium |
| 16 | 7156 | 4.53 | 11.36 | 28.39 | 0.91 | 4.15 | From medium to high |
| 17 | 6423 | 3.98 | 9.53 | 29.42 | 0.93 | 3.76 | Medium |
| 18 | 6692 | 4.19 | 10.2 | 28.87 | 0.92 | 3.91 | From medium to high |
| 19 | 7569 | 4.79 | 14.13 | 27.53 | 0.90 | 4.34 | From medium to high |
| 20 | 8123 | 5.43 | 15.87 | 26.38 | 0.88 | 4.76 | High |
| Rank | Real Level | Competition Layer Topology | |||
|---|---|---|---|---|---|
| Four Layers | Five Layers | Six Layers | Seven Layers | ||
| 1 | Medium | From medium-medium to high | From medium-medium to high | Medium | From medium-medium to high |
| 2 | From low to medium | From low to medium | From low to medium | From low to medium | From low to medium |
| 3 | High | High | From medium to high-high | High | High |
| 4 | High | From medium to high-high | High | High | From medium to high-high |
| 5 | From medium to high | From medium to high-high | From medium to high-high | From medium to high | From medium to high |
| 6 | Medium | From medium-medium to high | Medium | Medium | From medium-medium to high |
| 7 | High | High | From medium to high-high | High | High |
| 8 | From medium to high | From medium to high-high | From medium to high-high | From medium to high | From medium to high |
| 9 | From medium to high | From medium to high-high | From medium to high | From medium to high | From medium to high-high |
| 10 | Medium | From medium-medium to high | From medium-medium to high | Medium | From medium-medium to high |
| 11 | From low to medium | From low to medium-medium | From low to medium-medium | From low to medium | From low to medium-medium |
| 12 | Medium | From medium-medium to high | From medium-medium to high | Medium | Medium |
| 13 | Low | From low-low to medium | From low-low to medium | Low | * |
| 14 | Medium | From medium-medium to high | From medium-medium to high | Medium | From medium-medium to high |
| 15 | From low to medium | From low to medium-medium | From low to medium-medium | From low to medium | From low to medium-medium |
| 16 | From medium to high | From medium to high-high | From medium to high-high | From medium to high | From medium to high |
| 17 | Medium | Medium | From medium-medium to high | From medium-medium to high | From medium-medium to high |
| 18 | From medium to high | From medium to high | From medium to high-high | From medium to high | From medium to high-high |
| 19 | From medium to high | From medium to high-high | From medium to high | From medium to high | From medium to high |
| 20 | High | High | High | High | From medium to high-high |
Publisher’s Note: MDPI stays neutral with regard to jurisdictional claims in published maps and institutional affiliations. |
© 2022 by the authors. Licensee MDPI, Basel, Switzerland. This article is an open access article distributed under the terms and conditions of the Creative Commons Attribution (CC BY) license (https://creativecommons.org/licenses/by/4.0/).
Share and Cite
Zhao, X.; Hu, L.; Wang, X.; Wu, J. Study on Identification and Prevention of Traffic Congestion Zones Considering Resilience-Vulnerability of Urban Transportation Systems. Sustainability 2022, 14, 16907. https://doi.org/10.3390/su142416907
Zhao X, Hu L, Wang X, Wu J. Study on Identification and Prevention of Traffic Congestion Zones Considering Resilience-Vulnerability of Urban Transportation Systems. Sustainability. 2022; 14(24):16907. https://doi.org/10.3390/su142416907
Chicago/Turabian StyleZhao, Xueting, Liwei Hu, Xingzhong Wang, and Jiabao Wu. 2022. "Study on Identification and Prevention of Traffic Congestion Zones Considering Resilience-Vulnerability of Urban Transportation Systems" Sustainability 14, no. 24: 16907. https://doi.org/10.3390/su142416907
APA StyleZhao, X., Hu, L., Wang, X., & Wu, J. (2022). Study on Identification and Prevention of Traffic Congestion Zones Considering Resilience-Vulnerability of Urban Transportation Systems. Sustainability, 14(24), 16907. https://doi.org/10.3390/su142416907


