1. Introduction
Traffic accidents have always been one of the most essential public security issues. Statistics from the World Health Organization (WHO) show that more than 1.25 million people die from traffic accidents annually [
1]. Currently, traffic accidents have become the main cause of casualties. Thus, reducing the occurrence of traffic accidents has become a crucial social concern [
2]. The purpose of accident prediction is to know the development tendency of traffic accidents, reasonably evaluate the feasibility and implementation effect of traffic safety measures, and effectively reduce the risk of accidents. The goal is to accurately and timely predict traffic accidents in local areas. Therefore, mastering and predicting the potential for traffic accidents in road networks has become a key branch in the field of traffic safety. Precise prevention and control can not only enable the traffic police to investigate the potential hazards of relevant roads or intersections in advance but also to take timely and effective actions in case of emergencies. In such cases, the safety of travelers could be maximized, and the safe, smooth, and efficient operation of the road network could be guaranteed.
However, currently, the early warning and prevention of traffic accidents rely on the simple statistics of historical accident data or on the experience of the traffic police [
3,
4]. It is still impossible to comprehensively and reasonably find out the potential locations with high accident risks in the road network and take prevention measures. The prediction of traffic accidents is still challenging and has been a research focus. On the other hand, the rapid development of data collection and the popularity of big data platforms make it possible to collect and record massive data related to traffic accidents, laying a reliable data foundation for accident prediction [
5].
Many scholars have conducted related research on this issue. Lim et al. [
6] realize a warning system for vehicle speed and collision time by using a nested Kalman filter and the YOLO (You Only Look Once) vehicle detection algorithm. However, the false alarm rate still needs to be reduced. Aung et al. [
7] regard collision risk as a dependent variable and treat multiple factors, including driving speed, weather conditions, location, vehicle density, and driver fatigue degree, as independent variables. They further chose a hidden Markov model to model the correlation between these independent variables and the dependent variables. Comparative experiments show that the proposed method has better performance in terms of sensitivity and accuracy. Combined with traffic accidents, weather information, the height difference between the accident site and the surroundings, and whether there are tunnels and bridges, Kim et al. [
8] use models such as random forest, XGBoost, neural networks, and logical regression to deeply mine the data and predict the risk of accidents caused by weather conditions in the winter. But the accuracy of various influencing factors remains to be improved. Dias et al. [
9] simultaneously adopt machine learning and neural networks to predict accident frequency within the predefined time range. Experiments show that the effect obtained by a neural network is the best. Further research has found that rainfall is the meteorological factor with the highest probability of increasing accident risk, and the time period with the highest probability of accidents is between 17 and 20 in the evening. However, data collection is still a bottleneck that needs to be broken in this study.
Generally, traffic accident prediction can be described as a classification issue or a regression issue. For example, some scholars aim to predict whether accidents will occur in a specific spot (e.g., a road section) during a certain period (e.g., hours, days) [
10,
11,
12]. Others use regression models to predict the number of accidents at a given time and place [
13,
14]. However, in the above-mentioned work, classical data mining methods are used while the uniqueness of traffic accident data is neglected, such as spatial heterogeneity and temporal auto-correlation, resulting in poor prediction results. Recently, researchers have been trying to solve this problem by using deep learning frameworks, such as convolutional neural networks. Zhao et al. [
15] construct an LSTM encod-decoder prediction model that reconstructs input sequences and predicts future sequences simultaneously. Although their method can make predictions on spatio-temporal series, the fully connected LSTM (FC-LSTM) layer adopted by their model does not take spatial correlation into account. Shi et al. [
16] propose a convolutional LSTM (ConvLSTM) and develop an end-to-end trainable model for the precipitation nowcasting issue by extending the fully connected LSTM (FC-LSTM) with convolutional structures in both input-to-state and state-to-state transitions. Experiments show that the ConvLSTM network captures spatiotemporal correlations better and consistently outperforms FC-LSTM. In later research, this issue is expressed as an image prediction issue [
17]. Specifically, the traffic risk map is generated by learning spatial characteristics from accident records and related data. These works, however, either ignore time information or select data sets with very limited characteristics. They cannot predict accidents on a larger scale with spatial heterogeneity.
Given the typical spatiotemporal characteristics of accidents, the traditional time series prediction model can no longer play a good role in the prediction of traffic accidents. It is necessary to build a more complex network to effectively capture the spatiotemporal characteristics of the data. Recently, the rapid development of deep learning, especially with the birth of U-Net and the long short-term memory network models, has provided more useful tools and models for the effective prediction of traffic accidents.
In this study, the prediction of the traffic accident is turned into the prediction of a spatiotemporal series. Meanwhile, a deep learning framework for predicting traffic accidents is proposed by adopting a bi-direction ConvLSTM U-net model. To make it more specific, the whole research area is divided into regular grids first, and then the environmental features related to traffic accidents, such as road conditions, lighting, weather, etc., are collected. These features are mapped to each grid. Finally, a Bi-direction ConvLSTM U-net network model is developed and trained to predict the probability of accidents in each grid in the near future.
The rest of this paper is organized as follows:
Section 2 introduces some preparations for the experiment. In
Section 3, the detailed implementation scheme for traffic accident prediction combined with the Bi-direction ConvLSTM U-net model is introduced in detail. In
Section 4, the training of the network model by using historical traffic accidents from the road network in Ningbo, China, and the usage of the trained model to predict accidents are introduced. Compared with the results predicted by other network models, the performance of this method is further verified. The last part is about the conclusion and assumptions.
3. Proposed Method
The issue of accident prediction is modeled in this part. The research object is described as a continuous spatiotemporal domain
S ×
T (where
is a spatial grid while
is an interval that is equally divided by the study period) and the traffic accident statistics
N (
s,
t) in this time-space domain (
N (
s,
t) is the total number of accidents in grid
s ∈
S during
t ∈
T). It is supposed that there are
P measurements in each grid. The observation values at any time can be expressed by a tensor
, where
R is the structure domain of the observed characteristics and
M and
N are the number of rows and columns of the grid, respectively. If the traffic accidents are sampled in each grid according to a fixed timestamp, a tensor sequence
will be obtained. The goal is to train a model that predicts the probability accidents occurred in grid
S in the next time span
t + 1 for each time period
t ∈
T by taking advantage of historical traffic accidents and the associated attributes. Then this issue is converted to predict the most likely data series of the same length in the near future based on the
K data series, as shown in Formula (1).
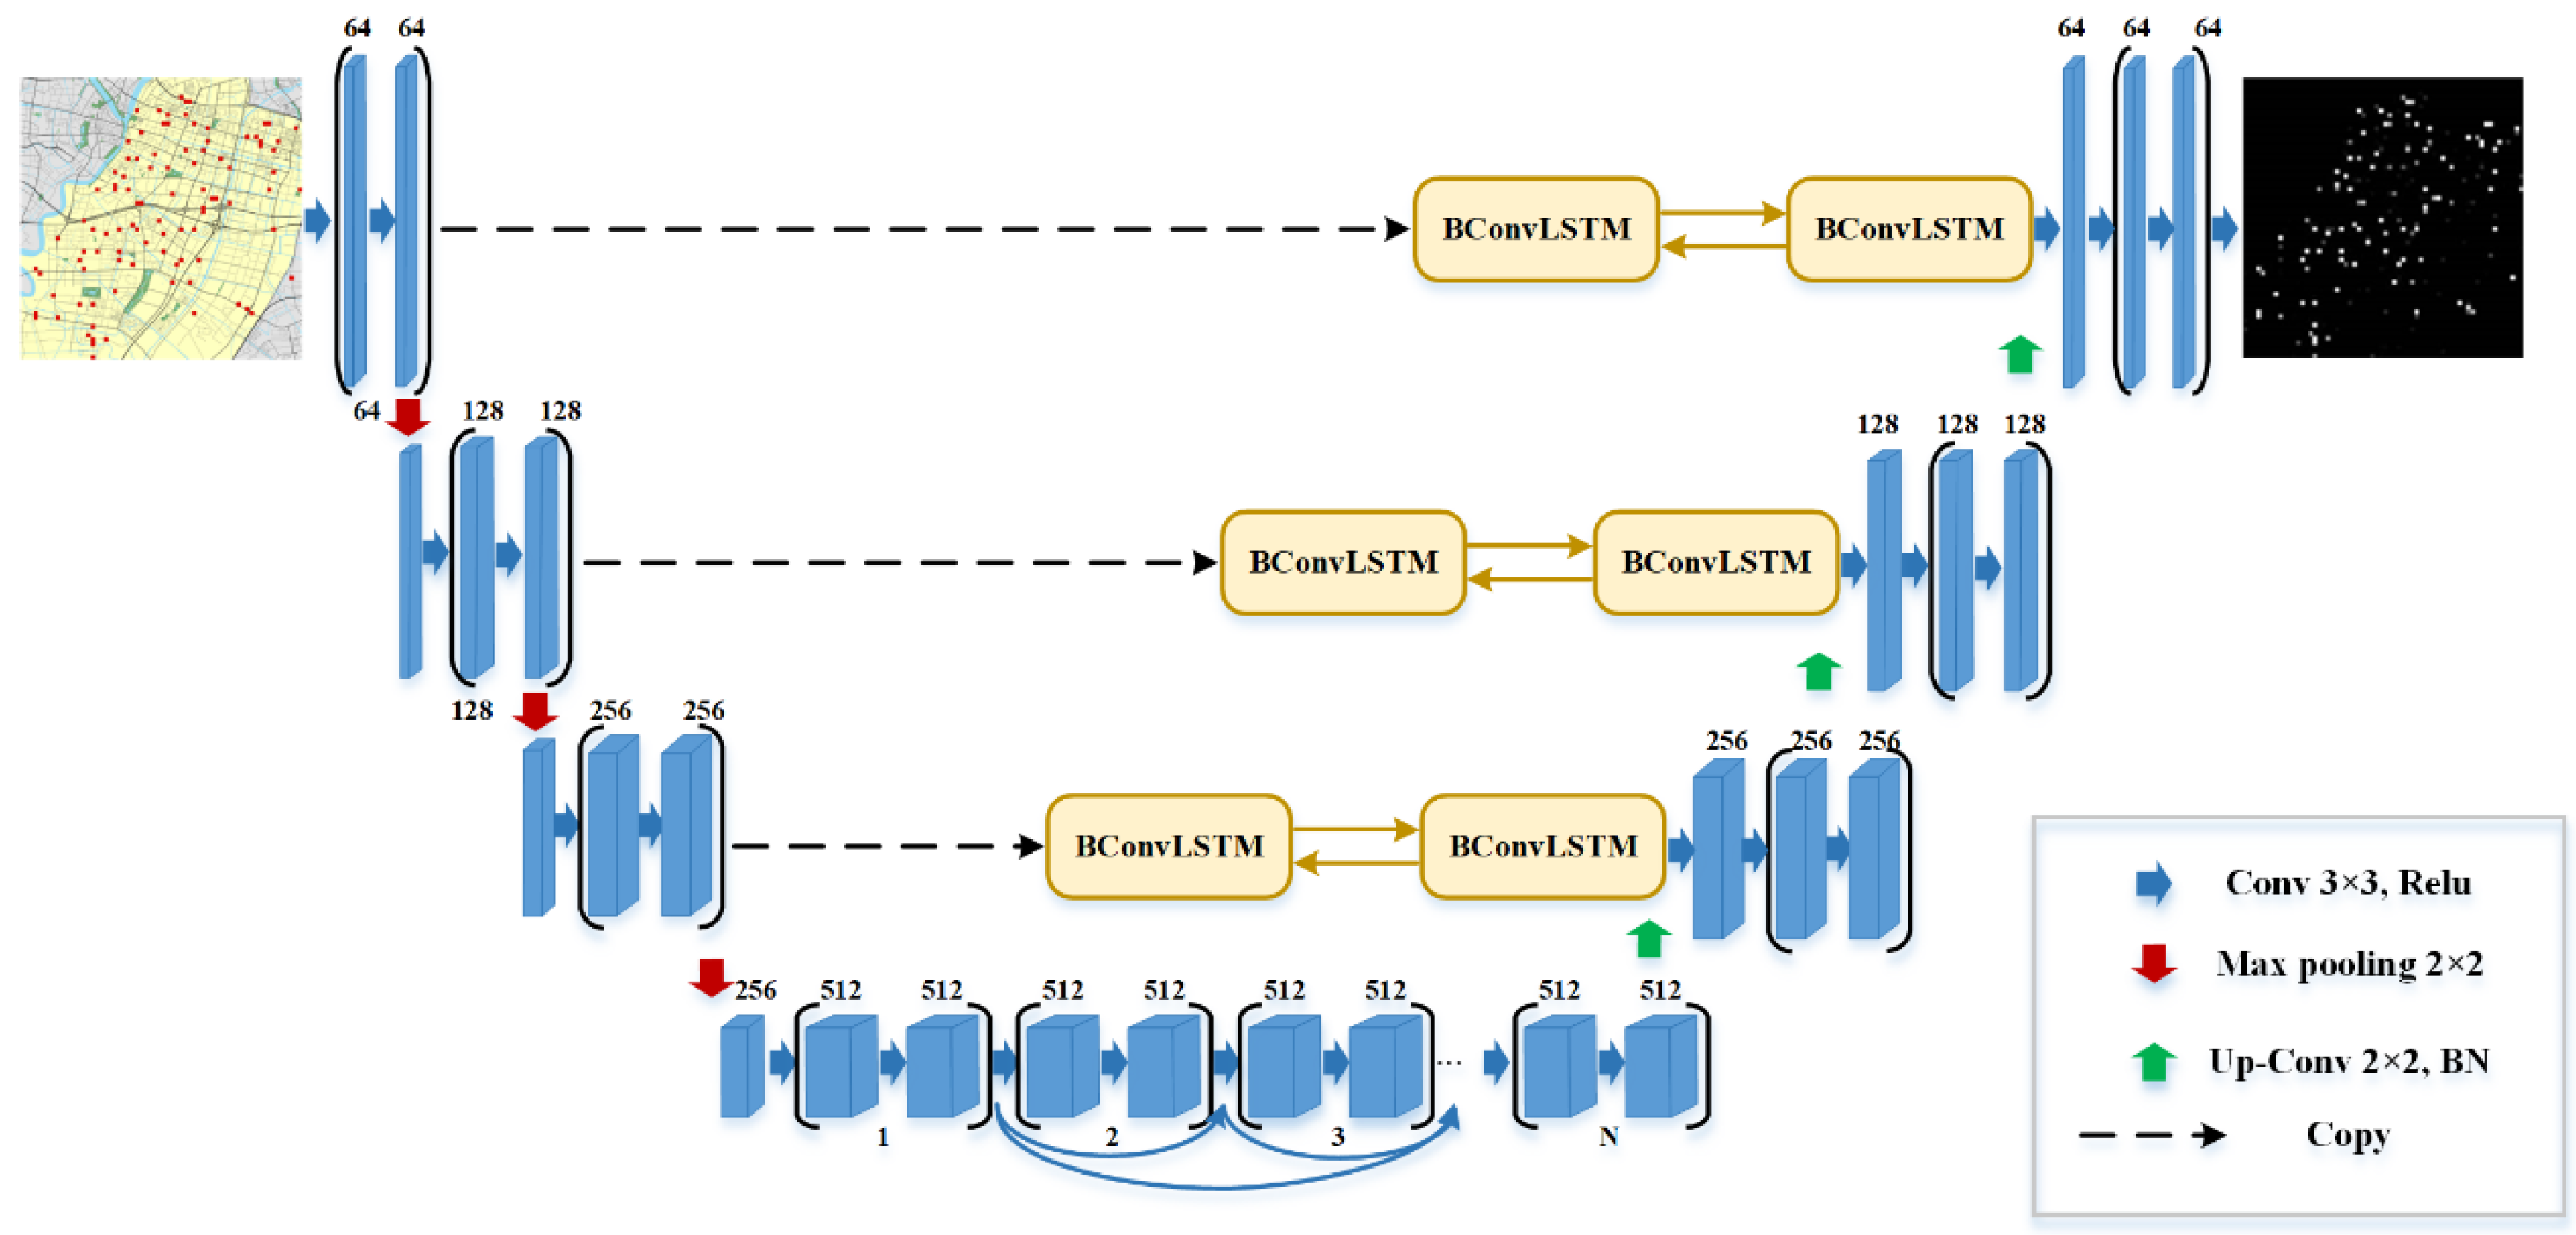
If we further regard the value of the feature in each grid as the pixel value of an image, then the feature sampled in each timestamp corresponds to a gray image. A new image data set with a time series is formed by superimposing multiple gray images in time order, as shown in
Figure 4. The issue of accident prediction naturally transforms into the issue of predicting a spatiotemporal sequence that includes both spatial and temporal structures. Our goal is to train a network model by using the image data set of this time series, and then predict the image sequence in the near future, and finally convert the predicted gray image into the probability of traffic accidents.
To sum up, short-term traffic accident prediction is essentially an issue of spatiotemporal sequence. Because of the spatial information involved, the traditional U-Net network only captures the temporal correlation but cannot effectively mine the spatial information hidden in the data. For traffic accidents, characteristics of time series and spatial information are important identifiers. Adding ConvLSTM and dense connection structures to the traditional U-Net network model can effectively capture the spatial correlation. Therefore, the BCDU-Net model can perfectly fit the spatiotemporal characteristics of the data.
4. Experiment and Analysis
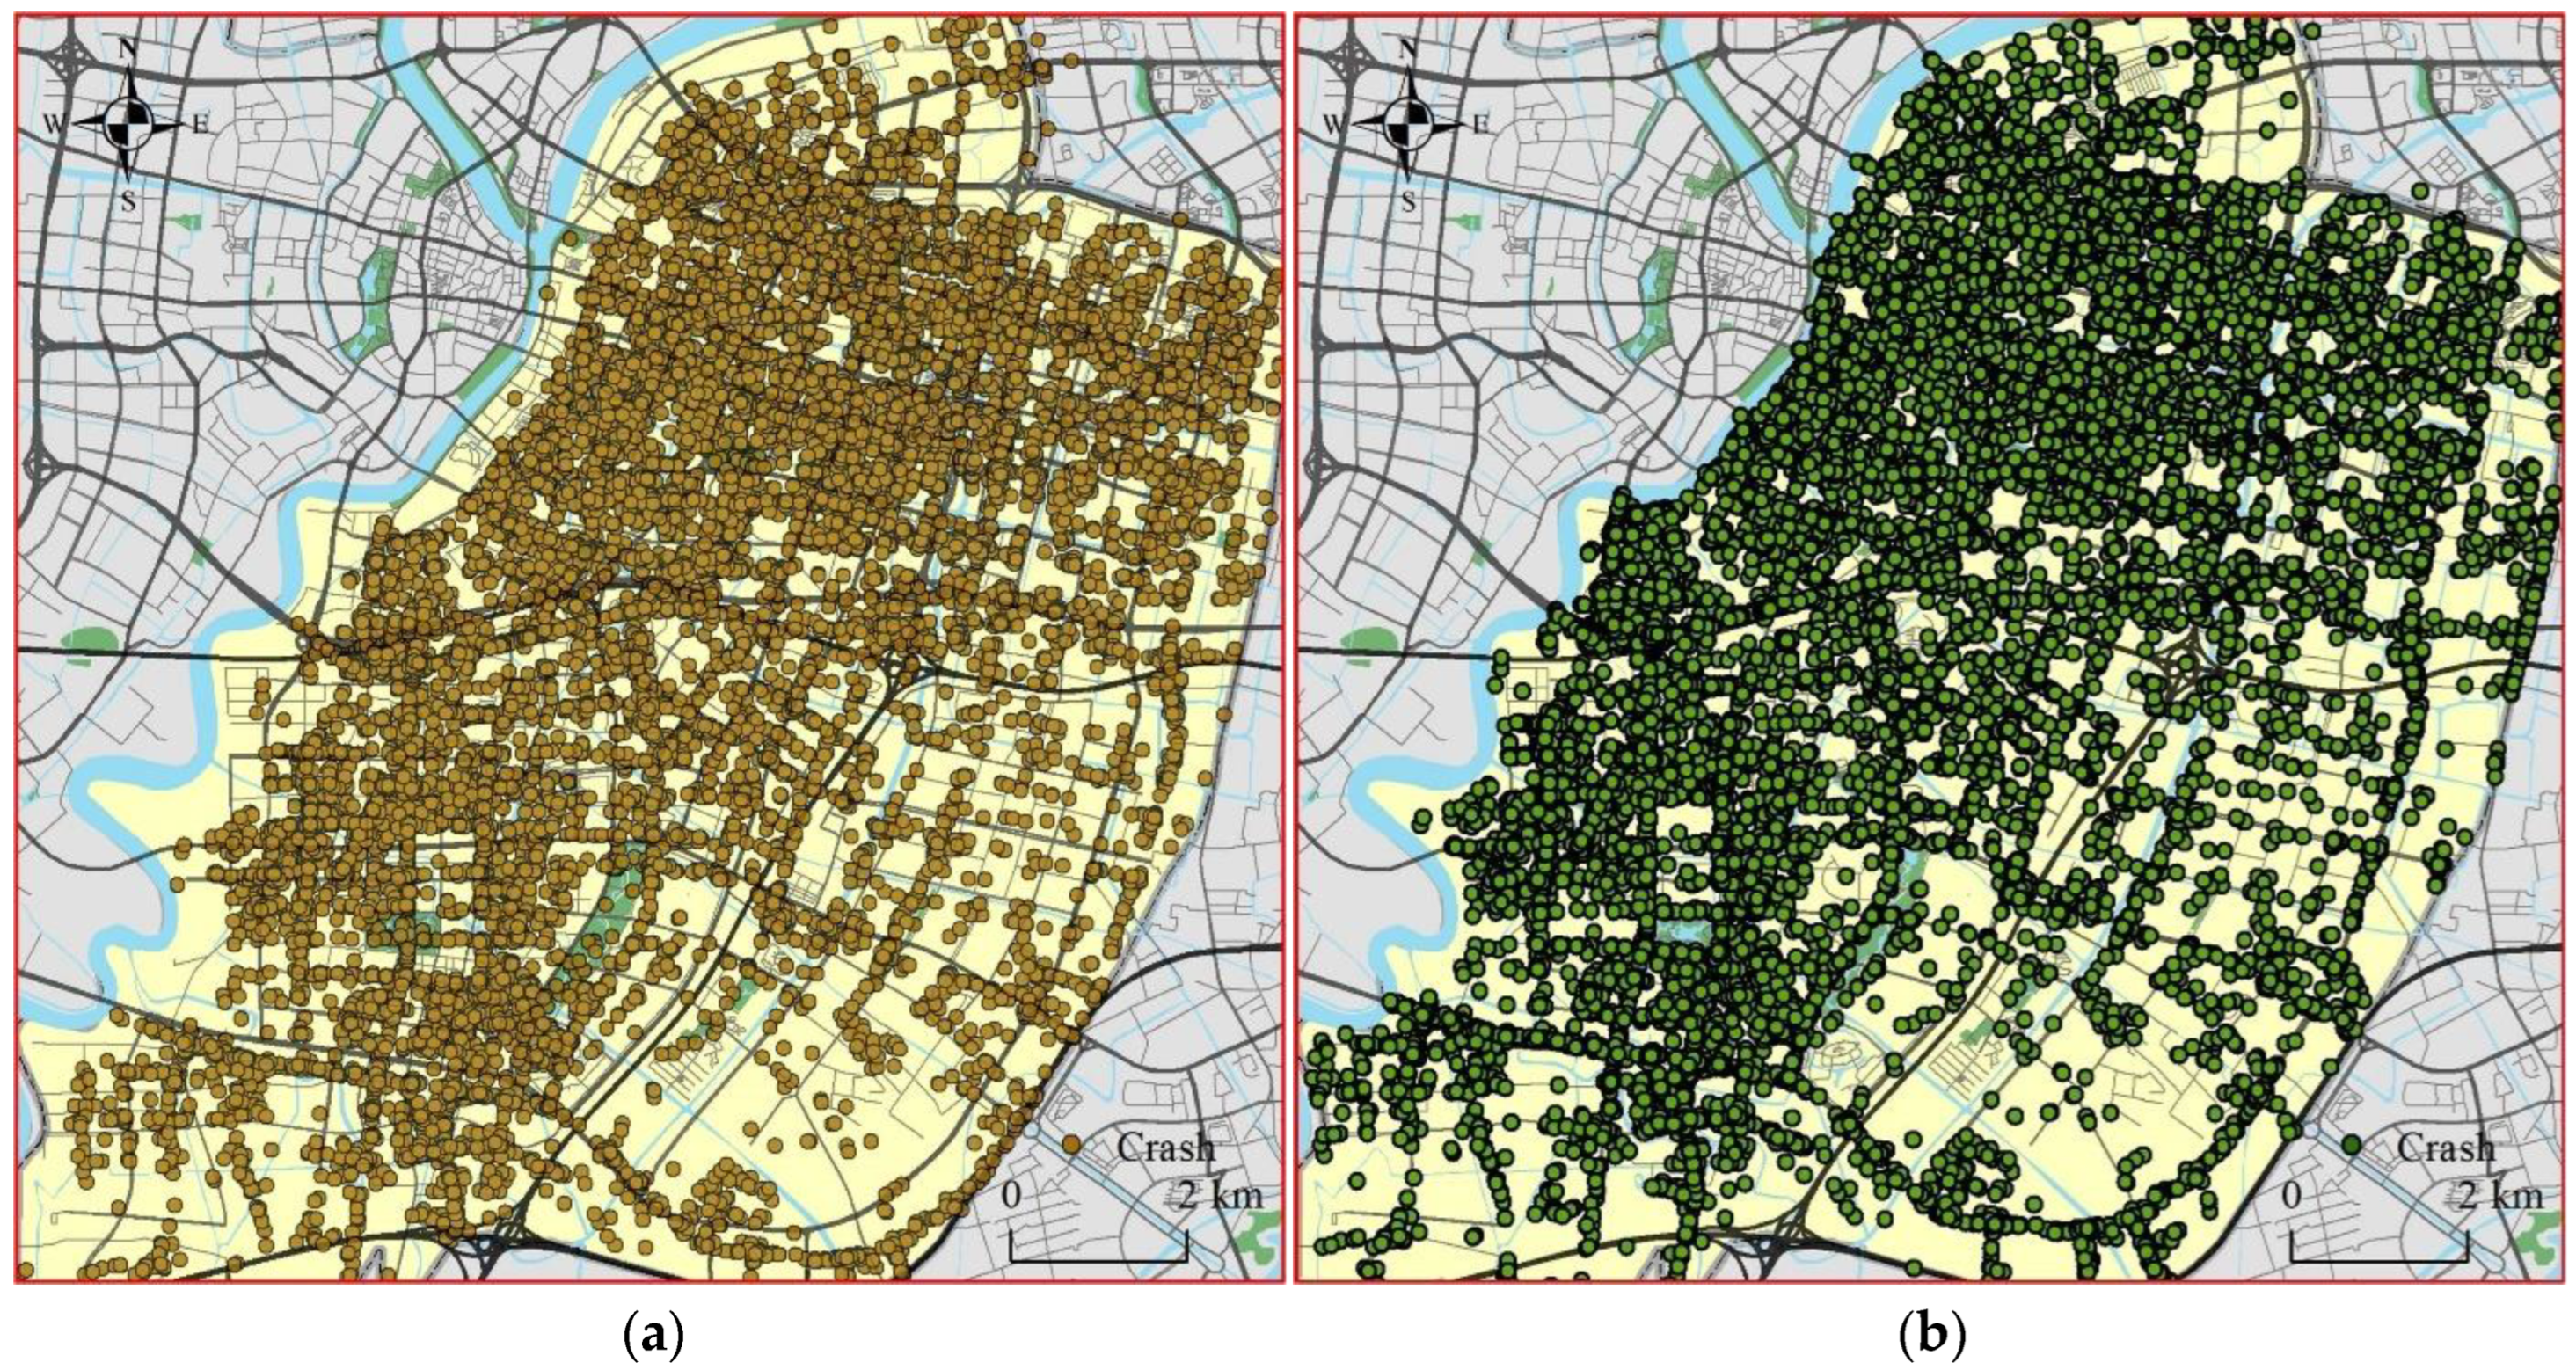
In the experiment, a regular grid with grid size of 200 m × 200 m was used to divide the core area of Yinzhou district into a 64 × 64 grid array. Then, the number of historical accidents and factors that affect the occurrence of traffic accidents are matched with the grid based on the spatial relationship. Since the occurrence of traffic accidents is affected by human travel activities, there is an obvious travel pattern that takes a day as a cycle. In this study, we choose 24 h as the length of the time stamp t and sample the number of traffic accidents in each grid within the specified time stamp. The training and testing samples with a continuous 1 + 1 day are created from the pre-processed accident data according to the time tag. The samples will be put into the BCDU-Net as a sequence for training. In other words, the accidents of the next day are predicted according to the accidents of the previous day. In this way, the entire data set is converted into 570 sequences. 90% of all data is divided into training sets, while the rest 10% into test sets. Then we use the offset with a step size of one to obtain the next input and its corresponding output circularly. Our model is implemented by Keras with a TensorFlow backend.
In our experiment, cross entropy (CE), mean square error (MSE), and root mean square error (RMSE) were adopted to evaluate the model. The definitions of these three indicators are shown in Formulas (2)–(4).
where C represents the number of categories, m is the number of samples,
is the truth, and
is the prediction.
The critical success index (CSI), false alarm rate (FAR), probability of detection (POD), and correlation metrics are employed to further evaluate the accuracy of the prediction results. CSI, FAR, and POD are commonly used indicators of precipitation forecasts in the meteorological field. We convert the predictions and the truth into a 0/1 matrix and calculate the hit cases (
H), miss cases (
M), and false prediction cases (
F). Their definitions are shown in formulas (5)–(7).
The definition of the correlation coefficient between the prediction
P and the truth
T is shown in Formula (8).
where
.
To evaluate the prediction effect of the BCDU-Net network on the accident data set, the accident data are further divided into accidents involving motor vehicles, non-motor vehicles, and single-vehicles according to their type labels. This is not only helpful for the traffic police to investigate areas prone to different types of traffic accidents, but it can also more pertinently rectify the relevant road sections and reduce the risk of accidents on the road network.
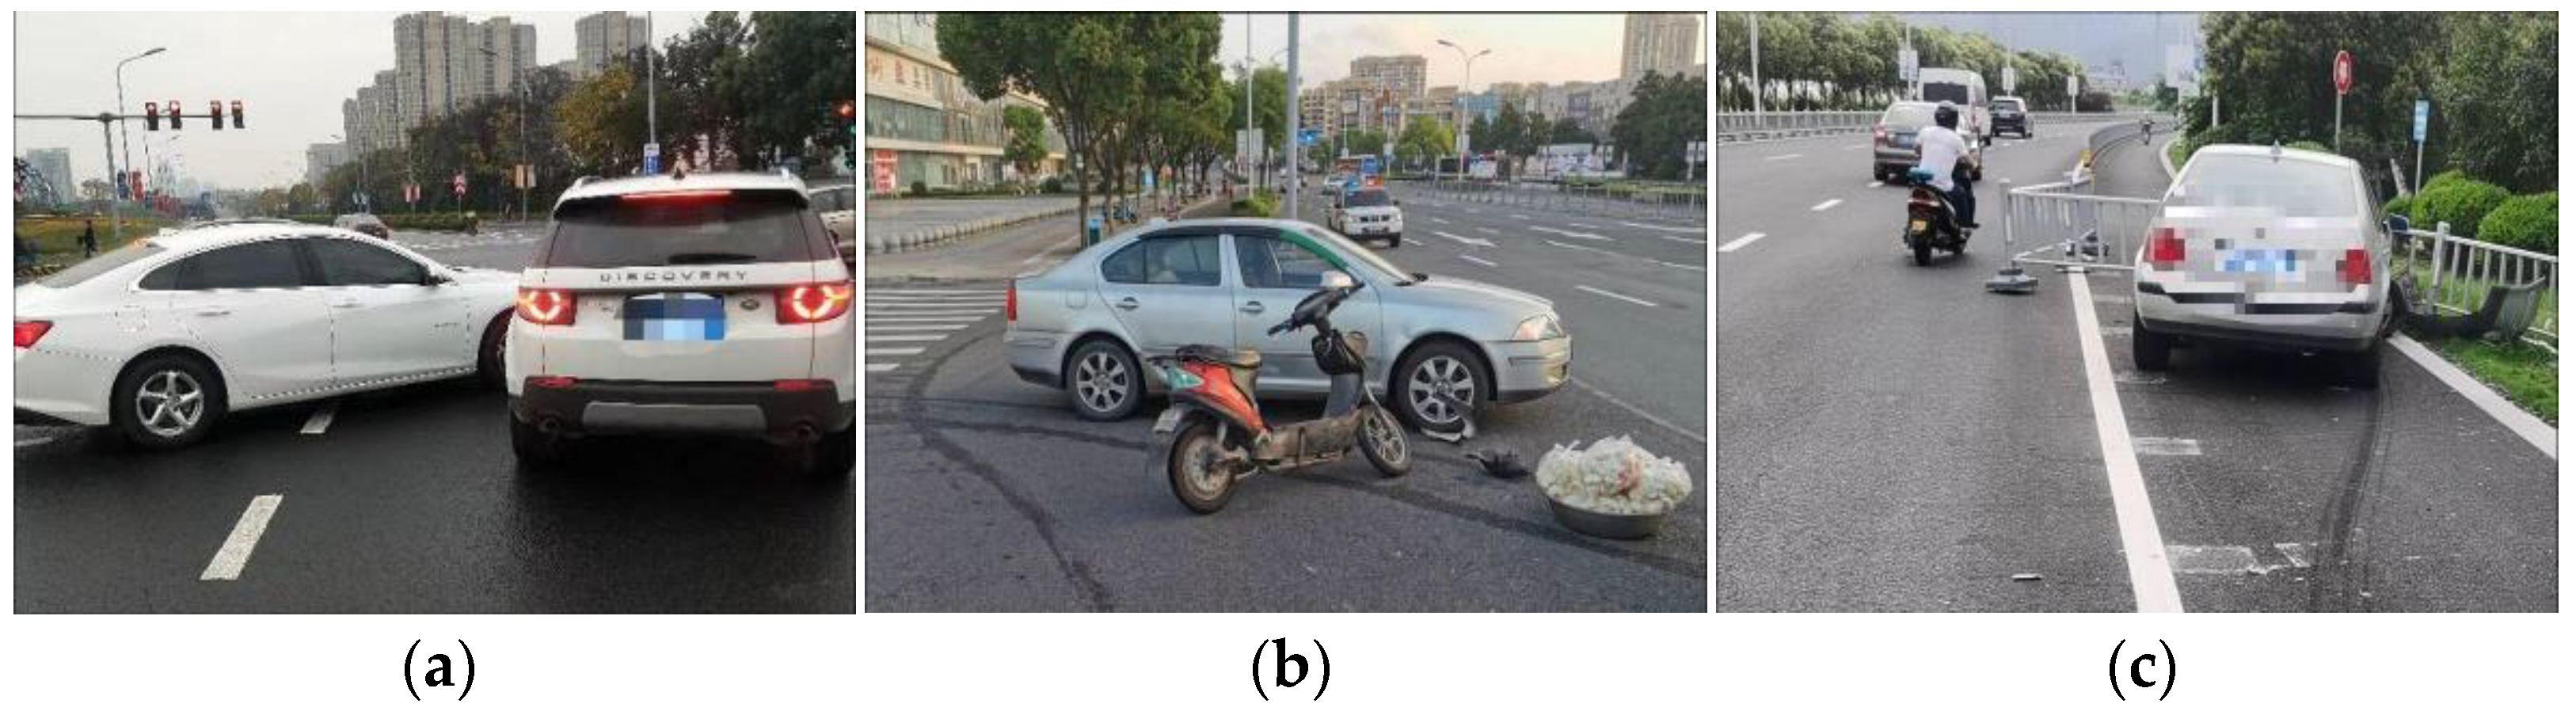
4.1. Motor Vehicle Accidents
A motor vehicle accident is an event in which a motor vehicle is involved in a collision with another motor vehicle, a pedestrian, an animal, or a stationary object.
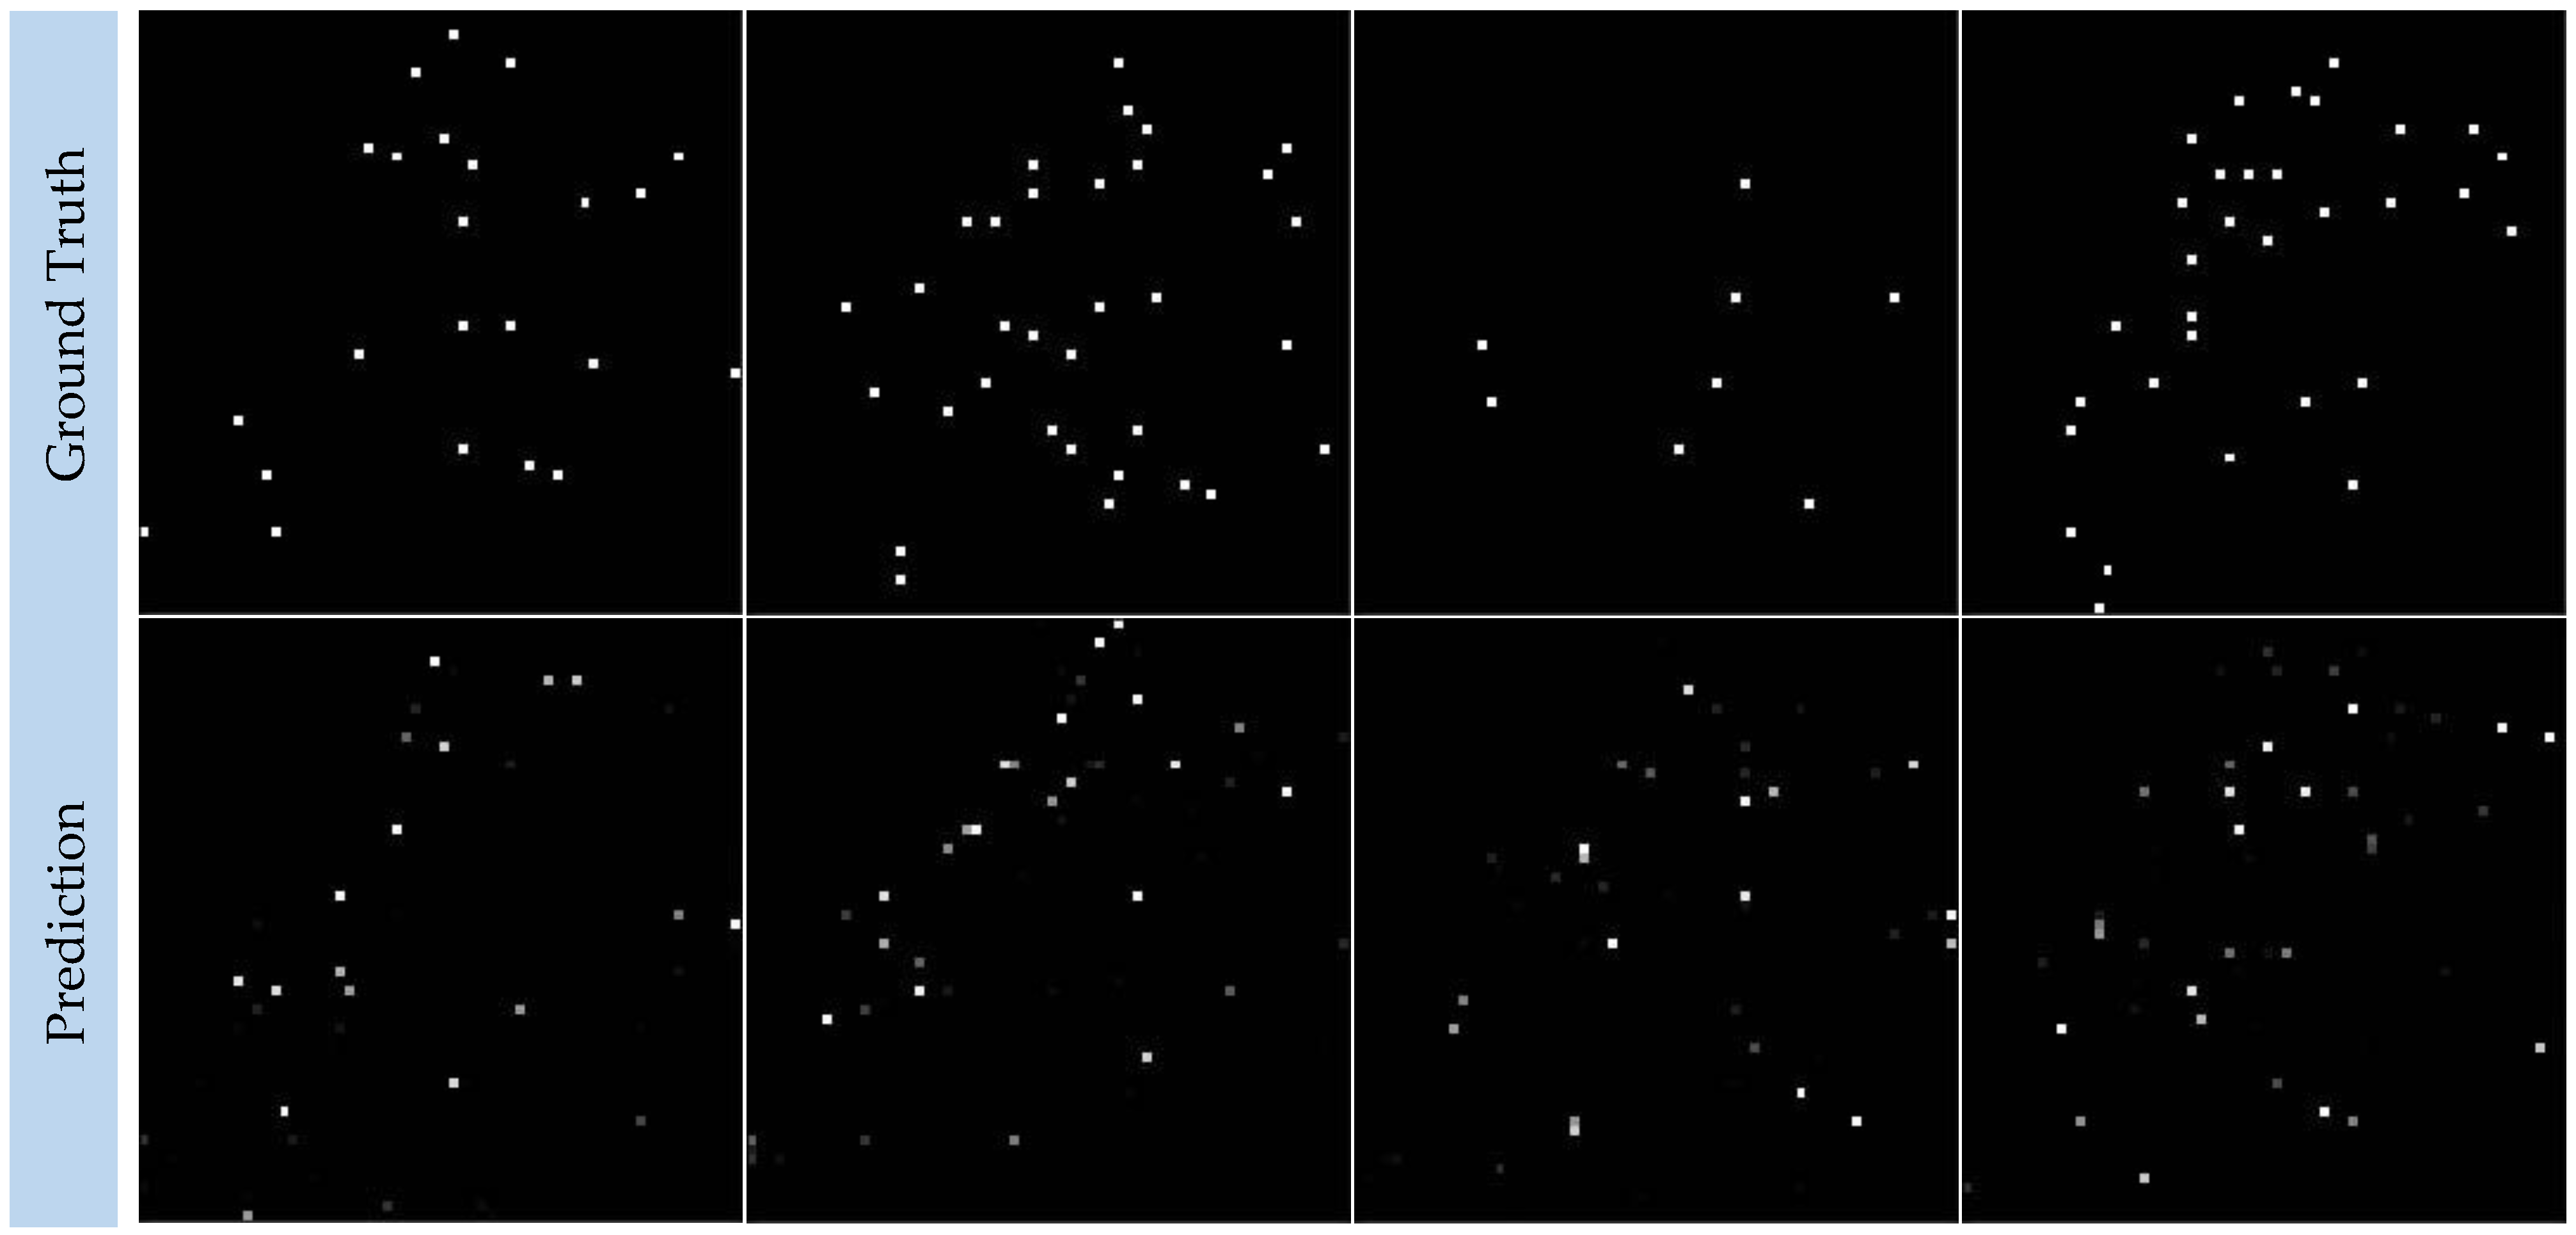
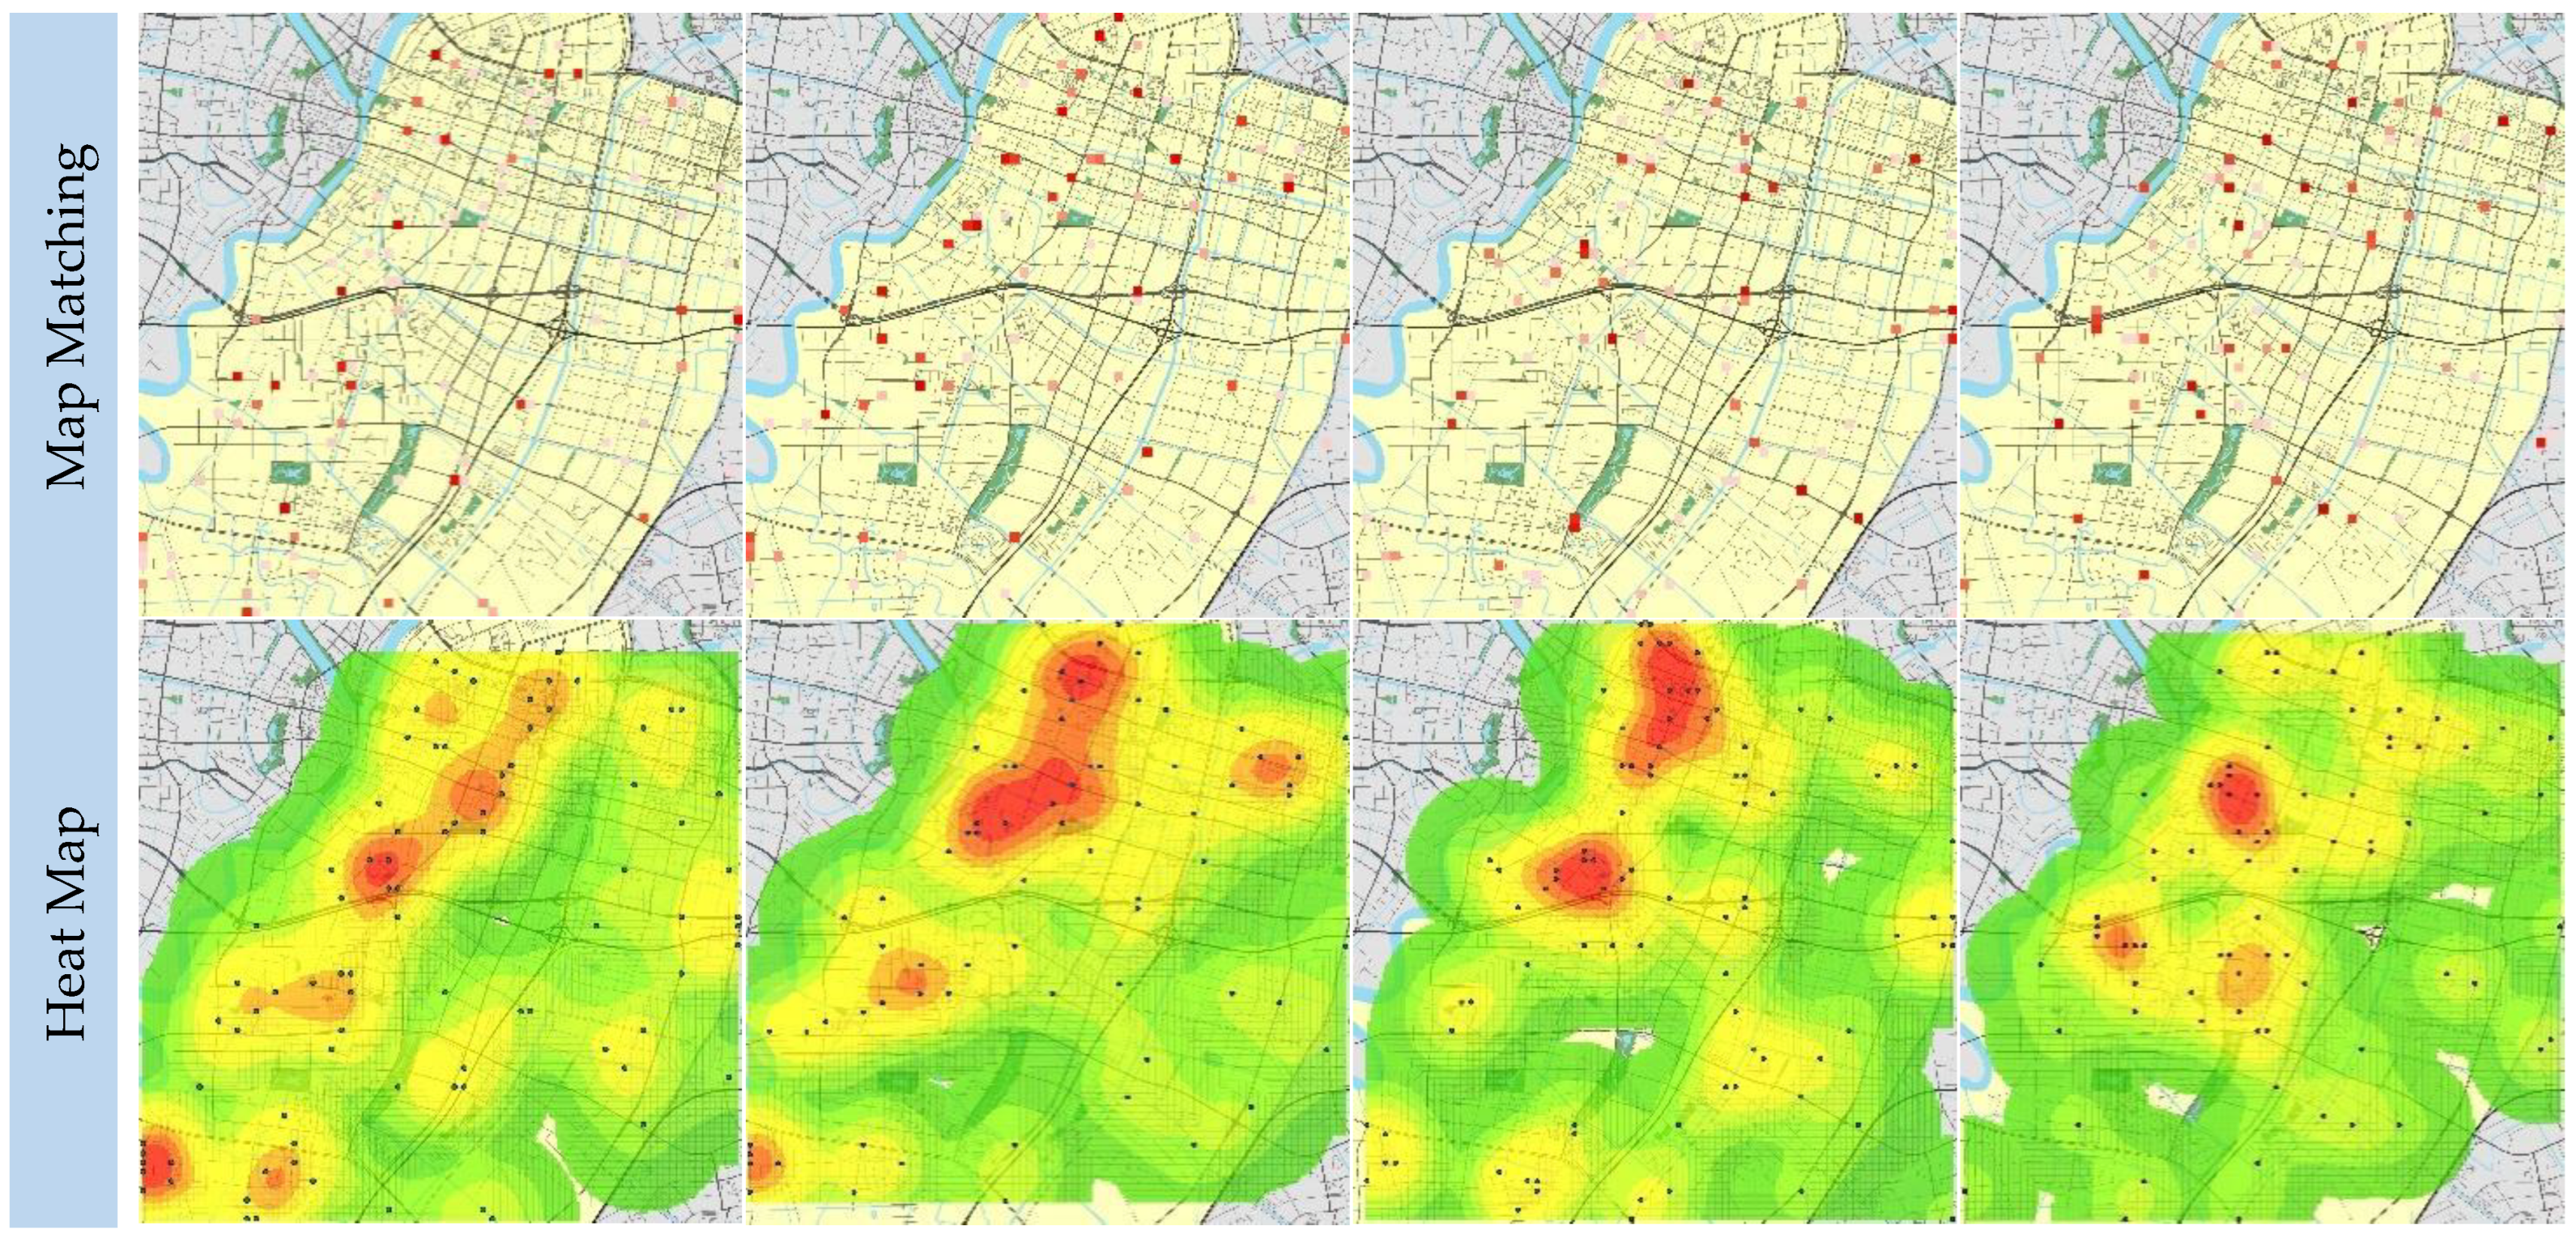
Figure 5 shows the comparison between the prediction of the proposed model and the true value. The first row is the distribution of traffic accidents that occur on the road network. The second row is the distribution of traffic accidents predicted by BCDU-Net. The third row is the matching effect of the predicted traffic accidents with the road network. The fourth row is the heat map of traffic accidents predicted by the model (the same below). Meanwhile, the quantitative results of the predictions from BCDU-Net were compared with other models, as listed in
Table 1. Obviously, the BCDU-Net performs better than other models.
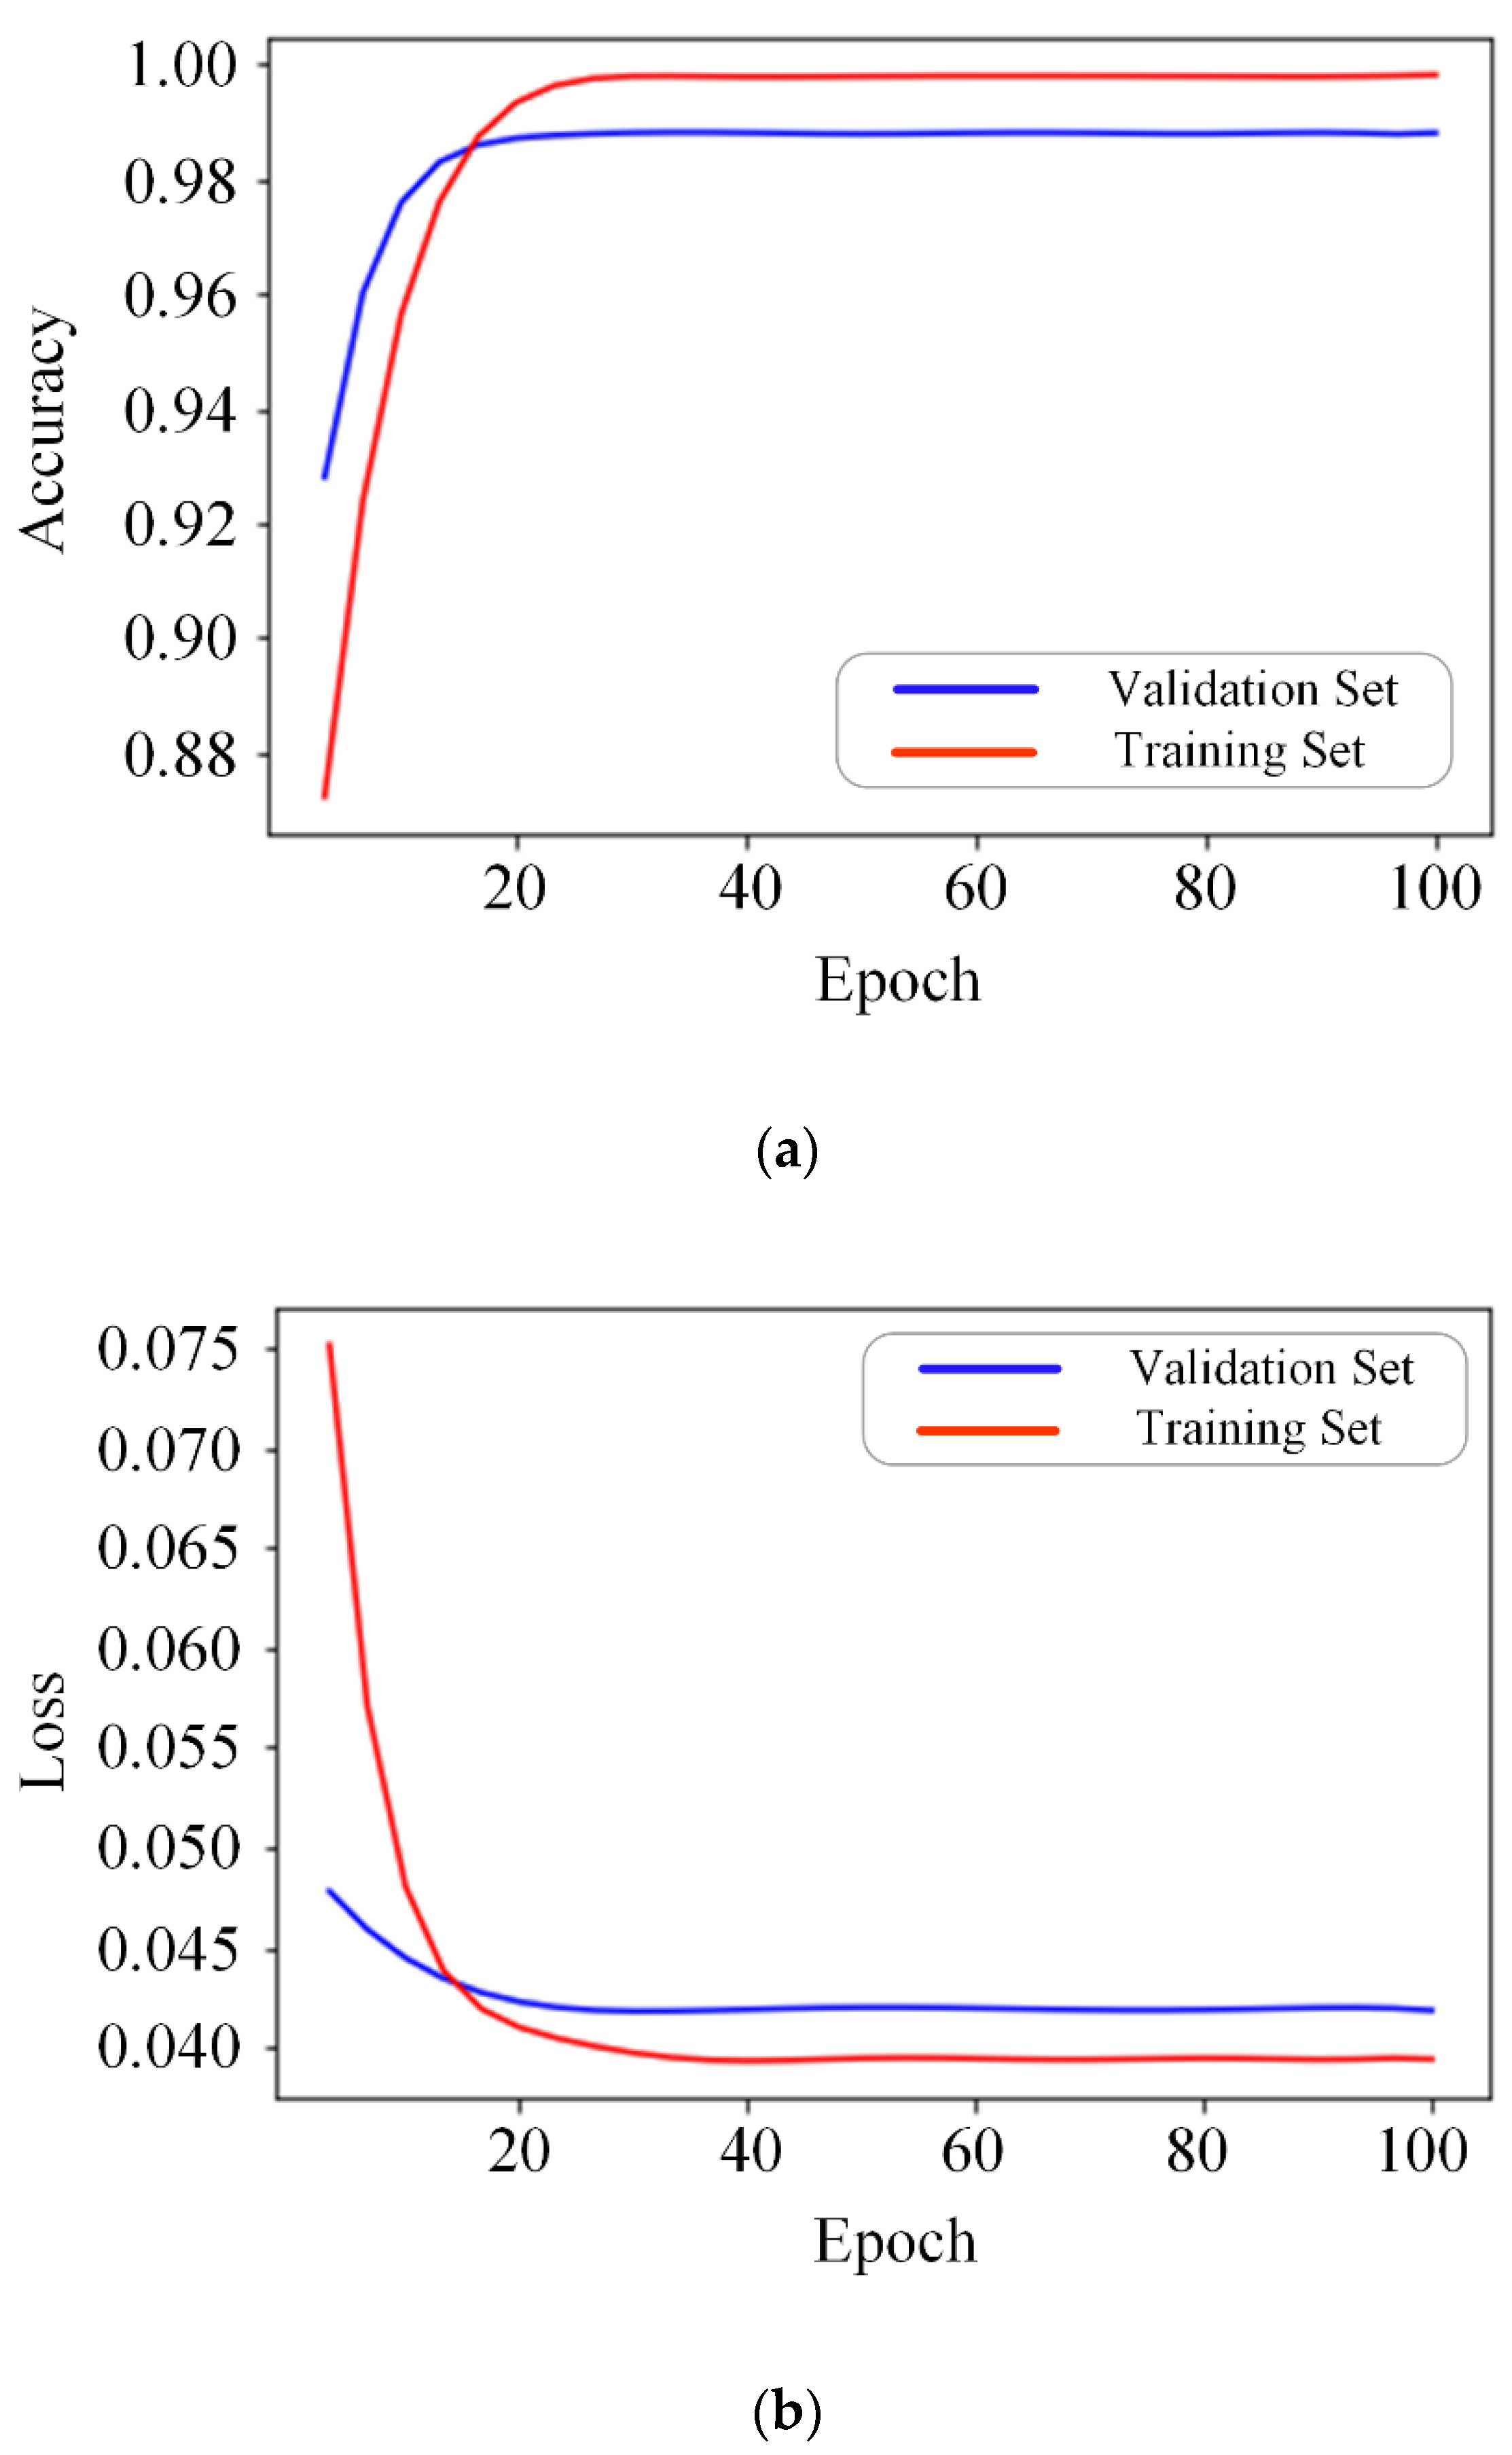
To verify the convergence of the BCDU-Net, the training and verification accuracy of the data set of motor vehicle accidents is shown in
Figure 6a, which demonstrates that the convergence speed of the BCDU-Net is very fast. To be more specific, the network almost converges after the 20th iteration. The changing trend of the model loss value with the number of iterations further validates this conclusion, as shown in
Figure 6b. To demonstrate the overall performance of BCDU-Net on the data set of motor vehicle accidents, the ROC curve is shown in
Figure 6c, which shows the relationship between the true positive rate (TPR) and the false positive rate (FPR) [
22]. The area below the ROC curve is used to indicate the accuracy of the prediction. In other words, the area below the curve is positively correlated with the prediction accuracy of the model.
4.2. Non-Motor Vehicle Accidents
Non-motor vehicle accidents refer to the casualties or property losses caused by drivers of bicycles, tricycles, rickshaws, animal-drawn vehicles, and special vehicles for persons with disabilities and persons with reduced mobility, as well as pedestrians, passengers, and those who carry out traffic activities on roads, due to their acts and negligence in violation of the “Road Traffic Safety Law” and other traffic laws and regulations.
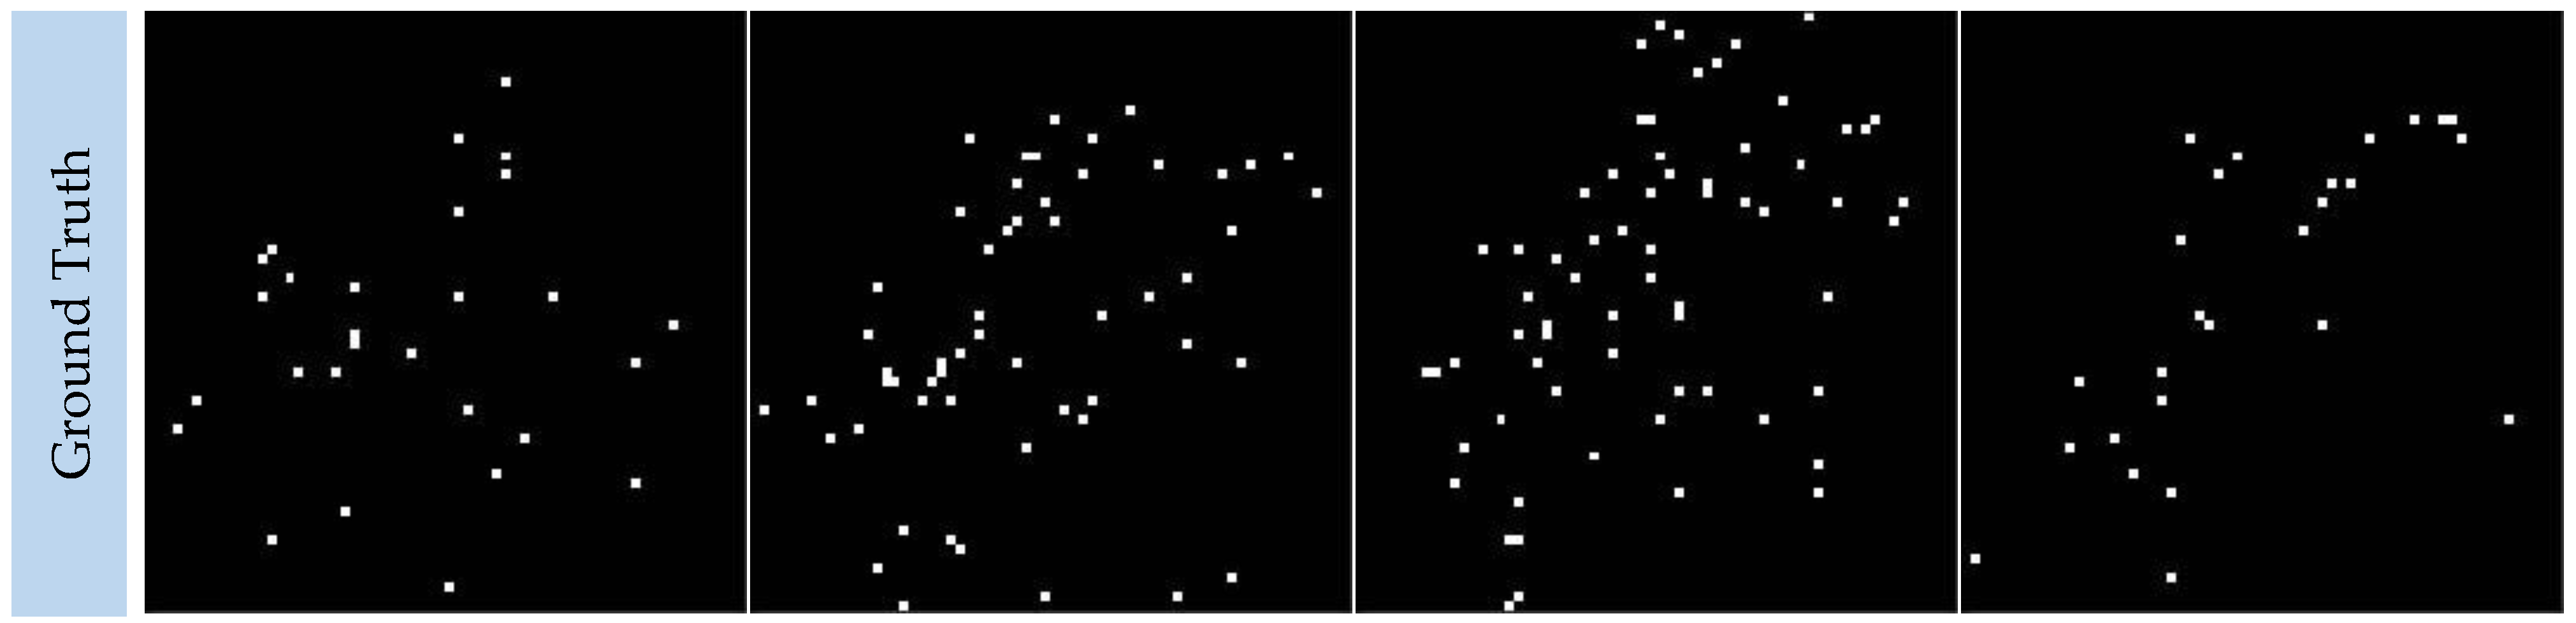
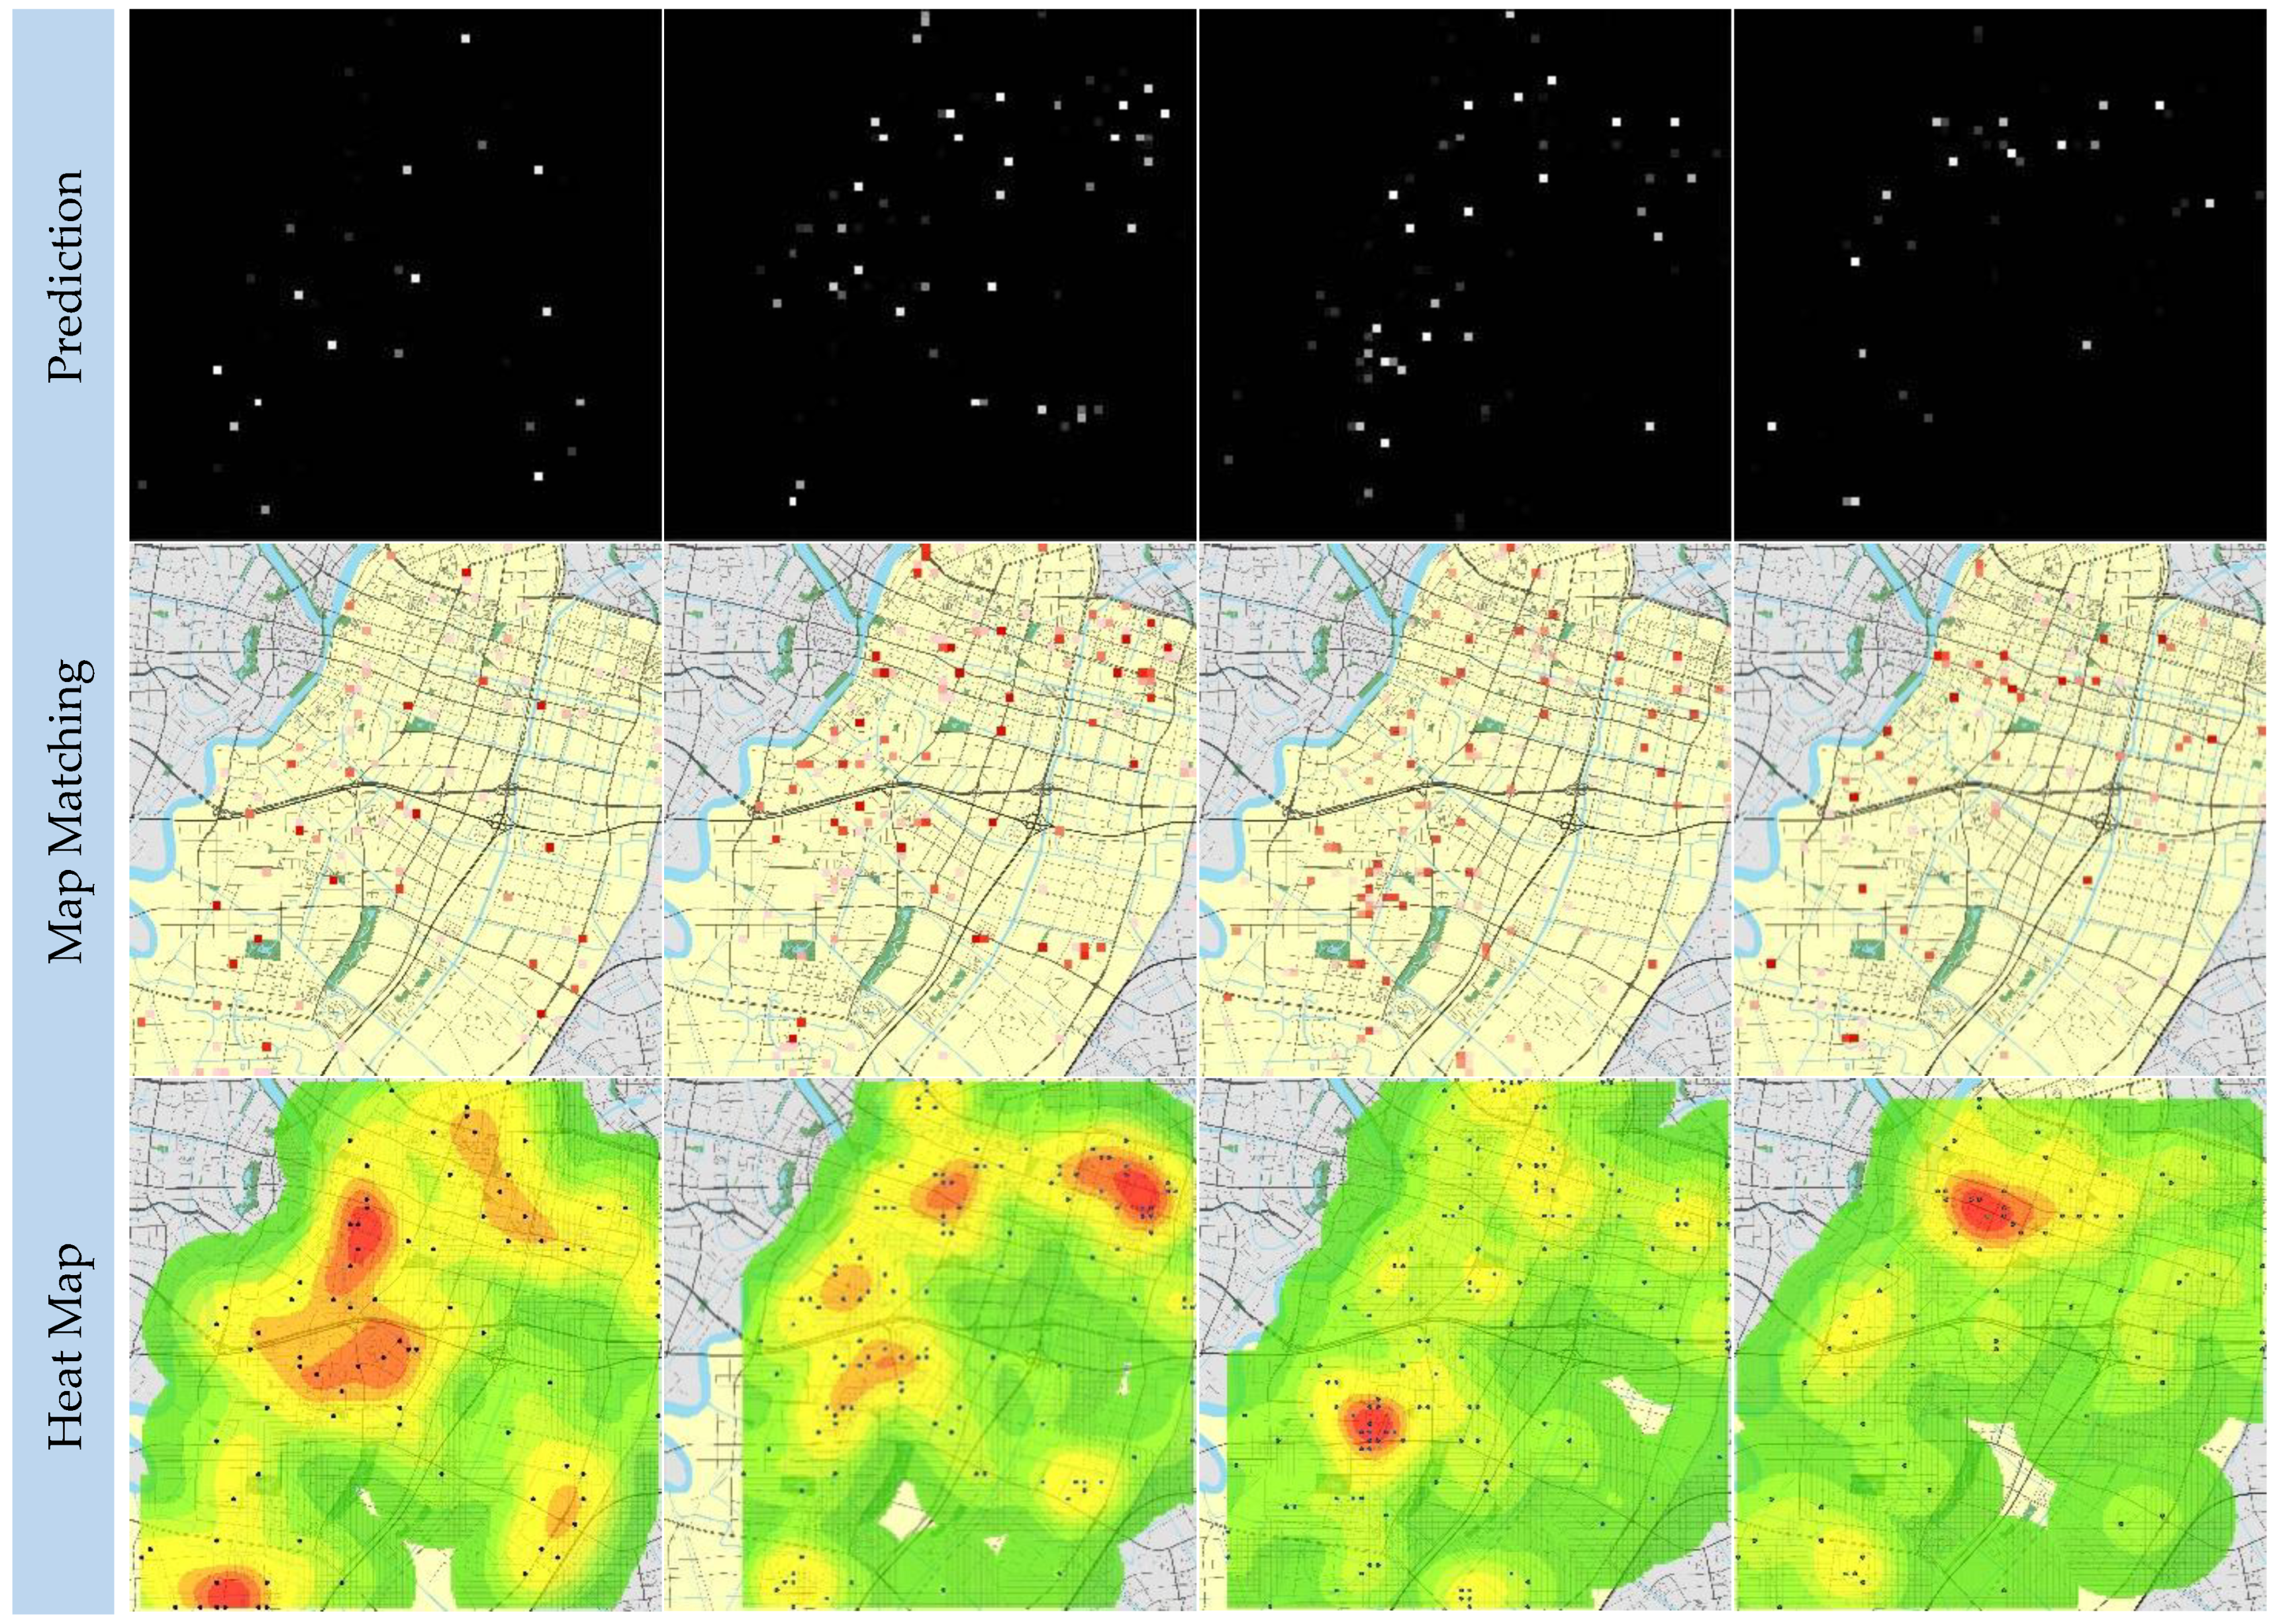
Figure 7 shows some promising outputs of BCDU-Net on the data set of non-motor vehicle accidents.
Table 2 lists the quantitative results from different models and the proposed network. BCDU-Net has made great improvements and is superior to the alternative schemes in terms of all evaluation indicators.
4.3. Single-Vehicle Accidents
A single-vehicle accident is a traffic accident in which only one party is involved. The prediction results of single-vehicle accidents in the road network using the BCDU-Net developed in this study are shown in
Figure 8.
Table 3 lists the results of quantitative analysis on this data set using different models and the BCDU-Net developed in this paper. The results show that most evaluation indices of BCDU-Net are superior to those of other models.
4.4. Discussion
4.4.1. Model Prediction Effect Analysis
BCDU-Net is modified from the original U-Net. We compared the “accuracy” and “F1-Score” of the U-Net and BCDU-Net in three different data sets of a traffic accident in
Table 4, which demonstrates that the prediction results of the original U-Net have been effectively improved by inserting bi-directional ConvLSTM into the skip connections layer.
The original U-Net model only uses a simple connection function to fuse the features from the coding layer and the decoding layer, while BCDU-Net uses a set of bi-directional ConvLSTM structures to combine features from the coding layer and the decoding layer. These two kinds of features are fused to form a set of feature maps with sufficient local and semantic information, enabling the network to learn more complex data structures. What’s more, dense connection structures share feature mapping among convolutional blocks through a direct connection and generate more diversified and richer feature information, granting the network stronger feature propagation ability. Therefore, the introduction of a dense connection layer can improve the prediction accuracy and f1 score of the three data sets.
4.4.2. Accident Prediction Results Analysis
The heat map of motor vehicle accidents shows that the number of motor vehicle accidents, mainly concentrated along roads with large traffic flows and nearby intersections, is relatively higher than that of other accidents. It is observed from the distribution map that motor vehicle accidents form relatively concentrated black-spot areas that are relatively fixed. The traffic management department can carry out risk investigation and accident prevention and control in advance for these areas. The heat map of non-motor vehicle accidents shows that non-motor vehicle accidents are mainly distributed at intersections and the areas nearby. In general, the distribution of the hot spot is relatively scattered and random. Further analysis shows that the hot spot of non-motor vehicle accidents is relatively scattered and unfixed and not as centralized and obvious as that of motor vehicle accidents. It is difficult for the traffic management department to prevent or control non-motor vehicle accidents in advance. The heat map of single-vehicle accidents shows that the number of single-vehicle accidents accounts for a relatively small percentage of the three types of accidents. Single-vehicle accidents mainly occur in areas with crisscrossing roads where the distribution of roads is relatively dense or there are many intersections. Further analysis shows that the distribution of single-vehicle accidents is relatively loose and that there is no relatively concentrated “hot spot” area. It forms a scattered pattern.
Although it is impossible to accurately locate the location of each accident by using the accident prediction method proposed in this study, it is possible to accurately predict a series of traffic accidents, including motor vehicle accidents, non-motor vehicle accidents, and single-vehicle accidents, within a local scope. For the traffic management department, it has already played the role of early prevention and early warning; meanwhile, it also enables the management department to mine the hot spots of accidents in the road network. By understanding the distribution of accidents on the road network, effective prevention and control of relevant road sections in advance can be carried out to minimize the risk of traffic accidents.
5. Conclusions
This paper applies Bi-ConvLSTM U-net neural network to the prediction of traffic accidents. We first define short-term traffic accidents prediction as the prediction of spatiotemporal sequence. The BCDU-Net model was trained using historical traffic accident data and then used to predict traffic accidents occurring in the road network of Yinzhou District, Ningbo. ConvLSTM is suitable for mining and analyzing spatiotemporal characteristics in accident data as it retains the advantage of traditional LSTM in memorizing time series. Besides, its inherent convolution structure can extract the spatial characteristics of data. The experimental results show that BCDU-Net can effectively extract the spatiotemporal distribution characteristics of traffic accident data to mine the deeper characteristics and predict the possibility of traffic accidents more accurately. Compared with the traditional neural network [
23], the prediction results of the method proposed in this study are more accurate, which is of great significance for traffic safety and transportation.
Meanwhile, traffic accidents are divided into three types, namely, accidents of motor vehicles, non-motor vehicles, and single vehicles, according to their attributes. These three types of accidents are trained on BCDU-Net, respectively. From the prediction results of the three models, it can be seen that motor vehicle accidents are mainly concentrated along some sections with large traffic flows or intersections nearby, forming relatively concentrated “black-spot” areas. These black-spot areas are relatively fixed; non-motor vehicle accidents are mainly distributed at intersections and nearby areas, showing a relatively scattered and random distribution. The distribution hot spots of non-motor vehicle accidents are relatively scattered and unfixed. Single-vehicle accidents mainly occur in areas crisscrossed by roads with a relatively dense distribution and many intersections. The distribution of single-vehicle accidents is relatively loose, and there is no relatively concentrated “hot-spot” area.
However, there are some deficiencies in this study. Firstly, the occurrence rate of traffic accidents is low, so the accurate prediction of traffic accidents is extremely challenging. Due to the lack of sufficient sample data, there is some deviation between the predicted results and the real values. Although we can continue to collect traffic accident data as a supplement to the experimental data set, the construction of road networks in many cities is still undergoing continuous reconstruction. As a result, the road network in urban areas is still expanding and updating. Therefore, it is difficult to collect a large and stable data set on traffic accidents. Secondly, each grid is regarded as the basic unit of prediction in our experiment. The finer the grid is divided, the higher the prediction accuracy is. However, since traffic accidents do not occur frequently, the finer the road network space is divided, the rarer the sequence matrix is, which in turn will reduce the accuracy of prediction. Therefore, the best partition granularity to obtain the best prediction effect is also an issue requiring further study in the follow-up research.
Our team will also use different in-depth learning network models (such as ConvGRU [
24]) to conduct more comparative experiments to achieve better experimental results and prediction accuracy. Meanwhile, we will adjust the model structure and parameters appropriately to further improve and optimize the computational performance of the model.


