A Decision-Making Approach for Sustainable Machining Processes Using Data Clustering and Multi-Objective Optimization
Abstract
1. Introduction
2. The Developed Approach
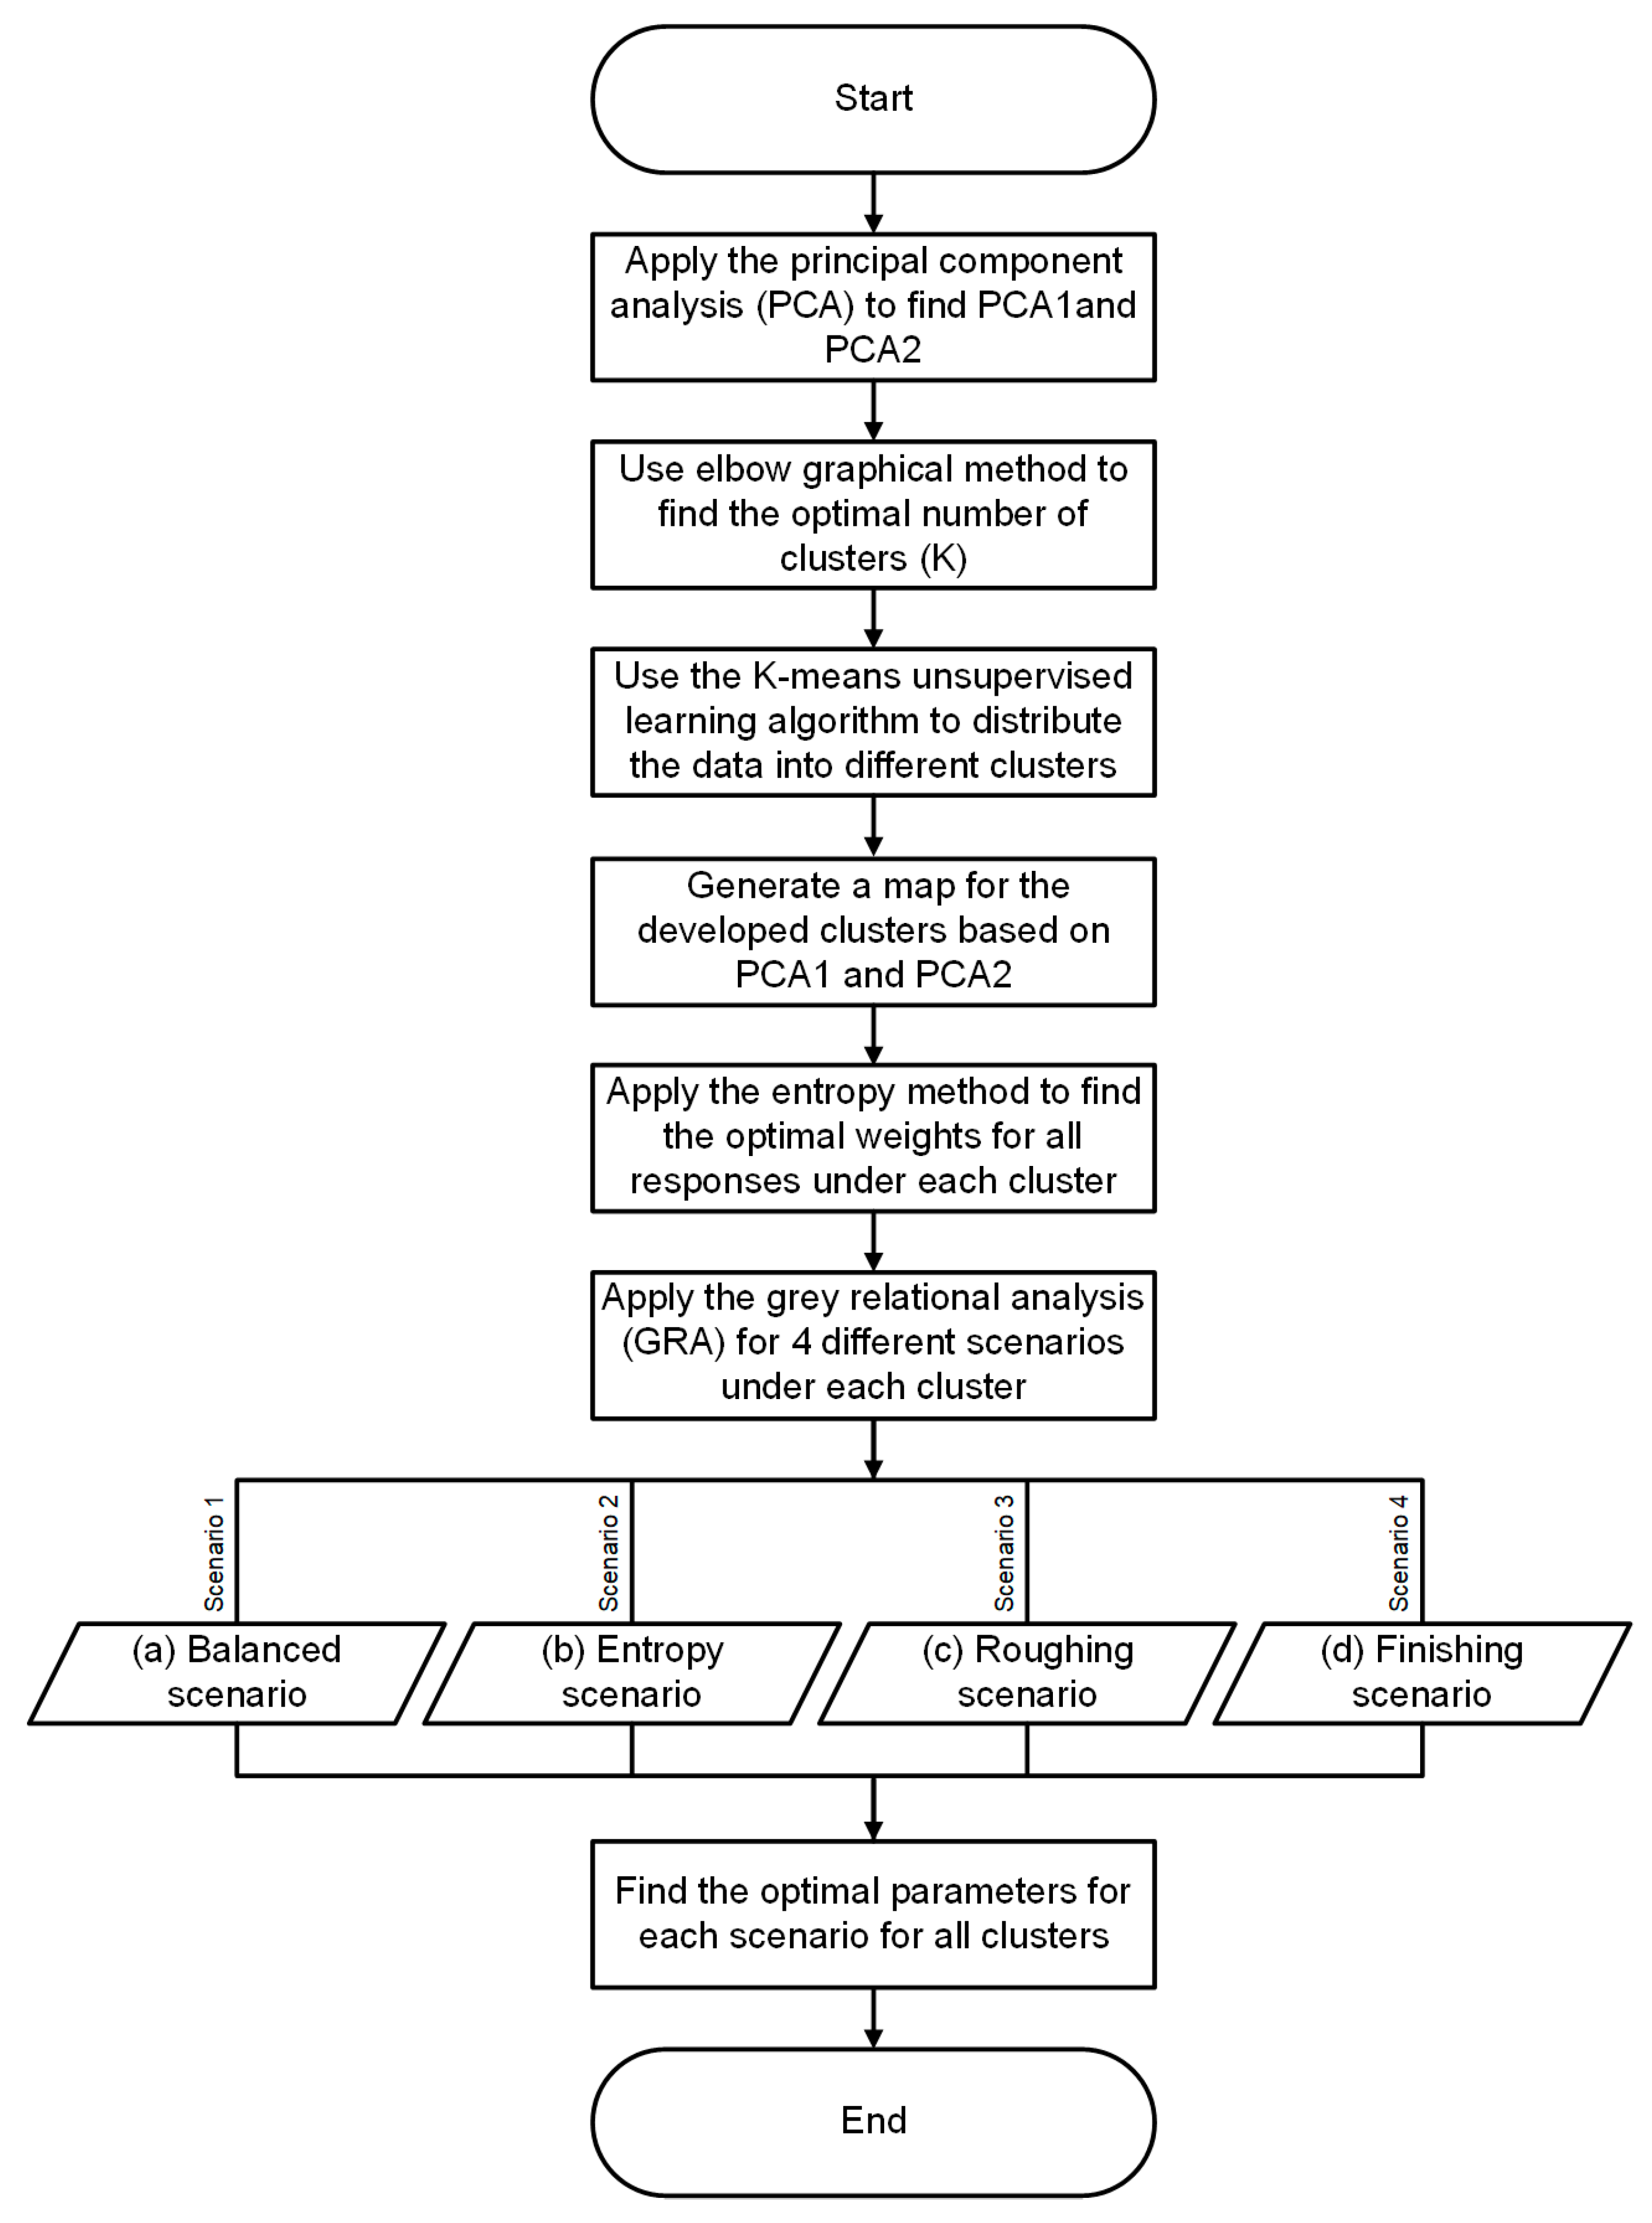
- Since more than two measured responses are usually studied to achieve a sustainable machining process, the first step is to apply the principal component analysis (PCA) to facilitate performing the clustering step. PCA is a prevalent technique for dimension reduction algorithms [18,19], and it is performed prior to k-means clustering to alleviate the high-dimensionality issue and accelerate computations [20]. The PCA approach converts the measured responses into two main normalized responses (i.e., PCA 1 and PCA 2). The first principal component (PCA 1) is the normalized linear combination of the responses that have the largest variance, while the orientation of the PCA 2 reflects the second largest source of variation in the data and is orthogonal to the first PC. Both PCA 1 and PCA 2 should pass through the average point in the data set. The PCA transformation is performed mathematically using the singular value decomposition SVD (to lower the dimensional space into two components). The SVD’s basics are to determine the matrix that includes both PCA 1 and PCA 2 based on the squared root of the eigenvalues and the eigenvectors of the high-dimensional input data [21].
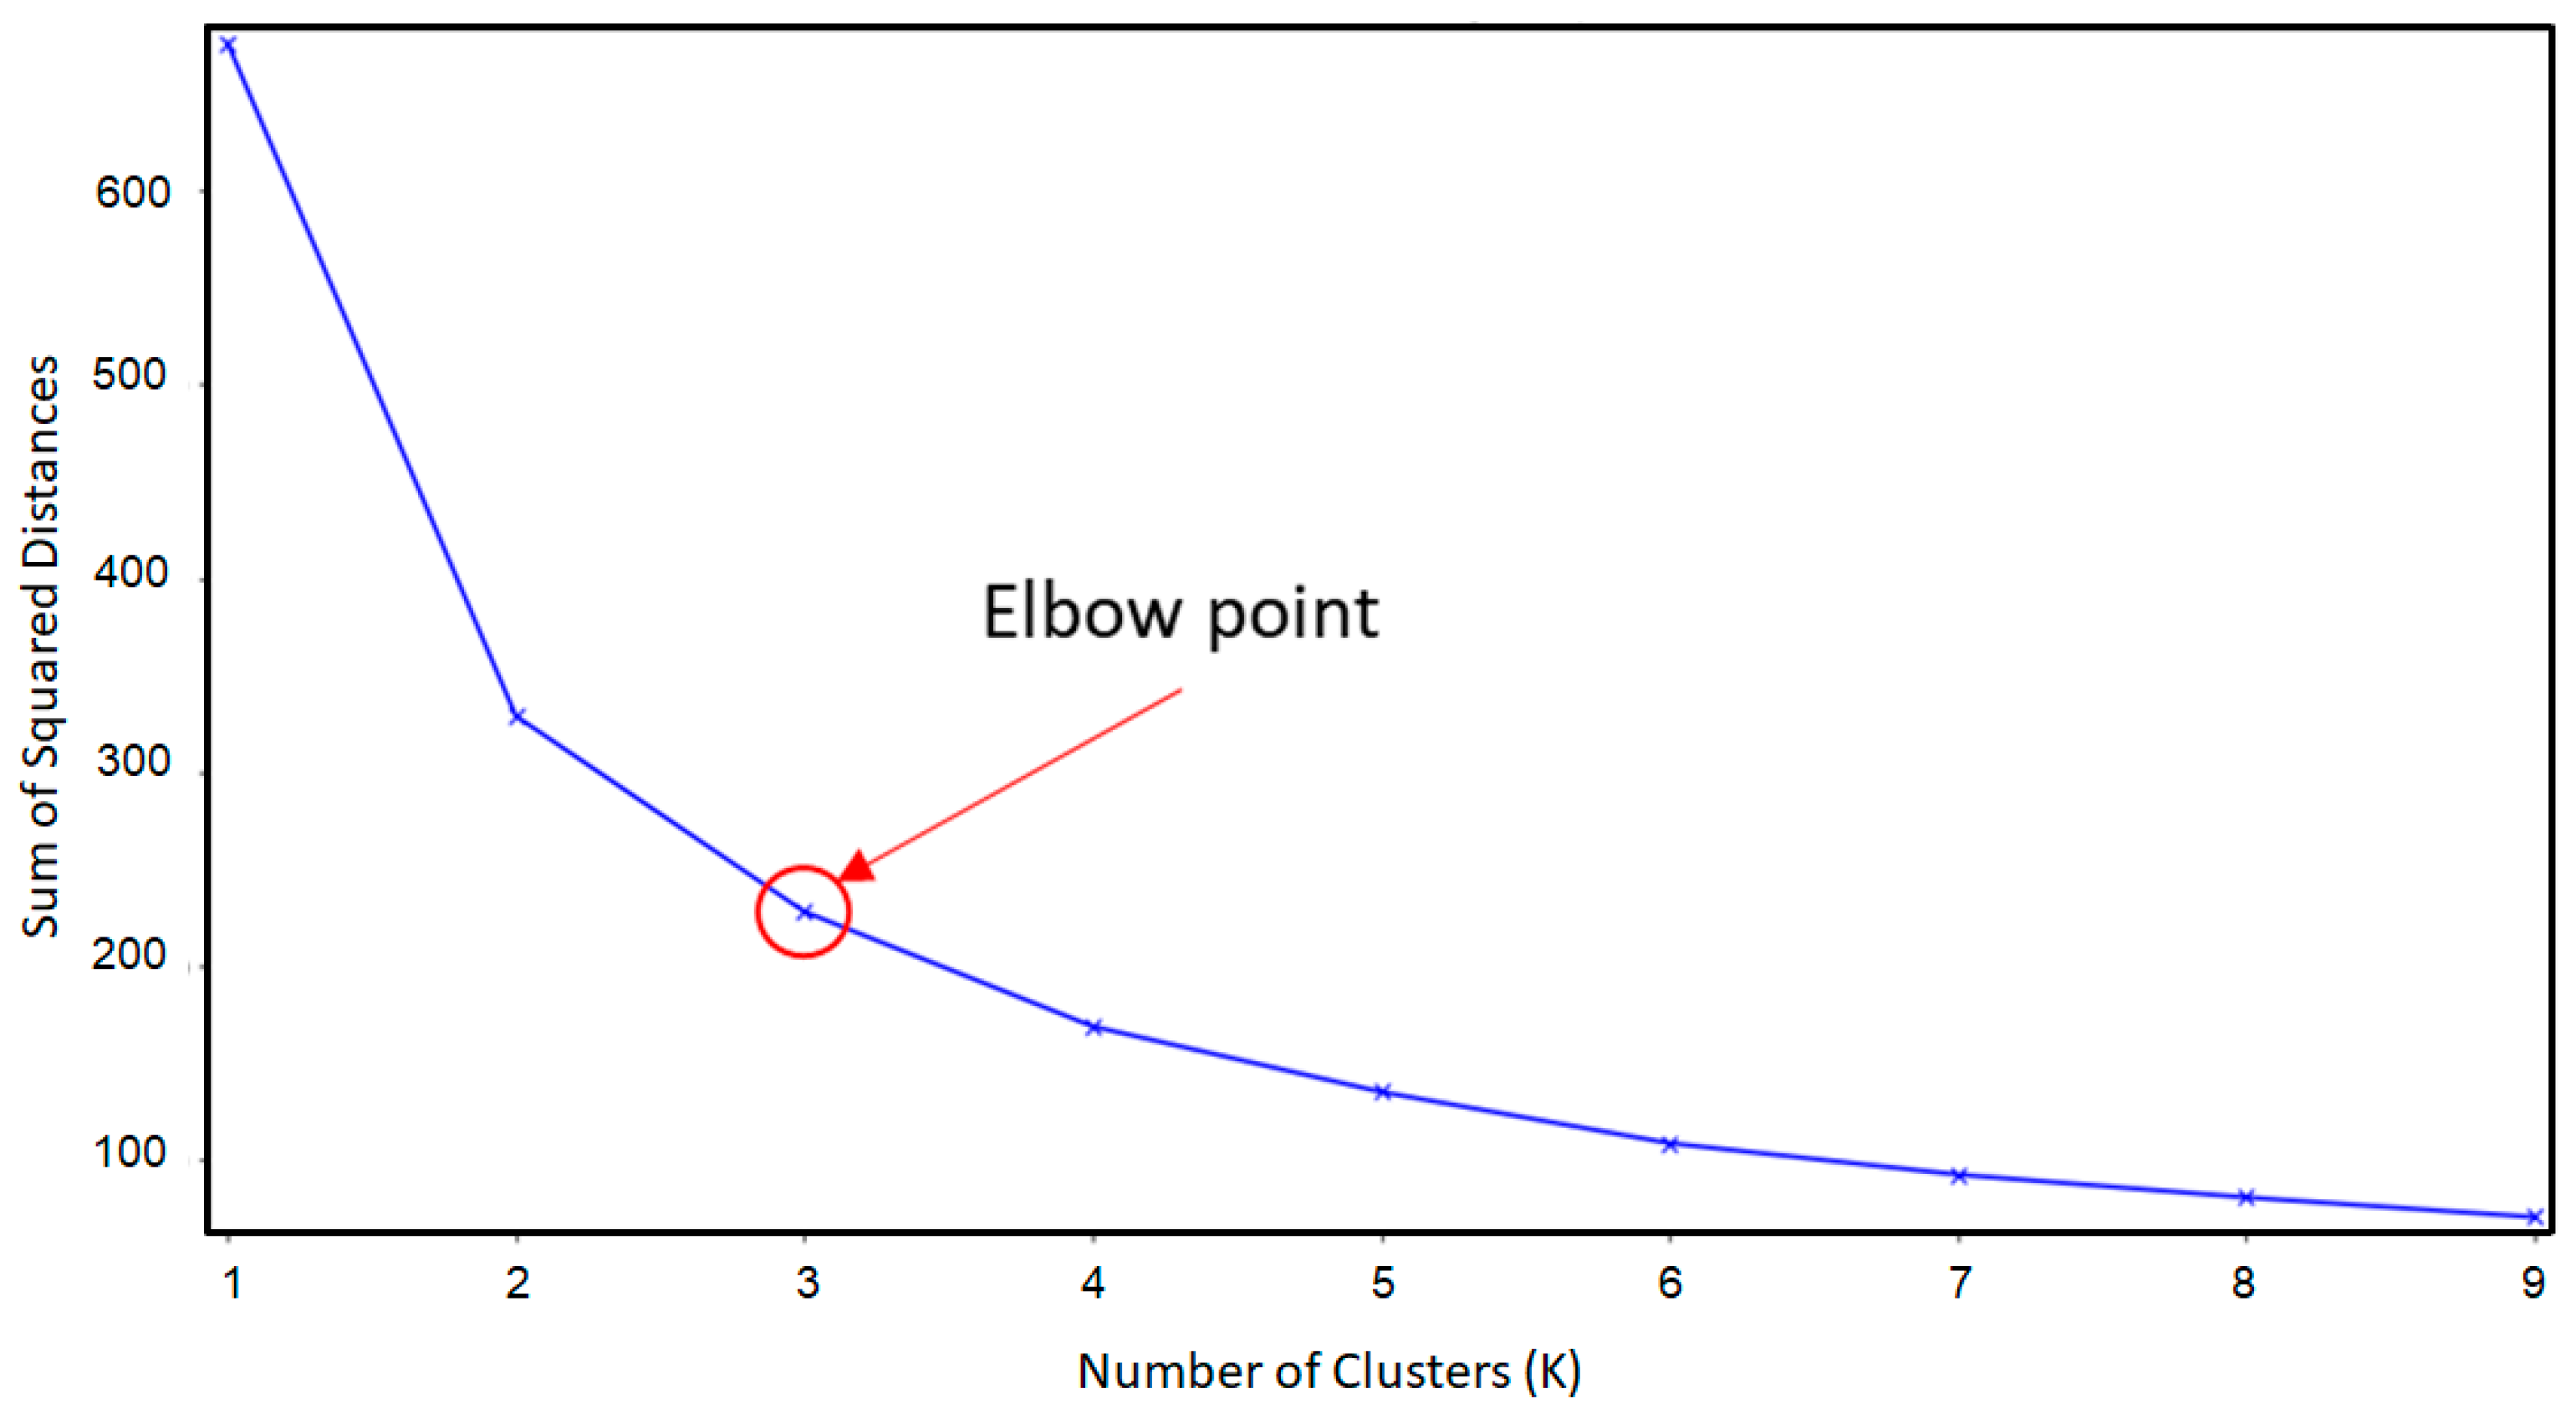
- The second step is to use the elbow graphical method to find the optimal number of clusters. The best number of clusters to describe a given dataset is determined iteratively [22,23]. The elbow method computes the sum of squared distances of samples to their nearest cluster center for each number of clusters K, weighted by the sample weights if provided [22]. The elbow-point is the optimal number of clusters for a particular dataset [22,23].
- The third step is to apply the clustering technique. In this approach, “K-means” is used to generate different clusters. K-means is an unsupervised learning algorithm that clusters data by attempting to separate samples into “n” groups of equal variances while minimizing the inertia or within-cluster sum-of-squares criterion. The number of clusters must be specified for this algorithm (see the previous step). This technique has been used in a wide variety of applications in a variety of fields [20,22]. The K-means algorithm takes a data set (X) with N samples and separates it into K distinct clusters, with each cluster being defined by the mean of its constituent samples. The means, also known as the cluster “centroids,” are typically not points from X, despite sharing the same space. The K-means algorithm selects cluster centers that minimize the inertia, or within-cluster sum-of-squares, as shown in Equation (1) [18]:
- At random, assign a number from 1 to K to each observation. These serve as the observation’s initial cluster assignments.
- Repeat until the cluster assignments no longer change.
- Determine the cluster centroid for each of the K clusters.
- Assign each observation to the cluster with the closest centroid (where the closest is defined using Euclidean distance).
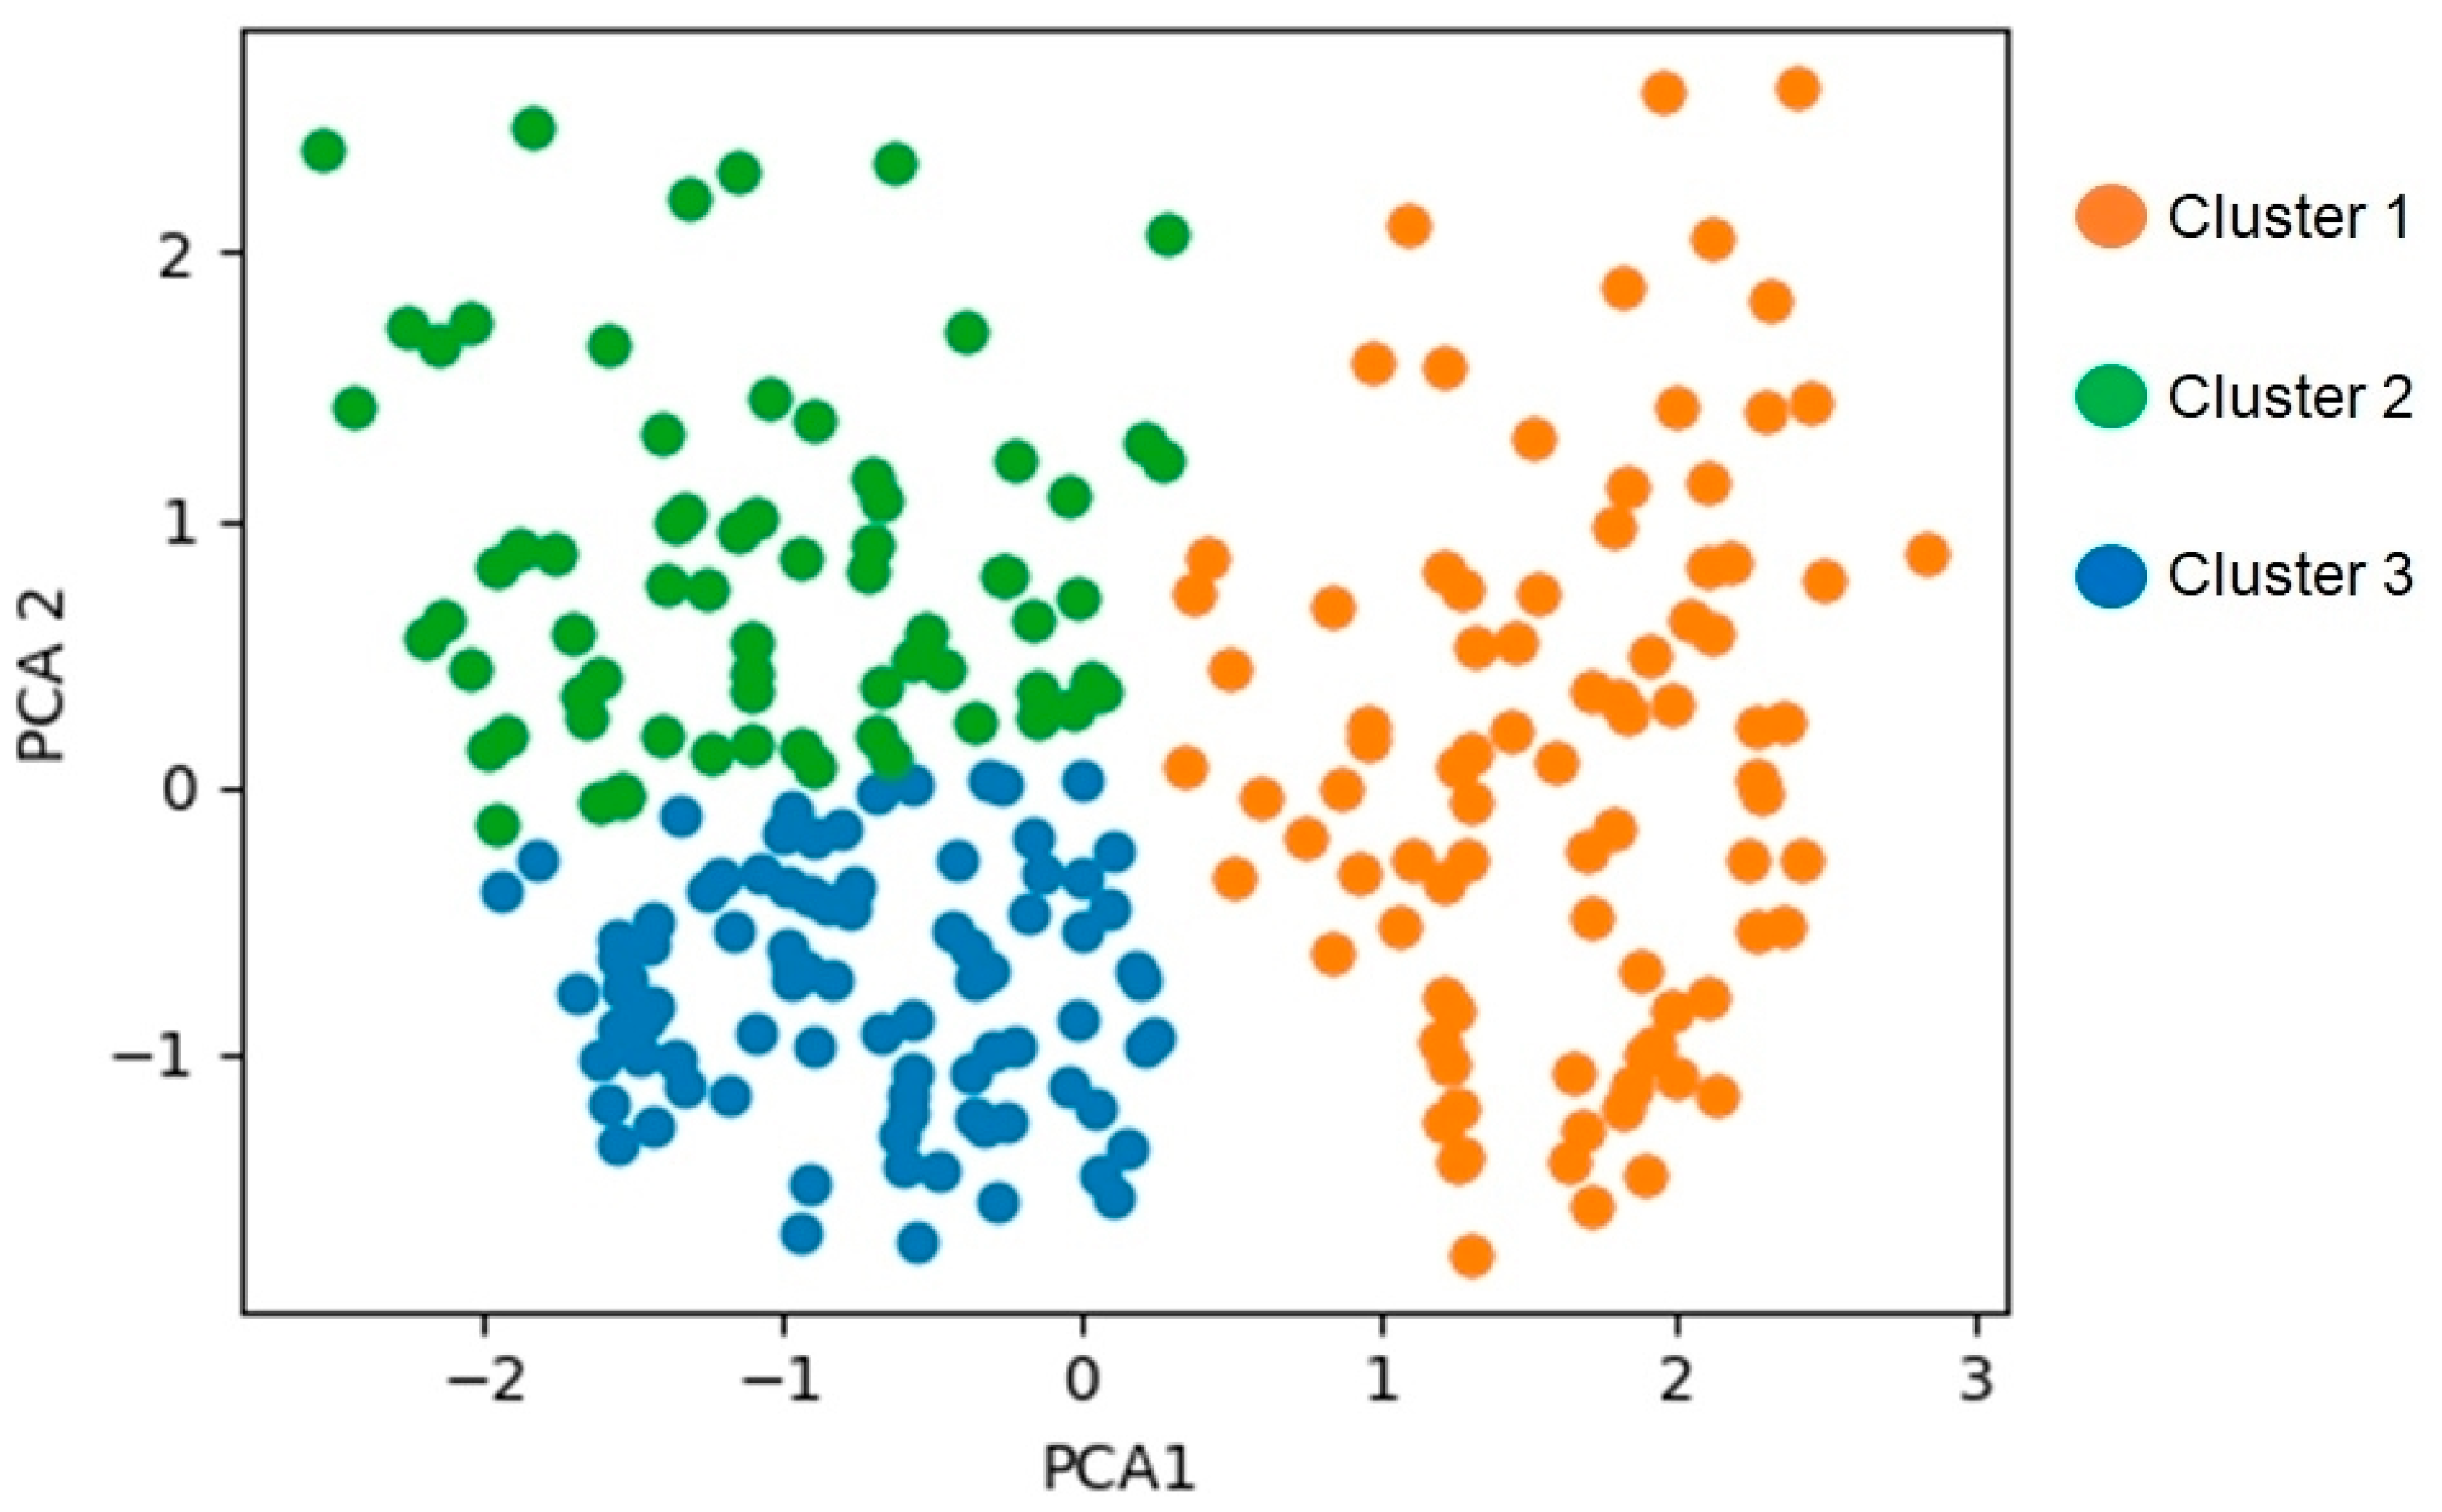
- The fifth step is to generate a map that includes the developed clusters based on PCA 1 and PCA 2.
- The sixth step is to find the optimized weights for each measured response for each developed cluster using the entropy method. The entropy method, which is derived from information theory, can be used to objectively determine criteria weights from pertinent decision data. When using entropy, a decision criterion’s weight is directly correlated with the average intrinsic information produced by a particular set of alternative evaluations [24]. The entropy method consists of the following summarized steps: (a) data normalization, (b) computing the entropy, and (c) computing the weight vector (including all studied responses). The entropy normalized value can be obtained as shown in Equation (2), where = 1, …, m; = 1, …, k; m is the number of data sets (i.e., machining experiments) and k is the number of the machining characteristics responses, is the original value, and is the entropy normalized value. Meanwhile, the entropy value for each response can be determined as shown in Equations (3) and (4). The assigned weight for each response can be calculated based on Equation (5)
- The seventh step is to define new scenarios using new weights based on the preference of the decision maker (i.e., balanced, finishing, roughing).
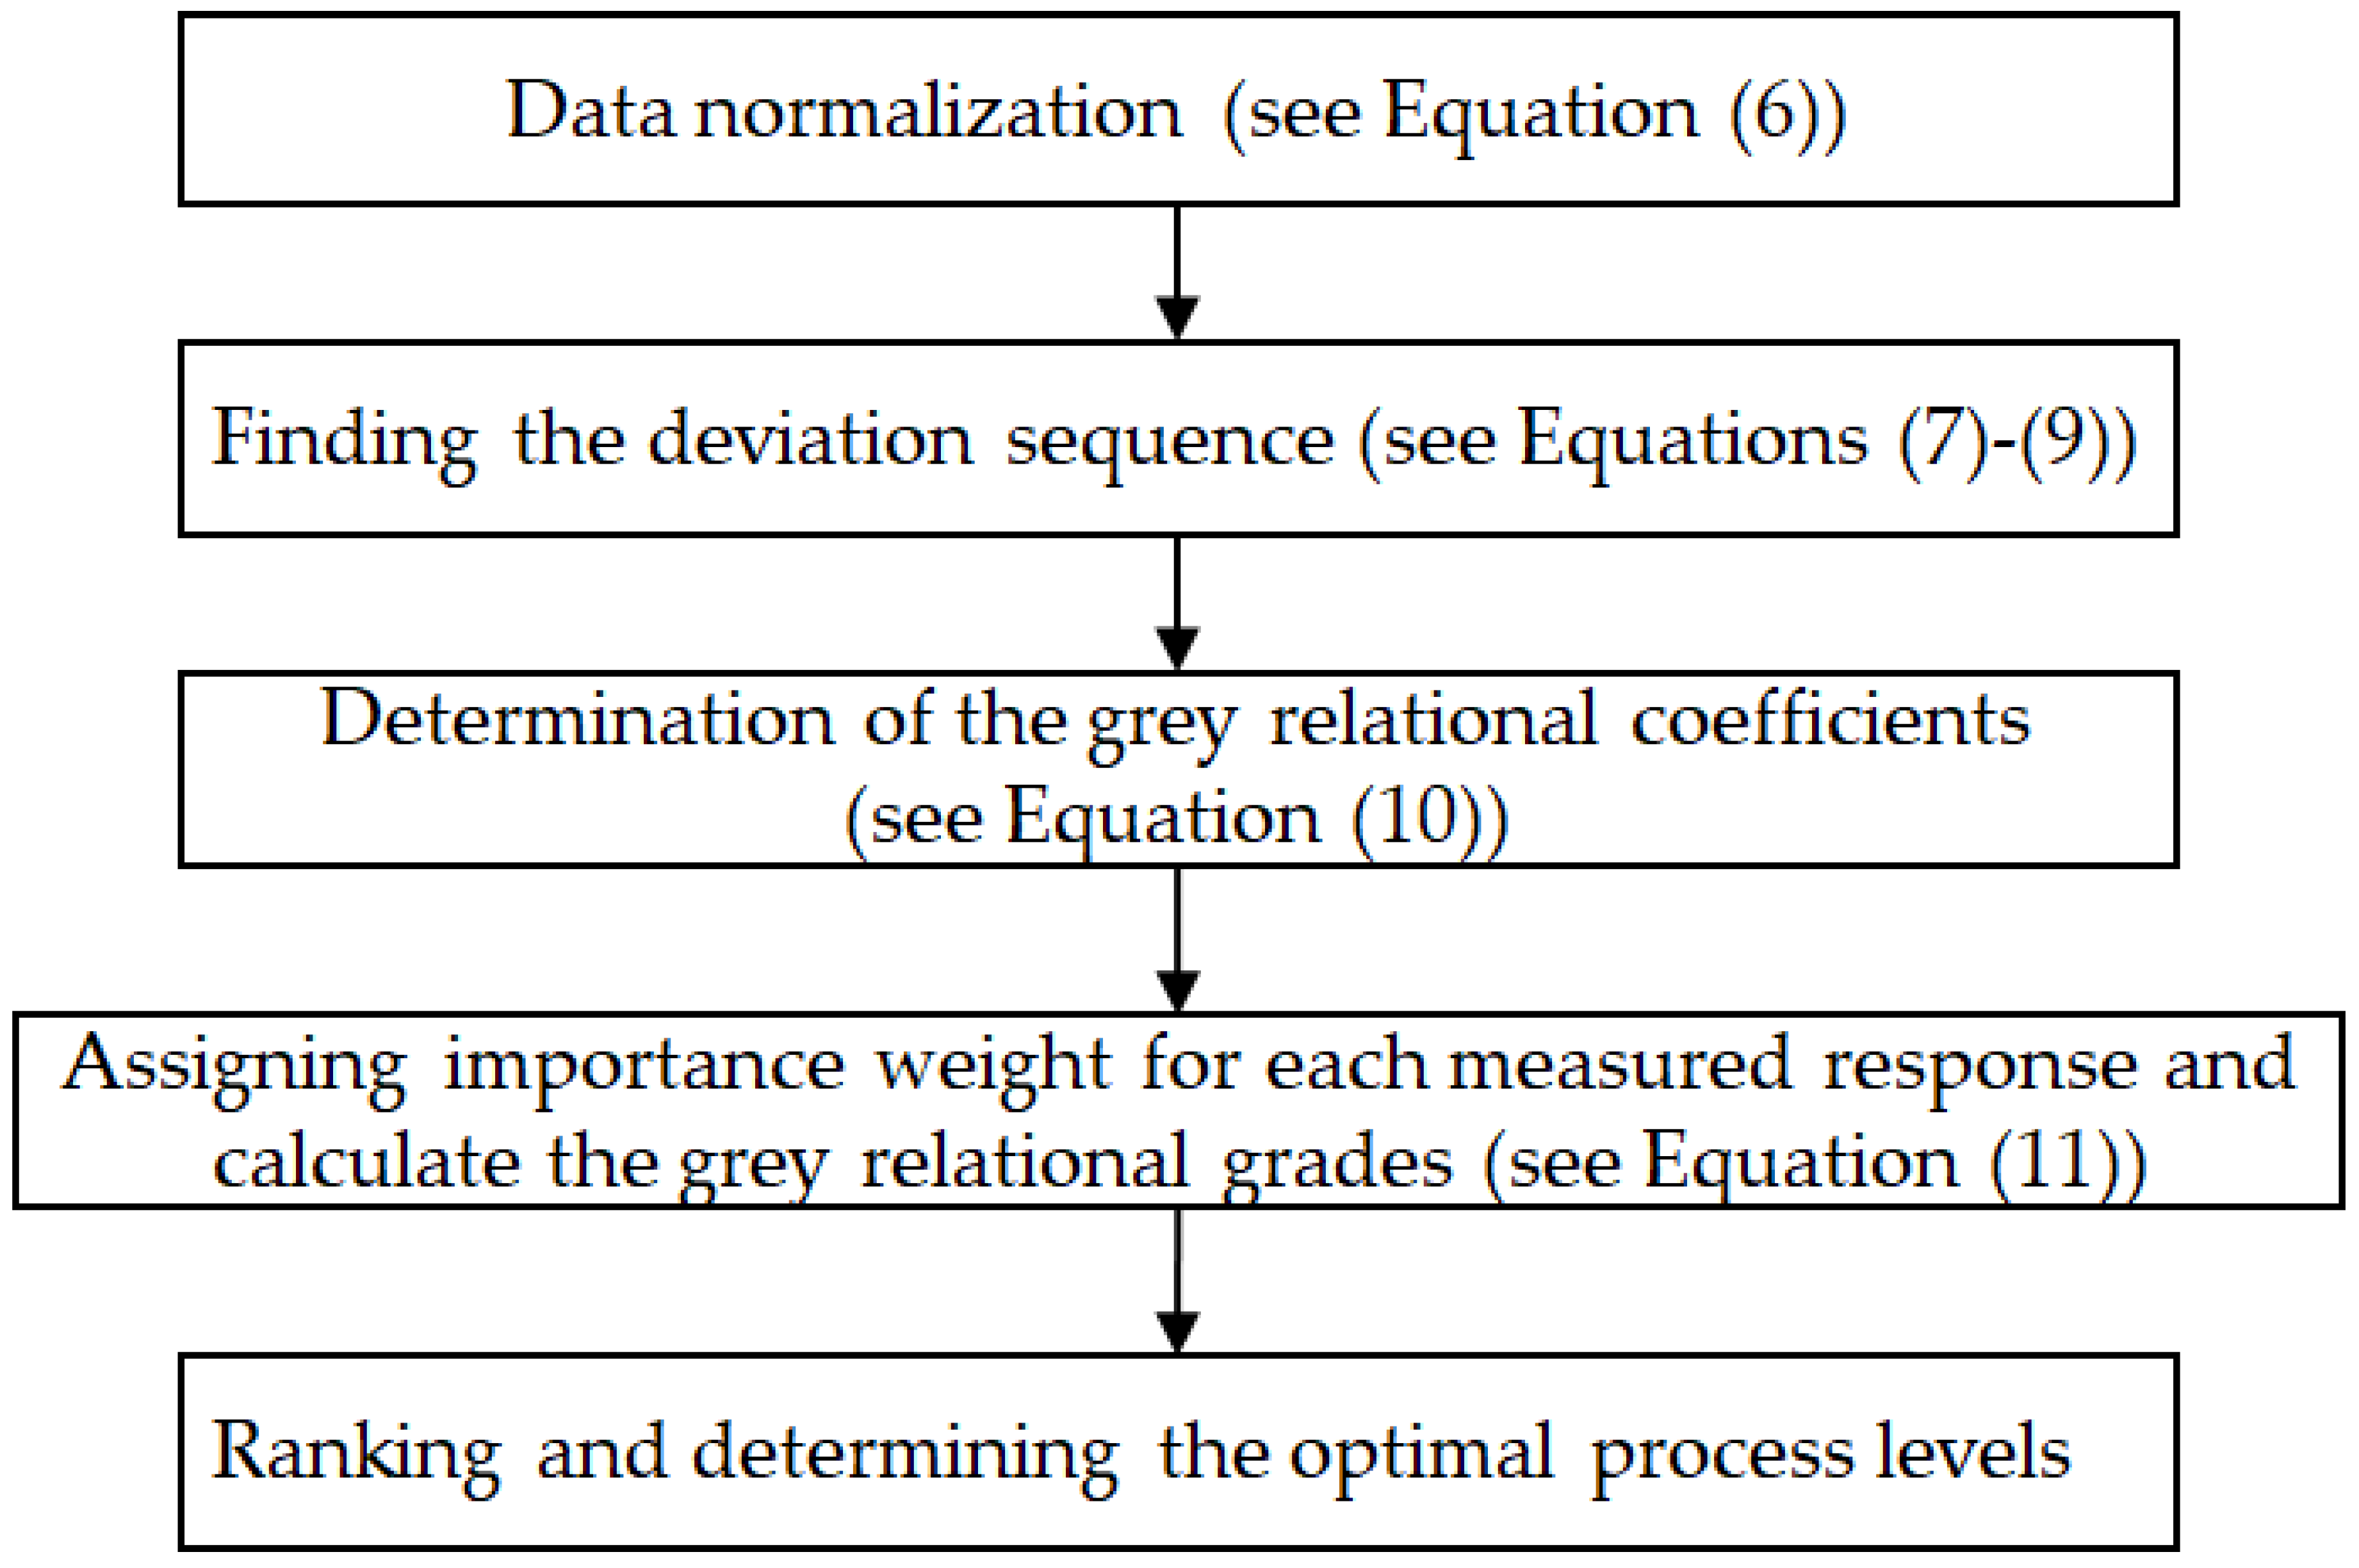
- The eighth step is to apply the multi-objective optimization using the grey relational analysis (GRA). GRA can be adapted for solving the complex interrelationships between the designated performance characteristics. Through this analysis, the grey relational grade (GRG) is defined favorably as an indicator for evaluating multiple performance characteristics. In recent years, grey relational analysis has emerged as an effective method for analyzing processes with multiple performance characteristics. It provides solutions for situations in which some information is known and some is unknown; consequently, it only provides a level-based solution. Various studies [25,26] have utilized it to determine the optimal operating levels associated with multiple performance characteristics in machining processes. GRA techniques consist of the following summarized stages (see Figure 2): (a) data normalization, (b) finding the deviation sequence for each measured response, (c) the determination of the grey relational coefficients, (d) assigning importance weight for each measured response and calculating the grey relational grades, and (e) ranking and determining the optimal process levels. For the first stage, linear normalization is used to normalize the data. The normalization is performed using Equation (6) as all studied responses have “smaller-the-better”-based characteristics.
3. Validation and Discussion
- The PCA technique is used as a dimension reduction algorithm to convert the measured responses into two main normalized responses (PCA 1 and PCA 2). This step is necessary to accurately perform the clustering operation.
- The elbow method is used to find the optimal number of clusters. Based on Figure 3, it is found that the best number of clusters for this specific dataset is 3.
- The third step is to implement the K-means technique to find and identify the clusters/zone of the provided data. Figure 4 shows a distribution of the three generated clusters with respect to PCA 1 and PCA 2. The first cluster covers 87 trials/points, while 70 points have been included in cluster 2. Cluster 3 includes 88 points. In addition, Table 2 shows the ranges for the three measured responses for each cluster. It can be observed that clusters 2 and 3 shared the same range for the unit volume machining time, while the highest range is noticed within cluster 1. This means the decision maker can rely more on cluster 2 or 3 if higher productivity is the primary objective function. In terms of surface roughness, both clusters 1 and 2 have almost the same range compared to cluster 3, which offered higher surface roughness (i.e., an increase by ~49% for the lower bound and ~35% for the upper bound). This means that either cluster 1 or 2 can represent the desired choice where the surface quality of the machined product is the primary objective function. It is evident that cluster 2 offers the lowest range in terms of specific energy, followed by cluster 3 and cluster 1. It should be stated that the generated clusters offer clear insights to the decision makers, however, there is still a need to offer optimal solution(s) within each cluster based on different scenarios. This is to accommodate all desired objectives (sustainability goals) the decision maker plans to accomplish.
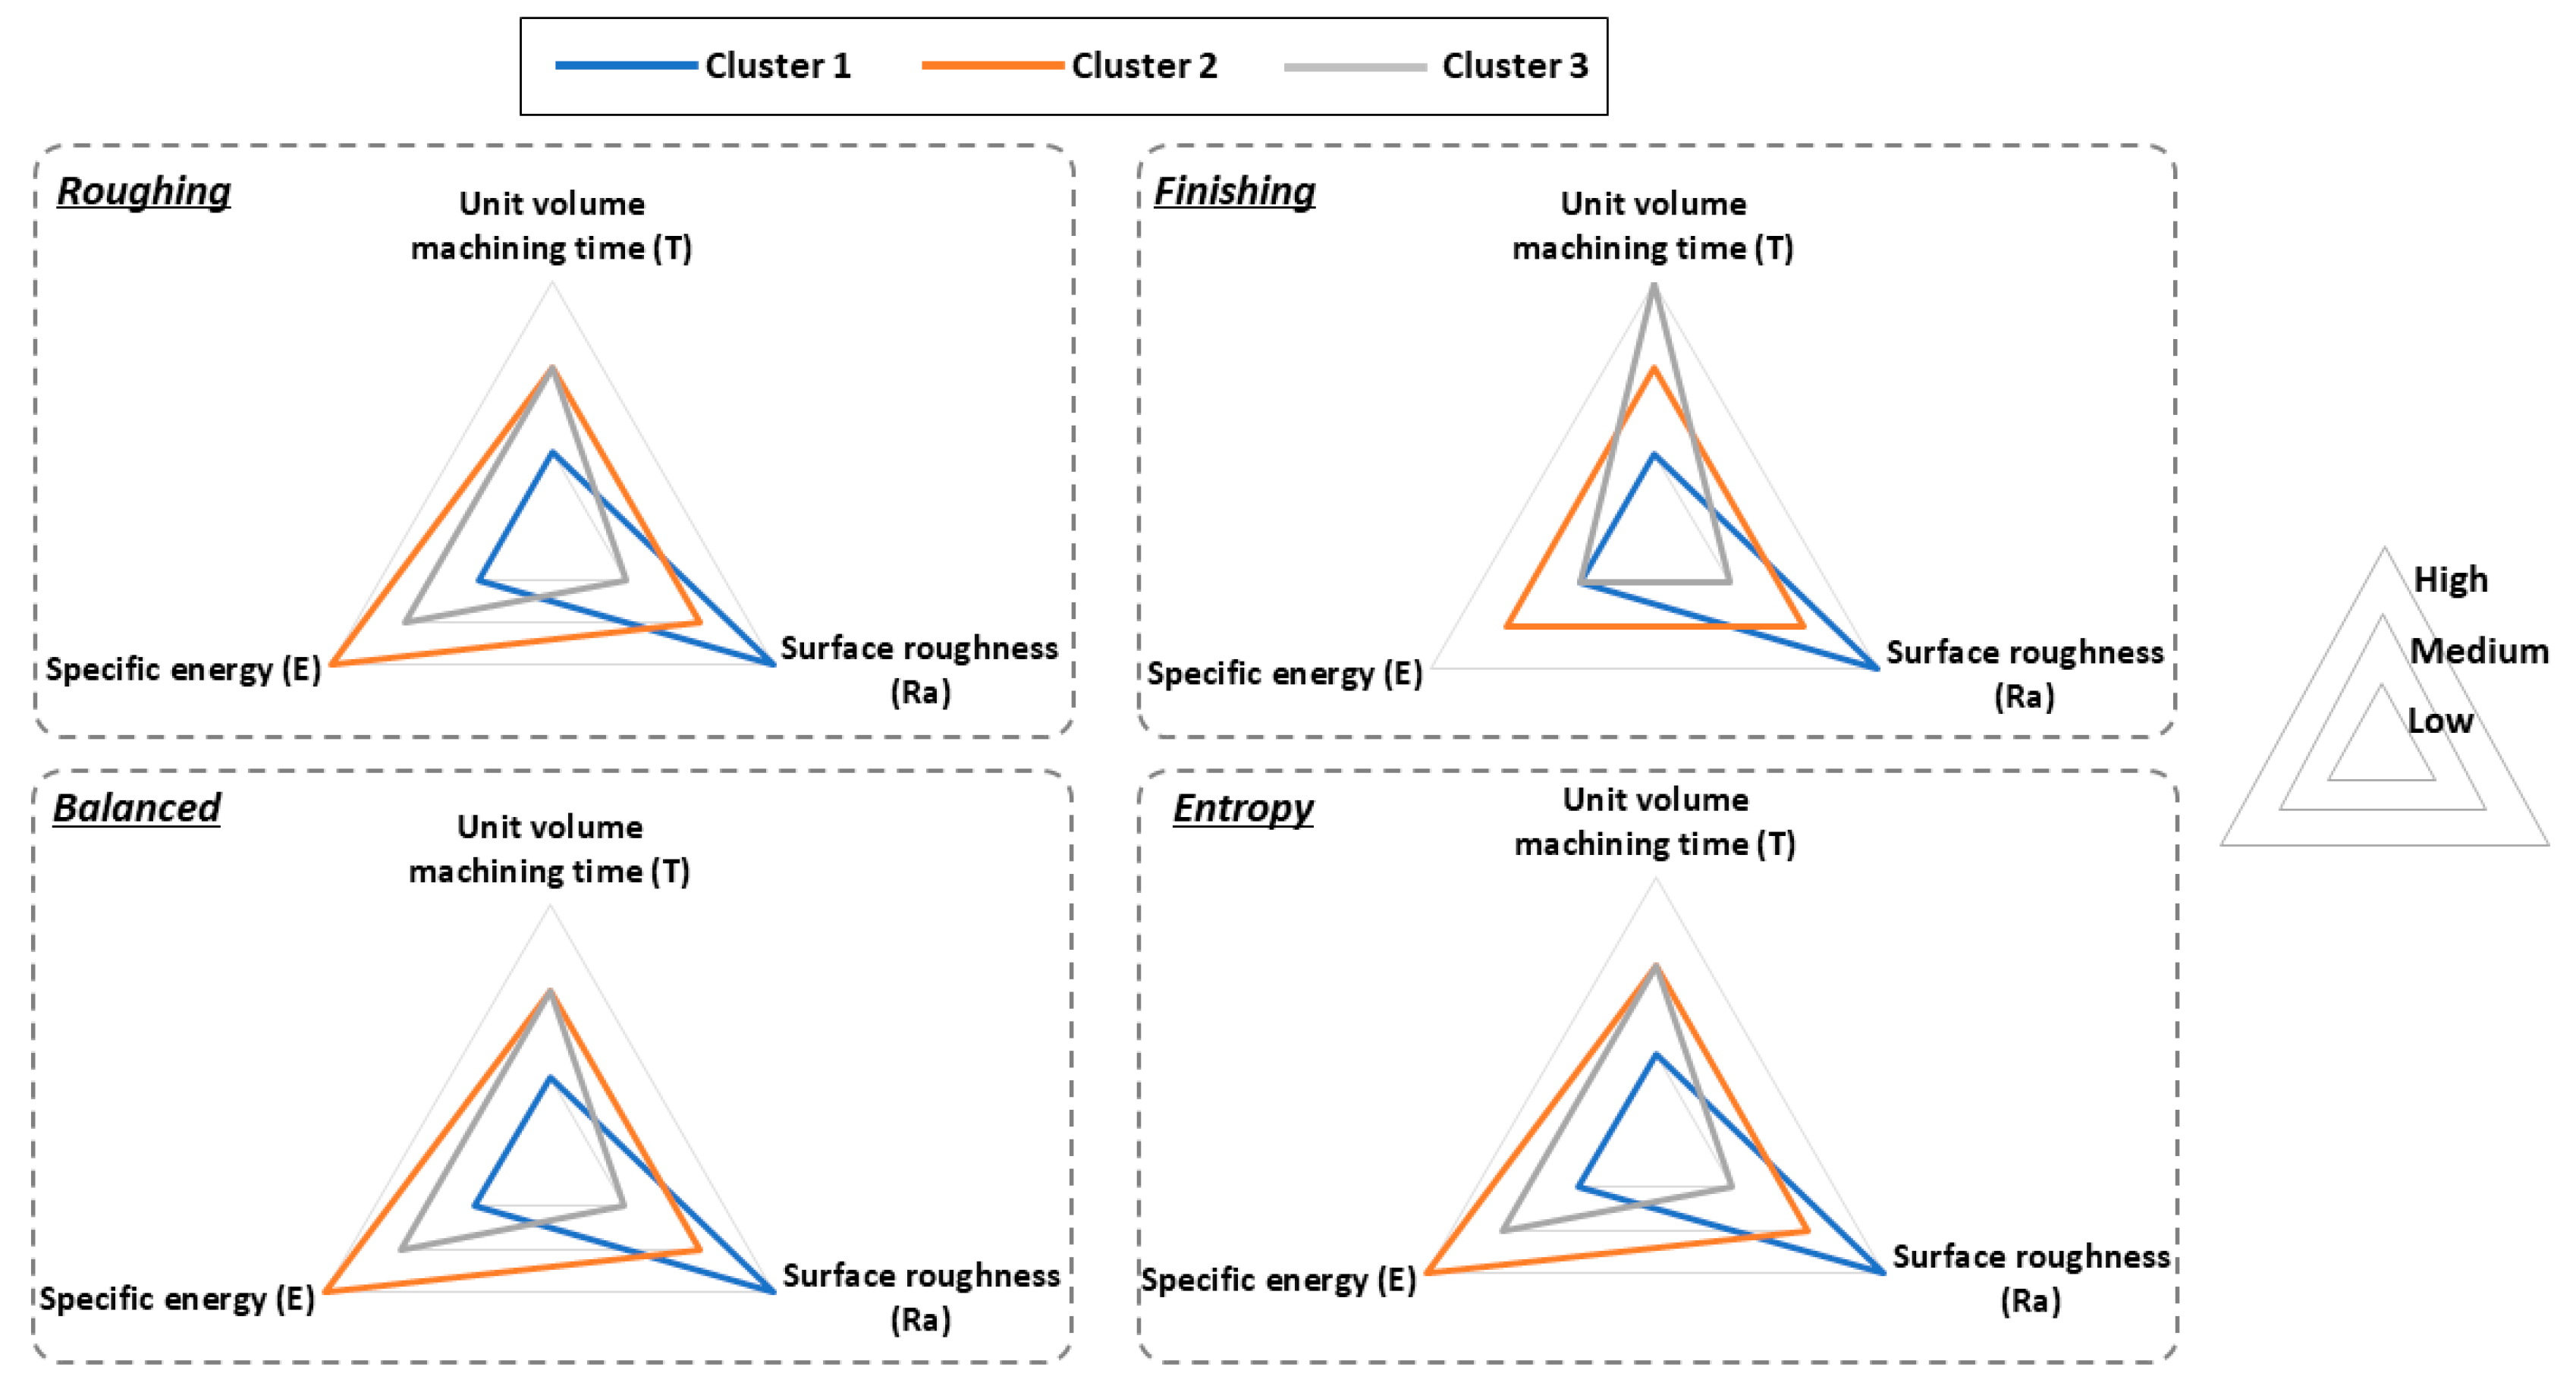
- The last step is to apply the GRA technique to find the optimal solution within each generated cluster for the four defined scenarios (i.e., entropy, finishing, roughing, and balanced). Table 5, Table 6 and Table 7 showed the optimal solutions for clusters 1–3, respectively. The optimal solutions for cluster 1 showed that both roughing and balanced-based scenarios can be achieved using the same process parameters. In addition, under all studied scenarios, the optimal level for the rake angle and nose radius was the same (i.e., nose radius of 0.8 mm along with a rake angle of 10°). Also, the optimal cutting velocity was 200 m/min for all scenarios, except the entropy scenario where it was 150 m/min. It should be stated that the results obtained in Table 5 were compatible with the physical meaning of each scenario. For example, the lowest surface roughness was obtained under the finishing scenario, while the lowest unit volume machining time was attained under the roughing scenario. In terms of the optimal solution for cluster 2, it is clear that the optimal level for the rake angle, nose radius, and cooling type was the same (i.e., nose radius of 0.8 mm, rake angle of 10o using MoS2). In addition, the results obtained in Table 5 were compatible with the physical meaning of each scenario. For example, the optimal level of feed rate under the finishing scenario was lower than the optimal feed rate used in the roughing scenario. Such information helps the decision maker to properly select the optimal process parameter settings based on the desired preference. Concerning the optimal solutions of the last cluster (see Table 7), it is clear that using graphite solid lubrication is dominant under all studied scenarios, except the finishing scenario where wet machining is the optimal cooling type. It is also noticeable that the optimal feed rate under all studied scenarios is the same (i.e., 400 mm/min). In addition, the optimal cutting velocity was the same under all scenarios, except the finishing scenario where the optimal cutting velocity was higher (i.e., 250 m/min). This is physically compatible with the finishing scenario, where higher velocity is required to achieve better surface quality. Generally, the obtained results in Table 5, Table 6 and Table 7 present all optimal solutions under the three generated clusters for the four studied scenarios. These different optimal solutions under different conditions provide the decision maker with the needed flexibility to select the optimal settings, and they make it simple for the decision maker to find the appropriate settings in the event that a new scenario is unexpectedly required. Because of this, such an approach is considered to be crucial in achieving a sustainable machining system.
4. Conclusions and Future Directions
Author Contributions
Funding
Conflicts of Interest
References
- Jayal, A.D.; Badurdeen, F.; Dillon, O., Jr.; Jawahir, I. Sustainable manufacturing: Modeling and optimization challenges at the product, process and system levels. CIRP J. Manuf. Sci. Technol. 2010, 2, 144–152. [Google Scholar] [CrossRef]
- Krolczyk, G.M.; Maruda, R.W.; Krolczyk, J.B.; Wojciechowski, S.; Mia, M.; Nieslony, P.; Budzik, G. Ecological trends in machining as a key factor in sustainable production—A review. J. Clean. Prod. 2019, 218, 601–615. [Google Scholar] [CrossRef]
- Lu, T. A Metrics-Based Sustainability Assessment of Cryogenic Machining Using Modeling and Optimization of Process Performance. Ph.D. Thesis, University of Kentucky, Lexington, KY, USA, 2014. [Google Scholar]
- Hegab, H.; Darras, B.; Kishawy, H. Towards sustainability assessment of machining processes. J. Clean. Prod. 2018, 170, 694–703. [Google Scholar] [CrossRef]
- Mia, M.; Gupta, M.K.; Lozano, J.A.; Carou, D.; Pimenov, D.Y.; Królczyk, G.; Khan, A.M.; Dhar, N.R. Multi-objective optimization and life cycle assessment of eco-friendly cryogenic N2 assisted turning of Ti-6Al-4V. J. Clean. Prod. 2018, 210, 121–133. [Google Scholar] [CrossRef]
- Salem, A.; Hopkins, C.; Imad, M.; Hegab, H.; Darras, B.; Kishawy, H. Environmental Analysis of Sustainable and Traditional Cooling and Lubrication Strategies during Machining Processes. Sustainability 2020, 12, 8462. [Google Scholar] [CrossRef]
- Ameta, K.L.; Solanki, V.S.; Singh, V.; Devi, A.P.; Chundawat, R.; Haque, S. Critical appraisal and systematic review of 3D & 4D printing in sustainable and environment-friendly smart manufacturing technologies. Sustain. Mater. Technol. 2022, 34, e00481. [Google Scholar]
- Fernández-Abia, A.I.; Barreiro, J.; de Lacalle, L.N.L.; Martínez-Pellitero, S. Behavior of austenitic stainless steels at high speed turning using specific force coefficients. Int. J. Adv. Manuf. Technol. 2012, 62, 505–515. [Google Scholar] [CrossRef]
- Hegab, H.; Salem, A.; Rahnamayan, S.; Kishawy, H. Analysis, modeling, and multi-objective optimization of machining Inconel 718 with nano-additives based minimum quantity coolant. Appl. Soft Comput. 2021, 108, 107416. [Google Scholar] [CrossRef]
- Salem, A.; Hegab, H.; Kishawy, H.A.; Rahnamayan, S. Multi-objective optimization during sustainable machining of difficult-to-cut materials. In Proceedings of the Joint Canadian Society for Mechanical Engineering and CFD Society of Canada International Congress, London, UK, 2–5 June 2019. [Google Scholar]
- Zarei, M.; Rezai, A.; Hamidpour, S.S.F. Breast cancer segmentation based on modified Gaussian mean shift algorithm for infrared thermal images. Comput. Methods Biomech. Biomed. Eng. Imaging Vis. 2021, 9, 574–580. [Google Scholar] [CrossRef]
- Salem, A.; Hegab, H.; Kishawy, H.A. An integrated approach for sustainable machining processes: Assessment, performance analysis, and optimization. Sustain. Prod. Consum. 2020, 25, 450–470. [Google Scholar] [CrossRef]
- Hegab, H.; Damir, A.; Attia, H. Sustainable machining of Ti-6Al-4V using cryogenic cooling: An optimized approach. Procedia CIRP 2021, 101, 346–349. [Google Scholar] [CrossRef]
- Zhang, X.; Yu, T.; Xu, P.; Zhao, J. An intelligent sustainability evaluation system of micro milling. Robot. Comput. Manuf. 2021, 73, 102239. [Google Scholar] [CrossRef]
- Moganapriya, C.; Rajasekar, R.; Santhosh, R.; Saran, S.; Gobinath, V.K.; Kumar, P.S. Sustainable Hard Machining of AISI 304 Stainless Steel Through TiAlN, AlTiN, and TiAlSiN Coating and Multi-Criteria Decision Making Using Grey Fuzzy Coupled Taguchi Method. J. Mater. Eng. Perform. 2022, 31, 7302–7314. [Google Scholar] [CrossRef]
- Salem, A.; Hegab, H.; Rahnamayan, S.; Kishawy, H.A. Multi-objective optimization and innovization-based knowledge discovery of sustainable machining process. J. Manuf. Syst. 2022, 64, 636–647. [Google Scholar] [CrossRef]
- Rodić, D.; Sekulić, M.; Gostimirović, M.; Pucovsky, V.; Kramar, D. Fuzzy logic and sub-clustering approaches to predict main cutting force in high-pressure jet assisted turning. J. Intell. Manuf. 2020, 32, 21–36. [Google Scholar] [CrossRef]
- James, G.; Witten, D.; Hastie, T.; Tibshirani, R. An Introduction to Statistical Learning; Springer: Berlin/Heidelberg, Germany, 2013; Volume 112. [Google Scholar]
- Lee, L.C.; Jemain, A.A. On overview of PCA application strategy in processing high dimensionality forensic data. Microchem. J. 2021, 169, 106608. [Google Scholar] [CrossRef]
- Anaraki, S.A.M.; Haeri, A.; Moslehi, F. A hybrid reciprocal model of PCA and K-means with an innovative approach of considering sub-datasets for the improvement of K-means initialization and step-by-step labeling to create clusters with high interpretability. Pattern Anal. Appl. 2021, 24, 1387–1402. [Google Scholar] [CrossRef]
- Halko, N.; Martinsson, P.G.; Tropp, J.A. Finding Structure with Randomness: Probabilistic Algorithms for Constructing Approximate Matrix Decompositions. SIAM Rev. 2011, 53, 217–288. [Google Scholar] [CrossRef]
- Liu, F.; Deng, Y. Determine the Number of Unknown Targets in Open World Based on Elbow Method. IEEE Trans. Fuzzy Syst. 2020, 29, 986–995. [Google Scholar] [CrossRef]
- Yuan, C.; Yang, H. Research on K-Value Selection Method of K-Means Clustering Algorithm. J. Multidiscip. Sci. J. 2019, 2, 226–235. [Google Scholar] [CrossRef]
- Zou, Z.-H.; Yun, Y.; Sun, J.-N. Entropy method for determination of weight of evaluating indicators in fuzzy synthetic evaluation for water quality assessment. J. Environ. Sci. 2006, 18, 1020–1023. [Google Scholar] [CrossRef] [PubMed]
- Tzeng, C.-J.; Lin, Y.-H.; Yang, Y.-K.; Jeng, M.-C. Optimization of turning operations with multiple performance characteristics using the Taguchi method and Grey relational analysis. J. Mater. Process. Technol. 2009, 209, 2753–2759. [Google Scholar] [CrossRef]
- Kuram, E.; Ozcelik, B. Multi-objective optimization using Taguchi based grey relational analysis for micro-milling of Al 7075 material with ball nose end mill. Measurement 2013, 46, 1849–1864. [Google Scholar] [CrossRef]
- Reddy, N.S.K.; Rao, P.V. Experimental investigation to study the effect of solid lubricants on cutting forces and surface quality in end milling. Int. J. Mach. Tools Manuf. 2006, 46, 189–198. [Google Scholar] [CrossRef]
| Cutting Velocity (m/min): Vc | Feed Rate (mm/min): f | Rake Angle (o): α | Nose Radius (mm): r | Cooling Type: C | |
|---|---|---|---|---|---|
| Level 1 | 150 | 200 | 4 | 0.4 | MoS2 |
| Level 2 | 200 | 300 | 10 | 0.8 | graphite |
| Level 3 | 250 | 400 | 16 | 1.2 | Wet |
| Unit Volume Machining Time (min/mm3): T | Surface Roughness (µm): Ra | Specific Energy (J/mm3): E | ||||
|---|---|---|---|---|---|---|
| Min. | Max. | Min. | Max. | Min. | Max. | |
| Cluster 1 | 0.000167 | 0.00025 | 0.29 | 0.969 | 16.3 | 42.53 |
| Cluster 2 | 0.000125 | 0.000167 | 0.39 | 0.81 | 9.25 | 22.33 |
| Cluster 3 | 0.000125 | 0.000167 | 0.69 | 1.34 | 11 | 32.77 |
| Weight Assigned to Unit Volume Machining Time (T) | Weight Assigned to Surface Roughness (Ra) | Weight Assigned to Specific Energy (E) | |
|---|---|---|---|
| Cluster 1 | 0.06 | 0.58 | 0.36 |
| Cluster 2 | 0.22 | 0.27 | 0.51 |
| Cluster 3 | 0.2 | 0.25 | 0.55 |
| Weight Assigned to Unit Volume Machining Time (T) | Weight Assigned to Surface Roughness (Ra) | Weight Assigned to Specific Energy (E) | |
|---|---|---|---|
| Roughing | 0.8 | 0.05 | 0.15 |
| Finishing | 0.05 | 0.8 | 0.15 |
| Balanced | 0.333 | 0.333 | 0.333 |
| Optimal Process Parameters | Optimal Responses | |||||||
|---|---|---|---|---|---|---|---|---|
| S | f | α | r | C | T | Ra | E | |
| Roughing | 250 | 300 | 10 | 0.8 | Wet | 0.000167 | 0.51 | 24.71 |
| Finishing | 250 | 200 | 10 | 0.8 | MoS2 | 0.00025 | 0.29 | 22 |
| Balanced | 250 | 300 | 10 | 0.8 | Wet | 0.000167 | 0.51 | 24.71 |
| Entropy | 150 | 200 | 10 | 0.8 | MoS2 | 0.00025 | 0.34 | 16.3 |
| Optimal Process Parameters | Optimal Responses | |||||||
|---|---|---|---|---|---|---|---|---|
| S | f | α | r | C | T | Ra | E | |
| Roughing | 150 | 400 | 10 | 0.8 | MoS2 | 0.000125 | 0.6 | 9.25 |
| Finishing | 250 | 300 | 10 | 0.8 | MoS2 | 0.000167 | 0.39 | 16.71 |
| Balanced | 150 | 400 | 10 | 0.8 | MoS2 | 0.000125 | 0.6 | 9.25 |
| Entropy | 150 | 400 | 10 | 0.8 | MoS2 | 0.000125 | 0.6 | 9.25 |
| Optimal Process Parameters | Optimal Responses | |||||||
|---|---|---|---|---|---|---|---|---|
| S | f | α | r | C | T | Ra | E | |
| Roughing | 150 | 400 | 10 | 1.2 | Graphite | 0.000125 | 0.85 | 11 |
| Finishing | 250 | 400 | 4 | 0.8 | Wet | 0.000125 | 0.698 | 22 |
| Balanced | 150 | 400 | 10 | 1.2 | Graphite | 0.000125 | 0.85 | 11 |
| Entropy | 150 | 400 | 10 | 1.2 | Graphite | 0.000125 | 0.85 | 11 |
Publisher’s Note: MDPI stays neutral with regard to jurisdictional claims in published maps and institutional affiliations. |
© 2022 by the authors. Licensee MDPI, Basel, Switzerland. This article is an open access article distributed under the terms and conditions of the Creative Commons Attribution (CC BY) license (https://creativecommons.org/licenses/by/4.0/).
Share and Cite
Hegab, H.; Salem, A.; Taha, H.A. A Decision-Making Approach for Sustainable Machining Processes Using Data Clustering and Multi-Objective Optimization. Sustainability 2022, 14, 16886. https://doi.org/10.3390/su142416886
Hegab H, Salem A, Taha HA. A Decision-Making Approach for Sustainable Machining Processes Using Data Clustering and Multi-Objective Optimization. Sustainability. 2022; 14(24):16886. https://doi.org/10.3390/su142416886
Chicago/Turabian StyleHegab, Hussien, Amr Salem, and Hussein A. Taha. 2022. "A Decision-Making Approach for Sustainable Machining Processes Using Data Clustering and Multi-Objective Optimization" Sustainability 14, no. 24: 16886. https://doi.org/10.3390/su142416886
APA StyleHegab, H., Salem, A., & Taha, H. A. (2022). A Decision-Making Approach for Sustainable Machining Processes Using Data Clustering and Multi-Objective Optimization. Sustainability, 14(24), 16886. https://doi.org/10.3390/su142416886


