Article

Urban-Metabolic Farming Modules on Rooftops for Eco-Resilient Farmscape

1
Engineering Cluster, Singapore Institute of Technology, 10 Dover Drive, Singapore 138683, Singapore
2
Sustainable Infrastructure Engineering (Building Services), Singapore Institute of Technology, 10 Dover Drive, Singapore 138683, Singapore
3
Department of Architecture and Building Science, Tohoku University, Sendai 980-8577, Japan
4
NetaTech Engineering Pte Ltd., 512 Chai Chee Lane #06-04, Singapore 469028, Singapore
5
Food, Chemical and Biotechnology Cluster, Singapore Institute of Technology, 10 Dover Drive, Singapore 138683, Singapore
*
Author to whom correspondence should be addressed.
Sustainability 2022, 14(24), 16885; https://doi.org/10.3390/su142416885
Submission received: 7 November 2022 / Revised: 27 November 2022 / Accepted: 28 November 2022 / Published: 16 December 2022

Abstract

:
The scarcity of land resources and food security challenges have prompted more effective uses of the rooftop as well as façade spaces in the urban city of Singapore. Urban rooftop spaces are used for mechanical and electrical (M&E) amenities such as air-conditioning cooling units and water tanks, so the spacious span of the roof area on HDB flats in Singapore is not available. Urban-metabolic farming modules (UmFm) built on 1.5 to 2 m terrace-step terrains have been modelled using BIM Revit to mimic such constraints in rooftop spaces. CFD simulation was conducted for the structure with consideration of the prevailing wind directions at different months of the year. The airflow with the inclusion of mesh netting and varying tiltings of the polycarbonate side façade was simulated to understand their impact on airflow in the growth envelope of the UmFm units under different prevailing wind directions. The amount of solar irradiance received by the crops at different heights in the UmFm due to the sun’s path, and shading of crops grown on the A-frame, was studied using Climate Studio. A comparative verification was done with a scaffold modular unit mounted with temperature, humidity, airflow, and Photosynthesis Photon Flux Density (PPFD) sensors. The digital model of the UmFm unit enables a prior assessment of site feasibility before actual physical implementation on an existing rooftop. It also facilitates plug and play for the UmFm unit to generate an eco-resilient farmscape for an urban city.

Graphical Abstract

1. Introduction

The Food and Agriculture Organization reported that urban agriculture has attracted more than half a billion people worldwide. This has a global contribution of 15% of food production [1]. In developed cities, urban agriculture is being reformed to produce food on a commercial scale [1]. One common constraint faced by urban farming is land scarcity. The urban farms should be highly productive with minimum dependency on artificial resources for the land-scarce urban environment [2]. According to Worldometer [3], Singapore’s population has increased from 1 million in 1950 to 5.8 million in 2020, and it may reach 6.9 million by the end of 2030. Singapore is the second most densely populated country in the world with limited land resources. Its high-rise buildings offer large surface areas of walls and roofs [4]. More than 90% of the food supply relies on overseas imports [5]. The scarcity of agricultural land, high costs, and disruption of supply chains due to conflict and pandemics have highlighted the need to develop a reliable and eco-resilient farming module [2]. With the aid of advanced technology, farming indoors is now possible; substituting sunlight with artificial LED lighting assists crops in making food through photosynthesis. Optimal Heat Ventilation and Air Conditioning (HVAC) systems promote crop growth and reduce the demand for water supply in controlled growth environments [6]. Indoor farming includes vertical farming, which allows crops to be vertically stacked in layers, but this has high variable costs with electrical bills for ventilation and lighting. Another type of indoor farming is rooftop farming on buildings with the advantage of using natural sunlight. Both methods of farming maximize the crop output within limited land space [7,8]. Utilization of the rooftops of Housing & Development Board (HDB) buildings to produce crops would be an added advantage for urban farming. However, current urban rooftop spaces are used for mechanical and electrical (M&E) amenities such as air-conditioning cooling units and water tanks. Competitive needs will require that the vertical structure constructed be modular and easy to plug in and use. Vertical farming on the building façade also offers additional advantages for the occupants. Especially in Singapore, which has a tropical climate throughout the year, the vertical farming of crops on the façade and rooftop would protect the building from excessive heat gain, which places higher demands on air-conditioning cooling. The setting up of urban farming on a rooftop will provide shade to the roof as well as provide a trans-evaporation effect as the crops grow, filtering out fine dust and thus improving air quality. Polycarbonate materials are used instead of traditional glass for the vertical farm as it helps to diffuse light more evenly than glass greenhouses. This helps plants thrive and even grow faster. Polycarbonate protects plants from excessive sunlight or radiation as it naturally offers UV protection.
In addition, by farming in a controlled environment, the crops are not affected by any bad weather conditions in the open area, and the harvest quality is controlled. It improves the environment by reducing the carbon footprint [1] during the transportation of food, as well as reducing crop damage that often happens during the logistical process [9]. It provides chemical-free food with no risk of pests and diseases [1]. However, with all the benefits it could bring to the country, indoor farming has some prominent challenges. One of them is the price of locally produced crops remaining competitive [10]. This is due to the high demand for artificial lighting to replicate sunlight for photosynthesis, and for the cooling and ventilation required for healthy plant growth. The airflow is of great importance for the proper growth of plants [11,12]. As mentioned in previous studies, the airflow velocity has to be within the range of 0.3–1 m/s [13] to provide sufficient ventilation for the crops. As mechanical ventilation might be required, the utilization of photovoltaic panels to produce electricity will be crucial to reduce energy consumption and improve the farming module efficiency [14,15]. Co-generative photovoltaic thermal modules of different geometrical and physical designs will provide an additional source of energy and preserve the architectural aspects of the farming module [16]. Based on the current state of the art, urban farming has great potential to reshape the future of agriculture. It has several advantages and could be a reliable source of food for cities. However, there are many challenges that need to be solved. Crop cultivation in urban farming requires a sufficient amount of light, airflow, and nutrients. The present work proposes a methodology that assesses the natural ventilation and natural lighting for a farming module in the early design stages. This methodology can be adopted to understand the anticipated future performance for a farming module before its physical construction. This work aims to study the airflow and the Photosynthetic Photon Flux Density (PPFD) inside an urban-metabolic farming module (UmFm). In our study, the UmFm will be erected on the step terrain of an unused plot of land in SIT@Dover to model the space constraint on the rooftops of the buildings. A good assessment of local airflow and the PPFD with consideration of the surrounding buildings is essential. Based on the stereographic sun path diagram for Singapore, we can infer that there are a total of three different key directions that the sun will travel: 70° overhead from the north during the summer solstice, 70° overhead from the south during the winter solstice, and mostly between 80 to 90° overhead on other days. CFD simulations are also performed for the four prevailing wind scenarios in Singapore. The effect of the opening angle for the façade’s panels is discussed. The impact of installing mesh netting (insect-proof screens) on the air velocity is introduced through simulations and experiments. The obtained air velocity is explained in the light of the optimal conditions for crop growth.

2. CFD and Daylight Simulation with Its Design Methodology

For the research study on the urban vegetable farm, multiple softwares were utilized to assist in the simulation work. Firstly, the geometric model and site layout were designed using Sketchup. Sketchup is a 3D modelling program commonly used in the industry due to its ease of use. After the model has been created, it was imported to Rhinoceros 3D and CFD Ansys Software [17] for further modelling and simulation. For the Rhinoceros 3D, a plug-in software known as Climate Studio was used to conduct the daylighting analysis on the geometric model. It provides users with the functions of architectural, landscape, and interior design. ANSYS Fluent is a commercial CFD software which is commonly utilized for urban physics applications [18]. The CFD Ansys Fluent Simulation was used for studying the airflow in the surrounding ambient around and within the growth structure. The daylight profile was obtained with Climate Studio which is an advanced daylighting, electric lighting, and conceptual thermal simulation software which covers luminance in the envelope. This is elaborated and shared in Section 3.5.

2.1. Computational Domain and Boundary Conditions for CFD Simulation

A 3D model of surrounding buildings and the UmFm structure was first generated using Sketchup, as shown in Figure 1b for the physical site shown in Figure 1a. An unused receding step terrain was used in our study to model the constraints typically faced by rooftop farming on low-rise buildings. Building amenities on the rooftop as well as potential shading from the neighboring high-rise buildings can limit the solar irradiance received, as shown in Figure 1c. The concept of a stilt house built on sloping terrain in a typical tea plantation was adopted in our design, which demonstrated an adaptable structure for challenging environmental terrain. A downward-sloping, segmented roof separated by an airgap of 10 to 15 cm is used to promote ventilation and to allow rainwater runoff. This is as illustrated in Figure 1c, which shows the side view of the UmFm structure. The UmFm is built on a scaffold structure which promotes air ventilation even from the base of the porous platforms. The urban-metabolic farming module (UmFm) is surrounded by buildings in all directions. Hence, the farming module will be subjected to air circulation in the wake regions behind those buildings from all directions. The overall dimensions for the farming module are about: 7.71 m × 4.93 m × 4.28 m (length × width × height).
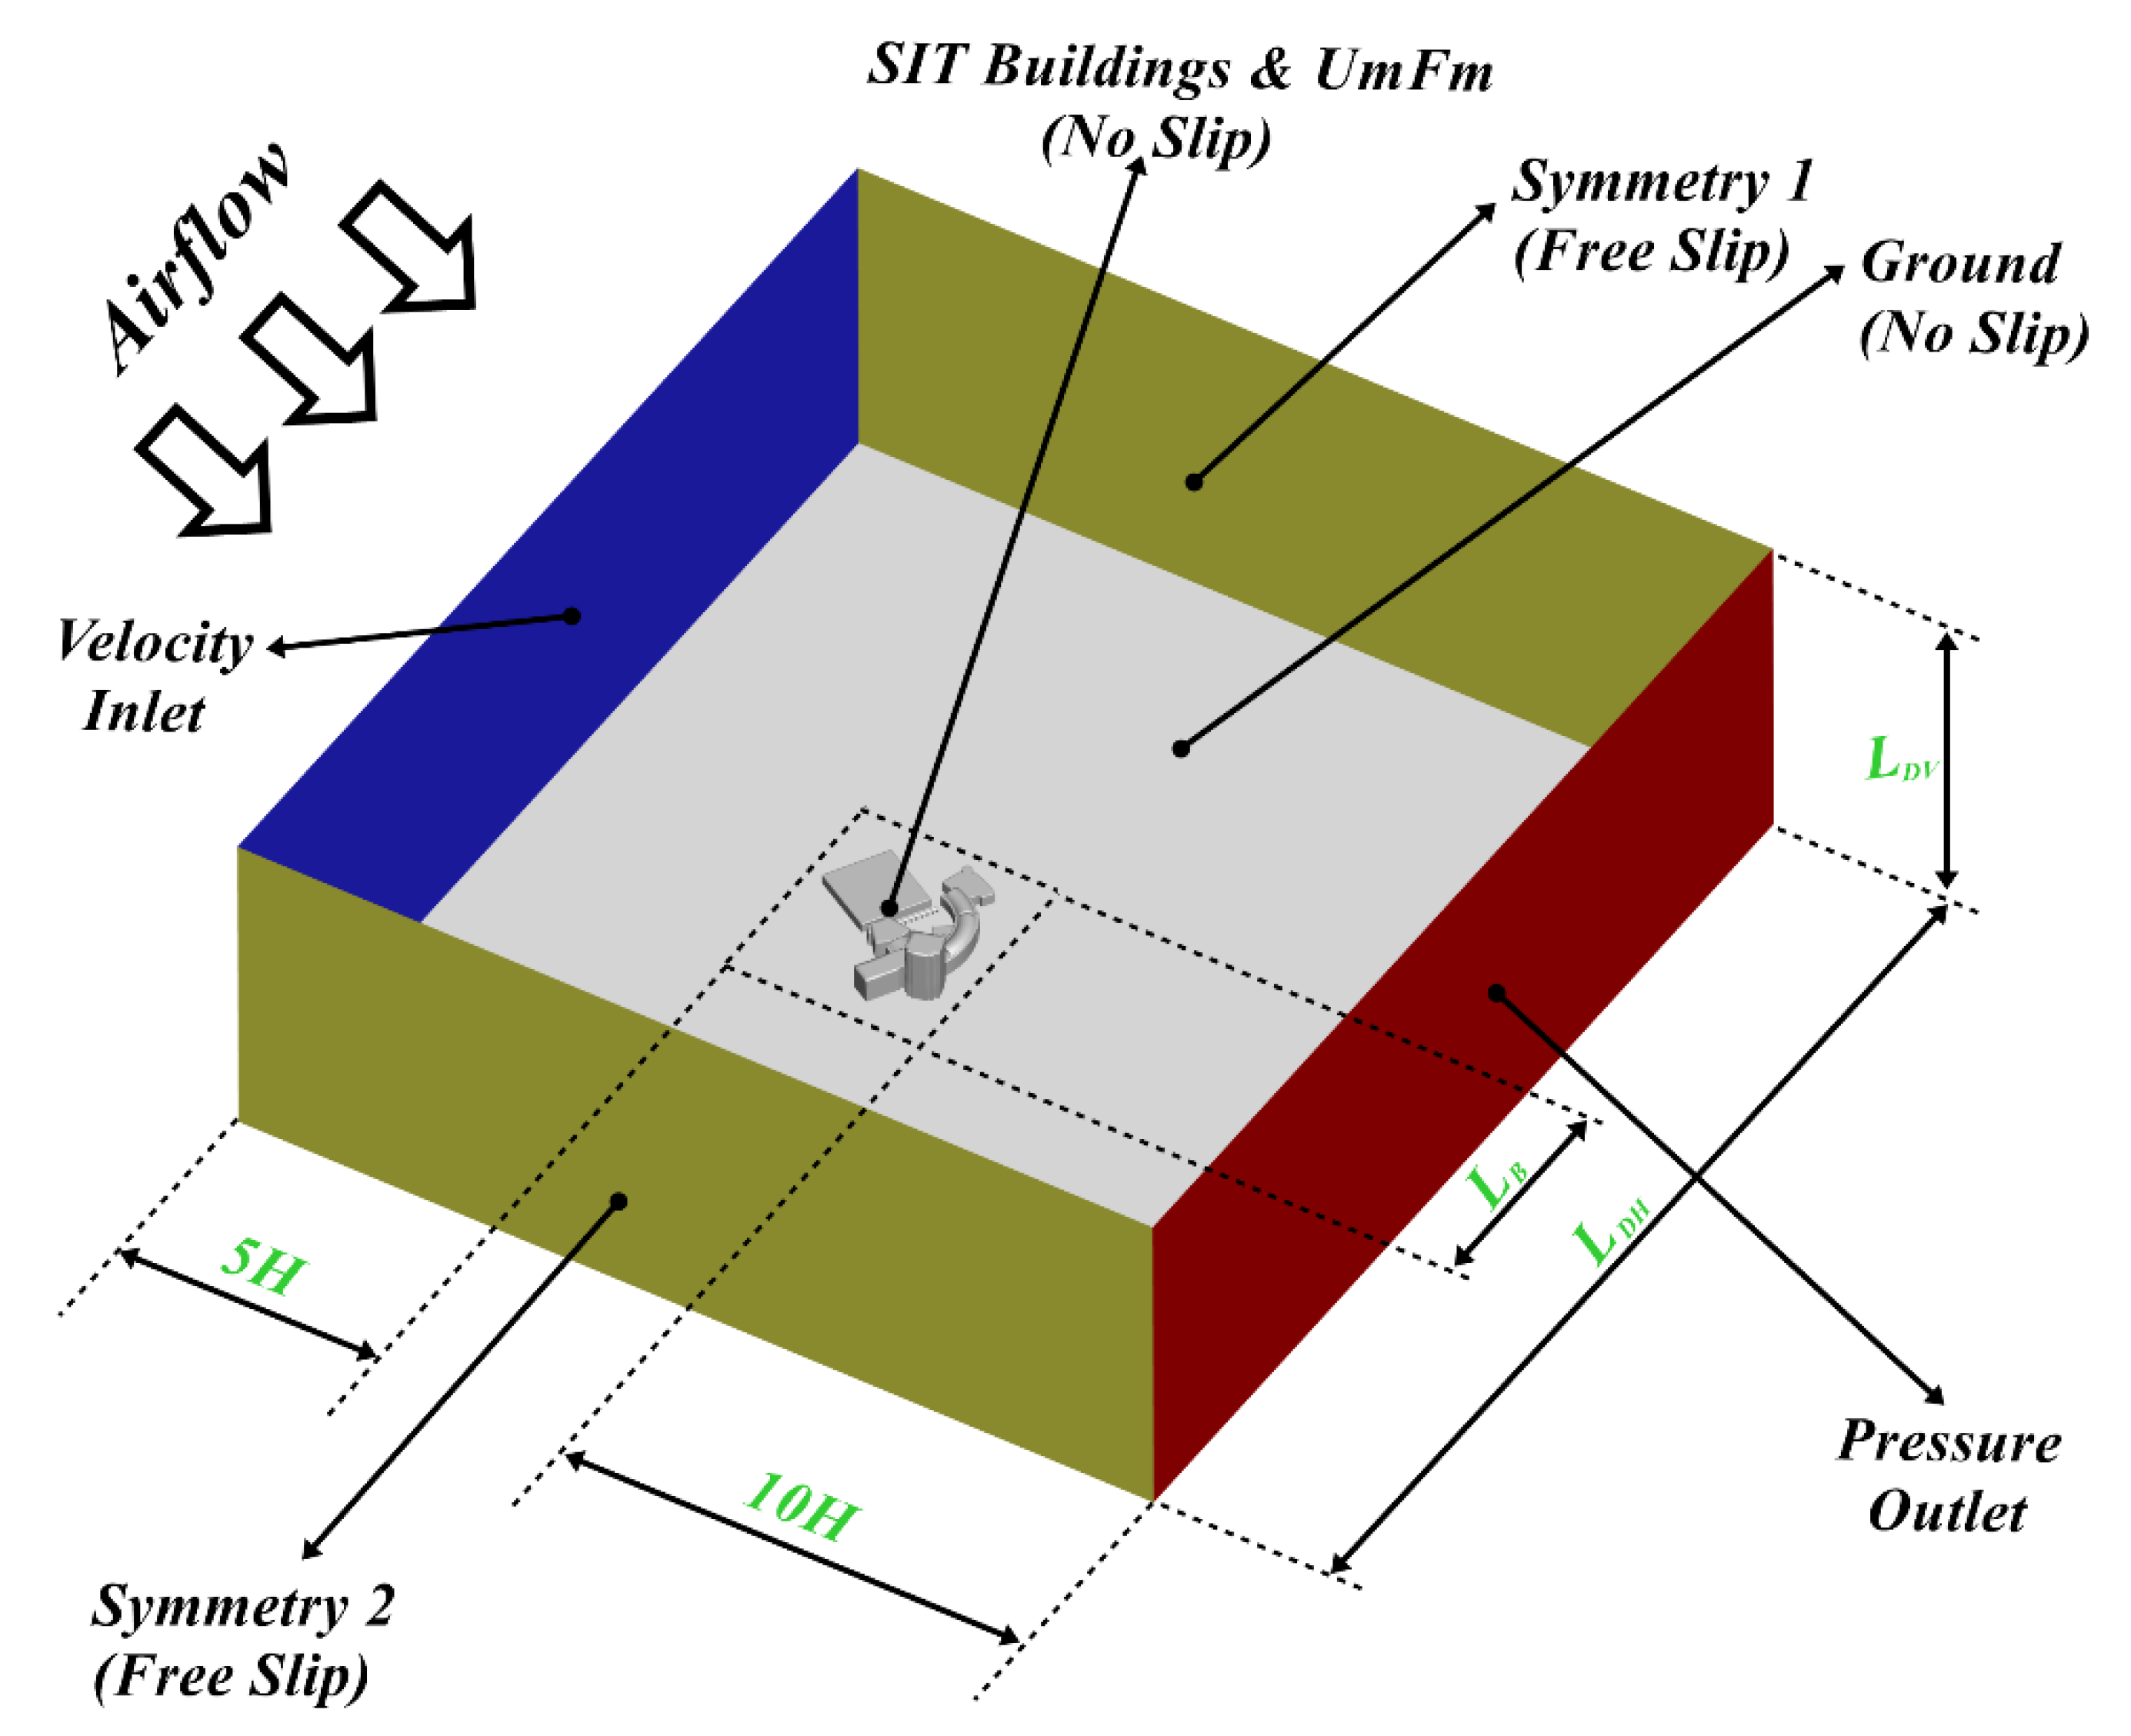
Figure 2 illustrates the computational domain dimensions and the applied boundary conditions. The dimensions of the computational domain were selected based on the guidelines stated in the best practice in the field of urban aerodynamics CFD simulations [18,19]. The upstream distance from the velocity inlet is 5H, where H is the height for the tallest building in the urban area of interest. In this case, the height for a building, 5 is taken as a reference, as depicted in Figure 2. The downstream distance from the SIT buildings to the pressure outlet boundary condition is 10H.
For the vertical and lateral extension of the computational domain, the following ratios are adopted to eliminate any potential blockage effect:
L B L DH < 17 %
H L DV < 17 %
Regarding the applied boundary condition, the sides and the top of the domain are considered to be symmetrical (free slip). The SIT buildings and the UmFm are wall (no-slip condition). For ANSYS Fluent [17] simulations, the roughness for the urban terrain needs to be specified in terms of roughness height (KS). According to Pattanapol et al. [20], the roughness height (KS) in ANSYS fluent can be calculated as KS = 20 × Z0, where Z0 is the Davenport–Wiering roughness length. The value for this parameter depends on the obstacles’ heights in the studied urban region. Based on Blocken’s review paper [18], Z0 is selected to be 1 m. Then, KS yields to 20 m. Regarding the overall Atmospheric Boundary Layer (ABL), the boundary condition follows the Green Mark [21] for prevailing wind direction in Singapore. The atmospheric boundary layer was applied at the velocity inlet. In addition, the recommended settings are applied for the turbulent kinetic energy and dissipation rates for the CFD RANS turbulence modelling as follows [22,23,24,25,26]:
U ( z ) = U ABL k ln ( Z + Z 0 Z 0 )
k ( z ) =   U ABL 2 C µ
ε ( z ) =   U ABL 3 k ( Z + Z 0 )
where UABL is the friction velocity, k the von Karman constant (0.42), and Cµ constant, generally taken equal to 0.09. The friction velocity (UABL) is calculated for a specified velocity (Uh) at a reference height (h) as:
U ABL =   k   U h ln ( h + Z 0 Z 0 )

2.2. Grid Generation

The Green Mark [21] recommendations for the grid sizing are adopted for generating the baseline mesh. Table 1 shows the grid sizing at different zones as suggested by the Green Mark. The grid refinement is performed mainly at the enclosure of the UmFm. The cell sizing inside the enclosure for different grids is 30 cm for Grid1, 15 cm for Grid2, and 7.5 cm for Grid3. Furthermore, the global minimum cell size is reduced from 1.5 cm to 1.1 cm to capture more details and curvatures of the scaffolding structure for the farming module while refining the mesh.
The grid independence study is conducted while simulating the airflow using these three grids. The number of cells for each grid is 43.1 M for the coarse grid, 64.5 M for the medium, and 79.9 M cells for the fine grid. During this study, the realizable k-ε turbulence model is utilized to estimate the Area-Weighted Average Velocity (AWAV) magnitude at a bounded plane inside the farming module at 1.35 m height above the second floor’s level. The aim of this study is to assure that the numerical results are independent of the grid structure. The asymptotic behavior is reached by the AWAV magnitude for the medium and fine grids. At the selected plane, 1.35 m above the second floor’s level, the converged value for the AWAV magnitude is fluctuating between 0.27–0.25 m/s. This means the results produced by the medium grid are independent of the grid structure. Therefore, the grid structure for the medium grid is considered while running the CFD simulations.

2.3. CFD Numerical Settings

The pressure-based solver available in ANSYS Fluent was utilized for numerical simulation. Discretization was performed using the finite-volume method with the second-order upwind scheme for all variables. This provides high accuracy for the results with reasonable numerical stability. The steady-state Reynolds-averaged Navier–Stokes (RANS) equations are solved using the Semi-Implicit Method for Pressure Linked Equations (SIMPLE) algorithm for pressure-velocity coupling. The SIMPLE algorithm uses a relationship between velocity and pressure corrections to enforce mass conservation and to obtain the pressure field. The strength of the SIMPLE method is its ability to efficiently obtain a steady-state solution for unsteady flow computations. The Realizable k-ε turbulence model was utilized for resolving the turbulent flow in the urban environment [26,27,28]. In each case, maximum residuals for turbulence equations have been converged to 10−5. The fully converged turbulent flow has been assessed through monitoring the AWAV magnitude at a certain plane inside the farming module. The value for the AWAV magnitude must be almost constant for the last 500 iterations to acknowledge convergence for the numerical case.
The effect of the mesh netting or “insect-proof screens” was introduced to the CFD simulations. This helps in realizing the potential decline in the air velocity inside the UmFm. In reality, the farming module has to be covered with these screens from all directions to prevent the access of harmful insects. However, this will significantly affect the air velocity inside the UmFm as it reduces the energy of the flow. In the CFD simulations, the mesh netting effect can be included by adding a porous media or a porous jump boundary condition. According to Darcy–Forcheimer, a source term should be added to the Navier–Stokes equations to accommodate the pressure drop created by the porous media. The source term is defined as follows [29]:
S Φ =   ( µ K U + ρ C f K U 2 )
where K is the permeability of the porous media, Cf is the inertial factor, ρ is the fluid density, µ is the fluid dynamics viscosity, and U is the flow velocity. Miguel [30] had developed two equations to calculate the permeability (K) and the inertial factor (Cf). Through experimental results, it was found that both factors are functions of the porosity for the screens as follows:
K =   3.44 × 10 9 ε 1.6
Y =   4.30 × 10 2 ε 2.13
where ε is the porosity for the mesh netting. These equations are valid for the porosity range of 0.04 to 0.9. In the present study, the porosity was around 0.365. This formula is utilized in many publications such as Villagrán et al. [31], Fatnassi et al. [29], and Bartzanas et al. [32]. The thickness of the porous medium (insect-proof screens) was 5.2 × 10⁻⁴ mm. The porous jump boundary condition in ANSYS Fluent resembles the effect of mesh netting in the CFD simulations. It reduces the flow energy and causes a pressure drop. This is a 1D simplification for the porous media model available for cell zones. This approach helps to reach numerical stability for the numerical case, especially when the flow moves through the porous zone from different directions.

2.4. Experimental Setup

The measurements were performed to have a better understanding of the CFD results. Two hot wire probes were used for obtaining the instantaneous air velocity. One probe was placed inside the mesh netting, while the other probe was placed outside. Figure 3a illustrates the schematic drawing for the field measurements. Basically, there are two chambers. In collaboration with our industrial partner, we covered one chamber of the scaffolding structure at Oasis Living lab with mesh netting, while the other chamber was left uncovered as a reference. The air velocity probes were placed in the middle of each chamber at the height of 1.2 m above the floor level (3.2 m above the ground level), as pointed out in Figure 3b. The rooftop was covered with polycarbonate panels for the two chambers. The accuracy for the hot wire probes is ±0.03 m/s. The measuring range is 0 to 20 m/s. The data were stored once each minute for the time span of around 4 h. The air temperature and humidity sensors were also installed at the location in reference and in the mesh netting.

2.5. Daylight Profiling

For the daylighting analysis, the site location that was input into the simulation process was based on the following details. For the site location, the latitude was 1.309° North and the longitude 103.866° East. The simulation dates were focusing on the annual results to determine the solar heat gain on all façades of the UmFm module. Obtaining the average solar heat gain can help us determine in which month the most and the least amounts of solar radiation will be absorbed on the façade. As we are bringing in natural daylight, we can also determine the month in which the modular farm will obtain the best and worst results in terms of bringing in sufficient solar heat, PPFD, and DLI. For the polycarbonate material used, it is assumed that the visible transmittance is about 80% and its U value is 3.96 W/m2.K. The planter boxes used in the UmFm structure are staggered in the shape of an “A” frame. This ensures that all the crops at different heights of the planter box can receive adequate photosynthetic photon flux density (PPFD). The photosynthetic photon flux density (PPFD) measures the light that reaches the crop canopy in the Par zone or the number of photosynthetically active photons that fall on a given surface each second. This is measured with the Light Passport. The other important parameter is the DLI which is measured in units of mol/m².d and each plant has a specific requirement of DLI for its growth. Values ranging between 6–18 mol/m²/d are common depending on the plant type. There is a relationship between PPFD and DLI which is given by: DLI = PPFD × light hours per day × (3600/1000,000). There is a trade-off between PPFD, and the number of light hours required to achieve a certain DLI value. A higher PPFD will require fewer light hours to achieve the desirable DLI, but excessive PPFD within a short period may not be good for optimal crop growth.

3. Results and Discussion

In this section, the numerical results are explained for different cases. Three effects are studied, which are: opening angles for the façade’s panels, wind direction, and mesh netting. The flow field inside the UmFm is presented at a height of 1.35 m above the second floor’s level. This is one of the planes at which the crops will be placed inside the farming module. The distribution of the planter boxes in the UmFm will be discussed in Section 3.5. The predicted impact of the AWAV magnitude on the plants’ growth is discussed in the light of current literature.

3.1. Effect of Different Opening Angles for the Façade’s Panels

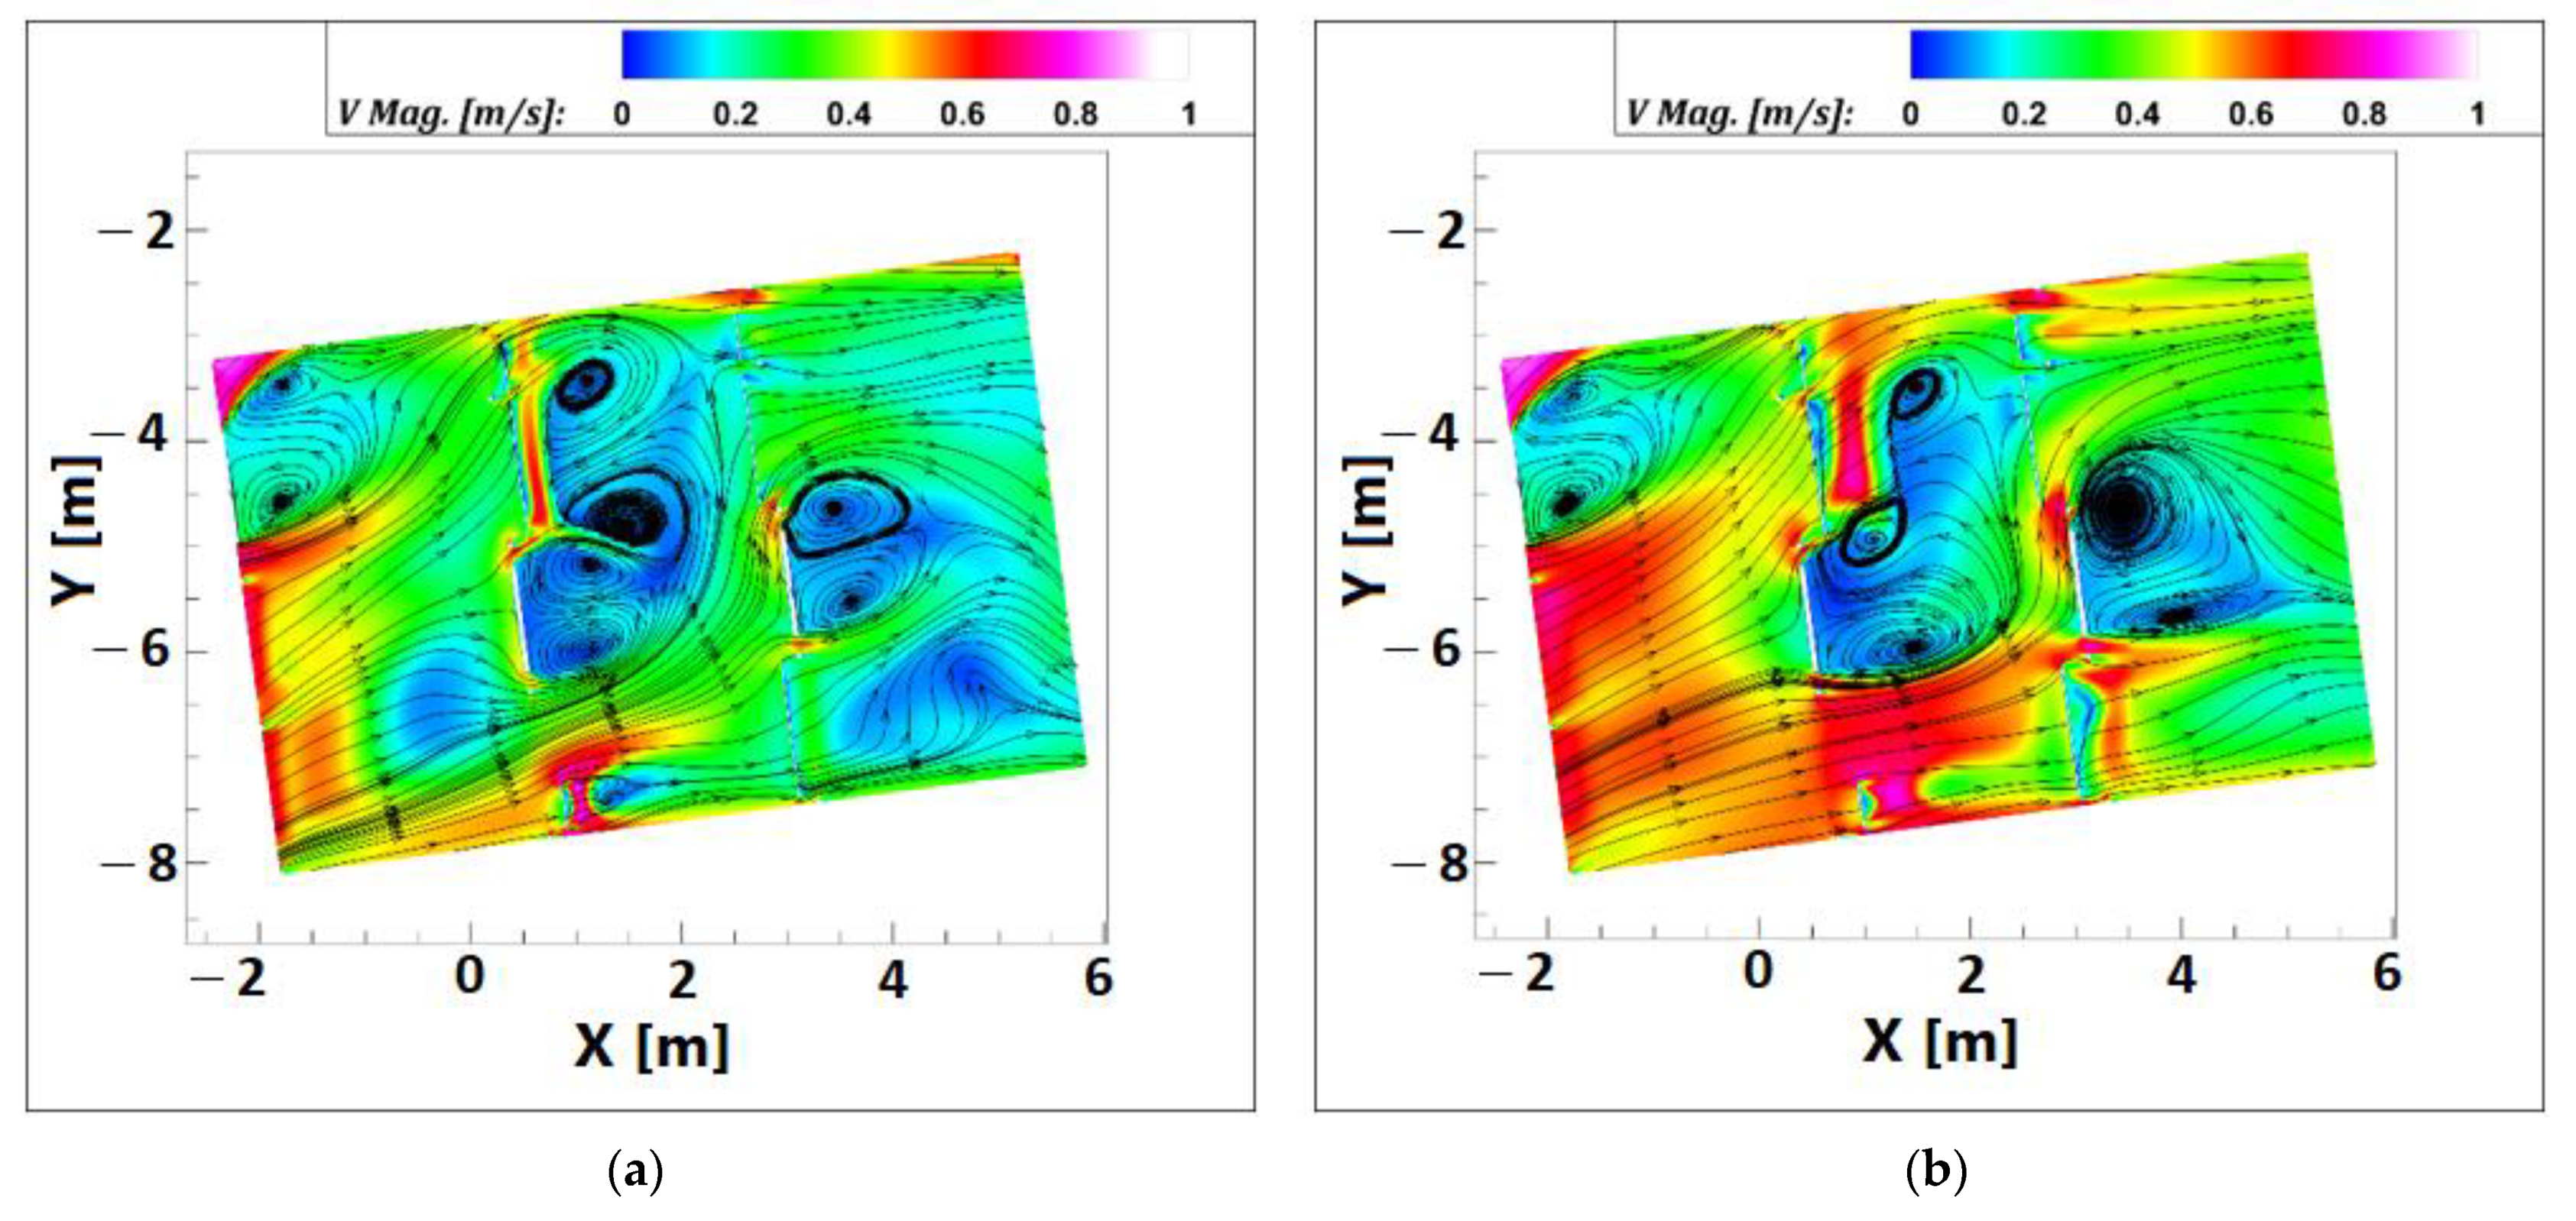
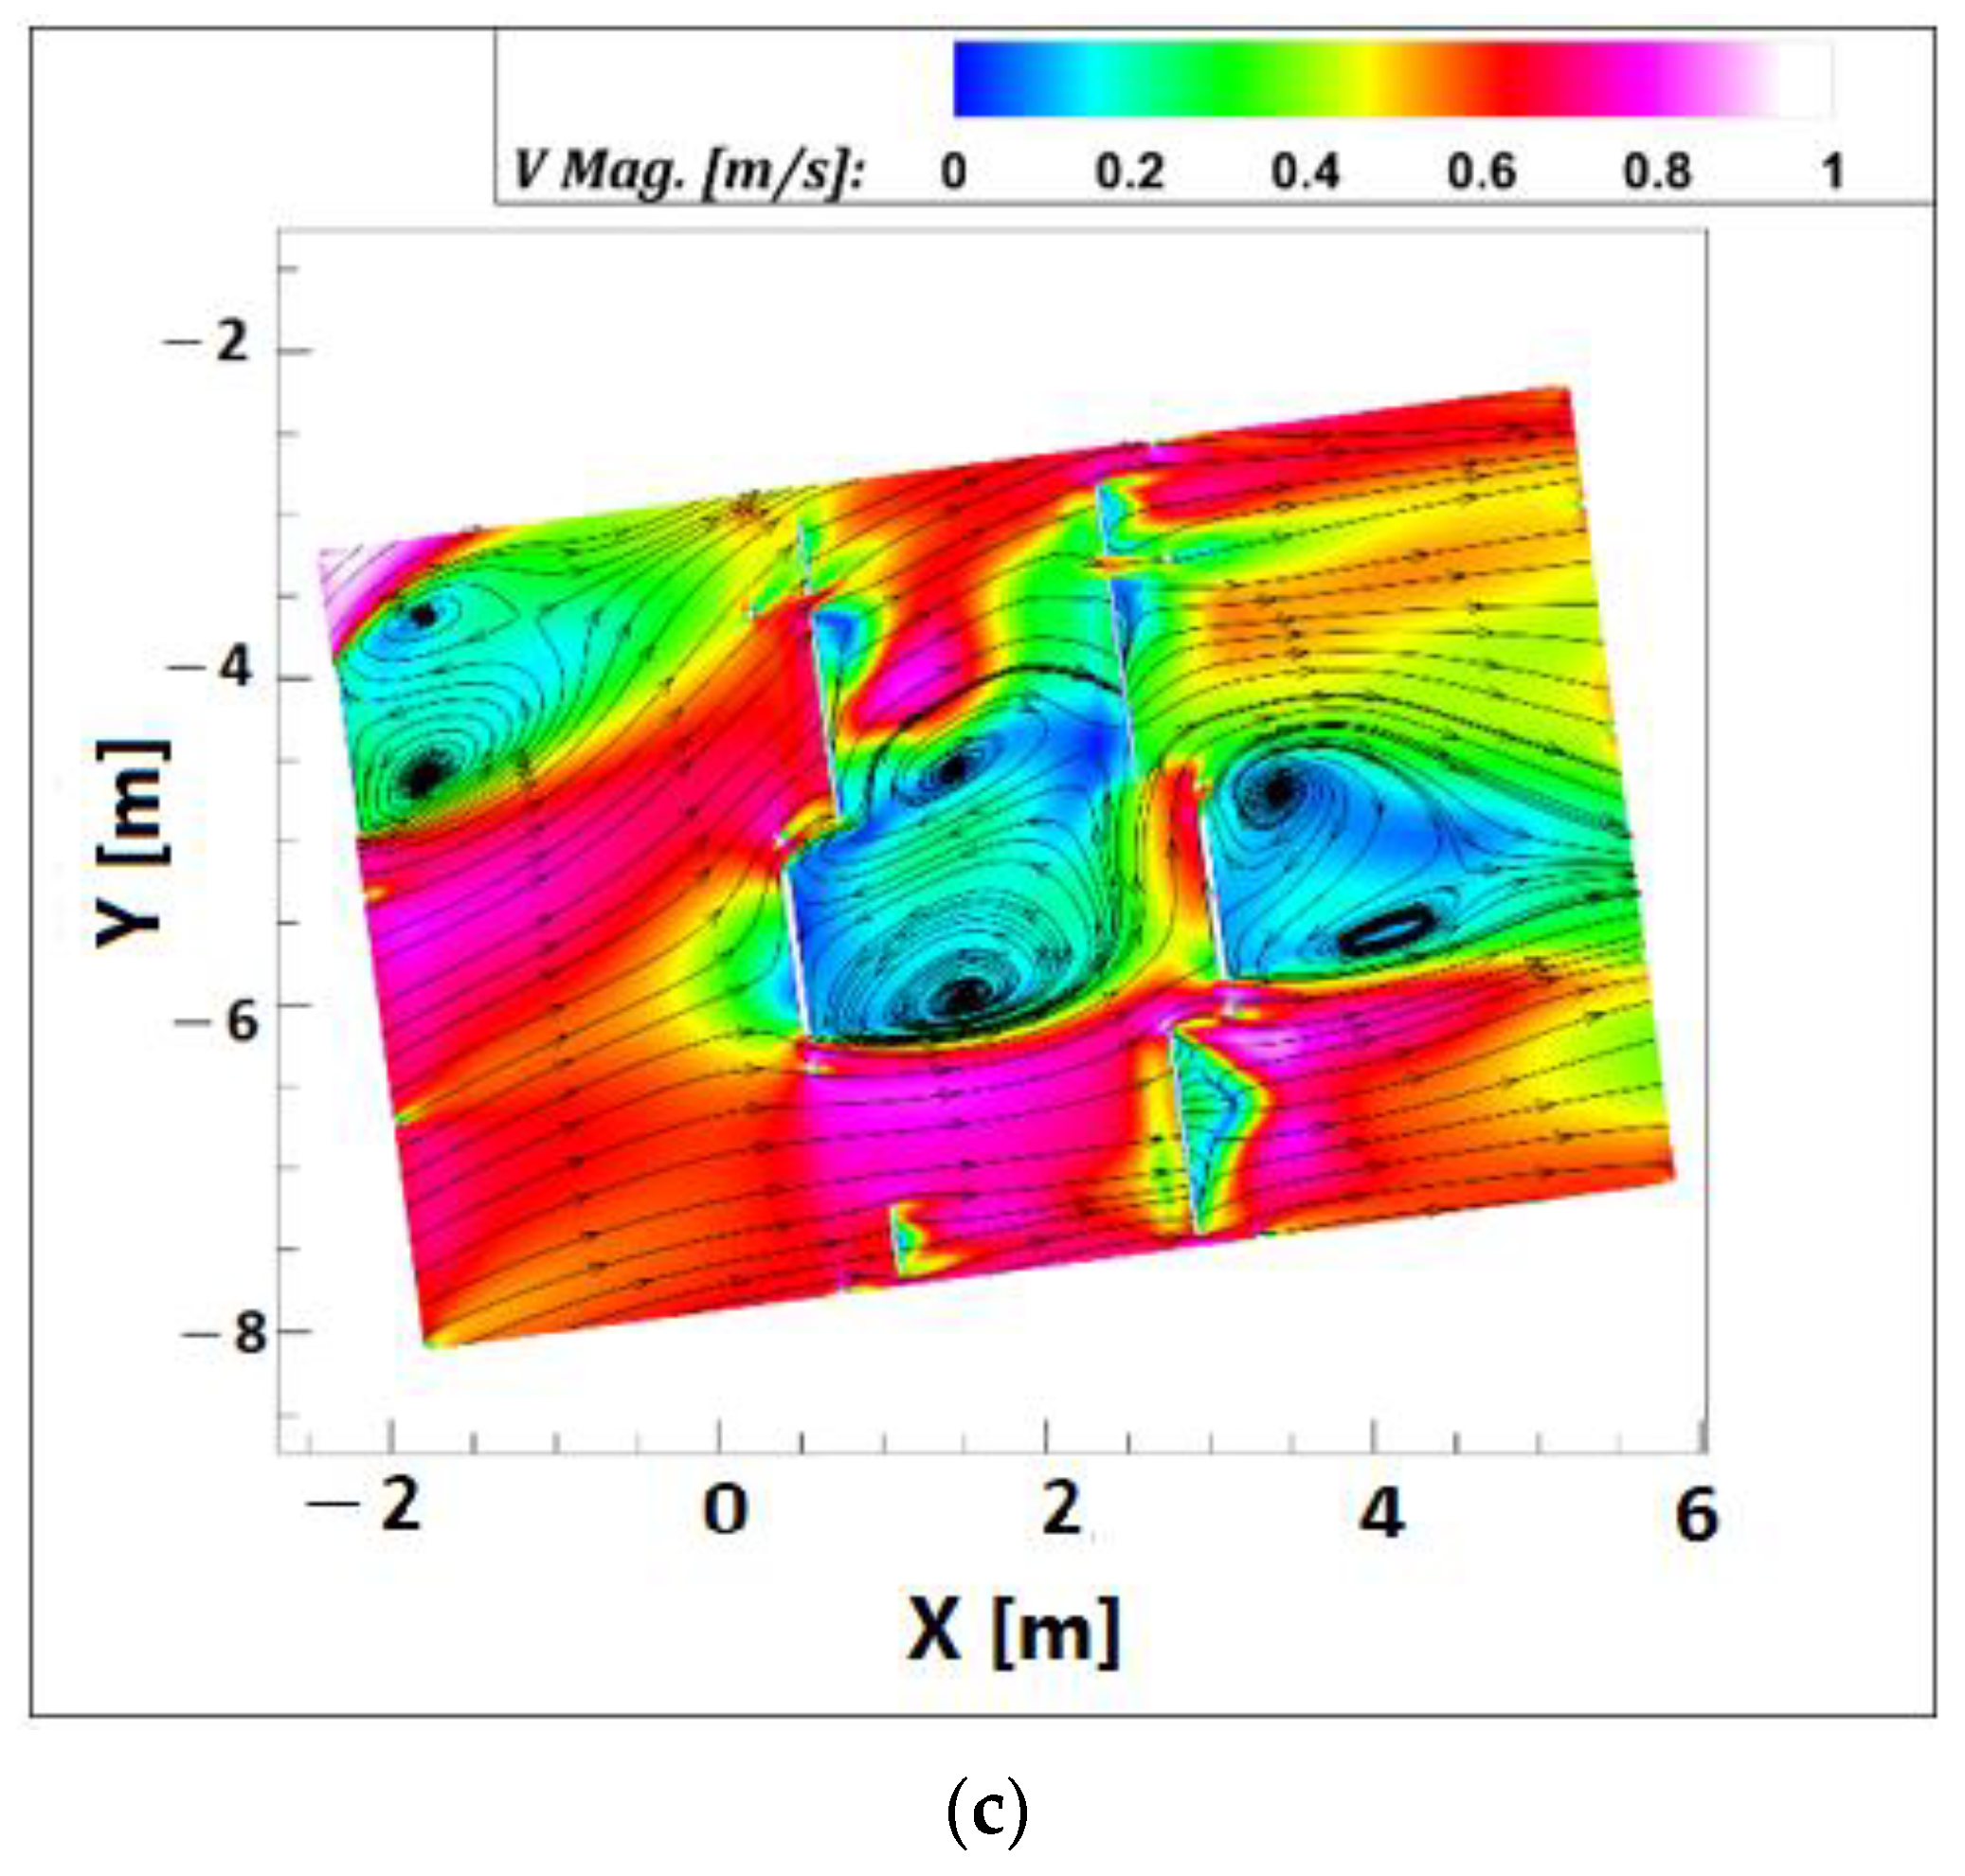
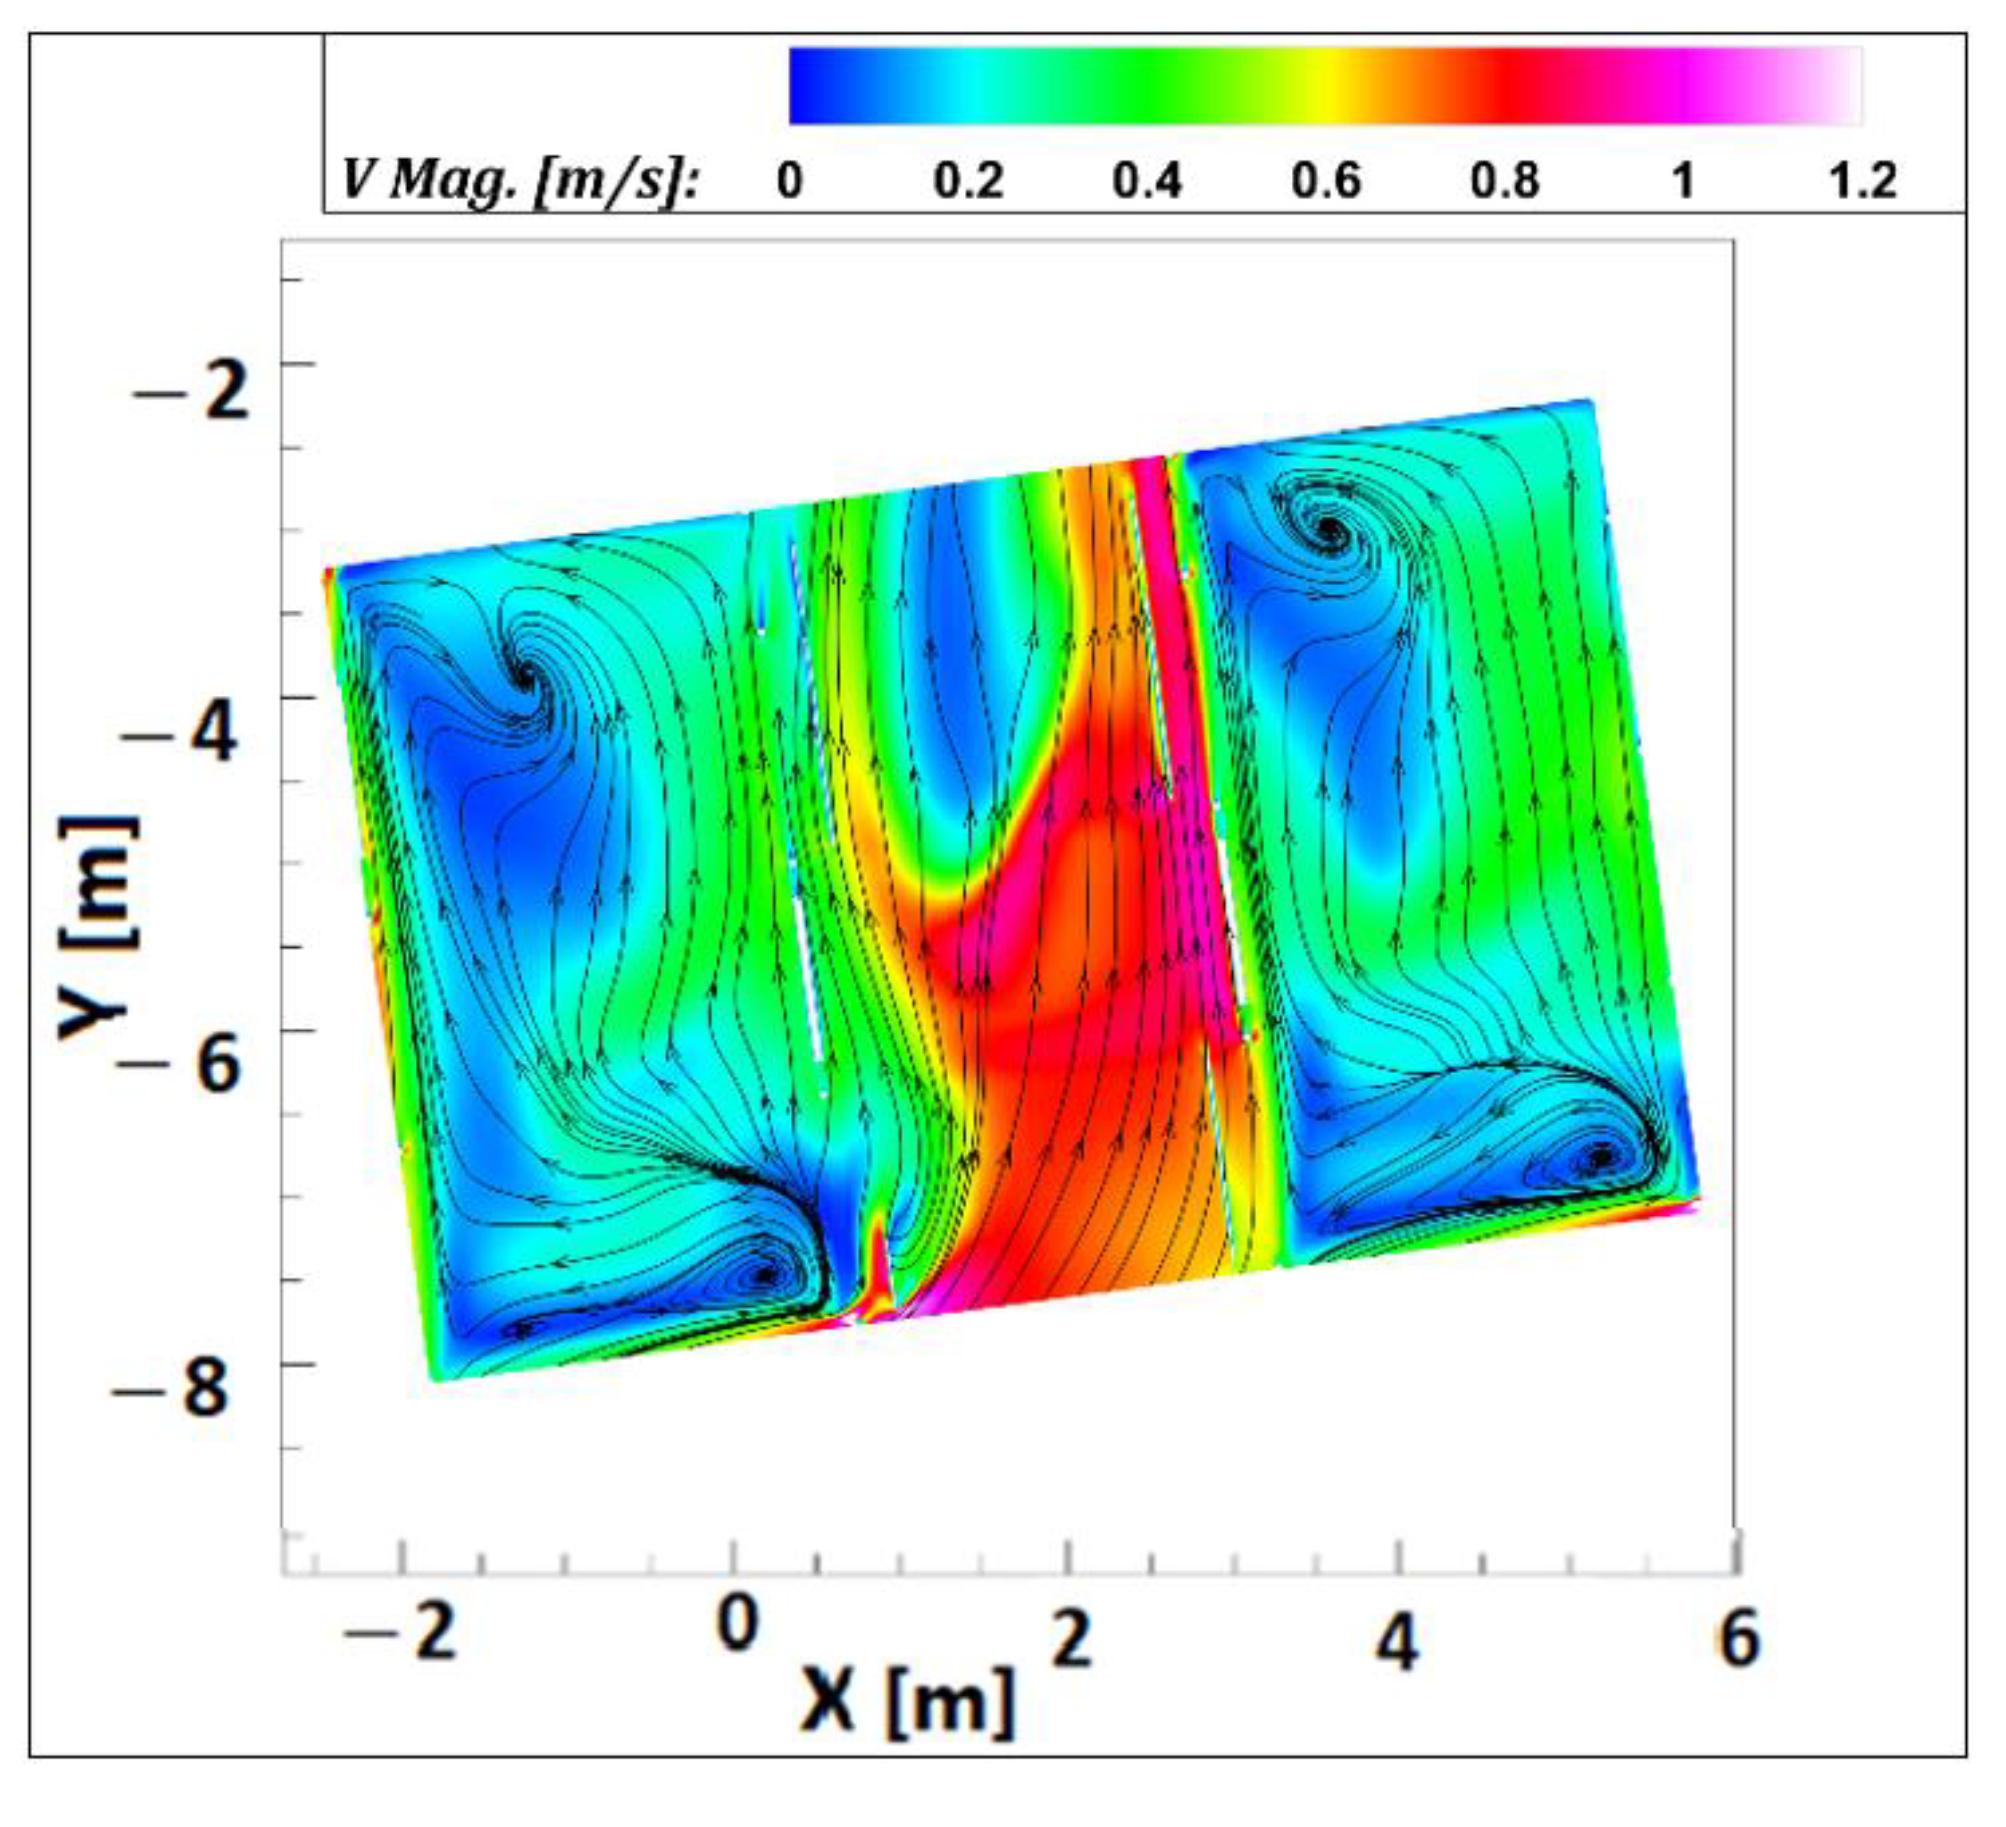
For the sake of natural ventilation, the ideal case will be without façade panels. However, due to the heavy rains in Singapore, the presence of the façade panels is necessary to protect the crops from the wind-driven rains. Three opening angles for the façade’s panels were studied, 25°, 45°, and 60°. As can be seen in Figure 4, the air approaches the farming module from the LHS in the case of the south wind scenario. In general, the flow vortices are generated at the flow separation region inside the LHS and RHS. This can be observed behind the side door at the LHS chamber and behind the middle door at the RHS, as shown in Figure 4c. The size for these two vortices does not change much when increasing the opening angles for the façade’s panels. However, the vortices in the middle section tend to diminish when increasing the angle of the façade. The farming module experiences high flow velocities for greater opening angles, especially in the LHS chamber. This culminates in greater AWAV magnitude, as shown in Table 2. Overall, the LHS has always better ventilation compared to the RHS chamber. However, the difference between both chambers shrinks (from 77.6% to 21%) as the opening angle for the façade’s panels increases. When increasing the opening angles for the façade’s panels from 25° to 60°, the AWAV magnitude is improved by at least 48.7% inside both chambers.
Kitaya et al. [12] reported that vertical downwards air currents with airspeeds higher than 0.3 m/s around the plants promoted the photosynthetic and transpiration rates in plants. Another study for the same plant, tomato seedlings, carried out by Li et al. [33], suggested that the best effect was seen in the treatment with an air velocity of 0.6 m/s. For sweet potato leaves, Kitaya et al. [11] observed that transpiration and net photosynthetic rates were almost constant at air current speeds of 0.3–1.0 m/s. The same range for air velocity is reported to be optimal by Ahmed et al. [13]. From the literature, the opening angle for the façade’s panels has to be at least 45°. This should provide air velocity >0.3 m/s inside both chambers of the UmFm.

3.2. Effect of Different Wind Direction

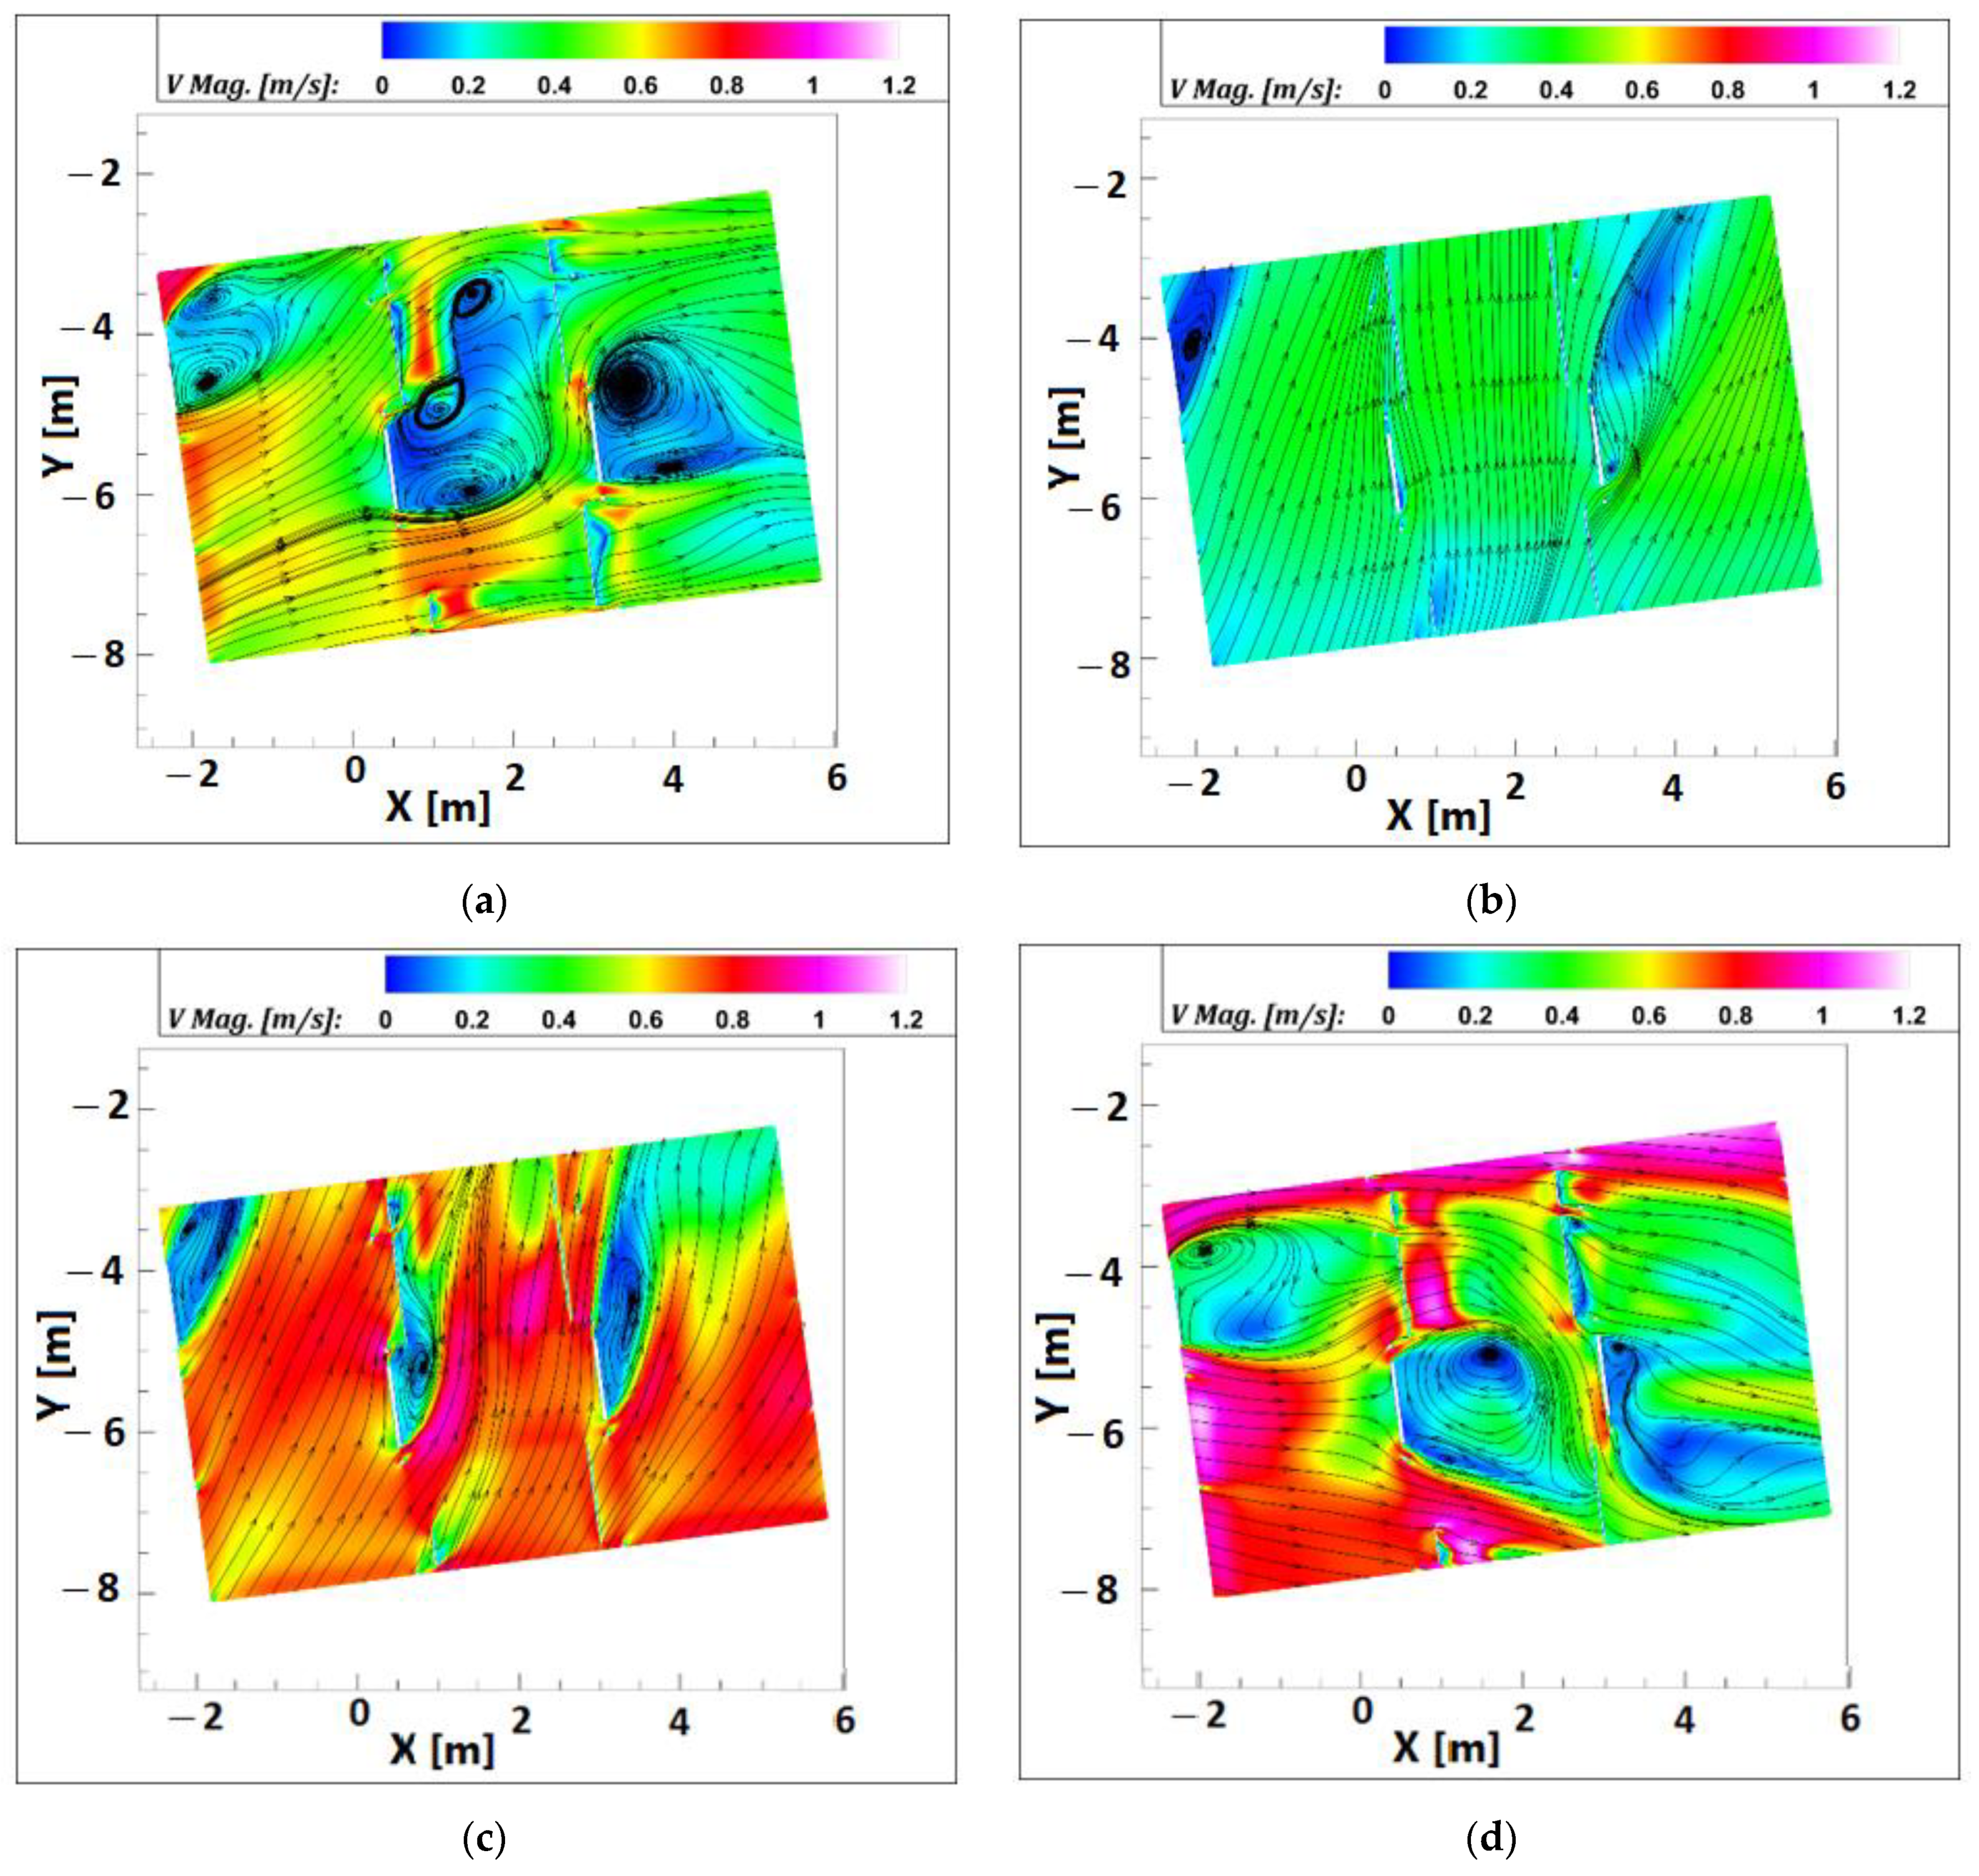
According to the Green Mark [21], there are four prevailing wind directions in Singapore during different seasons of the year, which are south, north, north-east, and south-east directions. Figure 5 shows the flow structure inside the farming module at a height of 1.35 m above the second floor’s level for different wind directions. From Figure 5b,c, the airflow encounters the least amount of resistance when it tackles the UmFm from the north and north-east directions. This is manifested as minimal size for the vortex structure. Moreover, the distribution for the velocity contours is similar for different chambers. This suggests a lesser difference in the AWAV magnitude between the LHS and RHS chambers. This is the opposite in the case of south and south-east winds, as shown in Figure 5a,d. The most significant difference in the velocity field between the two chambers is seen in the south-east wind scenario. As a result, the highest difference in the AWAV magnitude between the LHS and RHS chamber was reported for that wind scenario at 60%, as seen in Table 3. In contrast, the least difference in the AWAV magnitude between the two chambers was obtained for the north and the north-east wind, with less than 13%. For all tested wind scenarios, the 0.3 m/s air velocity was achieved for the LHS and RHS chambers. This means that the minimum air velocity for growing plants is achieved at a 45° opening angle for the façade’s panels. The best distribution for the AWAV magnitude for both chambers was found for the north-east wind scenario. In this case, the AWAV magnitude was around 0.6 m/s. This study reveals the importance of controlling the opening angle for the façade panels separately for the LHS and RHS. This will help in maintaining equal air velocity in the two chambers regardless of the wind direction.

3.3. Effect of Mesh Netting (Numerical)

The farming module should be covered with mesh netting (insect-proof screens) to prevent the access of insects and other harmful parasites to the crops. However, this will significantly influence the air ventilation inside the UmFm. Hence, CFD simulations were utilized to realize the potential impact of the mesh netting on airflow. The porous jump boundary condition was assigned at the rooftop and four sides for the LHS and RHS chambers. The porosity of the mesh netting is 36.48% and its thickness is 5.2 × 10⁻⁴ mm. From Equations (8) and (9), the permeability (K) and the inertial factor (Cf) are estimated for the porous jump. All other settings and boundary conditions are kept constant. The mesh netting was applied for the wind scenario that gives the best air ventilation, i.e., the north-east wind scenario. Figure 6 shows how the flow structure and the velocity contours are altered for the LHS and RHS chambers. Instead of having a smooth airflow inside each chamber, two major vortices are dominating the scene. The velocity contours also remarkably declined inside the two chambers. Two additional commercial mesh nettings were also considered for the simulation. For those mesh nettings, the porosity was 63.9% and 50%. Table 4 shows the results obtained for different mesh nettings. Applying the mesh netting with 36.48% porosity resulted in a 58.1% reduction in the AWAV magnitude for the RHS. This decline increased by 9.3% for the LHS. The mesh netting reduced the air velocity by at least 52.0%. Porosity higher than 64% will potentially allow insects to access the UmFm and, hence, damage the crops. Furthermore, the AWAV magnitude will have become less than 0.3 m/s for the two chambers. This indicates that the plants would not have sufficient ventilation to grow properly [12]. The results suggest that the installation of the mesh netting has a significant impact on the ventilation inside the farming module and, potentially, discourages crop growth. This reveals the necessity of installing artificial ventilation systems (such as fans and ducts) and not solely relying on natural ventilation when applying insect-proof screens under unfavorable wind conditions.

3.4. On-Site Sensing with Mesh Netting and Polycarbonate Rooftop

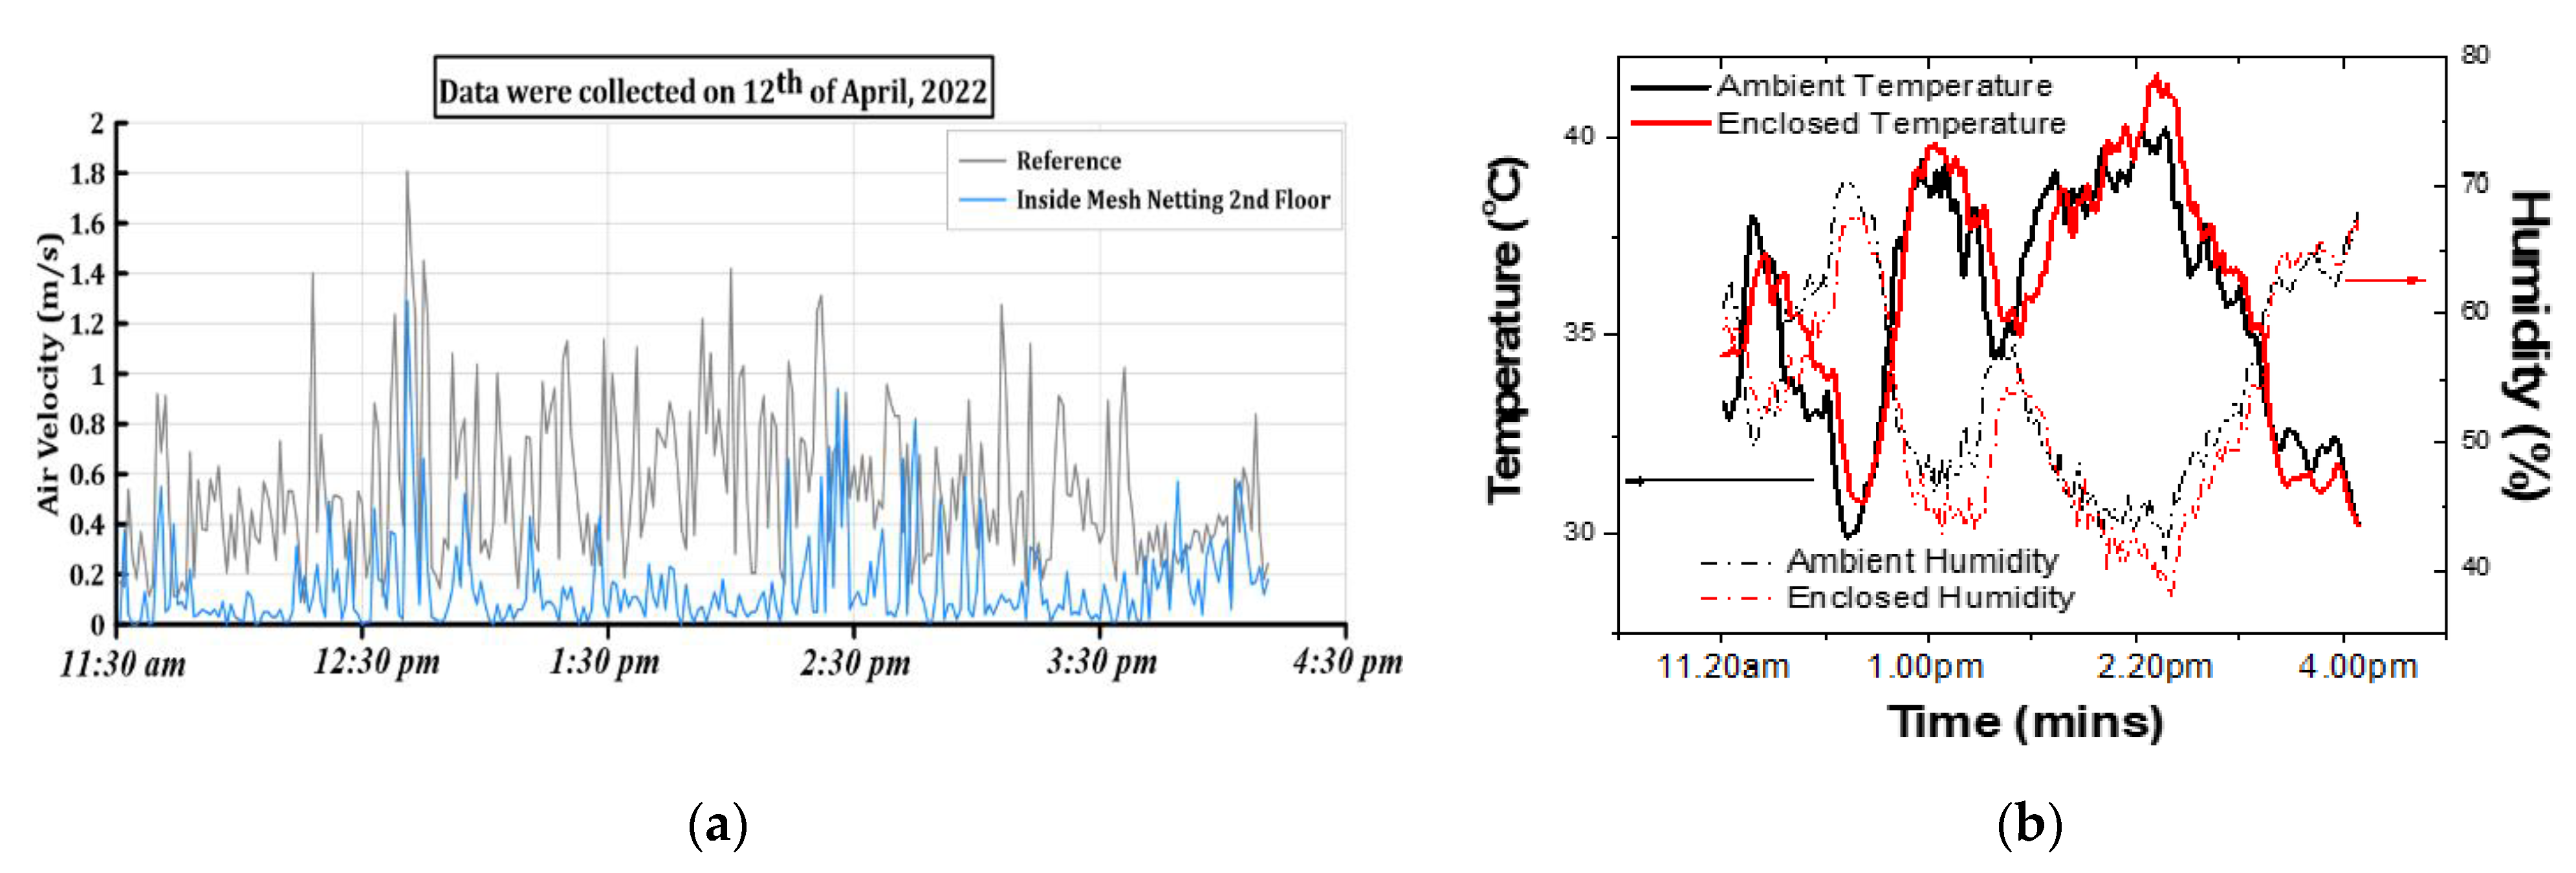
In this section, the authors explored the effect of installing the mesh netting experimentally. As discussed in Section 3.3, the CFD simulations predicted a significant decline in the AWAV magnitude with the use of mesh netting. This raised concerns regarding the crops’ growth and development. Hence, field measurements were conducted to understand this effect. The locations of the velocity probes and the experimental methodology were explained in Section 2.4. The velocity probes collected data for the air velocity at one-minute intervals for 4 h continuously. The results for the fluctuating velocity are given in Figure 7. As can be observed, the velocity fluctuations are haphazard. This reflected the natural wind gusts at the measuring site. On average, there is a great difference between the air velocity inside and outside the mesh netting. The time-averaged value for the air velocity at the Reference location was 0.537 m/s. This value declined by 71.7% due to the mesh netting effect and yielded 0.152 m/s. The porosity for the mesh netting used in the field measurements was 36.48%. The difference between the field measurements and the CFD simulations is less than 5%, considering the reduction in air velocity for the LHS chamber. This provides credibility for the conducted CFD simulations. In addition, it alerts the farming module designers to consider improving the ventilation artificially.
The on-site sensing of the temperature and relative humidity was carried out. The record of the temperature profile and humidity for the external ambient condition as compared to that in the mesh netting and polycarbonate was as shown in Figure 7b. The positions for the placement of the sensors with the data loggers were at the same regions of placement used for the air velocity sensors, as shown in Figure 3a. The enclosed area by the mesh netting with the polycarbonate rooftop has the effect of providing an air insulation layer. This leads to a longer period before temperatures rise. On the other hand, the humidity built up in the enclosed mesh takes a longer period as well to reach its peak and it is lower than the ambient humidity by 5% due to constraints in the airflow and regulation into and from the mesh netting. The enclosed area has minimal temperature and humidity variation as compared to the outdoor environment, which allows the vapor pressure to be better controlled when the crops are in the specific temperature and humidity ranges [34].

3.5. Daylight Profiling for PPFD at the UmFm

The main focus of the simulation study was to analyze whether the crops on the planter boxes were absorbing sufficient daylight throughout the day. As such, the data tabulated through the simulation software needed to contain results for all the planter boxes. The point in time illuminance at the specific condition was collected for different times of the day as well as during different periods of the year.
The annual solar irradiation which Singapore receives is approximately 1580 to 1620 kWh/m2. Compared to the annual readings of Singapore, the planter boxes were only facing 614 kWh/m2 of solar radiation per year, as shown in Figure 8a. This is due to the sun’s path and the partial shading due to surrounding high-rise buildings at different times of the day. The “A”-frame planter boxes will be the most ideal for implementation at the site considering that shading will be more prominent if the planter box is in the vertical layout. The average solar exposure in different months is also shown and it varied from 40 to 62 kWh/m2. The approximate PPFD based on annual solar radiation of 614 kWh/m2 is about 320.31 μmol/m2·s [35]. Hence, we can deduce that the crops will be receiving sufficient annual solar radiation throughout the year.
One particular day in January 2021 was chosen to collect the data for study to understand more about the point in illuminance of the planter box. During the morning of that day, the UmFm experienced partial shading by the surrounding block due to the sun’s path. The tabulated result revealed that its PPFD value was only 51.65 μmol/m2·s at the specific point of time at 9 am, while it had an illuminance of 2718.9 lx as collected by the luminescence sensors deployed. The impact of the sun’s path which contributed to partial shading in the UmFm is as shown in Figure 8b, where shadows are cast on part of the planter boxes at 10 am. Table 5 gives the overview of the illuminance, PPFD, and the DLI at different times of the day.
The illuminance (lx) to conventional solar irradiance (W/m2) is done with the following expression [35]:
Illuminance = k 380 780 V ( λ ) E ( λ ) d λ
The Equation (10) above is an example of the CIE 1988 data, where k is conversion constant, V(λ) is solar irradiance AM1.5 data, and E(λ) is the CIE illuminance data:
Work done by Michael et al. [36] through collection of both the illuminance and the solar irradiance data at the site allowed the prediction of the expression governing its conversion.
Illuminance = 122 × Solar irradiance + 87
Plants absorb radiation mostly in the 400–700 nm visible range and convert CO₂ uptake and water into oxygen and glucose. The amount of absorption in each wavelength depends on the cellular structure of the plant and may differ from species to species somewhat. The typical PPFD for leafy crops such as spinach is about 200 to 300 μmol/m2·s. From the tabulated results, we are confident that the leafy crops will receive an adequate amount of sunlight based on the generated PPFD value using microclimate studio. The DLI value ranges from about 6 to 10 mol/m²/d during the afternoon period. This is also sufficient to meet the needs of the crops, which typically range from 6 to 18 mol/m²/d.

4. Conclusions

This study explores the natural ventilation and the airflow structure inside a farming module operating in an urban environment. The farming module was surrounded by SIT buildings. The atmospheric boundary layer was applied to the computational domain. The airflow data are explained considering the best conditions for growing crops. The converged CFD results suggest that the opening angle for the façade’s panels has to be at least 45° to maintain the velocity inside the farming module above 0.3 m/s. The most homogenous distribution for the airflow inside the LHS and RHS chambers is reported for the north-east wind scenario. In this case, the AWAV magnitude was around 0.6 m/s for both chambers. Numerical simulations were performed to include the effect of installing mesh netting. The porous jump boundary condition was utilized for this task. The CFD data showed a significant decline in air velocity when installing the insect-proof screen. Sometimes, it reacheed above 65% reduction. This will affect the plant’s growth negatively. Field measurements also confirmed the predictions by the CFD simulations. The farming module will likely require artificial ventilation when the mesh netting is incorporated. The PPFD and the DLI based on the simulation using microclimate at the SIT@Dover site revealed that it is adequate to meet the needs of the crops over the day. Though partial shading due to surrounding buildings is encountered during the day, the overall DLI is nearly adequate to meet the needs of leafy crops.

5. Further Research Directions

As the study reveals that the mesh netting can cause more than 50% reduction in the airflow velocity, there will be an urgent need for artificial ventilation. This will cause additional consumption of energy and, subsequently, higher costs for the plants’ growth cycle. This issue needs to be tackled from two directions. First, it is important to design a mechanical ventilation system which provides sufficient and homogenous airflow for the plants. In this case, a system of fans, ducts, and vents should be carefully designed and tested. Second, PV panels will be considered for electricity production. This will significantly improve the energy efficiency for the farming module. During cloudy days, the DLI could be insufficient for the plants. Hence, red and blue LED lights with different wavelengths can be introduced and studied. These advanced technologies will make the UmFm much more ecofriendly and sustainable.

Author Contributions

Conceptualization, D.T.; Methodology, T.I.; Investigation, H.K. and R.H.S.T.; Data curation, B.T.W.A.; Writing—original draft, Y.E.W.; Writing—review and editing, H.A. and C.B.S.; Visualization, S.-C.C. All authors have read and agreed to the published version of the manuscript.

Funding

This research/project is supported by the Singapore Food Agency, Singapore, under its Singapore Food Story Theme 1 programme (Award No. SFS_RND_SUFP_001_09).

Acknowledgments

The authors would like to express their great gratitude to the SFA for its continuous support.

Conflicts of Interest

The authors declare no conflict of interest.

Nomenclature

AWAVArea-Weighted Average Velocity
CFDComputational Fluid Dynamics
DLIDaily Light Integral
HDBHousing & Development Board
HVACHeat Ventilation and Air Conditioning
LHSLeft-Hand Side
PPFDPhotosynthetic Photon Flux Density
RANSReynolds-Averaged Navier–Stokes
RHSRight-Hand Side
SIMPLESemi-Implicit Method for Pressure Linked Equation
UmFmUrban-Metabolic Farming Module

References

  1. O’Sullivan, C.A.; Bonnett, G.D.; McIntyre, C.L.; Hochman, Z.; Wasson, A.P. Strategies to improve the productivity, product diversity and profitability of urban agriculture. Agric. Syst. 2019, 174, 133–144. [Google Scholar] [CrossRef]
  2. Song, S.; Hou, Y.; Lim, R.B.H.; Gaw, L.Y.F.; Richards, D.R.; Tan, H.T.W. Comparison of vegetable production, resource-use efficiency and environmental performance of high-technology and conventional farming systems for urban agriculture in the tropical city of Singapore. Sci. Total Environ. 2022, 807, 150621. [Google Scholar] [CrossRef] [PubMed]
  3. Singapore Population. Available online: https://www.worldometers.info/world-population/singapore-population/ (accessed on 19 August 2022).
  4. Kosorić, V.; Huang, H.; Tablada, A.; Lau, S.K.; Tan, H.T.W. Survey on the social acceptance of the productive façade concept integrating photovoltaic and farming systems in high-rise public housing blocks in Singapore. Renew. Sustain. Energy Rev. 2019, 111, 197–214. [Google Scholar] [CrossRef]
  5. SG50 Special: Singapore’s Food Farms—A Story of Then and Now. Available online: https://www.sfa.gov.sg/food-for-thought/article/detail/sg50-special-singapore’s-food-farms---a-story-of-then-and-now (accessed on 19 August 2022).
  6. Taking It Indoors—Singapore Food Agency. Available online: https://www.sfa.gov.sg/docs/default-source/publication/ava-vision/ava-vision-issue-1-2016.pdf (accessed on 19 August 2022).
  7. What You Should Know About Vertical Farming by Rick LeBlanc. Available online: https://www.thebalancesmb.com/what-you-should-know-about-vertical-farming-4144786 (accessed on 19 August 2022).
  8. Blind Building Facades Become Urban Farms with Scalable Scaffolding System by SA Rogers. Available online: https://weburbanist.com/2018/09/17/blind-building-facades-become-urban-farms-with-scalable-scaffolding-system/ (accessed on 19 August 2022).
  9. Ho, S. Singapore Agritech Startup Sustenir Now Serving Hong Kong with Locally Grown. Available online: https://www.greenqueen.com.hk/sustenir-singapore-kale-hong-kong-with-launch-of-vertical-farm-in-the-city-3/ (accessed on 19 August 2022).
  10. High-Tech Vertical Farms to Begin Operations Next Year and Bring Fresher Leafy Greens to S’poreans’ Plates by Low Youjin. Available online: https://www.todayonline.com/singapore/high-tech-vertical-farms-begin-operations-next-year-and-bring-fresher-leafy-greens (accessed on 19 August 2022).
  11. Kitaya, Y.; Tsuruyama, J.; Kawai, M.; Shibuya, T. Effects of Air Current on Transpiration and Net Photo-Synthetic Rates of Plants in a Closed Plant Production System. In Transplant Production in the 21st Century; Springer: Berlin/Heidelberg, Germany, 2000. [Google Scholar]
  12. Kitaya, Y.; Tsuruyama, J.; Shibuya, T.; Yoshida, M.; Kiyota, M. Effects of Air Current Speed on Gas Exchange in Plant Leaves and Plant Canopies. 2002. Available online: www.elsevier.com/locate/asrwww.sciencedirect.com (accessed on 20 June 2022).
  13. Ahmed, H.A.; Tong, Y.-X.; Yang, Q.-C. Lettuce plant growth and tipburn occurrence as affected by airflow using a multi-fan system in a plant factory with artificial light. J. Therm. Biol. 2020, 88, 102496. [Google Scholar] [CrossRef]
  14. Panchenko, V.; Izmailov, A.; Kharchenko, V.; Lobachevskiy, Y. Photovoltaic Solar Modules of Different Types and Designs for Energy Supply. In Research Anthology on Clean Energy Management and Solutions; IGI Global: Hershey, PA, USA, 2021; pp. 731–752. [Google Scholar] [CrossRef]
  15. Panchenko, V.A. Solar Roof Panels for Electric and Thermal Generation. Appl. Sol. Energy 2018, 54, 350–353. [Google Scholar] [CrossRef]
  16. Kharchenko, V.; Panchenko, V.; Tikhonov, P.V.; Vasant, P. Cogenerative PV Thermal Modules of Different Design for Autonomous Heat and Electricity Supply. In Handbook of Research on Renewable Energy and Electric Resources for Sustainable Rural Development; IGI Global: Hershey, PA, USA, 2018; pp. 86–119. [Google Scholar] [CrossRef] [Green Version]
  17. ANSYS Fluent Theory Guide. 2013. Available online: http://www.pmt.usp.br/academic/martoran/notasmodelosgrad/ANSYS%20Fluent%20Theory%20Guide%2015.pdf (accessed on 15 April 2022).
  18. Blocken, B. Computational Fluid Dynamics for urban physics: Importance, scales, possibilities, limitations and ten tips and tricks towards accurate and reliable simulations. Build. Environ. 2015, 91, 219–245. [Google Scholar] [CrossRef] [Green Version]
  19. Franke, J.; Hellsten, A.; Schlünzen, H.; Carissimo, B. Best Practice Guideline for the CFD Simulation of Flows in the Urban Environment. In Proceedings of the 11th Conference on Harmonisation within Atmospheric Dispersion Modelling for Regulatory Purposes, Cambridge, UK, July 2007. [Google Scholar]
  20. Pattanapol, W.; Wakes, S.J.; Hilton, M.J.; Katharine, J.M.D. Modeling of Surface Roughness for Flow over a Complex Vegetated Surface. World Acad. Sci. Eng. Technol. 2007, 1, 94–102. [Google Scholar]
  21. Green Mark for Non-Residential Buildings NRB: 2015. 2015. Available online: https://www1.bca.gov.sg/docs/default-source/docs-corp-buildsg/sustainability/green_mark_nrb_2015_criteria.pdf (accessed on 18 March 2022).
  22. Blocken, B.; Stathopoulos, T.; Carmeliet, J. CFD simulation of the atmospheric boundary layer: Wall function problems. Atmos. Environ. 2007, 41, 238–252. [Google Scholar] [CrossRef]
  23. Richards, P.J.; Hoxey, R.P. Appropriate boundary conditions for computational wind engineering models using the k-ε turbulence model. J. Wind. Eng. Ind. Aerodyn. 1993, 46, 145–153. [Google Scholar] [CrossRef]
  24. Endalew, A.M.; Hertog, M.; Delele, M.A.; Baetens, K.; Persoons, T.; Baelmans, M.; Ramon, H.; Nicolai, B.M.; Verboven, P. CFD modelling and wind tunnel validation of airflow through plant canopies using 3D canopy architecture. Int. J. Heat Fluid Flow 2009, 30, 356–368. [Google Scholar] [CrossRef]
  25. Kang, G.; Kim, J.J.; Choi, W. Computational fluid dynamics simulation of tree effects on pedestrian wind comfort in an urban area. Sustain. Cities Soc. 2020, 56, 102086. [Google Scholar] [CrossRef]
  26. Toparlar, Y.; Blocken, B.; Vos, P.V.; van Heijst, G.J.F.; Janssen, W.D.; van Hooff, T.; Montazeri, H.; Timmermans, H.J.P. CFD simulation and validation of urban microclimate: A case study for Bergpolder Zuid, Rotterdam. Build. Environ. 2015, 83, 79–90. [Google Scholar] [CrossRef] [Green Version]
  27. Toja-Silva, F.; Kono, T.; Peralta, C.; Lopez-Garcia, O.; Chen, J. A review of computational fluid dynamics (CFD) simulations of the wind flow around buildings for urban wind energy exploitation. J. Wind. Eng. Ind. Aerodyn. 2018, 180, 66–87. [Google Scholar] [CrossRef]
  28. Bourdin, P.; Wilson, J.D. Windbreak aerodynamics: Is computational fluid dynamics reliable? Bound. Layer Meteorol. 2008, 126, 181–208. [Google Scholar] [CrossRef]
  29. Fatnassi, H.; Boulard, T.; Bouirden, L. Simulation of climatic conditions in full-scale greenhouse fitted with insect-proof screens. Agric. For. Meteorol. 2003, 118, 97–111. [Google Scholar] [CrossRef]
  30. Miguel, A.F. Airflow through porous screens: From theory to practical considerations. Energy Build. 1998, 28, 63–69. [Google Scholar] [CrossRef]
  31. Villagrán, E.A.; Jaramillo, J.E.; León-Pacheco, R.I. Natural ventilation in greenhouse with anti-insect screens evaluated with a computational fluid model. Agron. Mesoam. 2020, 31, 709–728. [Google Scholar] [CrossRef]
  32. Bartzanas, T.; Boulard, T.; Kittas, C. Numerical Simulation of the Airflow and Temperature Distribution in a Tunnel Greenhouse Equipped with Insect-Proof Screen in the Openings. 2002. Available online: www.elsevier.com/locate/compag (accessed on 27 June 2022).
  33. Li, Y.; Li, J.; Wu, G.; Li, Y.; Shen, A.; Ma, D.; Li, S. Design of an air blowing device above seedbed: The effect of air disturbance on the microenvironment and growth of tomato seedlings. HortScience 2020, 55, 1308–1314. [Google Scholar] [CrossRef]
  34. Inoue, T.; Sunaga, M.; Ito, M.; Qu, Y.C.; Matsushima, Y.; Sakoda, K.; Yamori, W. Minimizing VPD Fluctuations Maintains Higher Stomatal Conductance and Photosynthesis Resulting in Improvement of Plant Growth in Lettuce. Front. Plant Sci. 2021, 12, 646144. [Google Scholar] [CrossRef]
  35. Korczynski, P.M.; Logan, J.; Faust, J.E. Mapping Monthly Distribution of Daily Light Integrals across the Contiguous United States. HortTechnology 2002, 12, 12–16. [Google Scholar] [CrossRef]
  36. Peter, R.M.; Danvers, E.J.; Wilfrido, M. A conversion guide: Solar irradiance and lux illuminance. J. Meas. Eng. 2020, 8, 153–166. [Google Scholar]
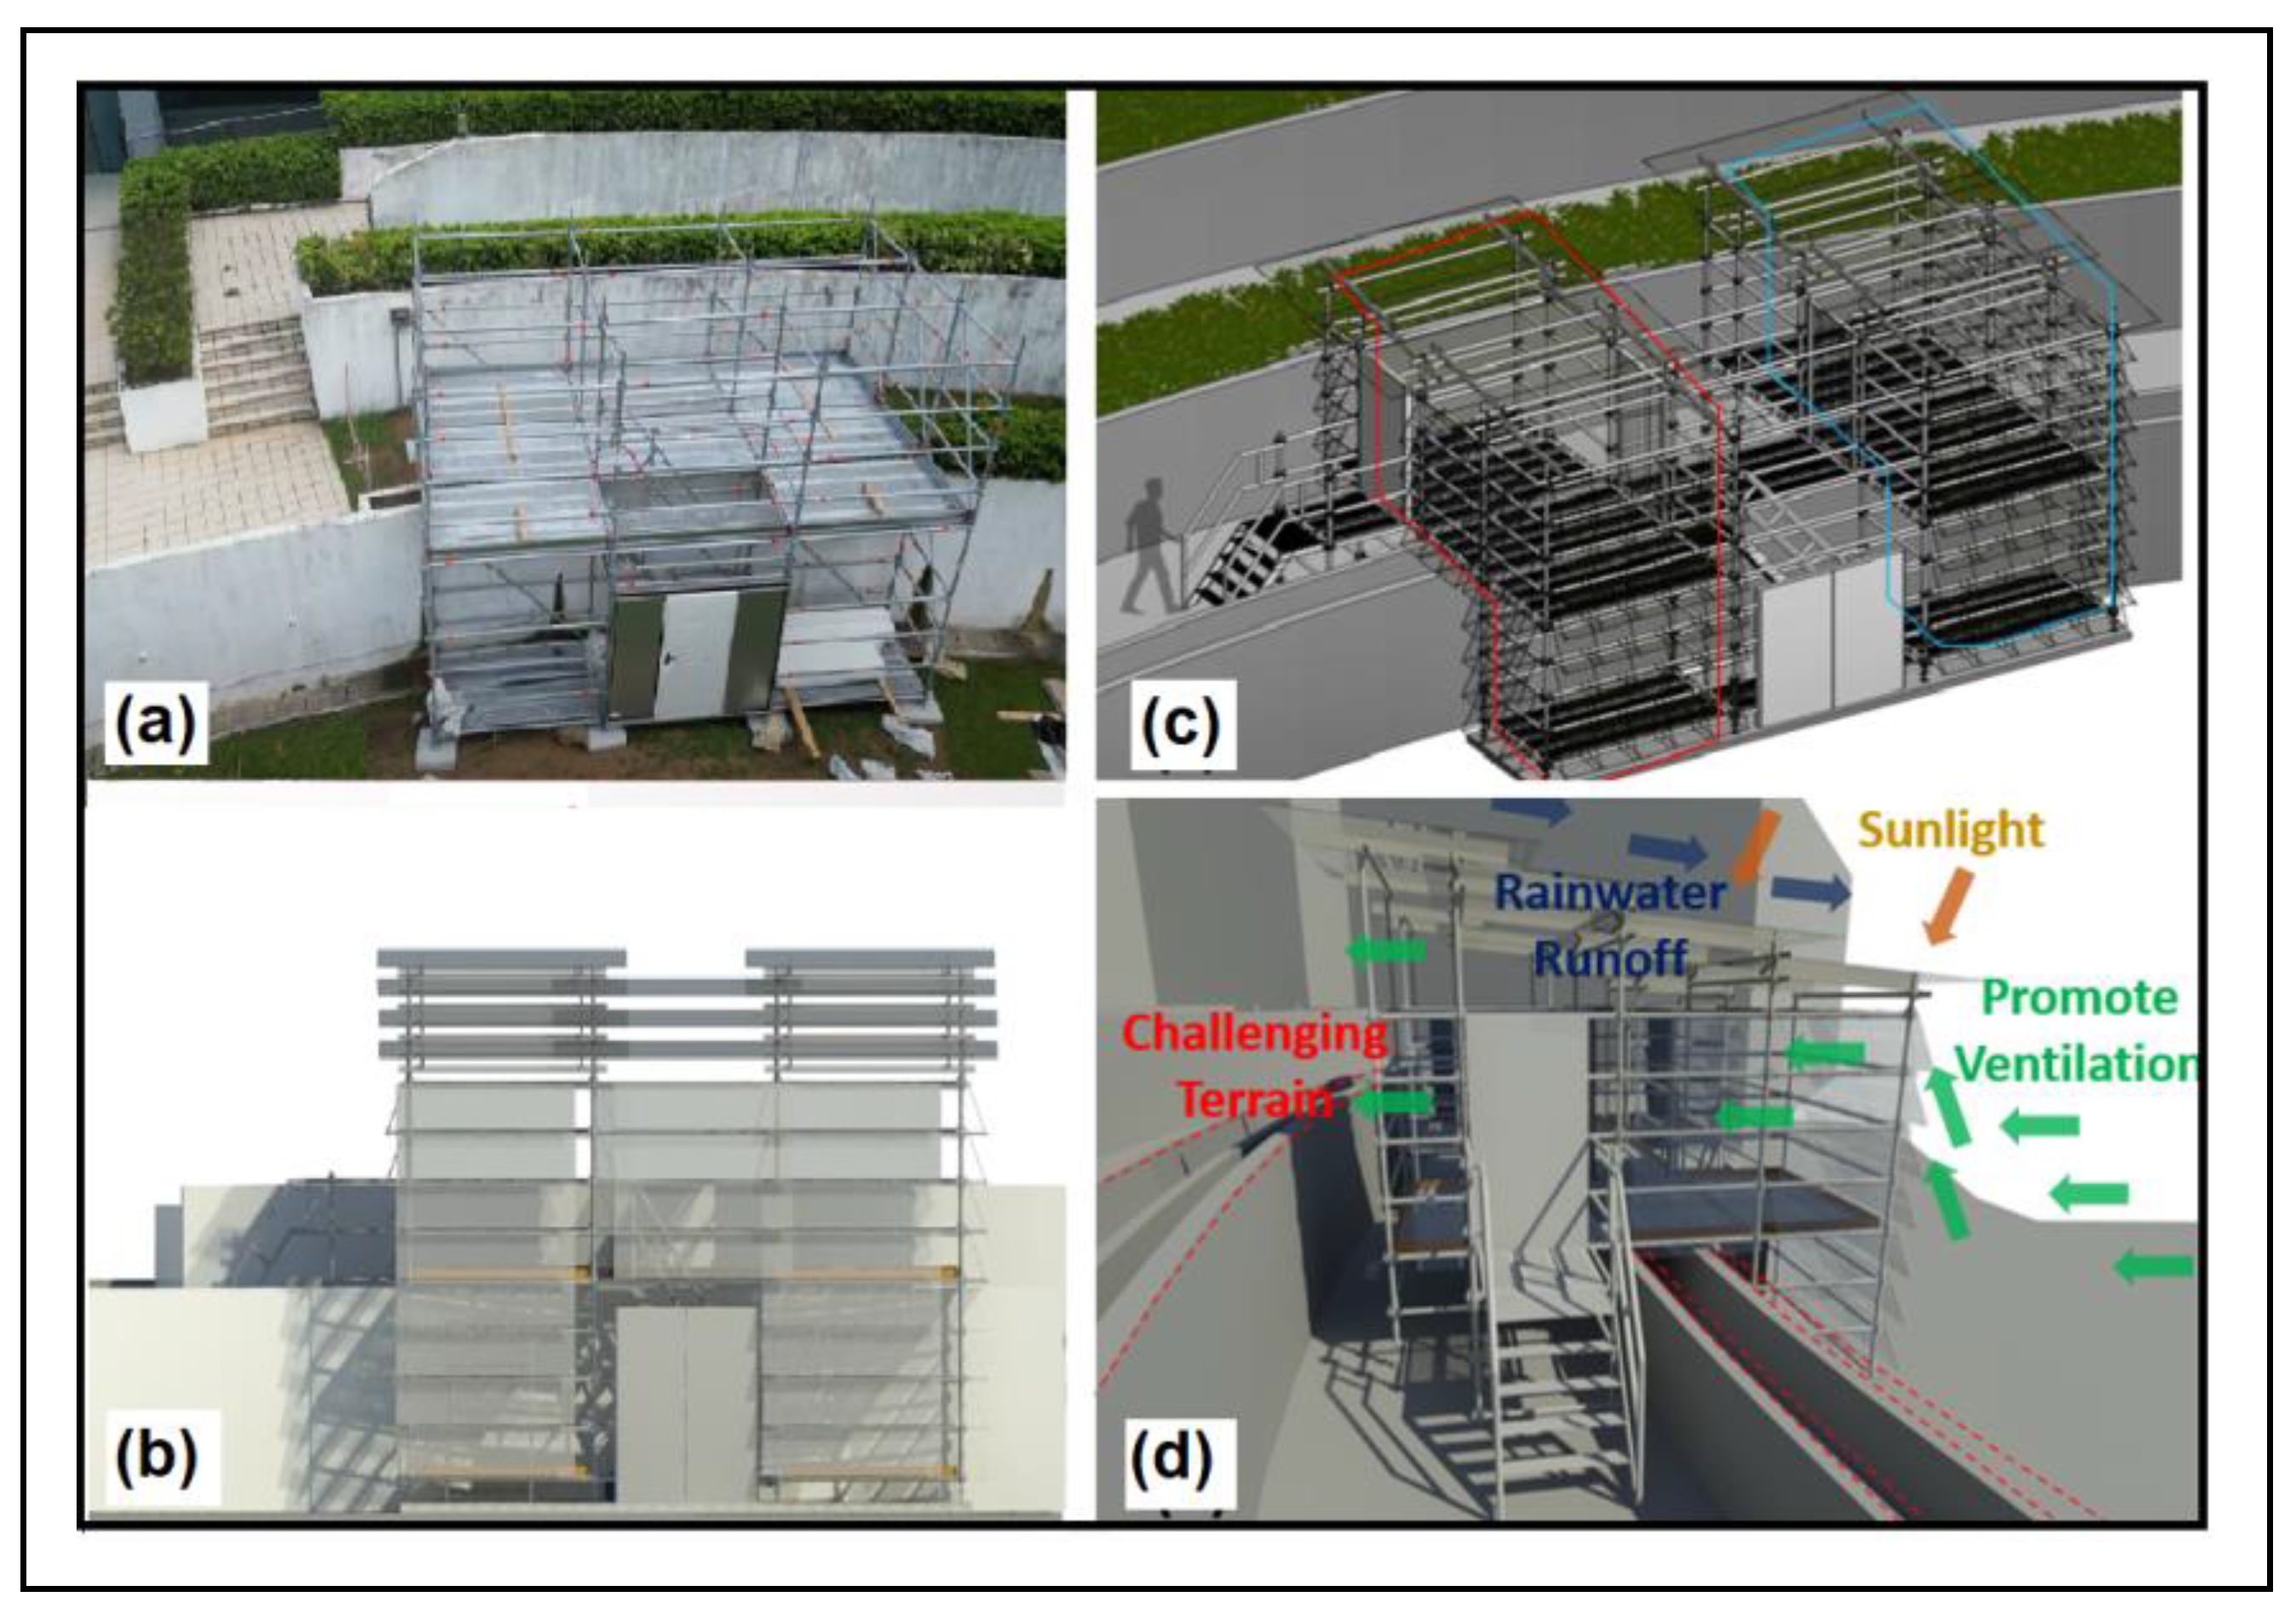
Figure 1. UmFm as integrated with the SIT buildings (a) in physical site and (b) in Sketchup (front view), and (c) in a zoom-in image of the 3D view of the UmFm structure with two chambers marked with red and blue dotted lines. (d) Side view of the UmFm with consideration of airflow, sun ray direction, and the rain runoff.
Sustainability 14 16885 g001
Figure 2. The computational domain’s dimensions and the boundary conditions for the CFD aerodynamics simulations (south wind scenario).
Sustainability 14 16885 g002
Figure 3. Experimental setup for testing the effect of mesh netting; (a) schematic drawing, (b) actual setup at Oasis Living lab.
Sustainability 14 16885 g003
Figure 4. Flow structure inside the UmFm at 1.35 m above the second floor’s level in case of south wind scenario; (a) façade’s panels at 25°, (b) façade’s panels at 45°, (c) façade’s panels at 60°.
Sustainability 14 16885 g004aSustainability 14 16885 g004b
Figure 5. Airflow magnitude inside the UmFm at 1.35 m above the second floor’s level with façade’s panels for wind direction from (a) south (b) north (c) north-east and (d) South-east direction.
Sustainability 14 16885 g005
Figure 6. Flow structure inside the UmFm for the north-east wind scenario at 1.35 m above the second floor’s level and façade’s panels at 45° with mesh netting (while Figure 5c shows the UmFm without mesh netting).
Sustainability 14 16885 g006
Figure 7. (a) Fluctuations of air velocity with time at different probes. (b) Variation of temperature and humidity with time of the day.
Sustainability 14 16885 g007
Figure 8. (a) Annual solar radiation of second-level planter boxes using Rhinoceros 3D and Climate Studio. (b) Partial shading of the UmFm by surrounding buildings in the morning.
Sustainability 14 16885 g008
Table 1. Grid size at different regions according to the Green Mark [21].
LocationGrid Size (m)
Within the functional spaces of interest0.1–0.5
Building of interest0.5–1.0
Surrounding building1.0–5.0
From ground surface to 10 m height in vertical direction0.5–1.0
From 10 m height to Hmax height in vertical direction (Hmax is the height of the tallest building among the group of buildings modelled explicitly) 1.0–5.0
Table 2. AWAV magnitude for the UmFm at different opening angles for the façade’s panels.
South Wind ScenarioAWAV Magnitude [m/s]
Façade Panels at 25°Façade Panels at 45°Façade Panels at 60°
LHSRHSLHSRHSLHSRHS
Plane 1 (at 1.35 m height)0.3570.2010.4890.3160.5310.439
Table 3. AWAV magnitude for the UmFm at different wind scenarios (façade’s panels at 45°).
Wind ScenarioAWAV Magnitude [m/s]
South WindNorth WindNorth-East WindSouth-East Wind
LHSRHSLHSRHSLHSRHSLHSRHS
Plane 1 (at 1.35 m height)0.4890.3160.2960.3230.6630.5870.6350.397
Table 4. AWAV magnitude for the UmFm at different porosity for the mesh netting (façade’s panels at 45°).
North-East Wind ScenarioAverage AWAV Magnitude (m/s) at 1.35 m Height [Reduction %]
Baseline without ScreensPorosity 63.9%Porosity 50%Porosity 36.48%
LHS Chamber0.6630.252 [62.0%]0.231 [65.2%]0.216 [67.4%]
RHS Chamber0.5870.282 [52.0%]0.261 [55.5%]0.246 [58.1%]
Table 5. Illuminance on 21 January at different times of the day.
Point in Time Illuminance for Planter Boxes
21 January9 am12 pm4 pmTotal DLI (mol/m²/d)
Illuminance (lx)2718.5943,897.6424,356.4816.599
Solar Radiation (W/m2)21.57359.1198.9
PPFD (µmol/m2/s)51.65834.06462.77
Publisher’s Note: MDPI stays neutral with regard to jurisdictional claims in published maps and institutional affiliations.