
Land-Use Changes in Insular Urban Territories: A Retrospective Analysis from 1990 to 2018. The Case of Madeira Island—Ribeira Brava

 ,
,  ,
,  and
and
Abstract
1. Introduction
2. Methodology
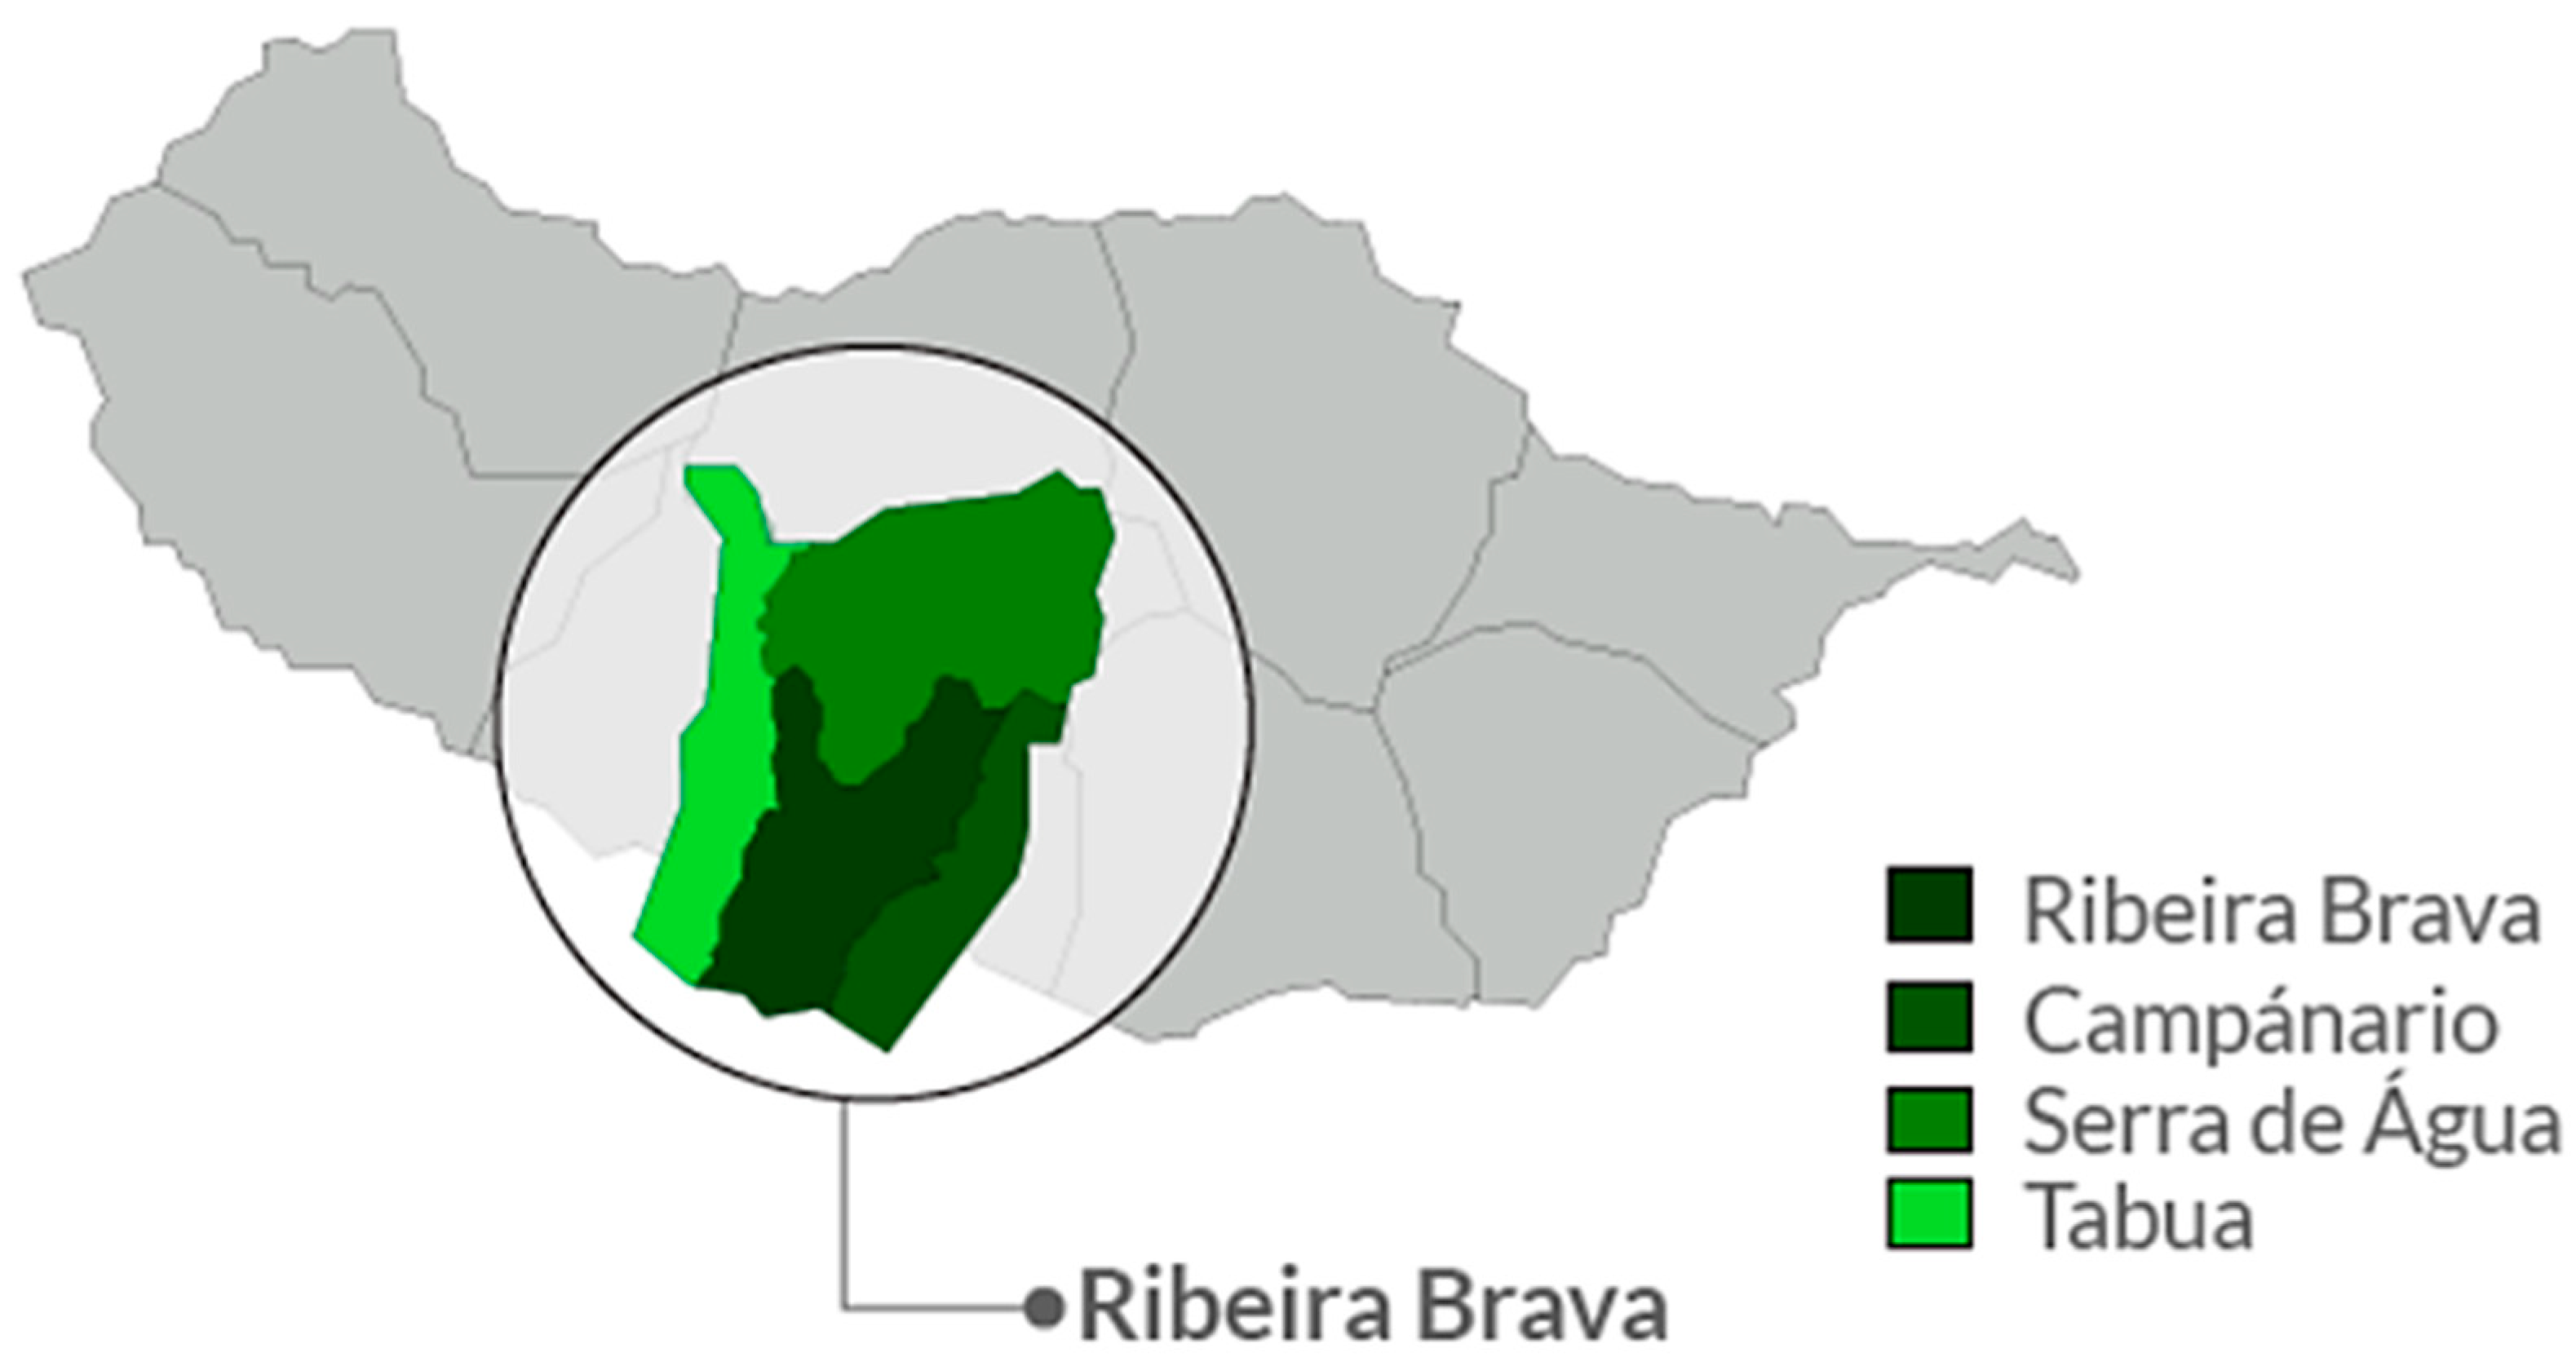
2.1. Study Area
2.2. Applied Methodology
3. Results
4. Discussion
5. Conclusions
Author Contributions
Funding
Institutional Review Board Statement
Informed Consent Statement
Data Availability Statement
Conflicts of Interest
References
- Neumann, K.; Herold, M.; Hartley, A.; Schmullius, C. Comparative assessment of CORINE2000 and GLC2000: Spatial analysis of land cover data for Europe. Int. J. Appl. Earth Obs. Geoinf. 2007, 9, 425–437. [Google Scholar] [CrossRef]
- Bartholomé, E.; Belward, A.S. GLC2000: A new approach to global land cover mapping from earth observation data. Int. J. Remote Sens. 2005, 26, 1959–1977. [Google Scholar] [CrossRef]
- Bielecka, E. GIS Spatial Analysis Modeling for Land Use Change. A Bibliometric Analysis of the Intellectual Base and Trends. Geosciences 2020, 10, 421. [Google Scholar] [CrossRef]
- Lousada, S.; Cabezas, J.; Castanho, R.A.; Gómez, J.M. Hydraulic Planning in Insular Urban Territories: The Case of Madeira Island—Ribeira Brava. Water 2021, 13, 2951. [Google Scholar] [CrossRef]
- Bildirici, M.E.; Lousada, S.; Yılmaz Genç, S. Terrorism, Freshwater, and Environmental Pollution: Evidence of Afghanistan, Burkina Faso, Iraq, Arab Republic of Egypt, Cameroon, Mali, Mozambique, Niger, Nigeria, Somalia, Syrian Arab Republic, and Pakistan. Water 2022, 14, 2684. [Google Scholar] [CrossRef]
- Baig, M.F.; Mustafa, M.R.U.; Baig, I.; Takaijudin, H.B.; Zeshan, M.T. Assessment of Land Use Land Cover Changes and Future Predictions Using CA-ANN Simulation for Selangor, Malaysia. Water 2022, 14, 402. [Google Scholar] [CrossRef]
- Naranjo Gómez, J.M.; Lousada, S.; Garrido Velarde, J.; Castanho, R.A.; Loures, L. Land-Use Changes in the Canary Archipelago Using the CORINE Data: A Retrospective Analysis. Land 2020, 9, 232. [Google Scholar] [CrossRef]
- Bielecka, E.; Jenerowicz, A. Intellectual Structure of CORINE Land Cover Research Applications in Web of Science: A Europe-Wide Review. Remote Sens. 2019, 11, 2017. [Google Scholar] [CrossRef]
- Bielecka, E.; Jenerowicz, A.; Pokonieczny, K.; Borkowska, S. Land Cover Changes and Flows in the Polish Baltic Coastal Zone: A Qualitative and Quantitative Approach. Remote Sens. 2020, 12, 2088. [Google Scholar] [CrossRef]
- Statuto, D.; Cillis, G.; Picuno, P. Analysis of the effects of agricultural land use change on rural environment and landscape through historical cartography and GIS tools. J. Agric. Eng. 2016, 47, 28. [Google Scholar] [CrossRef]
- Delgado, J. (Ed.) Armonización de las bases de datos de ocupación del suelo y su importancia en la evaluación de parámetros e indicadores medioambientales. In Proceedings of the Congreso Nacional de Medio Ambiente Cumbre Del Desarrollo Sostenible, Madrid, Spain, 1–5 December 2008. [Google Scholar]
- García-Álvarez, D.; Camacho Olmedo, M.T. Changes in the methodology used in the production of the Spanish CORINE: Uncertainty analysis of the new maps. Int. J. Appl. Earth Obs. Geoinf. 2017, 63, 55–67. [Google Scholar] [CrossRef]
- Martínez-Fernández, J.; Ruiz-Benito, P.; Bonet, A.; Gómez, C. Methodological variations in the production of CORINE land cover and consequences for long-term land cover change studies. The case of Spain. Int. J. Remote Sens. 2019, 40, 8914–8932. [Google Scholar] [CrossRef]
- Debowska, A.; Hoscilo, A.; Gruziel, M.; Napiorkowska, M. High Resolution Impervious and Tree Cover Layers as an Additional Source of Data on Land Cover Status in Poland. In Proceedings of the Geoconference on Informatics, Geoinformatics and Remote Sensing, Vol III, Albena, Bulgaria, 16–22 June 2014; Stef92 Technology Ltd.: Sofia, Bulgaria, 2014; pp. 651–658. [Google Scholar]
- Kasmaeeyazdi, S.; Abdolmaleki, M.; Ibrahim, E.; Jiang, J.; Marzan, I.; Rodriguez, I.B. Copernicus Data to Boost Raw Material Source Management: Illustrations from the RawMatCop Programme. Resour. Policy 2021, 74, 102384. [Google Scholar] [CrossRef]
- Brown, G.; Raymond, C.M. Methods for identifying land use conflict potential using participatory mapping. Landsc. Urban Plan. 2014, 122, 196–208. [Google Scholar] [CrossRef]
- Feranec, J.; Soukup, T.; Hazeu, G.; Jaffrain, G. European Landscape Dynamics: CORINE Land Cover Data; CRC Press, Taylor & Francis Group: Boca Raton, FL, USA; London, UK; New York, NY, USA, 2016. [Google Scholar]
- Puniach, E.; Bieda, A.; Ćwiąkała, P.; Kwartnik-Pruc, A.; Parzych, P. Use of Unmanned Aerial Vehicles (UAVs) for Updating Farmland Cadastral Data in Areas Subject to Landslides. ISPRS Int. J. Geo-Inf. 2018, 7, 331. [Google Scholar] [CrossRef]
- Melchiorri, M.; Florczyk, A.J.; Freire, S.; Schiavina, M.; Pesaresi, M.; Kemper, T. Unveiling 25 Years of Planetary Urbaniza-tion with Remote Sensing: Perspectives from the Global Human Settlement Layer. Remote Sens. 2018, 10, 768. [Google Scholar] [CrossRef]
- Yaakub, N.F.; Masron, T.; Marzuki, A.; Soda, R. GIS-Based Spatial Correlation Analysis: Sustainable Development and Two Generations of Demographic Changes. Sustainability 2022, 14, 1490. [Google Scholar] [CrossRef]
- Nelson, E.; Sander, H.; Hawthorne, P.; Conte, M.; Ennaanay, D.; Wolny, S.; Manson, S.; Polasky, S. Projecting Global Land-Use Change and Its Effect on Ecosystem Service Provision and Biodiversity with Simple Models. PLoS ONE 2010, 5, e14327. [Google Scholar] [CrossRef]
- Juknelienė, D.; Kazanavičiūtė, V.; Valčiukienė, J.; Atkocevičienė, V.; Mozgeris, G. Spatiotemporal Patterns of Land-Use Changes in Lithuania. Land 2021, 10, 619. [Google Scholar] [CrossRef]
- Longley, P.A.; Goodchild, M.F.; Maguire, D.J.; Rhind, D.W. Geographic Information Science and Systems, 4th ed.; Wiley: New York, NY, USA, 2015; Available online: https://www.wiley.com/en-us/Geographic+Information+Science+and+Systems%2C+4th+Edition-p-9781119031307 (accessed on 17 October 2022).
- Benz, U.C.; Hofmann, P.; Willhauck, G.; Lingenfelder, I.; Heynen, M. Multi-resolution, object-oriented fuzzy analysis of remote sensing data for GIS-ready information. ISPRS J. Photogramm. Remote. Sens. 2004, 58, 239–258. [Google Scholar] [CrossRef]
- Washaya, P.; Balz, T. Sar Coherence Change Detection of Urban Areas Affected by Disasters Using Sentinel-1 Imagery. ISPRS Int. Arch. Photogramm. Remote. Sens. Spat. Inf. Sci. 2018, XLII-3, 1857–1861. [Google Scholar] [CrossRef]
- Benedetti, A.; Picchiani, M.; Del Frate, F. Sentinel-1 and Sentinel-2 Data Fusion for Urban Change Detection. In Proceedings of the IGARSS 2018—2018 IEEE International Geoscience and Remote Sensing Symposium, Valencia, Spain, 22–27 July 2018. [Google Scholar] [CrossRef]
- Fadigas, L. Urbanismo e Território—As Políticas Públicas; Edições Sílabo: Lisbon, Portugal, 2015. [Google Scholar]
- Loures, L.; Panagopoulos, T.; Burley, J. Assessing user preferences on post-industrial redevelopment. Environ. Plan. B Plan. Des. 2016, 43, 871–892. [Google Scholar] [CrossRef]
- Weber, J.-L. Implementation of land and ecosystem accounts at the European Environment Agency. Ecol. Econ. 2007, 61, 695–707. [Google Scholar] [CrossRef]
- Feranec, J.; Jaffrain, G.; Soukup, T.; Hazeu, G. Determining changes and flows in European landscapes 1990–2000 using CORINE land cover data. Appl. Geogr. 2010, 30, 19–35. [Google Scholar] [CrossRef]
- Hazeu, G.; Büttner, G.; Arozarena, A.; Valcárcel, N.; Feranec, J.; Smith, G. Detailed CLC data: Member states with CLC level 4/level 5 and (semi-) automated solutions. In European Landscape Dynamics CORINE Land Cover Data; CRC Press: Boca Raton, FL, USA, 2016; pp. 275–304. [Google Scholar] [CrossRef]
- Büttner, G. CORINE land cover and land cover change products. In Land Use and Land Cover Mapping in Europe; Springer: Berlin/Heidelberg, Germany, 2014; pp. 55–74. [Google Scholar] [CrossRef]
- European Union. Directive 2007/2/EC of the European Parliament and of the Council of 14 March 2007 Establishing an Infrastructure for Spatial Information in the European Community (INSPIRE); Published in the official Journal on the 25 April 2007; European Parliament and of the Council of the European Union: Brussels, Belgium, 2007. [Google Scholar]
- Modugno, S.; Balzter, H.; Cole, B.; Borrelli, P. Mapping regional patterns of large forest fires in Wildland–Urban Interface areas in Europe. J. Environ. Manag. 2016, 172, 112–126. [Google Scholar] [CrossRef] [PubMed]
- Pereira, M.G.; Aranha, J.; Amraoui, M. Land cover fire proneness in Europe. For. Syst. 2014, 23, 598–610. [Google Scholar] [CrossRef]
- Bishr, Y. Overcoming the semantic and other barriers to GIS interoperability. Int. J. Geogr. Inf. Sci. 1998, 12, 299–314. [Google Scholar] [CrossRef]
- Verburg, P.H.; van Berkel, D.B.; van Doorn, A.M.; van Eupen, M.; van den Heiligenberg, H.A.R.M. Trajectories of land use change in Europe: A model-based exploration of rural futures. Landsc. Ecol. 2010, 25, 217–232. [Google Scholar] [CrossRef]
- van Vliet, J.; de Groot, H.L.F.; Rietveld, P.; Verburg, P.H. Manifestations and underlying drivers of agricultural land use change in Europe. Landsc. Urban Plan. 2015, 133, 24–36. [Google Scholar] [CrossRef]
- Levers, C.; Müller, D.; Erb, K.; Haberl, H.; Jepsen, M.R.; Metger, M.J.; Meyfroidt, P.; Plieninger, T.; Plutzar, C.; Stürck, J.; et al. Archetypical patterns and trajectories of land systems in Europe. Reg. Environ. Chang. 2015, 18, 715–732. [Google Scholar] [CrossRef]
- Ustaoglu, E.; Williams, B. Determinants of urban expansion and agricultural land conversion in 25 EU countries. Environ. Manag. 2017, 60, 717–746. [Google Scholar] [CrossRef] [PubMed]
- Food and Agricultural Organization. The Agri-Environmental Statistics of the Food and Agriculture Organization of the United Nations; United Nations: New York, NY, USA, 2014. [Google Scholar]
- Martin, J. The European Environment: State and Outlook 2010: Synthesis; European Environment Agency: Copenhagen, Denmark, 2010. [Google Scholar]
- Maul, G. Small islands. In Schwart Encyclopedia of Coastal Science; Maurice, L., Ed.; Springer: New York, NY, USA, 2005; pp. 883–887. [Google Scholar]
- Heredia-R, M.; Torres, B.; Cabrera-Torres, F.; Torres, E.; Díaz-Ambrona, C.G.H.; Pappalardo, S.E. Land Use and Land Cover Changes in the Diversity and Life Zone for Uncontacted Indigenous People: Deforestation Hotspots in the Yasuní Biosphere Reserve, Ecuadorian Amazon. Forests 2021, 12, 1539. [Google Scholar] [CrossRef]
- Akinyemi, F.O. Vegetation Trends, Drought Severity and Land Use-Land Cover Change during the Growing Season in Semi-Arid Contexts. Remote Sens. 2021, 13, 836. [Google Scholar] [CrossRef]
- Smith, P.; House, J.I.; Bustamante, M.; Sobocká, J.; Harper, R.; Pan, G.; West, P.C.; Clark, J.M.; Adhya, T.; Rumpel, C.; et al. Global Change Pressures on Soils from Land Use and Management. Glob. Chang. Biol. 2016, 22, 1008–1028. Available online: https://onlinelibrary.wiley.com/doi/10.1111/gcb.13068 (accessed on 9 November 2022). [CrossRef]
- Amado, M. Planeamento Urbano Sustentável; Caleidoscópio: Lisboa, Portugal, 2009; ISBN 9789728801748. (In Portuguese) [Google Scholar]
- Baptista, T.; Cabezas, J.; Fernandez, L.; Pinto-Gomes, C. IDE-OTALEX C. The first crossborder SDI between Portugal and Spain Background and development. J. Earth Sci. Eng. 2013, 3, 393. [Google Scholar]
- Pinto-Correia, T.; Kristensen, L. Linking research to practice: The landscape as the basis for integrating social and ecological perspectives of the rural. Landsc. Urban Plan. 2013, 120, 248–256. [Google Scholar] [CrossRef]
- Castanho, R.A. Identifying Processes of Smart Planning, Governance and Management in European Border Cities. Learning from City-to-City Cooperation (C2C). Sustainability 2019, 11, 5476. [Google Scholar] [CrossRef]
- Castanho, R.A. The Relevance of Political Engagement and Transparency in Cross-Border Cooperation (CBC) Environments: Analyzing Border Cities in Europe. Lex Localis J. Local Self-Gov. 2020, 18, 487–502. [Google Scholar] [CrossRef]
- Couto, G.; Castanho, R.; Pimentel, P.; Carvalho, C.; Sousa, Á.; Santos, C. The Impacts of COVID-19 Crisis over the Tourism Expectations of the Azores Archipelago Residents. Sustainability 2020, 12, 7612. [Google Scholar] [CrossRef]
- Fernandes, M.J.P. Riscos no Concelho da Ribeira Brava: Movimentos de Vertente Cheias Rápidas e Inundações. Master’s Thesis, Universidade de Coimbra, Coimbra, Portugal, 2009. [Google Scholar]
- Prada, S.; Gaspar, A.; Sequeira, M.M.; Nunes, A. Disponibilidades Hídricas na Ilha da Madeira. In AQUAMAC—Técnicas e Métodos para a Gestão Sustentável da Água Na MACARONÉSIA; Chapter: Disponibilidades Hídricas na Ilha da Madeira; Instituto Tecnológico de Canarias, Ed.; Instituto Tecnológico das Canarias, Cabildo de Lanzarote, Consejo Insular de Aguas de Lanzarote: Las Palmas, Spain, 2005; pp. 261–294. [Google Scholar]
- CM-Ribeira Brava. Câmara Municipal da Ribeira Brava. 2022. Available online: http://www.cm-ribeirabrava.pt/cmrb1/ (accessed on 30 November 2021).
- European Environmental Agency (EEA). Corine Land Cover. 2021. Available online: https://www.eea.europa.eu/publications/COR0-landcover (accessed on 30 November 2021).
- European Commission (EC). 2001. Available online: https://op.europa.eu/en/publication-detail/-/publication/96743011-0b4f-11ea-8c1f-01aa75ed71a1 (accessed on 30 November 2021).
- Copernicus. Corine Land Cover Nomenclature Guidelines. 2022. Available online: https://land.copernicus.eu/user-corner/technical-library/corine-land-cover-nomenclature-guidelines/html/index.html (accessed on 4 March 2022).
- Lousada, S.; Gonçalves, L.; Atmaca, A. Hydraulic Planning in Insular Urban Territories: The Case of Madeira Island—São Vicente. Water 2022, 14, 112. [Google Scholar] [CrossRef]
- Gonçalves, L.B.; Rodrigues, W.T.; Curitiba, A.S.; Torres, H.; Lousada, S.A.N. Utilização de Bacias de Detenção Para Mitigação de Cheias em Áreas Urbanas, Espacios y Sociedades em Transfo, Rmación, 1st ed.; Thomson Reuters Aranzadi: Pamplona, Spain, 2020; Volume 6, pp. 20–9221. [Google Scholar]
- Gonçalves, L.B. Análise Teórico-Prática do Risco de Cheias no Arquipélago da Madeira–Caso de Estudo dos Concelhos do Funchal, Machico, Ribeira Brava e São Vicente. Master’s Thesis, Universidade da Madeira, Funchal, Portugal, 2020. [Google Scholar]
- Correio da Manhã. 2012. Available online: https://www.cmjornal.pt/portugal/detalhe/pj-detem-suspeito-de-atear-incendio-florestal-na-madeira (accessed on 30 November 2021).
- Sieber, I.M.; Hinsch, M.; Vergílio, M.H.; Gil, A.J.F.; Burkhard, B. Assessing the effects of different land-use/land-cover input datasets on modelling and mapping terrestrial ecosystem services: Case study Terceira Island (Azores, Portugal). One Ecosyst. 2021, 6, 1–26. [Google Scholar] [CrossRef]
- Freitas, H.F.B.F. Evento Extremo da Ilha da Madeira 2010: Identificação e Análise das Áreas Afetadas por Deslizamentos de Vertentes na Região do Funchal; Graduation’s Final Test; Universidade Federal de Santa Catarina: Florianópolis, Brazil, 2018. [Google Scholar]
- Bertrand, N.; Vanpeene-Bruhier, S. Periurban landscapes in mountain areas. At the crossroads of ecological and socio-economic studies. J. Alp. Res. 2007, 95, 69–80. [Google Scholar]
- Gao, P.; Niu, X.; Wang, B.; Zheng, Y. Land use changes and its driving forces in hilly ecological restoration area based on gis and rs of northern China. Sci. Rep. 2015, 5, 11038. [Google Scholar] [CrossRef] [PubMed]
- Haller, A. The “sowing of concrete”: Peri-urban smallholder perceptions of rural–urban land change in the Central Peruvian Andes. Land Use Policy 2014, 38, 239–247. [Google Scholar] [CrossRef] [PubMed]
- Institute of Mechanical Engineering (IME). Natural Disasters Saving Lives Today, Building Resilience for Tomorrow; Institute of Mechanical Engineering: London, UK, 2013. [Google Scholar]
- Castanho, R. A Sustainable Urban Planning in Transboundary Areas: Analysis of Critical Factors for Territorial Success. Ph.D. Thesis, University of Extremadura, Badajoz, Spain, 2017. [Google Scholar]
- Arévalo, J.R.; Delgado, J.; Otto, R.; Naranjo-Cigala, A.; Salas Pascual, M.; Fernández-Palacios, J. Distribution of alien vs. native plant species in roadside communities along an altitudinal gradient in Tenerife and Gran Canari (Canary Islands). Perspect. Plant Ecol. 2005, 7, 185–202. [Google Scholar] [CrossRef]
- Vizzari, M.; Hilal, M.; Sigura, M.; Antognelli, S.; Joly, D. Urban-rural-natural gradient analysis with CORINE data: An application to the metropolitan France. Landsc. Urban Plan. 2018, 171, 18–29. [Google Scholar] [CrossRef]
- Zêzere, J.; Pereira, A.; Morgado, P. Perigos Naturais e Tecnológicos no Território de Portugal Continental. In Apontamentos de Geografia; Centro de Estudos Geográficos, Universidade de Lisboa: Lisbon, Portugal, 2006. [Google Scholar]
- Frias, A.; Cabral, J. Facility localization: Strategic decision on insular territory. Asian J. Bus. Manag. 2013, 1, 2321–2803. [Google Scholar]
- Wirawan, B.; Tambunan, R. Challenges on Java’s small city spatial planning. In Proceedings of the IOP Conference Series: Earth and Environmental Science, Bandung, Indonesia, 3–5 April 2018; Volume 158. [Google Scholar]
- Edelman, D.; Gursoy, N. Regional development planning in Istanbul: Recent issues and challenges. Curr. Urban Stud. 2017, 5, 146–163. [Google Scholar]
- Jurado Almonte, J.M.; Fernández Tristancho, A. Experiencias En Turismo Accesible En Andalucía Y Portugal: Especial Atención Al Ámbito Alentejo-Algarve-Provincia De Huelva; Servicio de Publicaciones de la Universidad de Huelva: Huelva, Spain, 2016; Volume 182. [Google Scholar]
- Cabrera, M.; Custodio, E. The Canary Islands. In Water, Agriculture and the Environment in Spain: Can We Square the Circle? Di Estefano, L., Llamas, M.R., Eds.; CRC Press: Boca Raton, FL, USA, 2013; pp. 281–289. [Google Scholar]
- da Costa, A.M.; de Salis, H.H.C.; Viana, J.H.M.; Leal Pacheco, F.A. Groundwater Recharge Potential for Sustainable Water Use in Urban Areas of the Jequitiba River Basin, Brazil. Sustainability 2019, 11, 2955. [Google Scholar] [CrossRef]
- Zimmermann, E.; Bracalenti, L.; Piacentini, R.; Inostroza, L. Urban flood risk reduction by increasing green areas for adaptation to climate change. Procedia Eng. 2016, 161, 2241–2246. [Google Scholar] [CrossRef]
- Santos, L.d.; Fortuna, J. Modelo de exigências para uso urbano do solo. Critérios urbanísticos e riscos naturais—Um exemplo em Coimbra. Territorium 2005, 12, 69–95. [Google Scholar] [CrossRef] [PubMed]
- Meneses, F.J. O Urban Sprawl em Cidades Portuguesas de Média Dimensão—Análise da Década de 1991 a 2001; Universidade Técnica de Lisboa: Lisboa, Portugal, 2010. [Google Scholar]
- Hassan, M.M. Monitoring land use/land cover change, urban growth dynamics and landscape pattern analysis in five fastest urbanized cities in Bangladesh. Remote Sens. Appl. Soc. Environ. 2017, 7, 69–83. [Google Scholar] [CrossRef]


| Level 1 | Level 2 | Level 3 |
|---|---|---|
| 1. Artificial surfaces | 1.1. Urban fabric | 1.1.1. Continuous urban fabric |
| 1.1.2. Discontinuous urban fabric | ||
| 1.2. Industrial, commercial and transport | 1.2.1. Industrial or commercial units | |
| 1.2.2. Road and rail networks and associated land | ||
| 1.2.3. Port areas | ||
| 1.2.4. Airports | ||
| 1.3. Mine, dump and construction sites | 1.3.1. Mineral extraction sites | |
| 1.3.2. Dump sites | ||
| 1.3.3. Construction sites | ||
| 1.4. Artificial, non-agricultural vegetated areas | 1.4.1. Green urban areas | |
| 1.4.2. Sport and leisure facilities | ||
| 2. Agricultural areas | 2.1. Arable land | 2.1.1. Non-irrigated arable land |
| 2.1.2. Permanently irrigated land | ||
| 2.1.3. Rice fields | ||
| 2.2. Permanent crops | 2.2.1. Vineyards | |
| 2.2.2. Fruit trees and berry plantations | ||
| 2.2.3. Olive groves | ||
| 2.3. Pastures | 2.3.1. Pastures | |
| 2.4. Heterogeneous agricultural areas | 2.4.1. Annual crops associated with permanent crops | |
| 2.4.2. Complex cultivation | ||
| 2.4.3. Land occupied by agriculture | ||
| 3. Forests and semi-natural areas | 3.1. Forests | 3.1.1. Broad-leaved forest |
| 3.1.2. Coniferous forest | ||
| 3.1.3. Mixed forest | ||
| 3.2. Shrub and/or herbaceous vegetation association | 3.2.1. Natural grassland | |
| 3.2.2. Moors and heathland | ||
| 3.2.3. Scierophyllous vegetation | ||
| 3.2.4. Transitional woodland shrub | ||
| 3.3. Open spaces with little or no vegetation | 3.3.1. Beaches, dunes, and plains | |
| 3.3.2. Bare rock | ||
| 3.3.3. Sparsely vegetated areas | ||
| 3.3.4. Burnt areas | ||
| 3.3.5. Glaciers and perpetual snow | ||
| 4.Wetlands | 4.1. Inland wetlands | 4.1.1. Inland marshes |
| 4.1.2. Peatbogs | ||
| 4.2. Coastal wetlands | 4.2.1. Salt marshes | |
| 4.2.2. Saline | ||
| 4.2.3. Intertidal flats | ||
| 5. Water bodies | 5.1. Inland waters | 5.1.1. Water courses |
| 5.1.2. Water bodies | ||
| 5.2. Marine waters | 5.2.1. Coastal lagoons | |
| 5.2.2. Estuaries | ||
| 5.2.3. Sea and ocean |
| CLC Nomenclature\Year | 1990 | 2000 | 2006 | 2012 | 2018 |
|---|---|---|---|---|---|
| 112 | 10.32% | 11.64% | 11.79% | 11.40% | 11.40% |
| 121 | 0.00% | 0.00% | 0.00% | 0.39% | 0.39% |
| 212 | 0.39% | 0.39% | 0.00% | 0.00% | 0.00% |
| 221 | 0.00% | 0.00% | 0.08% | 0.08% | 0.03% |
| 222 | 1.06% | 1.06% | 1.05% | 1.05% | 1.05% |
| 241 | 2.43% | 2.43% | 1.02% | 1.02% | 0.00% |
| 242 | 3.54% | 3.33% | 4.97% | 4.97% | 4.99% |
| 243 | 14.24% | 13.42% | 12.70% | 12.78% | 13.15% |
| 311 | 6.88% | 6.88% | 6.19% | 3.42% | 6.44% |
| 312 | 4.25% | 4.39% | 4.08% | 3.98% | 4.46% |
| 313 | 21.43% | 21.43% | 20.81% | 18.03% | 16.68% |
| 321 | 10.33% | 10.33% | 11.14% | 11.60% | 13.45% |
| 322 | 16.55% | 16.22% | 16.22% | 14.84% | 20.12% |
| 324 | 6.07% | 5.97% | 7.46% | 5.37% | 6.57% |
| 333 | 2.33% | 2.33% | 2.33% | 2.33% | 1.11% |
| 334 | 0.00% | 0.00% | 0.00% | 8.58% | 0.00% |
| 523 | 0.17% | 0.17% | 0.16% | 0.16% | 0.16% |
Publisher’s Note: MDPI stays neutral with regard to jurisdictional claims in published maps and institutional affiliations. |
© 2022 by the authors. Licensee MDPI, Basel, Switzerland. This article is an open access article distributed under the terms and conditions of the Creative Commons Attribution (CC BY) license (https://creativecommons.org/licenses/by/4.0/).
Share and Cite
Lousada, S.; Cabezas, J.; Castanho, R.A.; Gómez, J.M.N. Land-Use Changes in Insular Urban Territories: A Retrospective Analysis from 1990 to 2018. The Case of Madeira Island—Ribeira Brava. Sustainability 2022, 14, 16839. https://doi.org/10.3390/su142416839
Lousada S, Cabezas J, Castanho RA, Gómez JMN. Land-Use Changes in Insular Urban Territories: A Retrospective Analysis from 1990 to 2018. The Case of Madeira Island—Ribeira Brava. Sustainability. 2022; 14(24):16839. https://doi.org/10.3390/su142416839
Chicago/Turabian StyleLousada, Sérgio, José Cabezas, Rui Alexandre Castanho, and José Manuel Naranjo Gómez. 2022. "Land-Use Changes in Insular Urban Territories: A Retrospective Analysis from 1990 to 2018. The Case of Madeira Island—Ribeira Brava" Sustainability 14, no. 24: 16839. https://doi.org/10.3390/su142416839
APA StyleLousada, S., Cabezas, J., Castanho, R. A., & Gómez, J. M. N. (2022). Land-Use Changes in Insular Urban Territories: A Retrospective Analysis from 1990 to 2018. The Case of Madeira Island—Ribeira Brava. Sustainability, 14(24), 16839. https://doi.org/10.3390/su142416839