Article

Plastic Packaging Waste Management in Iceland: Challenges and Opportunities from a Life Cycle Assessment Perspective

by
Ólafur Ögmundarson
1,*,
Laura Sophie Kalweit
2,
Venkateshwaran Venkatachalam
2,
Rakel Kristjánsdóttir
3,
Hans-Josef Endres
2 and
Sebastian Spierling
2
1
Faculty of Food Science and Nutrition, University of Iceland, 102 Reykjavík, Iceland
2
Faculty of Mechanical Engineering, Institute of Plastics and Circular Economy—IKK, Leibniz Universität Hannover, 30167 Hannover, Germany
3
Department for Climate and Circular Economy, Environment Agency of Iceland, 108 Reykjavik, Iceland
*
Author to whom correspondence should be addressed.
Sustainability 2022, 14(24), 16837; https://doi.org/10.3390/su142416837
Submission received: 18 October 2022 / Revised: 10 December 2022 / Accepted: 12 December 2022 / Published: 15 December 2022
(This article belongs to the Collection Waste Management towards a Circular Economy Transition)

Abstract

:
The management of plastic packaging waste is advancing quickly, and new strategies are being implemented worldwide for better resource recovery. To assess the environmental benefits of new ways of handling plastic packaging waste, we need to first evaluate current waste management options in order to create a basis for comparison. In this study, the environmental impacts of plastic packaging waste handling are assessed for the first time in Iceland using the life cycle assessment (LCA) methodology. The results show that mechanical recycling, despite including the impacts of exporting the waste to different European countries, has more environmental benefits than landfilling the waste in Iceland. Increasing the recycling rates of plastic waste in Iceland is also identified as a promising option from a resource efficiency perspective. With better waste sorting, Iceland can become more environmentally sustainable, ensuring that plastic materials land in recycling processes, and thereby enhancing the flow of material in the circular economy.

1. Introduction

Plastics are a versatile group of materials that provide material properties suitable for products ranging from food packaging to automotive applications. Plastic food packaging, for example, prevents food loss and waste, which could pose a greater risk to sustainable development if not for plastics. Subsequently, one could claim that it is not the plastic that is the problem but how humans use it in large quantities and then handle it as waste and improperly dispose of it. Improper waste management [1] also manifests in the increased amount of plastic litter in the world, causing major environmental problems for the world’s ecosystems [2]. The high carbon footprint of plastics is also a problem due to the related extraction of fossil resources, as well as the impacts of manufacturing [3]. The cumulative efforts of reducing plastic use and implementing better and more efficient waste handling and recycling results in less or no landfilling of valuable materials. This, in turn, will reduce the need for virgin plastics. With the right disposal routes, plastics may even play a more central role in the circular economy.
To promote the circular economy of plastics, there has been a rise in political activities and regulations on both a national and international level to curb plastic waste in the environment. In the case of Iceland, the landfilling or incineration without energy recovery of separately collected waste (e.g., paper and cardboard, metals, plastics, glass, bio waste, and textiles) will be banned from the year 2023. The current government has initiated bans on single-use plastic bags [4] and put in place extra fees for single-use plastic items. This is in line with the EU directive 2019/904 on the reduction of the impact of certain plastic products on the environment [5]. Despite the focus on better waste handling and the banning of single-use plastics, the average demand for plastic packaging in Iceland is one of the highest in Europe. It was approximately 49 kg (Iceland’s plastic packaging demand in 2019: 17,493 tons (see Supplementary Information SI-1) [6,7]. Iceland’s population on 1 January 2019: 356,991 [8]) of plastic packaging per capita, per year in 2019 [7,9], whereas the European average (EU27) was 34.5 kg per capita, per year for 2019 [9]. In addition, when comparing the recovery rates of Europe (77.4%) and Iceland (24.9%), it is obvious that there is still untapped potential in Iceland [9].
By assessing the environmental impacts of current plastic waste handling processes and by setting this in the context of the impacts of current plastic consumption, we can assess if future plastic waste handling strategies are more environmentally sustainable than current practices. This can also guide policymakers as to which disposal routes should be selected for minimizing the environmental impacts of plastic packaging waste.
For Iceland, this study is the first to assess the potential environmental impacts of plastic packaging consumption and waste management. It lays a baseline in terms of environmental impact results, making it possible to assess future changes in plastic waste management. It also helps to identify future research needs for other waste management options, both in Iceland and abroad.

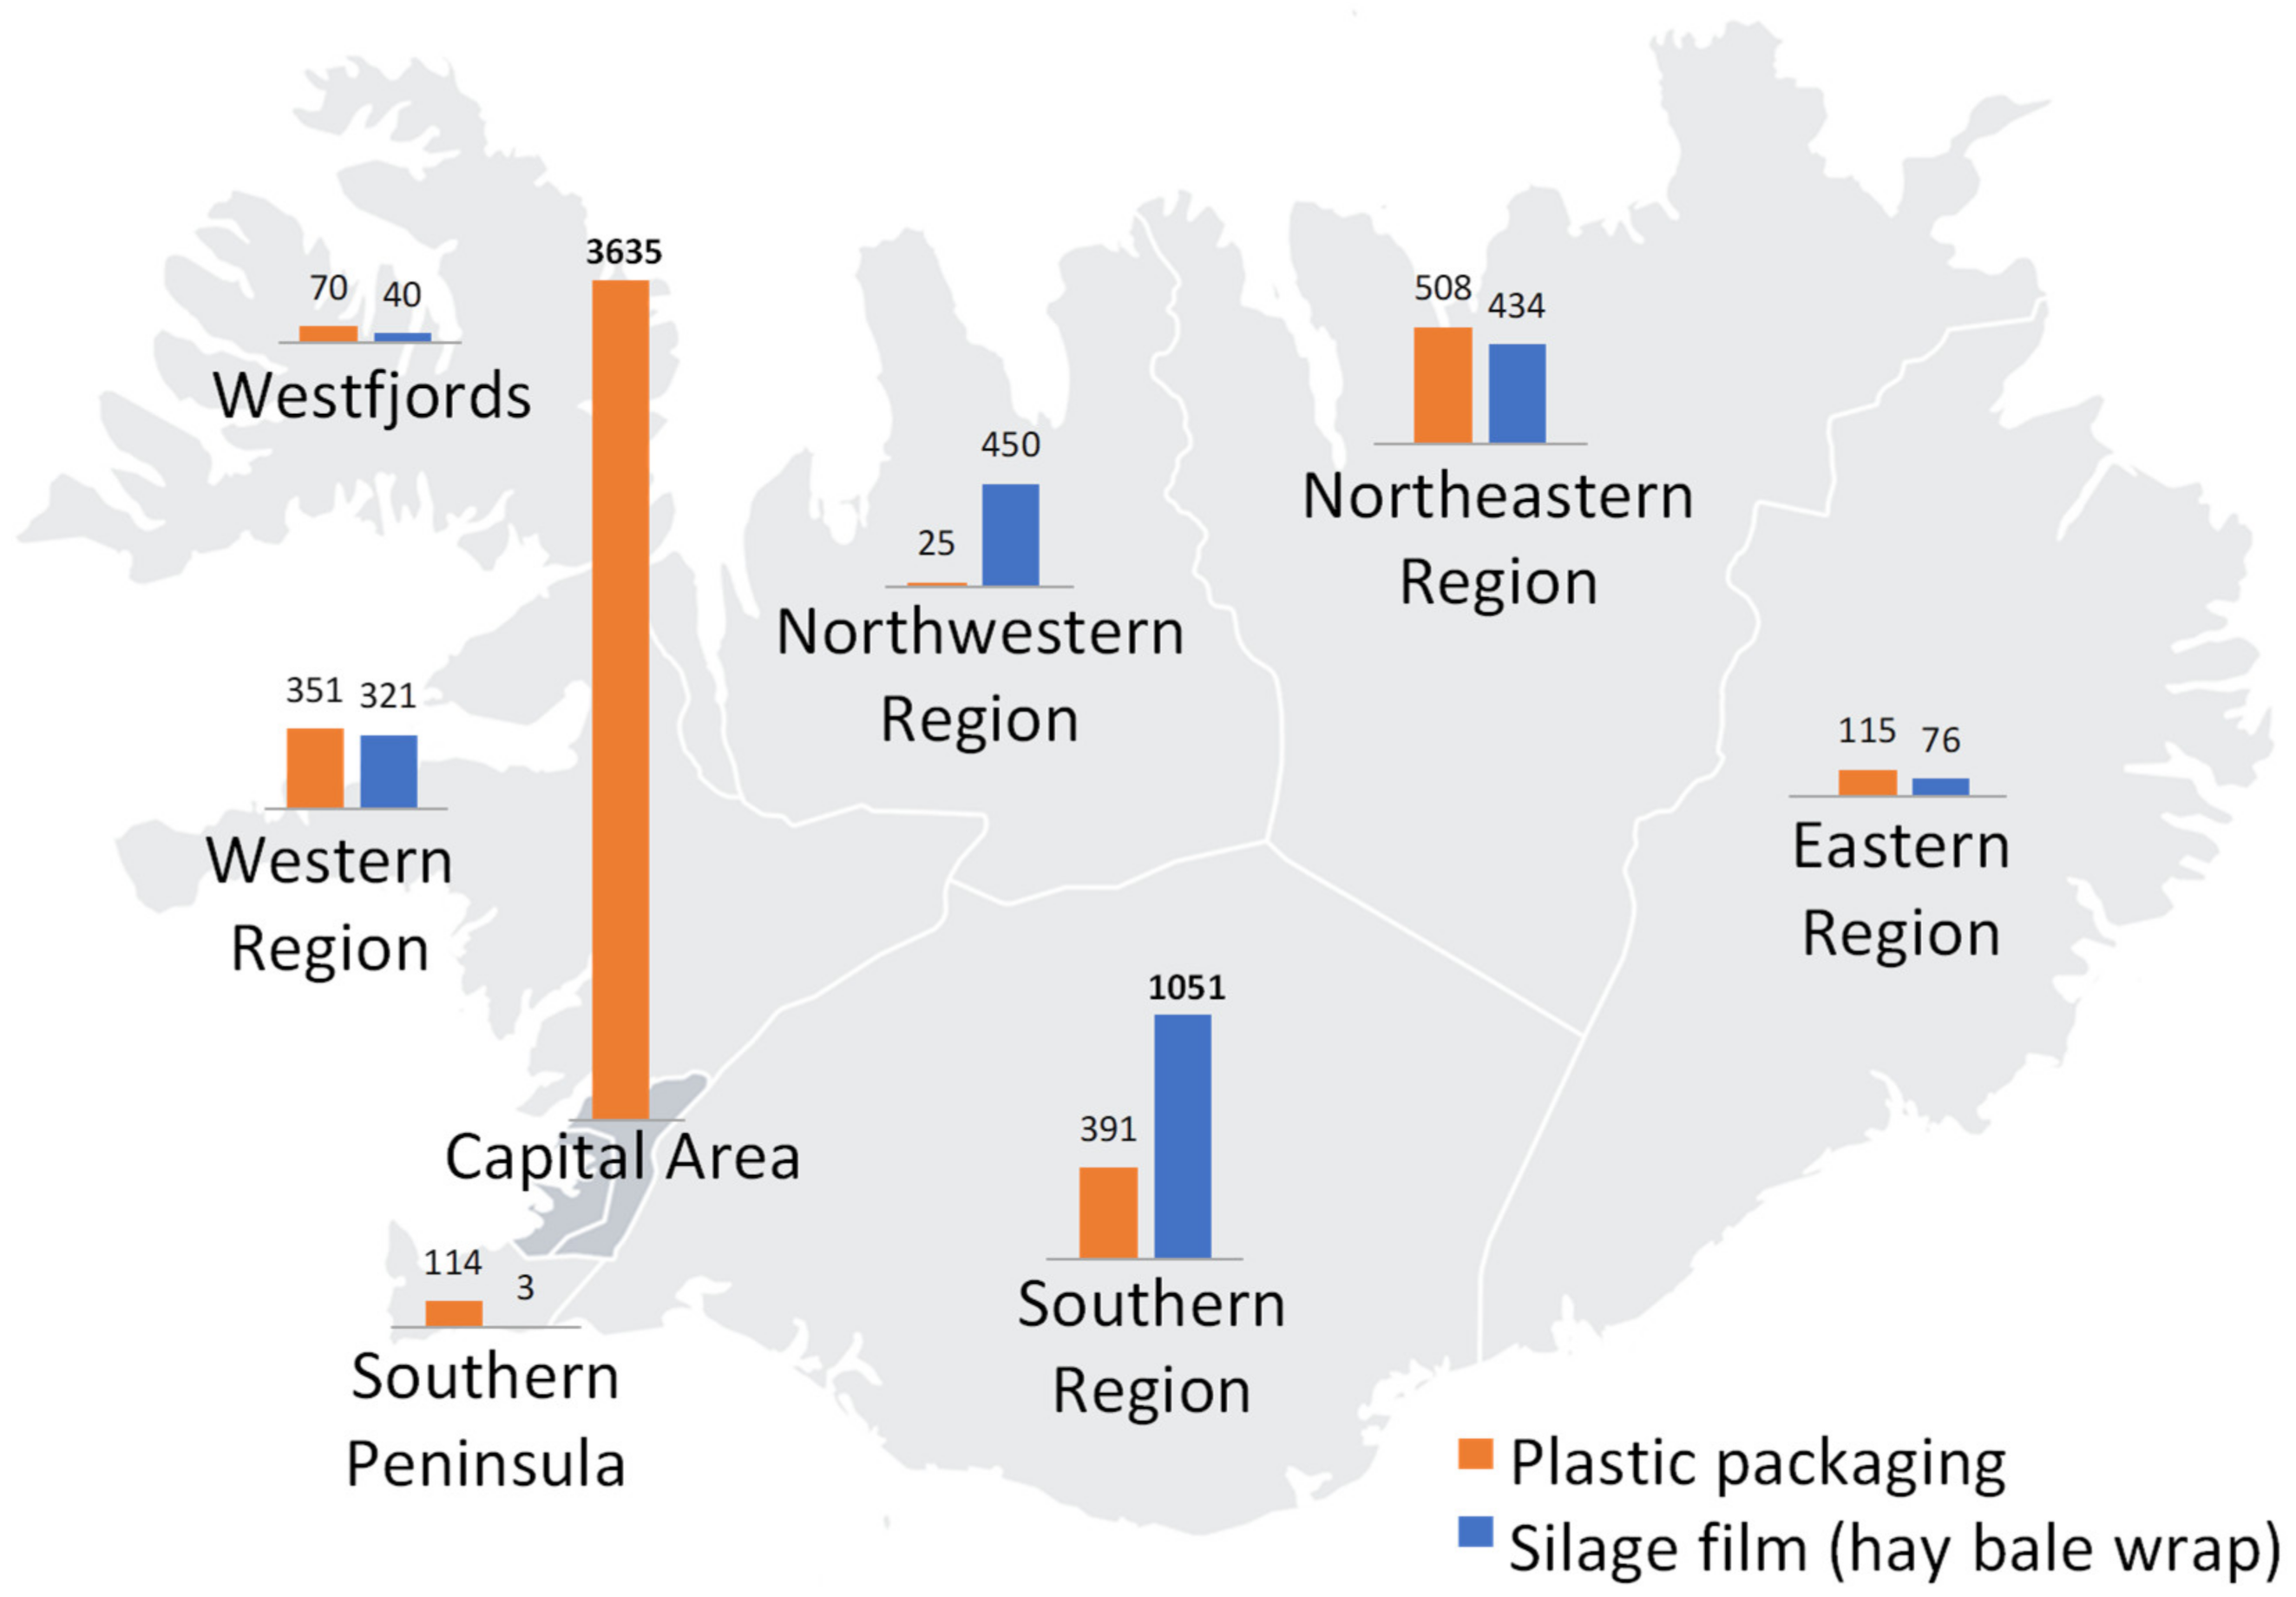
2. Plastic Packaging Demand and Waste in Iceland

This study builds on data from the Icelandic Recycling Fund [7]. The Icelandic Recycling Fund (IRF) is the relevant authority in Iceland for initiating economic incentives for the recycling and reduction of waste being landfilled. The IRF is also responsible for collecting data from waste handlers across the whole country of Iceland on the materials that fall under their jurisdiction, in this case, plastic packaging.
While the IRF is the responsible authority in Iceland for collecting data on plastic packaging, the Environmental Agency of Iceland (which operates under the direction of the Ministry of the Environment, Energy and Climate) is responsible for collecting and presenting the national waste statistics. The gathered data from the IRF are then reported by law to the Environment Agency’s data portal, as well as waste data from other governing bodies, compiled by the Environment Agency [10]. This study is therefore built on the best available data on plastic packaging in Iceland, but limitations are addressed in Section 3 of this study. An overview of the data, origin, location, and corresponding sources is provided in Table 1.
The reference year for this study is 2020. Note that the scope is restricted to only plastic packaging waste (EWC Stat code 07.41) as defined in EU regulation (EC) 2150/2002 ANNEX III [13]. It is important to clarify that silage film (hay bale wrap) is also registered as plastic packaging waste in Icelandic waste statistics. This, however, is not necessarily the case in other European countries, where it is most often registered as agricultural plastic waste [6,10]. Data for silage film (hay bale wrap) and deposit bottles are provided separately by the IRF because of their separate collection due to their refund system. The data for plastic packaging refer to both industry and households, although industrial recycling rates are significantly higher than household recycling rates. According to the IRF’s 2020 data, 89.3% of pre-consumer plastic packaging waste from industry that was sent for recycling was recyclable, while only 49.2% of pre-sorted household waste was recycled [6].
In 2020, approximately 63% of the population lived in the Greater Reykjavík Area [14]. Therefore, most plastic packaging (almost 70% including deposit bottles but without silage film) was collected in the capital area, whereas agricultural plastic packaging (silage film for hay bales) had higher shares in the Icelandic countryside (see Figure 1) [7].
Plastic packaging demand—Plastic packaging consumption in Iceland exceeded 14,445 tons in 2020 (see Figure 2). A major share (92.6%) of plastic packaging was imported and only 7.4% came from domestic production that year [7]. There was a steady increase in plastic use until 2019. Comparing the total amount of plastic packaging in Iceland with the previous year’s (see supplementary information SI-1), a decrease is noticeable in 2020, which can be attributed to the impacts of the global COVID-19 pandemic [15]. In addition to the decline in global plastic production, the decline in tourism is also a possible reason [15,16]. Additionally, there has been a rise in the awareness of single-use plastic packaging consumption due to its recent ban in Iceland. Previous studies have shown a connection between the ban on single-use plastic and consumer motivation for plastic packaging waste avoidance [17]. The IRF has not yet provided data for 2021, but European market data show an increase in plastic demand during 2021 [15].
Plastic packaging waste—Information about end-of-life plastic management in Iceland for the year 2020 is given in the Sankey diagram in Figure 2. The chart clearly shows the flow of plastic consumption and waste management. The total amount of 14,445 tons was composed of plastic packaging, silage film, and deposit bottles.
The IRF reports the collected amount of each plastic application for the year 2020, as well as the disposal route. Collected plastic waste is pre-sorted and sent to different European countries for recycling. Of the total plastic packaging waste, 30.8% is intended for recycling. However, this recycling rate is primarily due to the high recycling rate of the single-variety silage film and deposit bottles [7]. For deposit bottles, customers receive a refund when empty beverages are returned [18]. This is also the case for silage film, giving the farmers the incentive to collect and hand in film for recycling [19]. For this reason, deposit bottles and silage film have a high collection and recycling rate. Eventually, due to the contamination of other plastic packaging, only 14.2% of packaging is recycled [6,7]. The rest is then incinerated with energy recovery. In addition, a large proportion is not packaging but ends up in plastic containers due to poor waste sorting by consumers. Since the focus of this study is on plastic packaging only, other waste categories (non-packaging plastic waste, water, and dirt) are not considered (see Figure 2).
The IRF does not report a major share of packaging waste and its end-of-life treatment remains unknown. A total of 7.6% of the disposed plastic is incinerated without energy recovery in Iceland [6]. Additionally, littering or remaining in usage (use phase) are possible reasons for the lack of data, but no justified assumptions can be made due to high uncertainty. Since it is mainly landfilled as mixed household waste (often called municipal solid waste (MSW)), the rest (92.4%) is assumed by the IRF [6] to be landfilled (see Section 3).
The collected plastic intended for recycling was sent to different European countries in 2020 and 2021 (see Table 2). A certain variation in the final destinations of the plastic packaging sent for recycling is noticeable between the years 2020 and 2021 since exports were highly affected by COVID-19 in 2020. Therefore, the average of both years for the geographical location in this study is used for the different end-of-life options. To date, only a small proportion of the plastic packaging waste generated (silage film only) is recycled in Iceland and processed into pellets. The pellets are shipped mainly to Great Britain (see Table 1) since the infrastructure for further processing is not available in Iceland [6].
Landfilling is mainly utilized in Iceland as a disposal route. Fifteen active landfill operations have permits that allow them to receive mixed active waste for landfilling [10]. This includes mixed household waste (within municipal solid waste, MSW), which consists of, among other types of waste, unsorted plastic packaging. Even if plastic packaging waste does not include hazardous materials, it still contains additives that can pollute the leachate. Moreover, the leachate collection does not filter out microplastics [20]. Therefore, the environmental impacts generated by landfills cannot be represented by the LCA impact categories. Further information can be found in the supplementary information SI-2.
To summarize, the current system for plastic waste management in Iceland consists mainly of disposal within Iceland (landfill and incineration without energy recovery) and recovery waste treatment in Europe, where plastic waste is sent for recycling and incineration with energy recovery.

3. Materials and Methods

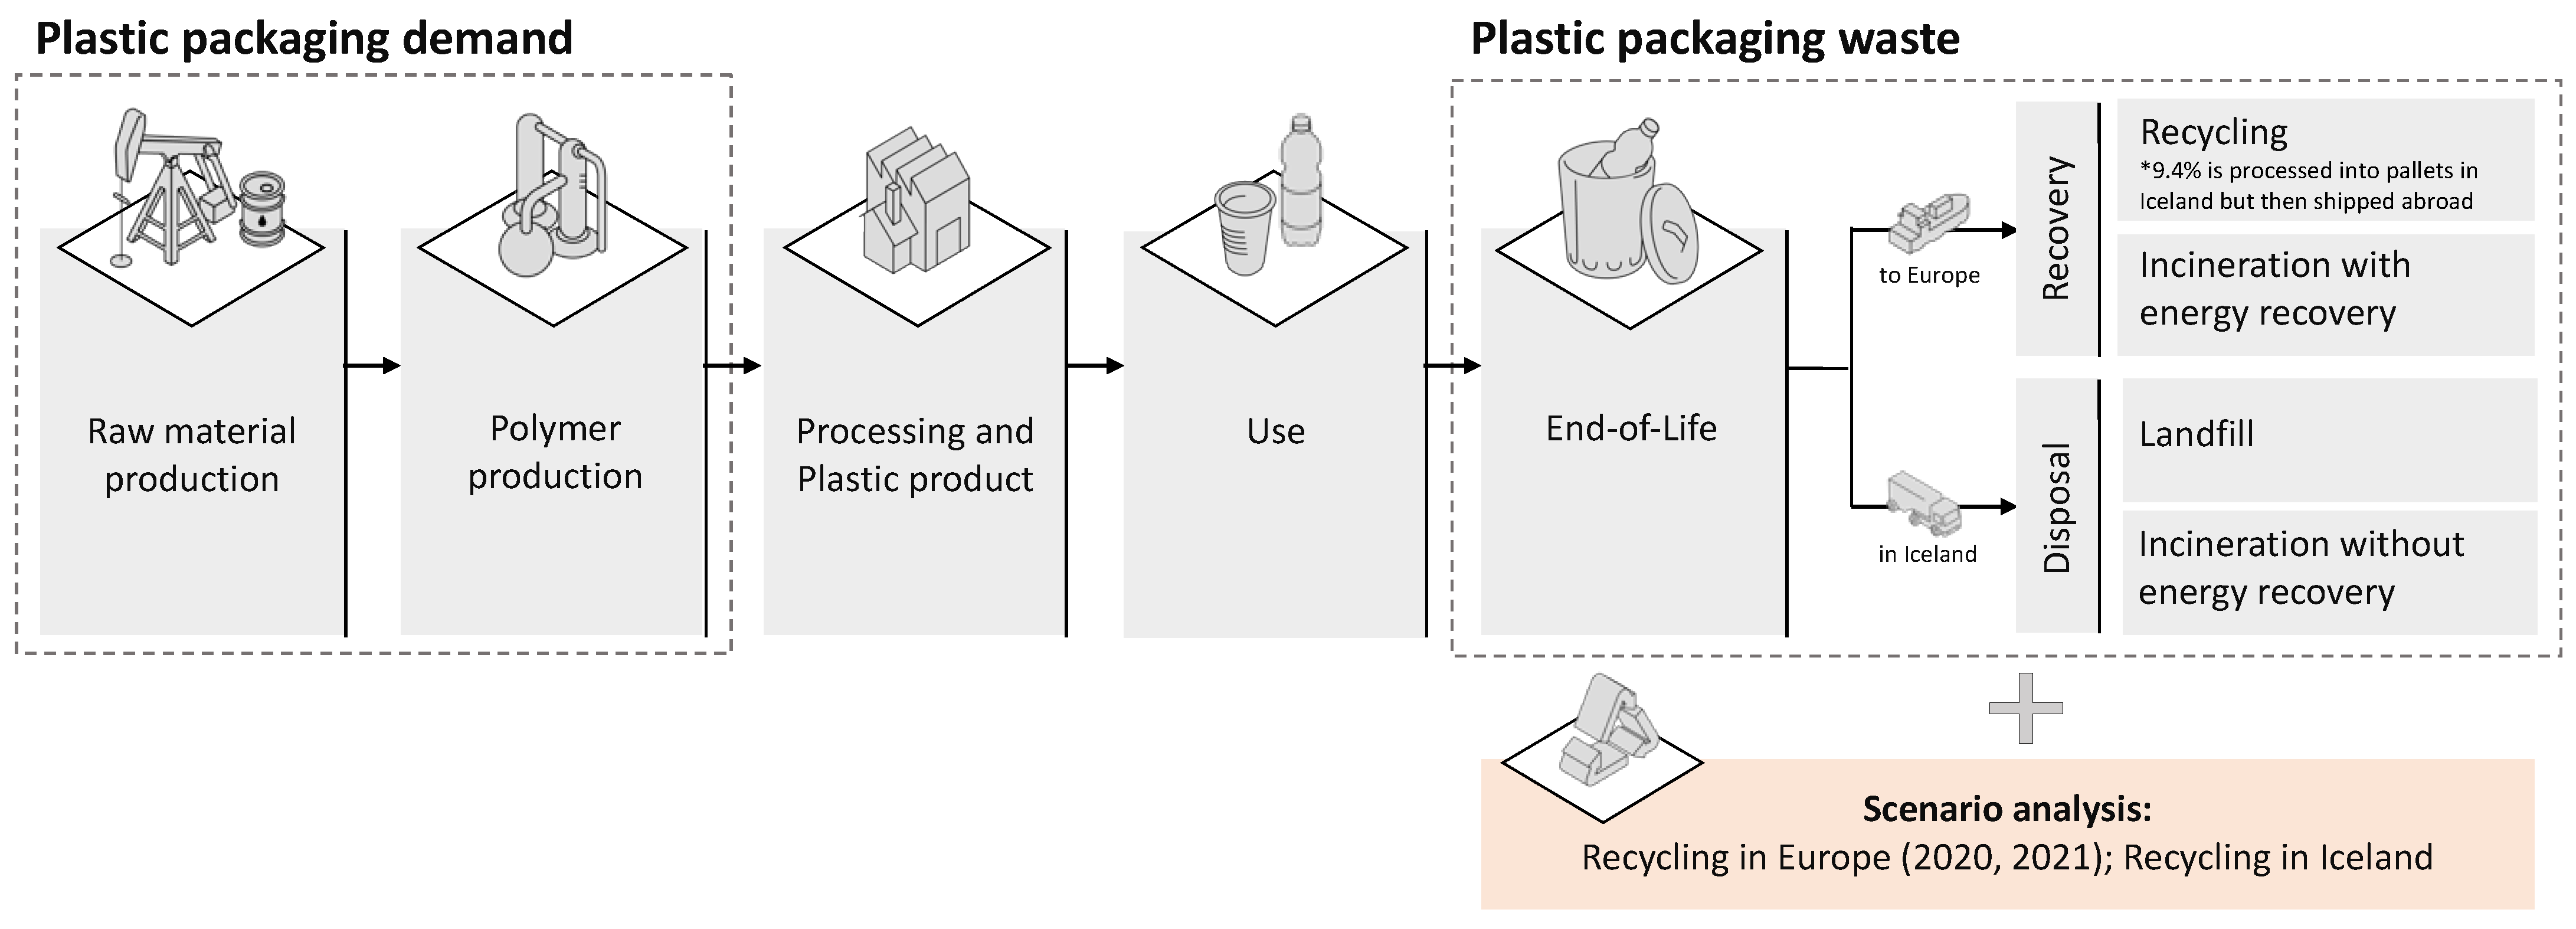
3.1. Goal and Scope of the Study

The goal of this study is to estimate the potential environmental impacts of plastic consumption and waste management in Iceland using life cycle assessment (LCA). The LCA is an internationally standardized tool, which is used to estimate the potential environmental impacts of a product/process/service across its life cycle. The framework and guidelines for conducting an LCA are standardized and are performed in accordance with ISO 14040 [21] and 14044 [22]. In addition to the ISO standards, the LCA community have come up with different guidelines and initiatives, including those from the International Life Cycle Data System (ILCD) of the European Commission, which helps researchers and industries to understand the critical aspects of LCA [23,24]. Based on the plastic consumption data and the plastic waste streams, the potential environmental impacts are calculated in this study. The results are then compared with different scenarios to assess the potential environmental benefits of policy changes in Icelandic waste management strategies in the future.
To better understand the environmental impacts of plastic waste management in Iceland, scenarios are defined within the scope of the study, the results of which will then be interpreted and discussed in detail in Section 5. The system boundaries and additional scenarios are shown in Figure 3.
The calculation procedure is based on life cycle assessment data obtained and modeled with GaBi software [25] and GaBi life cycle inventory databases [26] based on ISO 14040/44 [21,22] (see supplementary information SI-4). For the life cycle impact assessment (LCIA), the CML 2001—Version April 2016 method was applied as the impact assessment method [27], and all available impact indicators were considered to enable a holistic overview: global warming potential (GWP), abiotic depletion (fossil) potential (ADP), acidification potential (AP), and eutrophication potential (EP). In addition, the LCIA results of ozone depletion potential (ODP), photochemical ozone creation potential (POCP), abiotic depletion potential elements (ADP elements), freshwater aquatic ecotoxicity potential (FAETP inf), human toxicity potential (HTP inf), marine aquatic ecotoxicity potential (MAETP inf), and terrestrial ecotoxicity potential (TETP inf) are provided in the supplementary information.
The functional unit (FU) was the annual plastic packaging demand in Iceland and its end-of-life treatment in Europe for the year 2020. The amount of plastic packaging according to the different plastic types consumed and the amount of packaging treated after use, along with the impact of transporting and treating this plastic waste, are considered in the reference flows. The exact values of the reference flows (regarding the packaging waste and the amount/proportion of waste treated/disposed of) are discussed in Section 2.
To calculate the environmental impacts of plastic demand and waste in Iceland per year, the following methods (calculation procedures) are applied, which combine the amounts of plastic consumption (from the baseline year, 2020) according to the plastic type and the corresponding waste, alongside its environmental impacts. By treating plastic consumption and the treatment of plastic waste as two functions of the system under consideration, the functional unit and the corresponding reference flows for these two functions are defined within this study.

3.2. Inventory Analysis

3.2.1. Plastic Packaging Demand

The assessment of plastic consumption in Iceland shows the current environmental impact of conventional plastics. While the impact on a cradle-to-gate basis is considered for the raw plastic, the impacts of additives and the further processing of plastic products (e.g., via injection molding) are not considered due to the lack of detailed data (see the system boundaries in Figure 3).
The first assessment deals with the calculation of the environmental impacts of plastic consumption in Iceland, based on the plastic packaging demand in Iceland for 2020. Subsequently, based on the composition of the plastic packaging and the individual environmental impacts of each plastic type (calculated with the help of LCI datasets), the environmental impact of a ton of plastic packaging mix in Iceland was calculated (as the sum of the environmental impacts of individual plastic types per ton), which was then multiplied with the annual consumption of plastic packaging in Iceland for the year 2020 (14,445 tons).

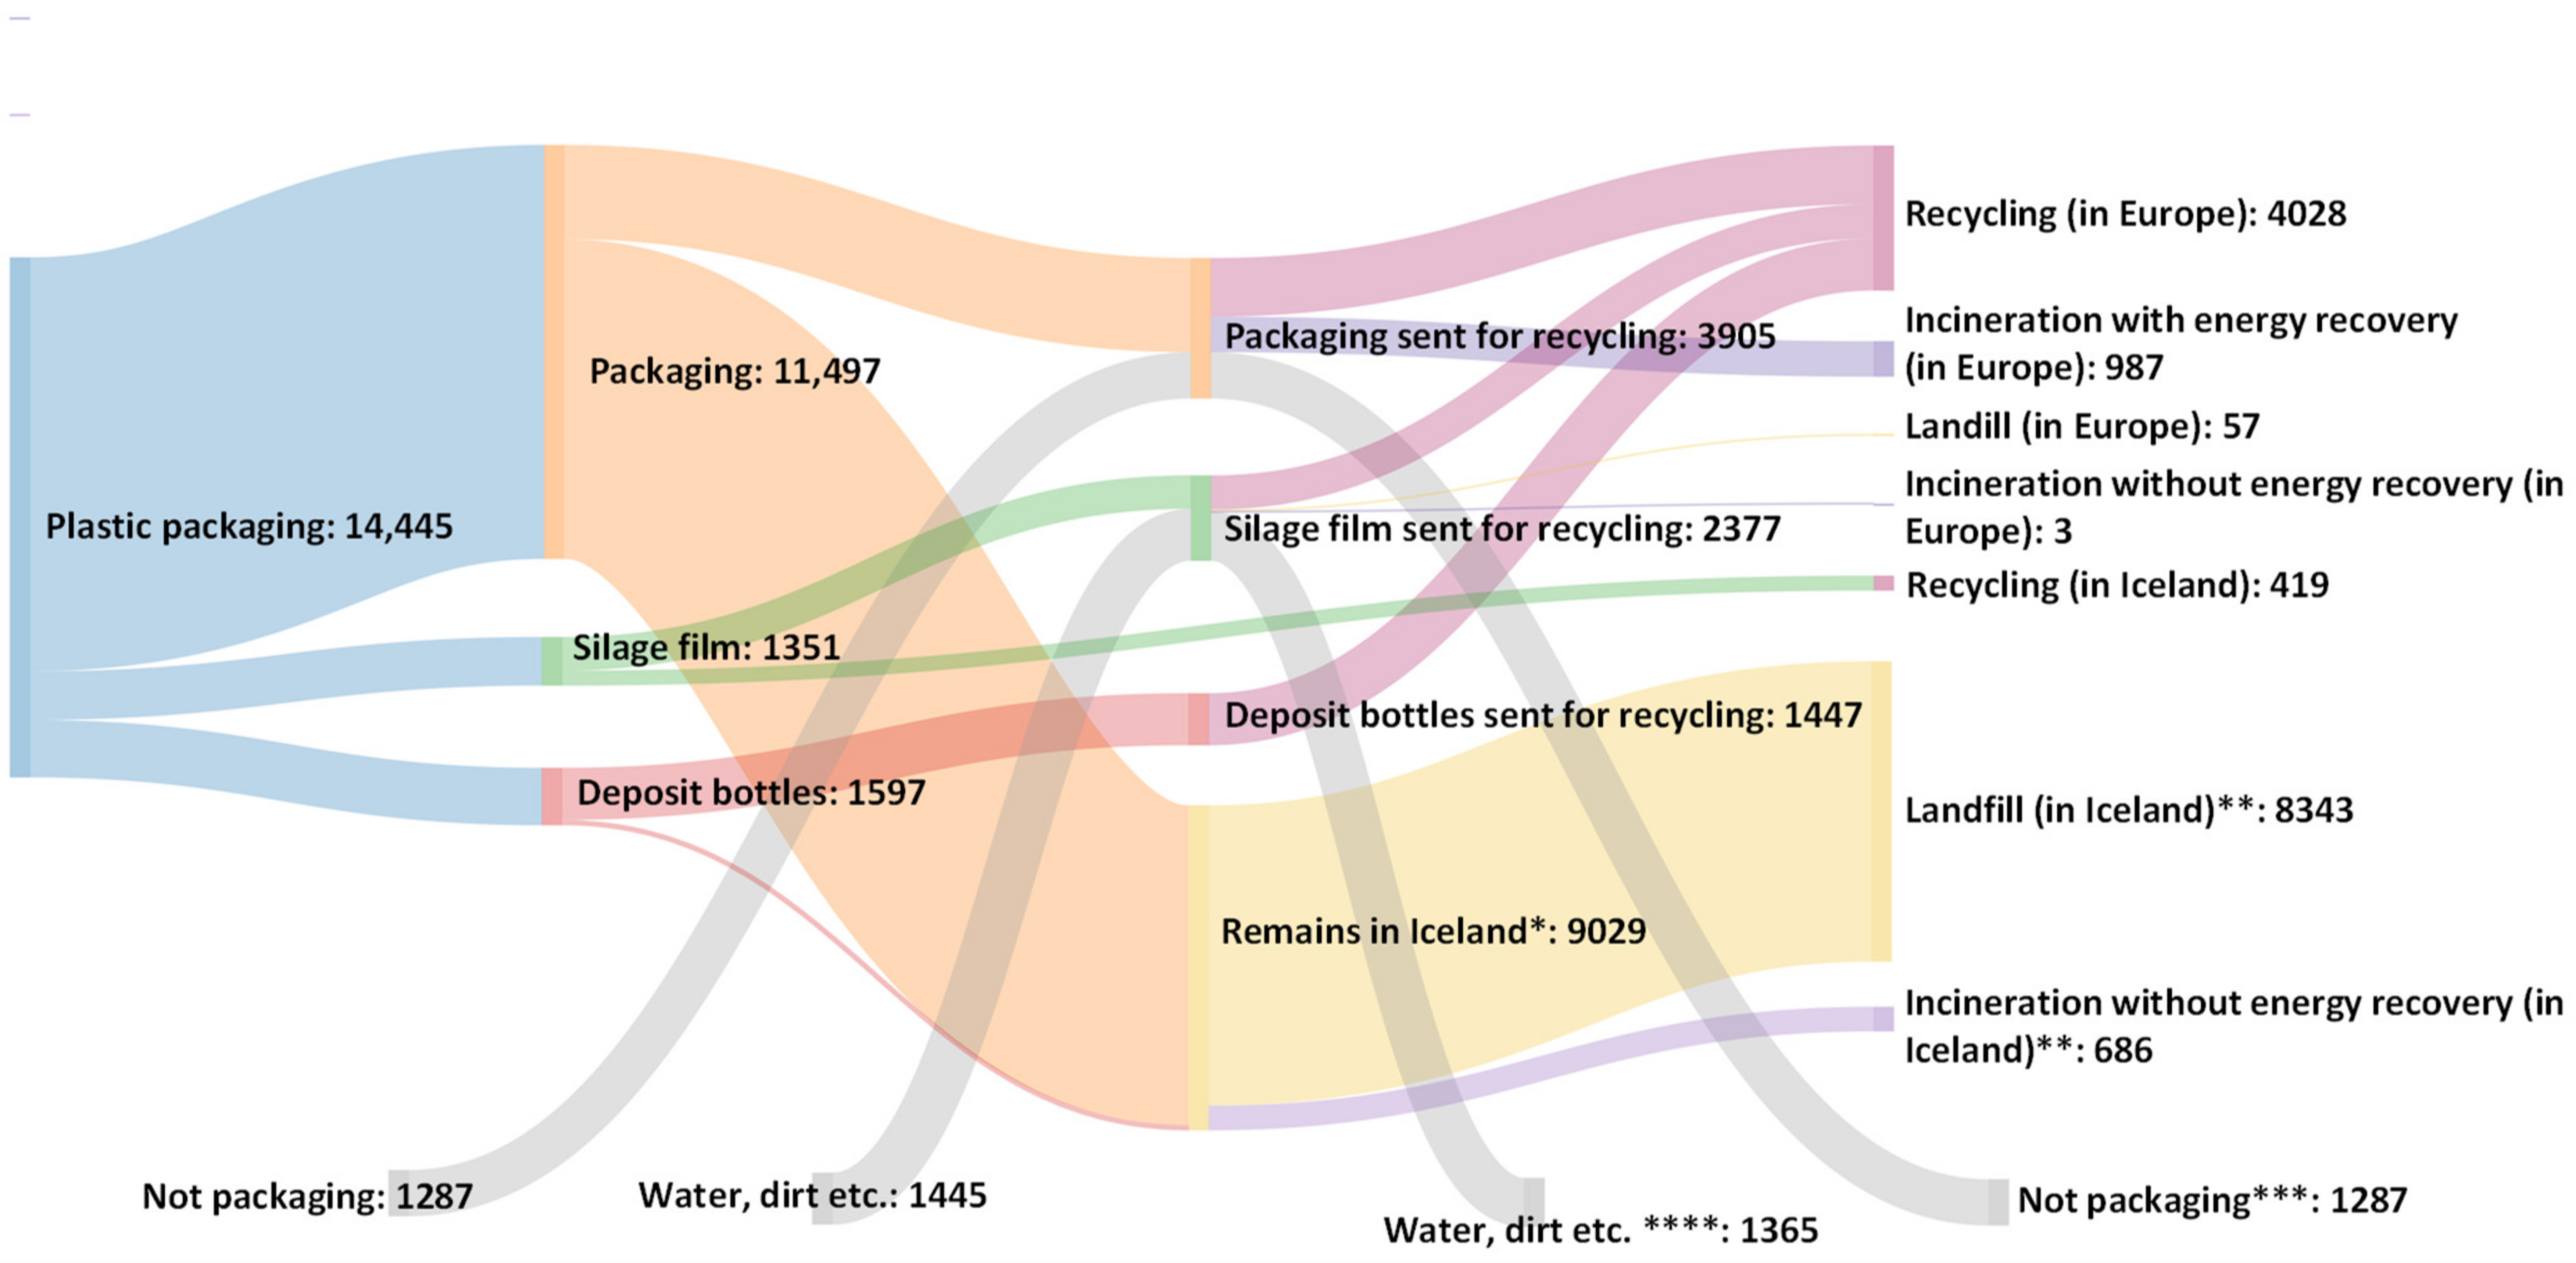
3.2.2. Plastic Packaging Waste

The assessment of current plastic waste management in Iceland shows the impact of current end-of-life options. Four end-of-life options are considered: recycling (mechanical), landfill, and incineration with and without energy recovery. Landfill and incineration without energy recovery are mainly conducted within Iceland, whereas recycling is mainly conducted outside of Iceland (see Table 1). Waste flows occurring during the recycling process in the respective countries are treated by landfill and incineration with energy recovery in those countries. Transport was also considered for the different end-of-life options. Within Iceland, the transport distance for waste collection by truck is assumed to be 100 km, but no accurate data are available on the average transport distances of waste within the country. The transportation distance to Europe via container ship is calculated by EcoTransit [28] (Sweden 2178 km, Germany 2321 km, Netherlands 2272 km, Poland 2975 km, and Denmark 2377 km). Truck transports in Europe to recycling facilities are also assumed to be 100 km. For end-of-life options that result in products (recycling with secondary plastic and incineration with energy recovery with electricity and steam), as well as the impact caused by processing, credits are also accounted for. For mechanical recycling, a material quality and substitution share for primary plastic of 90% is considered, according to Nessi et al. [29]. Credits and energy substitution potential were given for incineration with energy recovery (information on credits were based on commercial life cycle inventory databases, which vary between countries and type of plastic waste), where the energy resources can be recovered. In the case of incineration without energy recovery or landfill, no credits are associated as there is no resource recovery.
To enable a better understanding of the results, the life cycle impacts of the different end-of-life options are not only shown for the overall plastic waste in Iceland but also on a per ton basis to enable a direct comparison of the different end-of-life options.
Moreover, beyond the interpretation of the study’s results according to the ISO 14044 standard, the additional analysis assesses potential future scenarios for plastic waste management pathways in Iceland. The scenario analysis of exports to different countries in the years 2020 and 2021 (see Table 1) or a shift to local recycling within Iceland is based on the same calculation procedure. As the potential credits for recycled plastic are assumed to not differ between geographical locations, for this scenario analysis, only the impacts of processing and transport are compared.
In general, the following LCA data were used: For the impacts of the different plastics, cradle-to-gate data on the European average were considered; see the supplementary information SI-5. Plastic-type-specific data were accounted for. For the considered end-of-life options, the following life cycle inventory datasets were chosen. For (mechanical) recycling a generic plastic recycling dataset was adapted (considered the recycling processes of washing, granulation, pelletizing, and compounding) with available country-specific background data. Due to the limited availability of Icelandic-specific data, European energy datasets for utilities such as steam had to be used. However, it can be assumed that the environmental impacts of the Icelandic energy supply would be even lower because of the use of geothermal steam resources. Credits for avoiding primary plastic production were considered with the mentioned quality adjustments for substitution. The same cradle-to-gate data as mentioned above were used for this calculation. For landfills, a generic dataset of the European average was used. Incineration with/without energy recovery was covered with a generic dataset, which was supplemented with available country-specific background data (e.g., electricity mix). For transport, the Euro4 truck 28–32 t gross weight (22 t payload capacity) was chosen with the respective country-specific fuel production, as well as ocean-going ships with 5000 to 200,000 dwt payload capacity for overseas transport.

3.2.3. Data Limitations and Assumptions of the LCA Study

Not all the data related to the waste management in Iceland might be reported correctly by waste handlers to the Environment Agency’s waste data portal. The Environment Agency has assumptions and premises behind its waste statistics and how it corrects the portal data. Due to the lack of information on certain parts of the life cycle of plastics in Iceland, and for simplification when calculating the plastic packaging consumption and waste data, several assumptions were made for this study, in consultation with the Environment Agency and the IRF.
The composition of plastic packaging is assumed to be a mixture of different plastic types based on the European average (polymer types: low-density polyethylene (LDPE), linear low-density polyethylene (LLDPE), high-density polyethylene (HDPE), polypropylene (PP), polystyrene (PS), expandable polystyrene (PS-E), polyvinyl chloride (PVC), polyethylene terephthalate (PET), acrylonitrile butadiene styrene (ABS), polyamide 6 (PA6), polyamide 6.6 (PA6.6), polycarbonate (PC), and polyurethane (PU)) from 2020, which was provided by Plastics Europe [11,12], as Iceland-specific data could not be obtained and are currently unavailable (due to the lack of plastic production in Iceland). However, it is assumed that the European average also represents the composition and proportion of different plastic types used in Iceland [6,10]. The environmental impacts are considered on a cradle-to-gate basis for the different plastic types, based on European average values for plastic packaging (see supplementary information SI-3). More precise data are available for the subsector deposit bottles and silage films. In the case of deposit bottles, PET is considered [6,18]. According to Pure North (Iceland’s recycling facility of hay bale wrap), silage film is made of LLDPE [30].
For simplification, it was assumed that all plastic packaging that was put on the market in 2020 became waste the same year, as it is most often produced for single-use applications such as packaging. Of all plastics, 62.5% were not sorted and were registered into the waste data (see Figure 2). Since landfilling is currently the major end-of-life option for mixed household waste in Iceland, for the 62.5% of unsorted waste, end-of-life scenarios were modeled as 92.4% landfilling and 7.6% incineration without energy recovery according to the IRF [6]. Since no country-specific datasets are available for landfilling in Iceland, the assessment of the impacts of landfilling was conducted following European standards. However, recent research has shown that this is appropriate for estimating landfill emissions in Iceland [31].
Littering is not considered as an end-of-life option since no specific data are available on the amount of plastic that is dumped into the ocean or the natural environment (see Figure 2). In Iceland, an island in the North Atlantic Ocean, marine plastic litter, in particular, poses an increasing problem, mainly occurring in relation to consumer waste and the fishing industry [32]. For example, poor waste management, tourism, or strong winds can cause the littering of plastic packaging. However, plastic littering is currently not included in the LCA methodology, even though it can cause damage to biodiversity or human health [33], and is therefore not assessed in this study.
This study builds on data from the IRF. Therefore, the results of this study have a fairly high certainty when assessing demand and end-of-life scenarios. However, the “in-market” data are based on the calculation method of the IRF’s web customs register, which is based on the plastic packaging fees [6,34]. For calculating the recycling rate for the exported plastics, the IRF uses information from overseas recycling facilities. These are average recycling rates for each facility and do not directly reflect the recycling rate for plastics from Iceland.

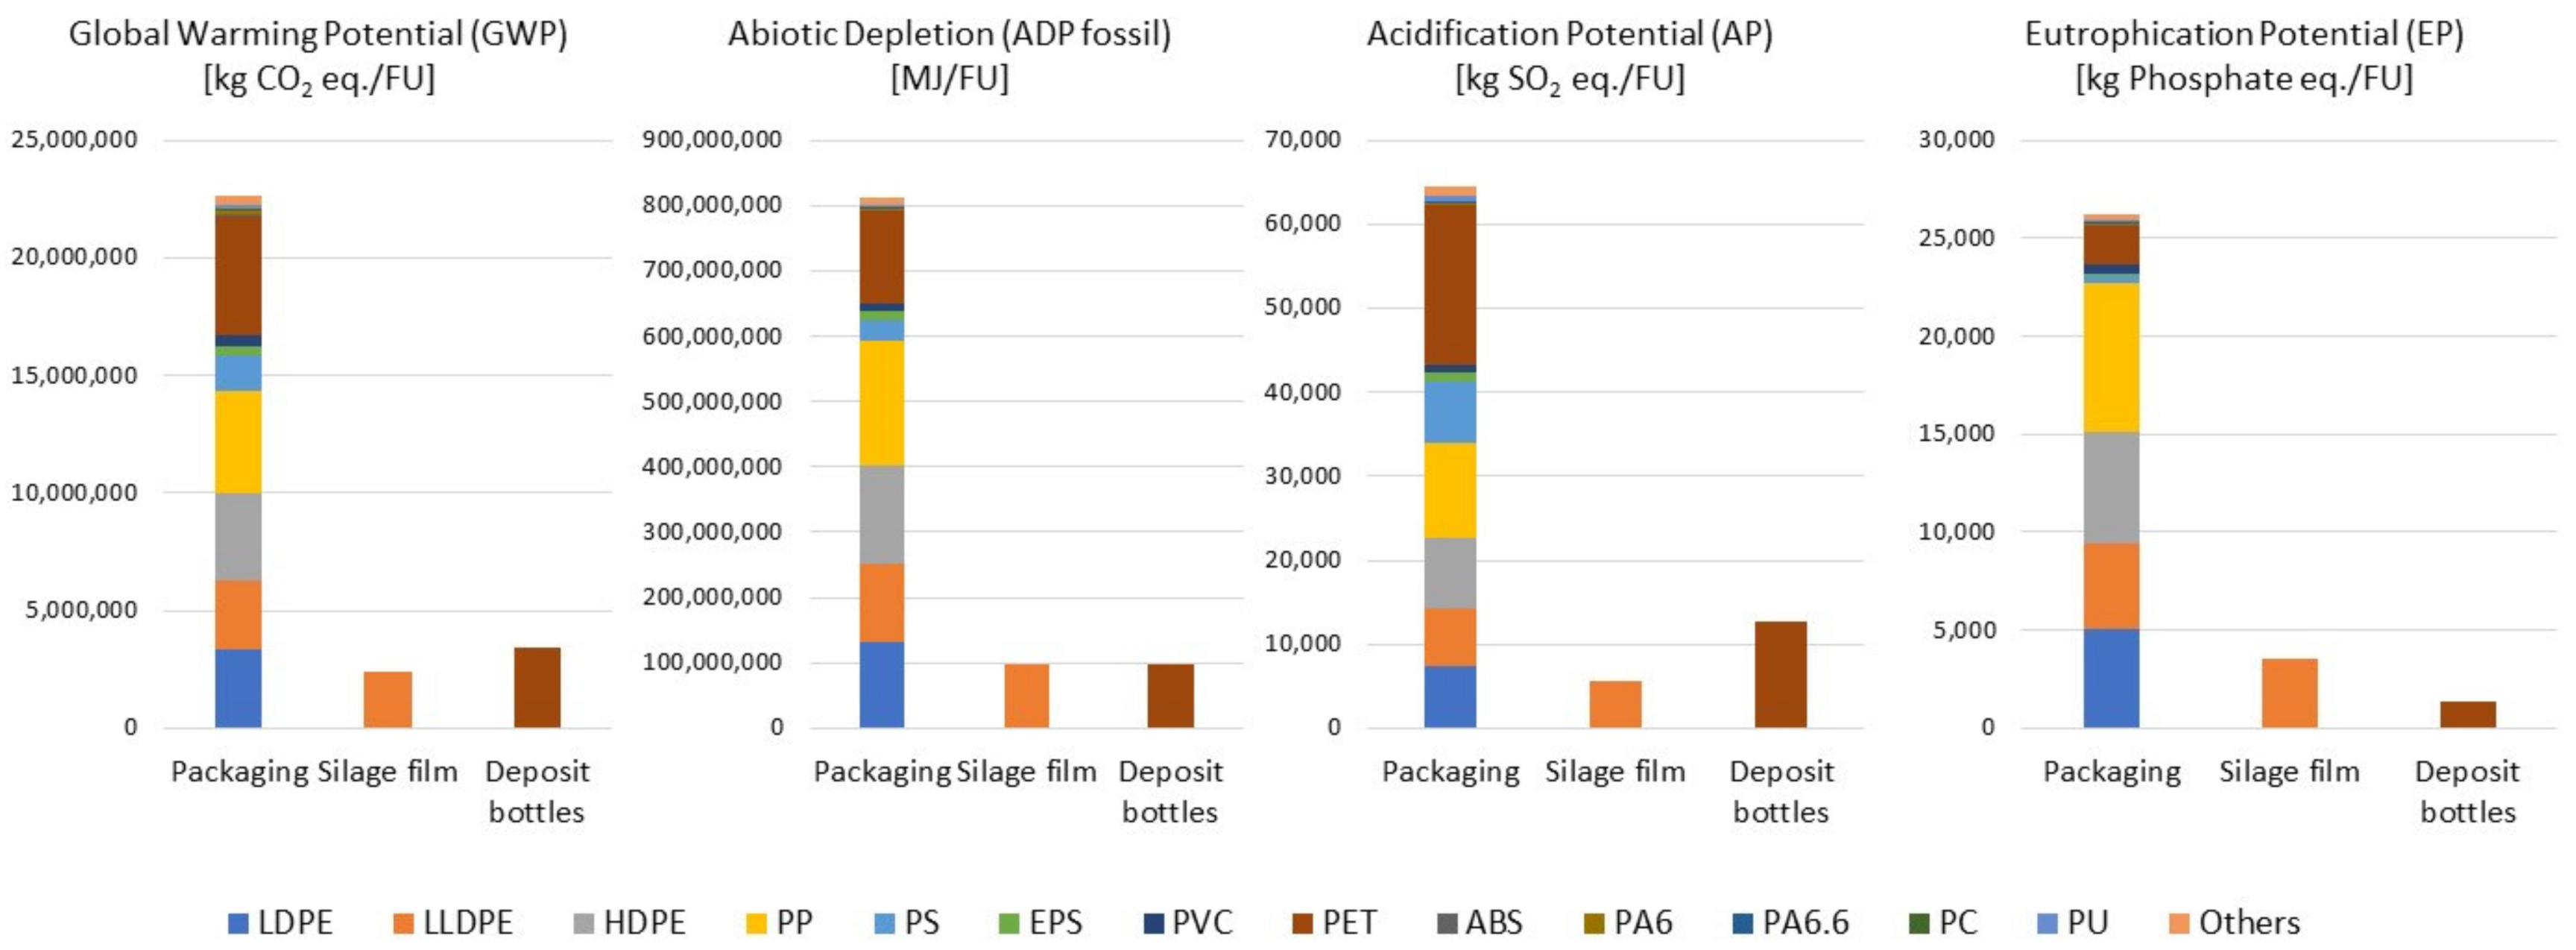
4. Impact Assessment

This section shows the LCA results of the different assessments and scenarios that were considered within the scope of this study. Moreover, the environmental impacts of treating and disposing of plastic waste from Iceland are interpreted and discussed in detail. The results for the indicators GWP, AP, EP, and ADP (fossils) are also shown and discussed in this section in detail. The results of additional CML indicators can be found in the supplementary information.

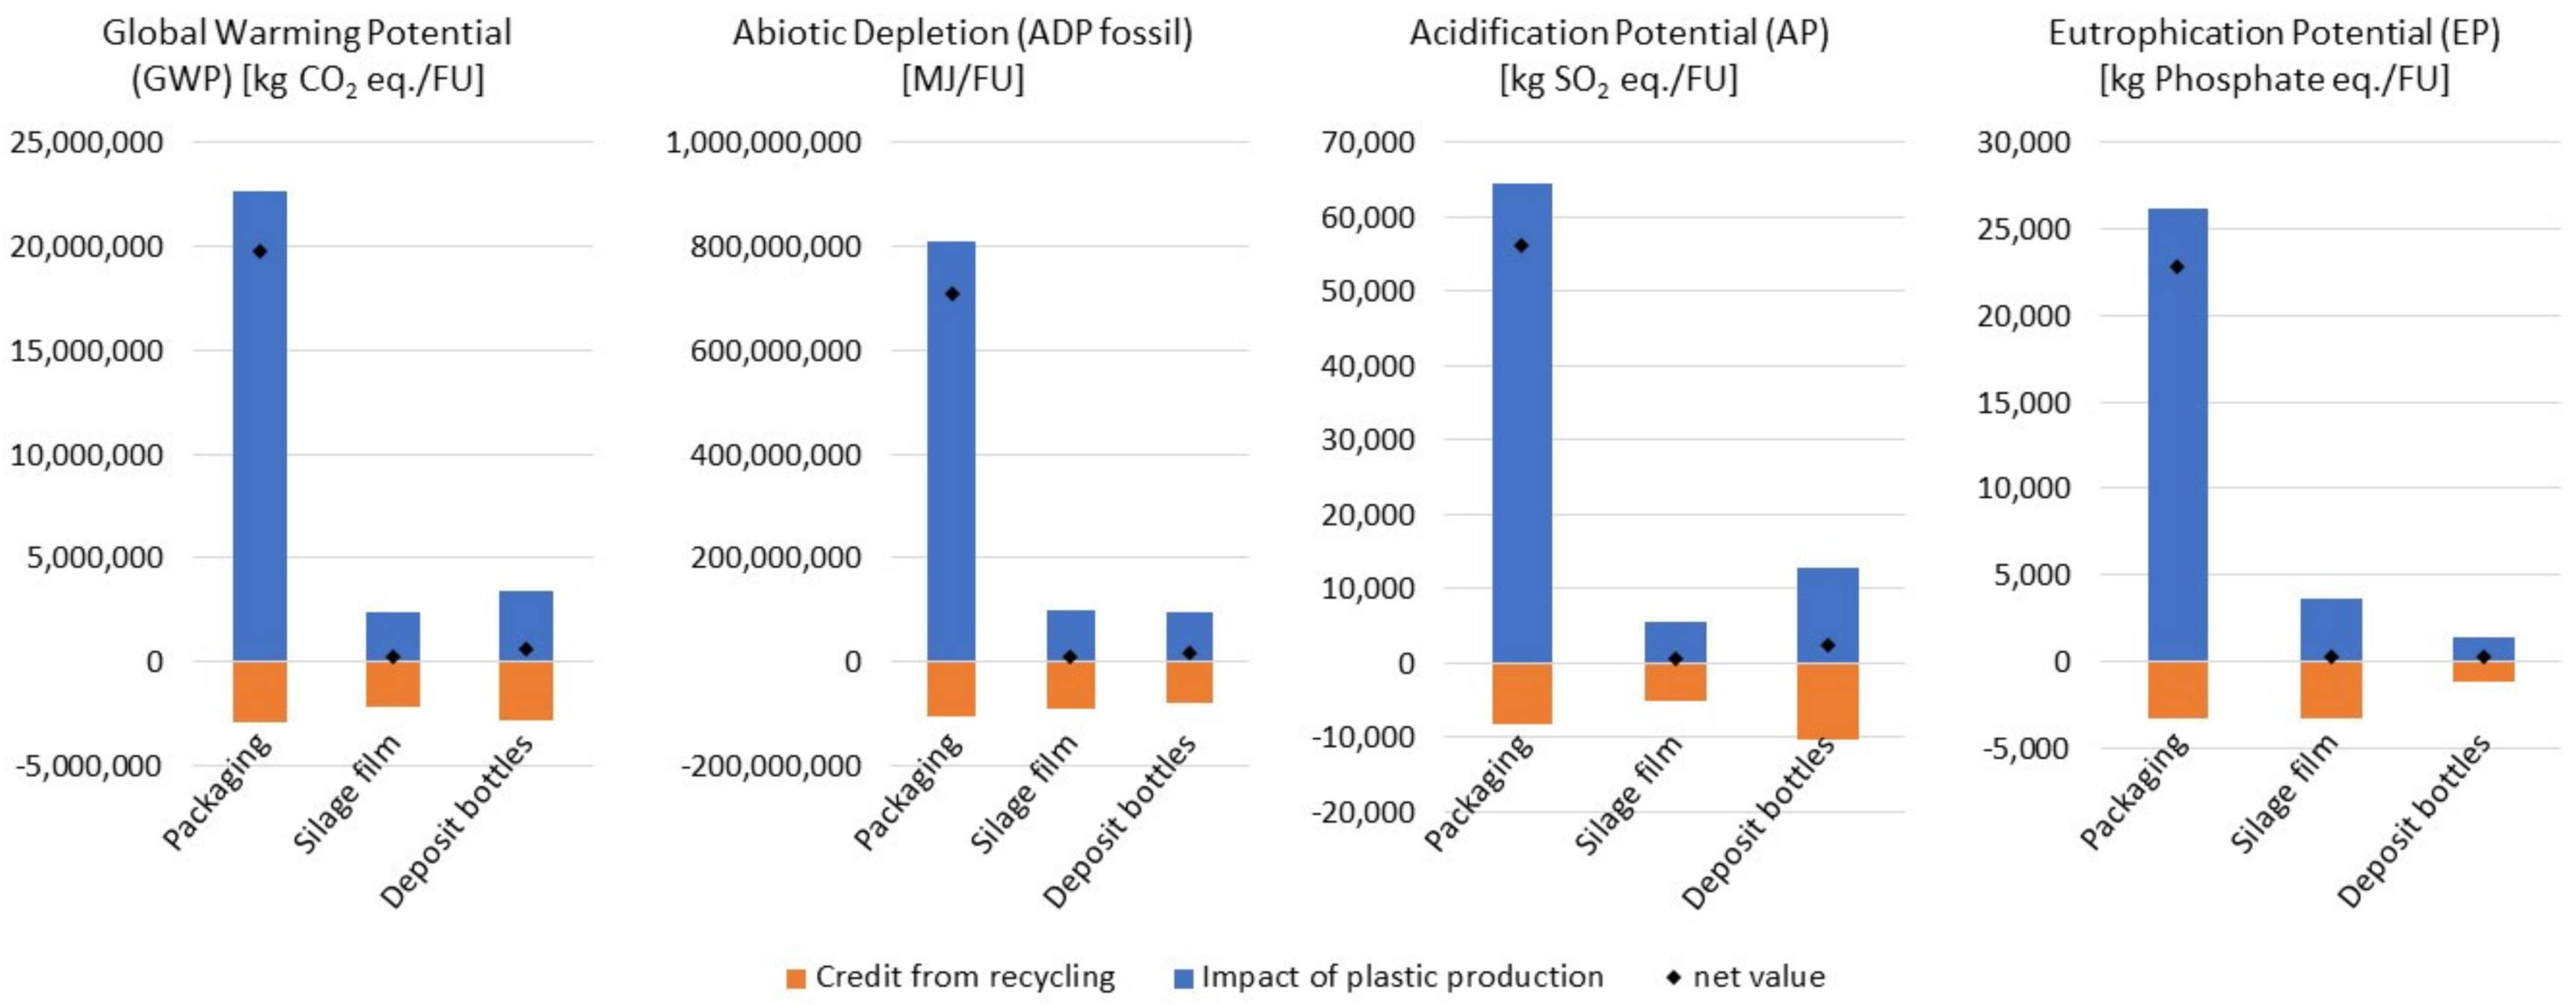
4.1. Plastic Packaging Demand

Based on the available data and the underlying assumptions described in Section 2 (Plastic packaging demand and waste in Iceland) and Section 3 (Data limitations and assumptions of the study), the environmental impacts of the total plastic packaging consumption in Iceland for the year 2020 for plastic packaging, silage film, and deposit bottles are shown in Figure 4. Moreover, the environmental impact of each application is calculated based on the composition of the plastic mix, as shown in supplementary information SI-3. These LCA results, however, neither take the transportation to Iceland nor the impacts of processing these plastic types into account.
The results in Figure 4 show the overall consumption in Iceland for the year 2020 and the contribution of the different plastic types used. It is noteworthy that, depending on the impact categories, the plastic types have different shares of the overall impact. According to the European average (see supplementary information SI-3), polyethylene (LDPE, LLDPE, and HDPE), polypropylene (PP), and polyethylene terephthalate (PET) constitute the highest share of the plastic packaging mix, which is why they make a considerably higher contribution to the environmental impacts in comparison to other plastics.
For the global warming potential (GWP), 2.85 × 10⁷ kg CO2 eq. (total emissions from packaging, silage film, and deposit bottles) is caused by plastic packaging consumption in Iceland for the year 2020. This means that the plastic packaging consumption per capita emits almost 80 kg CO2 eq. To put it in context with the average annual consumption-based carbon footprint of Icelandic households, which is 10.4 t CO2 eq/capita [35], plastic packaging makes up a share of 0.8% of total greenhouse gas emissions per capita in Iceland.

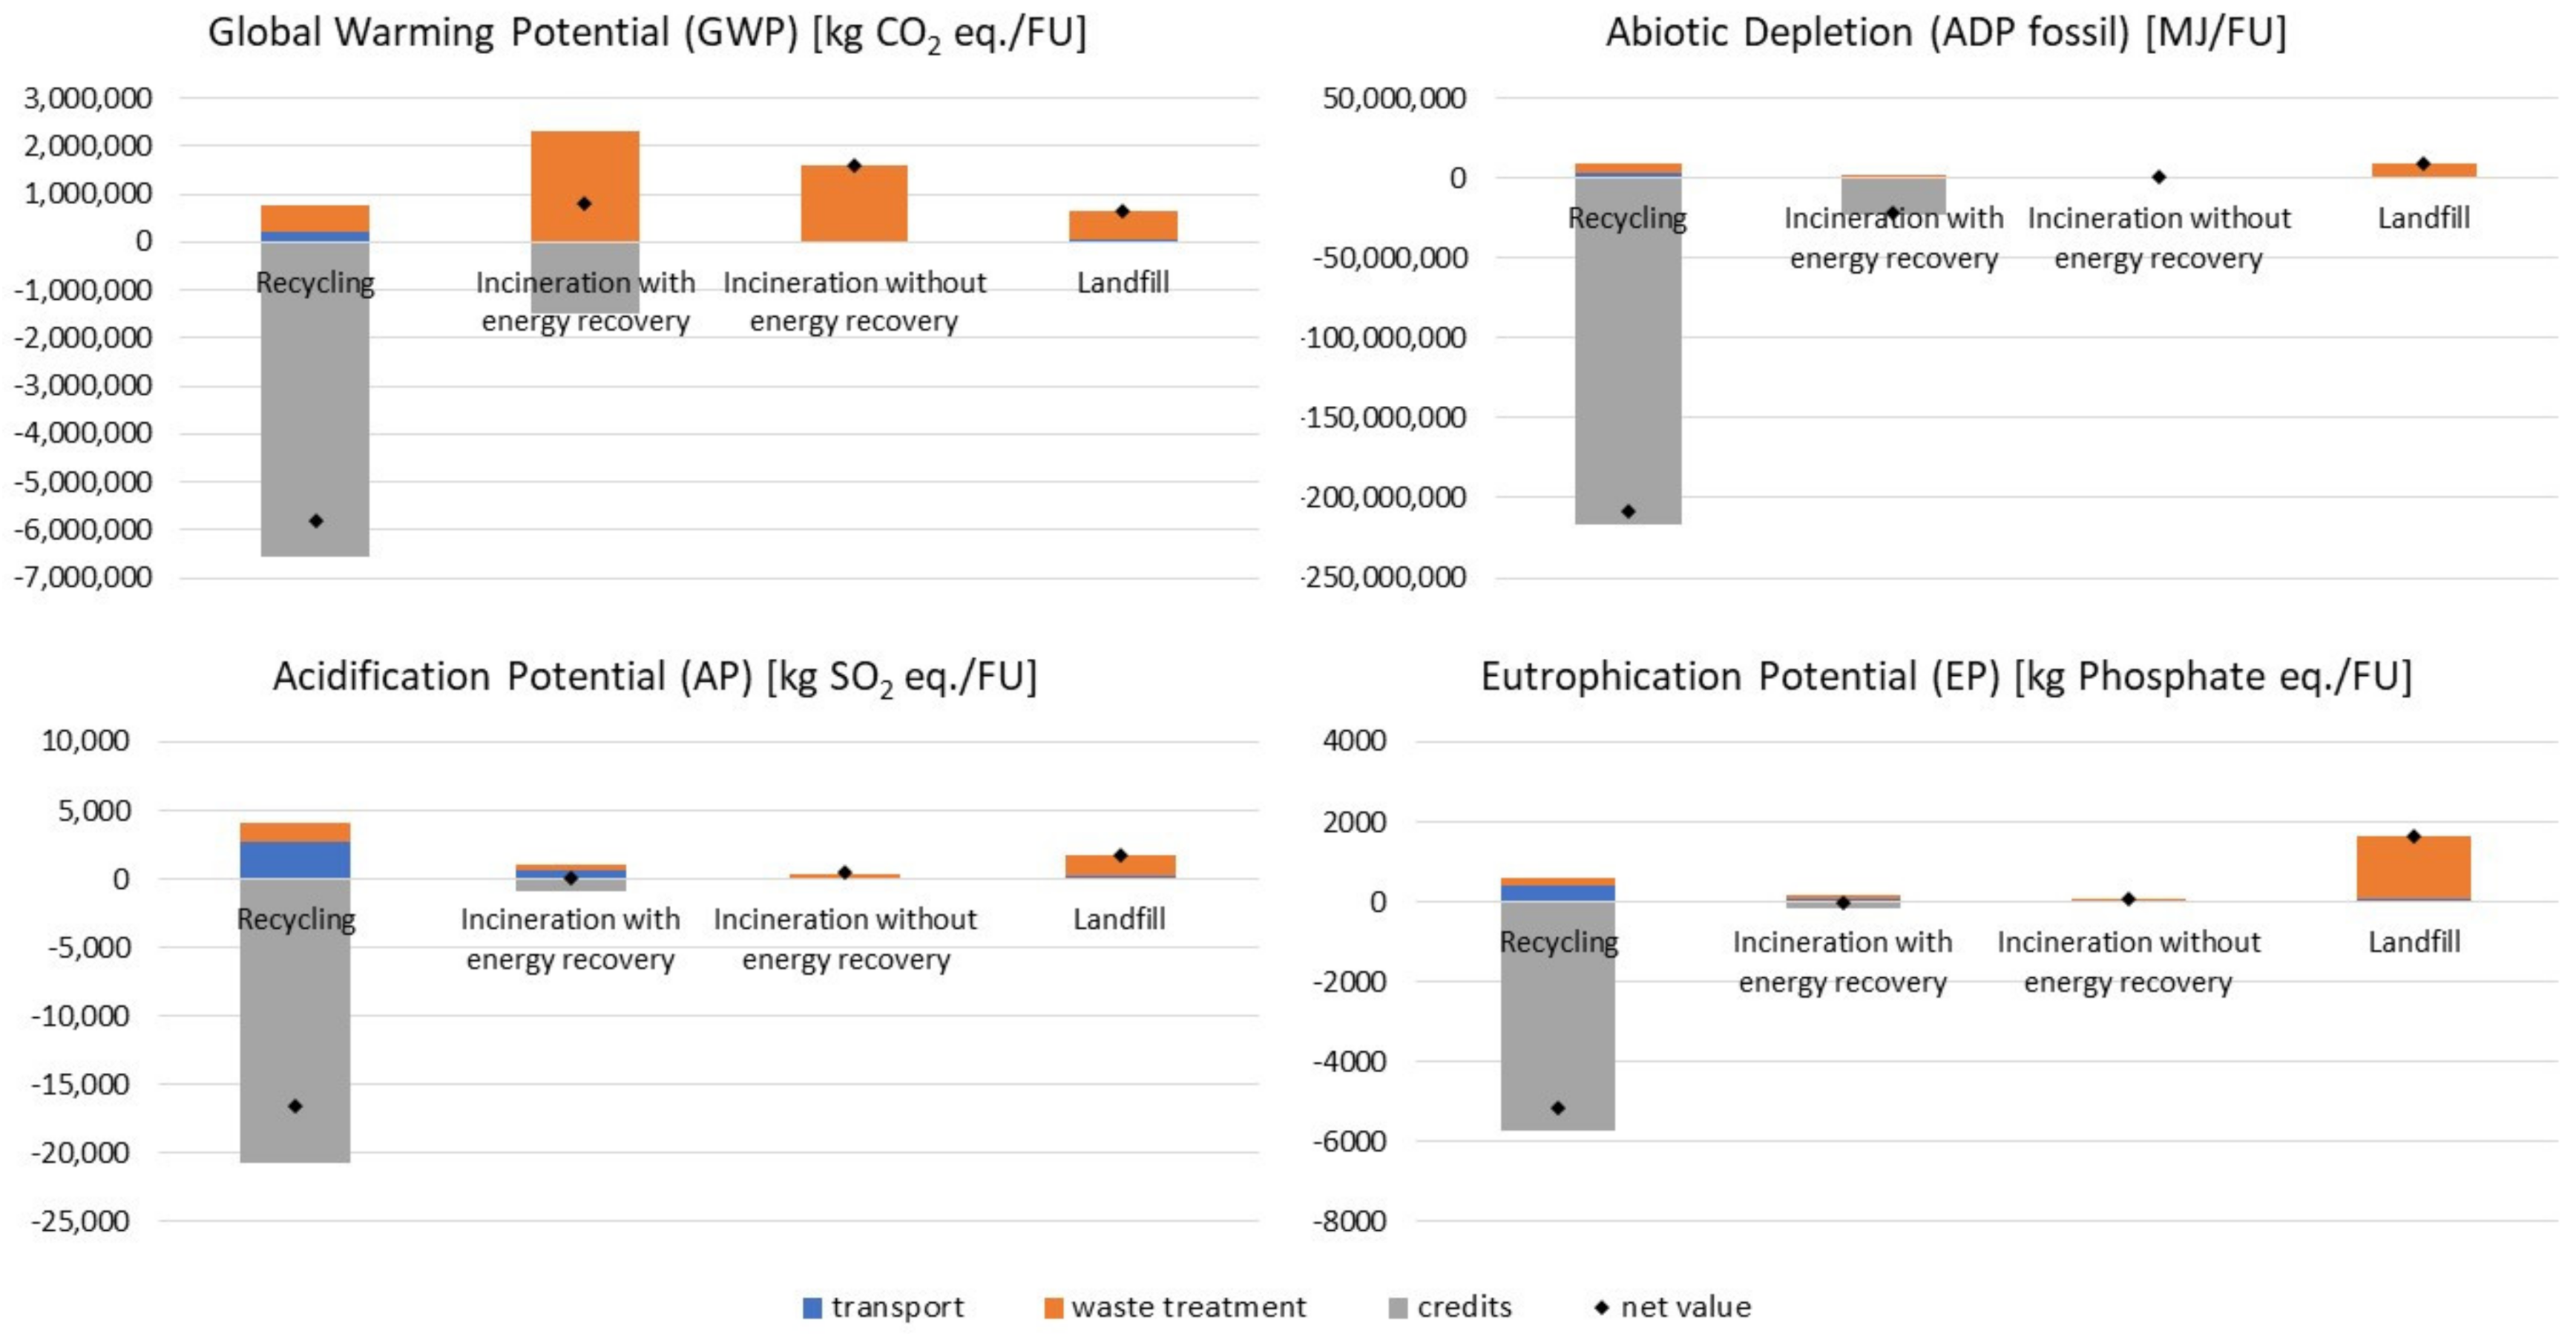
4.2. Plastic Packaging Waste

Iceland’s waste management for plastic packaging was assessed for the year 2020. Based on the available data and the assumptions described in Section 2 and Section 3, the environmental impacts of treating a ton of plastic waste from Iceland by different end-of-life options (recycling, incineration, and landfilling) were calculated. These results consider the average percentage distribution of end-of-life options in Iceland, Sweden, the Netherlands, Germany, Poland, and Denmark for the years 2020 and 2021 (see Table 1) and were obtained with the help of the country-specific LCI datasets for different end-of-life options. The results for the waste treatment of one ton of Iceland’s plastic packaging are provided in the supplementary information SI-7. The results (net values) for one ton of plastic waste show that the impacts of recycling are lower compared with all other end-of-life options across the different impact indicators due to the credits that are associated with mechanical recycling, where the primary material is replaced by a secondary material, reducing the need for the production of the primary material and hence the overall environmental impacts.
For the impact indicator GWP, incineration has the highest impact due to the emissions occurring during the combustion process, based on the chemical structure of the plastics. For the impact indicator AP, landfill and incineration without energy recovery have the highest impacts since there are no associated credits. Additionally, for the impact indicator EP, landfill has the highest impact compared with other end-of-life options, mainly due to leachate from the landfills, which pollutes the water bodies and soil. Similarly, for the impact indicator ADP, landfill has the highest impact caused by the resources used in the production of plastics that are not recovered from landfill, which results in the depletion of fossil resources. The transportation of waste did not contribute much to the total impacts across different impact indicators (see supplementary information SI-7).
Based on the calculated environmental impacts per ton of plastic waste, the total impacts for the functional unit (amount of annual plastic packaging waste for the reference year 2020) can be determined. The results of the environmental impacts based on the functional unit of plastic packaging waste in 2020 are shown in Figure 5.
Figure 5. Impacts and credits for plastic packaging waste treatment in Iceland for the year 2020 (GWP, ADP, AP, and EP).
Sustainability 14 16837 g005
For GWP, it can be seen in Figure 5 that incineration without energy recovery has the highest impact on the net value, followed by incineration with energy recovery, and then mechanical recycling (which has a negative value because the credits associated with recycling in substituting the virgin material are more than the impacts of the recycling and transportation of the waste). For AP, landfill has the highest impact among the end-of-life options, followed by incineration without energy recovery, incineration with energy recovery, and finally, mechanical recycling. Impacts from transportation play a significant role in the total AP for plastic packaging that is sent for recycling to different parts of Europe. However, the generation of leachates during landfill is a major reason why the AP of landfills is higher compared with other end-of-life options, as leachates have the potential to pollute water bodies and soil when plastic waste is disposed of in landfills. This is why the EP of the landfill is the highest among the end-of-life options used for treating plastic waste from Iceland. In addition, for the impact indicator ADP, landfill has the highest impact in comparison to other end-of-life options due to the lack of resource recovery from plastic waste in landfills. The environmental impacts of treating plastic packaging waste using different EoL options in Iceland are in alignment with the results from previously conducted LCA studies [36,37,38,39,40]. A direct comparison of the results between these studies is not possible owing to different aspects such as geographical location, waste composition, data quality, different choices of process for the EoL options, technological level, and reference period. However, when analyzing the results of this study against other studies, it can still be seen that the choice of EoL option that maximizes the recovery and recycling of plastic waste improves the environmental impacts across the various impact indicators.

5. Interpretation

Based on the impact assessment results, the significance of certain parameters and the uncertainty of some of the data assumptions are addressed in the form of scenario and sensitivity analysis.

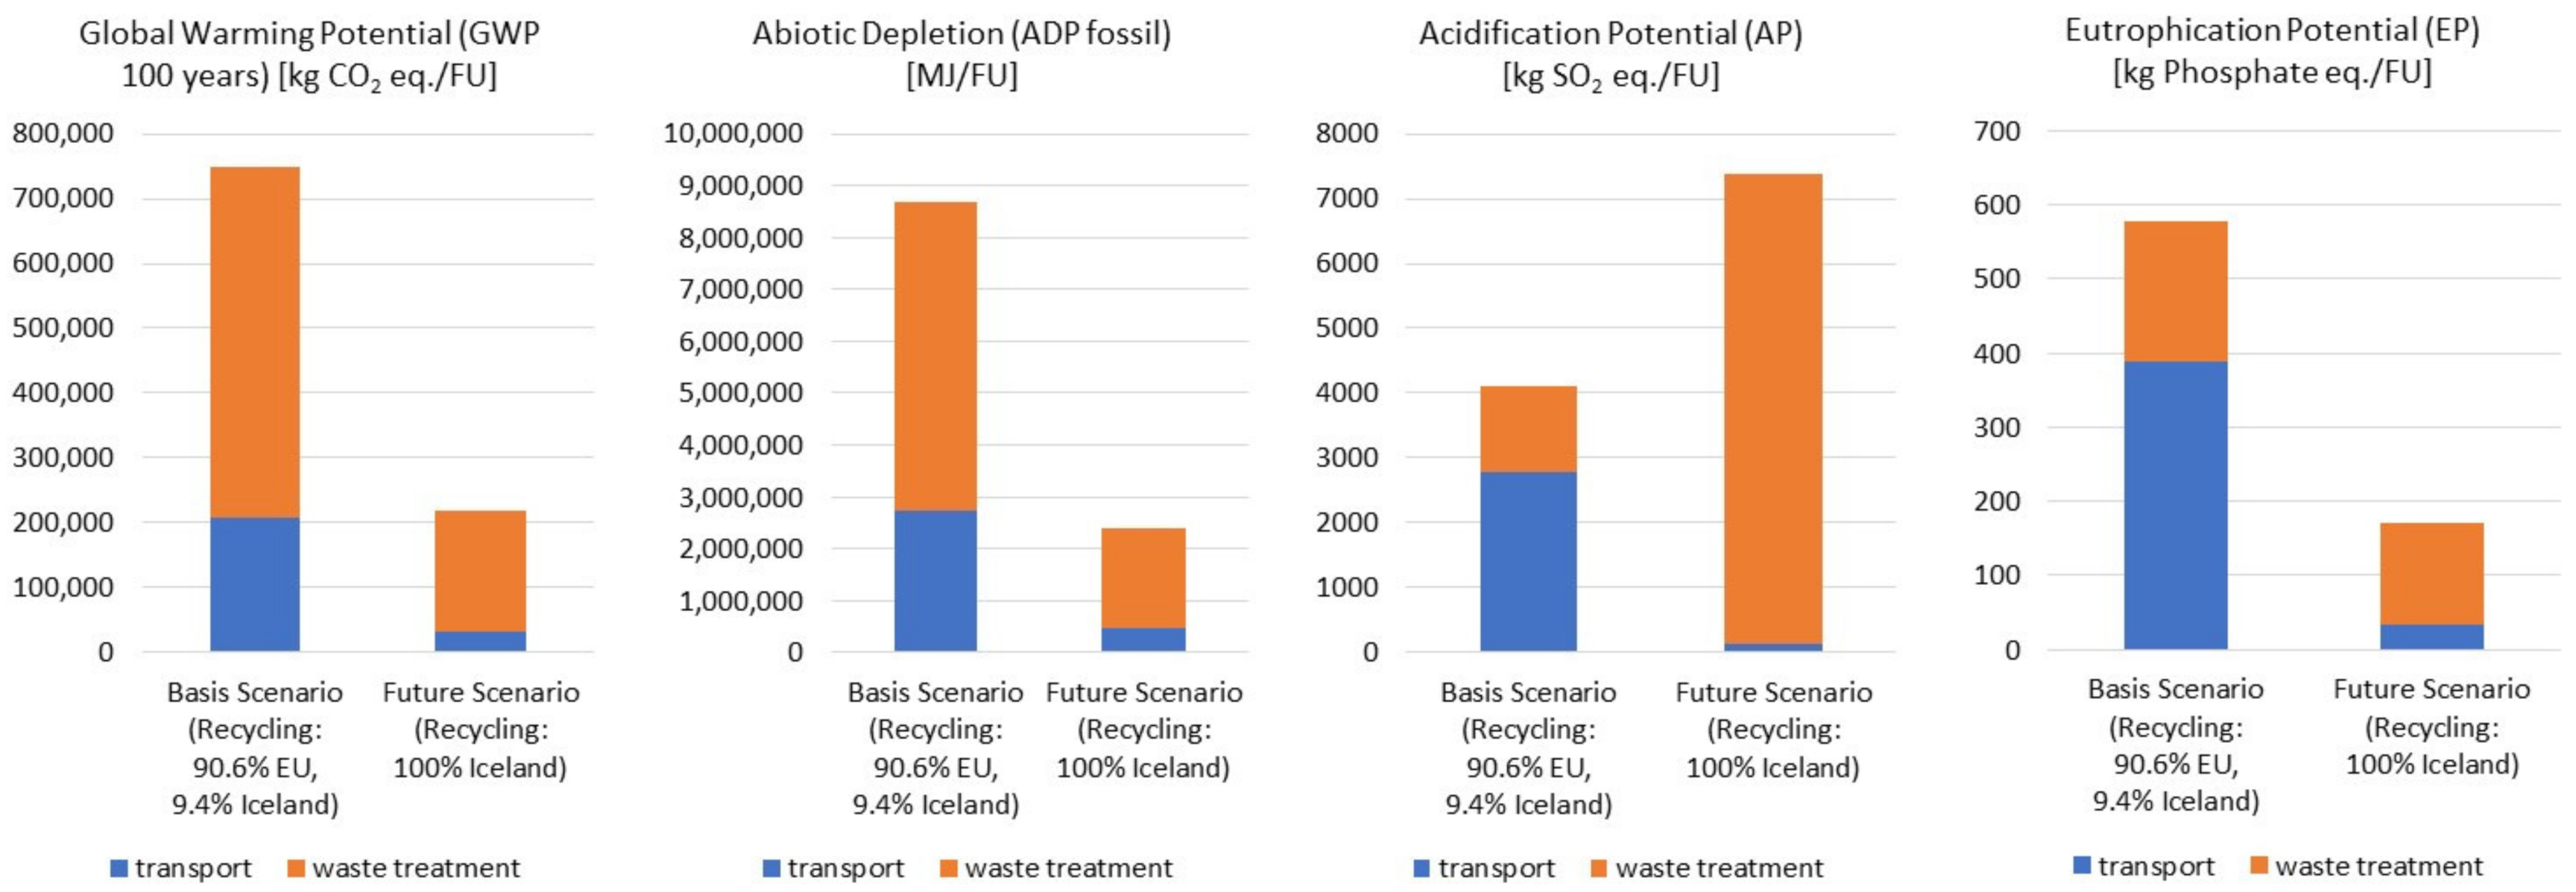
5.1. Scenario Analysis

5.1.1. Differences in Geographical Destinations of Recyclable Plastic Packaging in 2020 and 2021

Uncertainties arise between 2020 and 2021 due to fluctuations in the exports of recyclable plastic packaging waste to different European countries, caused by the COVID-19 pandemic (see Table 1). Therefore, the average values are used in the basic scenario. However, a closer analysis of the electricity mixes of the various countries (see supplementary information SI-6) reveals that the environmental impacts of the recycling or incineration processes can also differ. For that reason, an additional scenario analysis for both 2020 and 2021 was carried out, in order to determine the influence of electricity mixes on the total impacts. The results are given in the supplementary information SI-8.
Since most of the plastic packaging waste sent for recycling is actually recyclable (see Figure 2), it makes sense from an environmental perspective to recycle plastic waste in countries with a more environmentally friendly electricity mix. Nevertheless, the impact of waste treatment for recycling is comparatively low in contrast to other end-of-life options. Landfilling and incineration without energy recovery, however, account for a small share in terms of volume. An important aspect to consider is that depending on the country, the values for incineration with energy recovery can vary considerably due to the variable credits. In contrast to recycling, it makes sense to recover energy from the incineration of non-recyclable plastic waste in countries that have a lower percentage of renewable energy to replace fossil energy resources. However, it should be emphasized that depending on the end-of-life option, the choice of country for waste treatment can have a decisive influence.

5.1.2. Recycling in Iceland

When comparing the electricity mixes of different countries, it is noteworthy that Iceland has significantly lower environmental impacts in most impact categories due to the dominant share of renewable energy resources (except acidification potential) compared with the average European electricity mix. In general, energy-intensive processes could therefore be carried out in Iceland in a much more environmentally friendly way than in other European countries. At present, however, Iceland recycles only a small proportion of its own plastic waste. To determine the potential that would arise if Iceland recycled its own plastic packaging waste, a scenario analysis was conducted to assess the potential environmental benefits. This exercise is not intended to represent a real scenario but to assess the potential environmental benefits of building the infrastructure required for increased domestic recycling in Iceland.
The assumption for this scenario is that all plastic waste that is currently sent to other countries for recycling is recycled in Iceland. Excluded from the assessment is plastic waste that is currently incinerated or landfilled in Iceland or other countries. The idea behind this scenario is to assess the potential environmental benefits of domestic recycling, including the reduction in impacts related to the current transporting of plastic packaging waste abroad, and impacts from recycling related to energy usage in the different destination countries. Additionally, given the fact that Iceland’s electricity mix is composed mostly of hydropower (73%) and geothermal power (26%) [26], it would be interesting to see the trade-offs in recycling when conducted in Iceland due to their use of electricity from renewable energy sources, compared with that of the recycling and electricity mixes of other countries with less green energy usage. The LCA results for recycling plastic waste in Iceland are then compared against the LCA results for transporting and recycling plastic waste in different European countries, without taking other end-of-life options into account. The credits for substituting the virgin material were not considered as it was assumed that the number of credits was the same for both scenarios. The results are shown below for the impact indicators GWP, AP, EP, and ADP (Figure 6).
Figure 6 shows a significant decrease in the GWP, ADP, and EP of treating plastic waste by recycling when carried out in Iceland compared with the European average. Moreover, the transportation of waste by ship to Europe (basis scenario) is avoided in this scenario and involves only inland truck transport. This shows a noticeable difference in the results for the selected impact categories.
The environmental benefits in GWP arise from Iceland’s electricity mix substitutes, compared with the average European electricity mix, which has a higher share of fossil energy resources. This also affects the indicator ADP (fossil) since the use of fossil fuels is avoided. Additionally, the indicator EP shows potential benefits when the recycling of plastic waste is fully conducted in Iceland due to the reduction in transport and the use of the Icelandic energy mix for recycling processes. On the other hand, in the case of AP, as shown in Figure 6, the acidification potential of recycling in Iceland is worse than that of the basic scenario, which is most likely due to the hydrogen sulfide (H2S) emissions (along with CO2 and nitrogen) in the non-condensable gas stream from the turbine exhaust during the generation of geothermal energy caused by the usage of the Icelandic electricity mix [41,42].

5.1.3. Combining the Results of the Impact on Plastic Demand in Iceland and the Substitution Credits of Current Recycling Rates

It is noteworthy that due to the high recycling rate of silage film and deposit bottles, recycling credits almost even out the impacts related to the production of virgin material. Plastic packaging, on the other hand, due to its low recycling rate, shows a large potential for improved waste handling, which would lead to a reduction in the overall impacts of general plastic packaging in Iceland. The results are provided in Figure 7.
Figure 7 clearly shows that there is untapped potential for the better recycling of packaging waste, especially in the sector of plastic packaging from households (see Section 3). While silage film and deposit bottles have high recycling rates, only 14.1% of packaging is recycled.

5.2. Sensitivity Analysis

To understand the significance and uncertainty of certain assumptions that are made for obtaining the inventory data for LCA, a sensitivity analysis was performed. In a sensitivity analysis, the values of these uncertain data assumptions are increased/decreased over a range to understand their significance on the total environmental impacts of the system under study. Based on the impact assessment results, two inventory data assumptions were considered for the sensitivity analysis and they are discussed below.

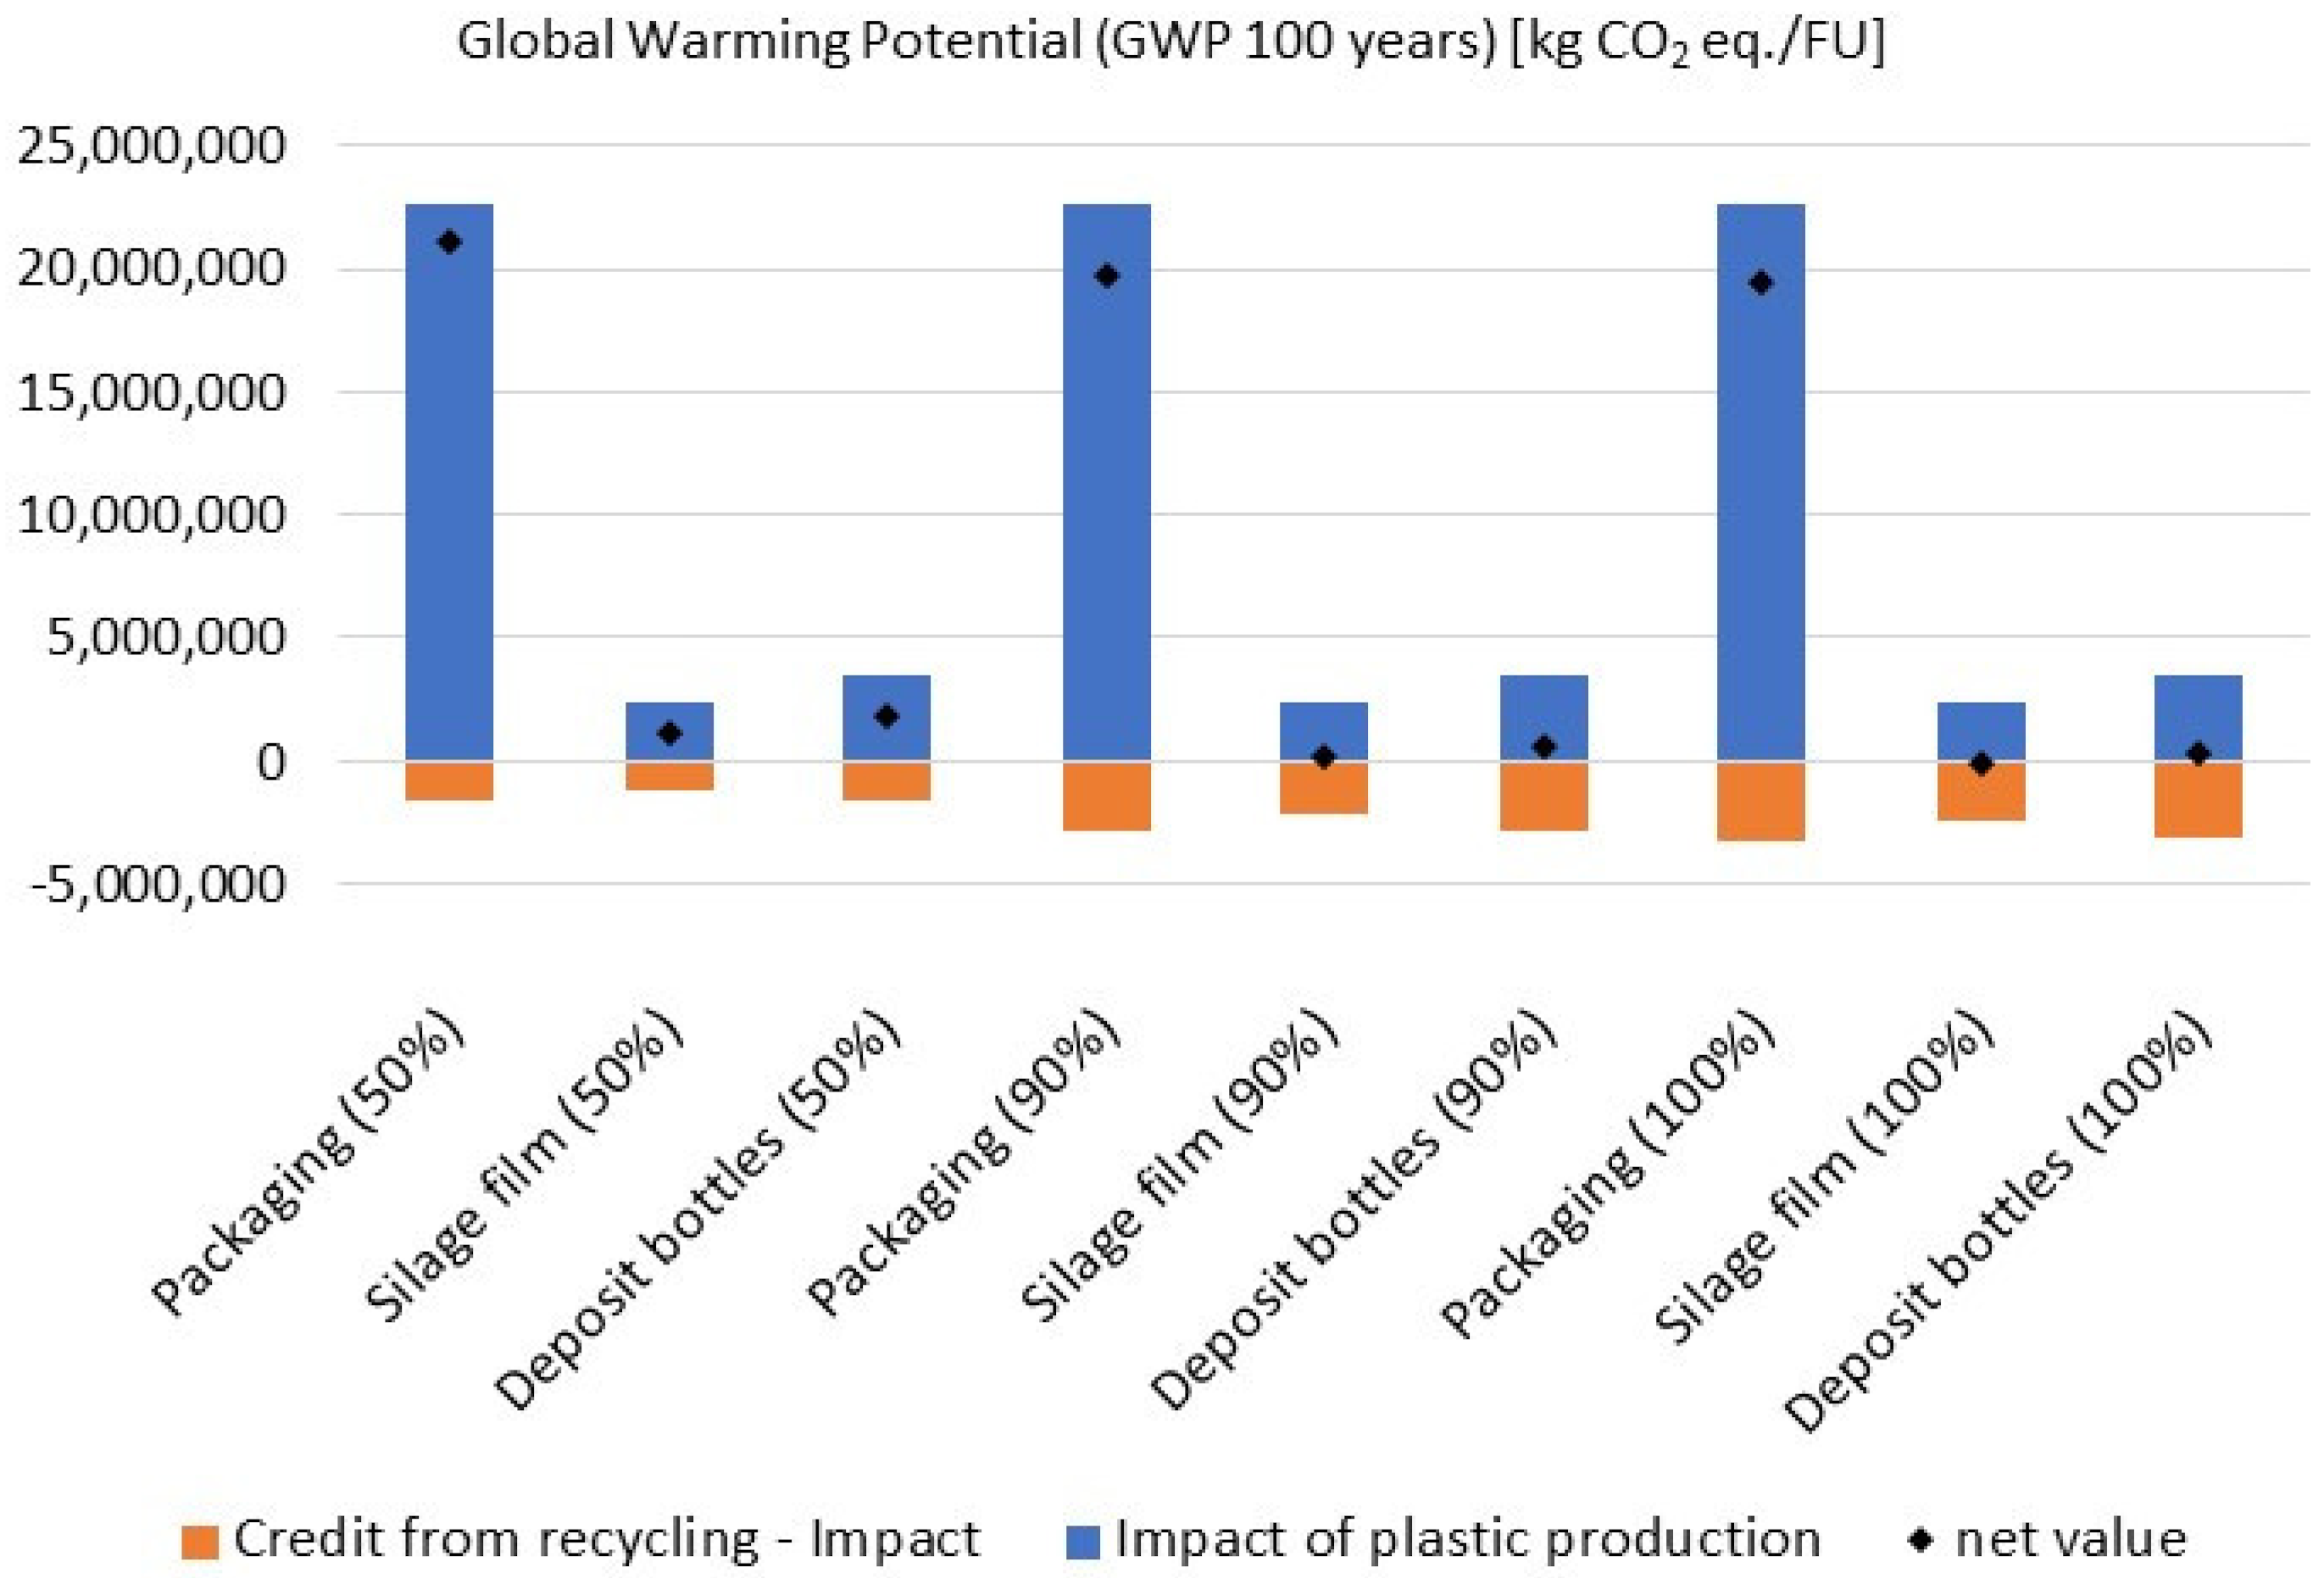
5.2.1. Substitution Potential of Recycled Plastics

For the scenario of combining the results of the impact on plastic demand in Iceland and the substitution credits of current recycling rates, it was assumed that the potential credits for using recycled plastic are assumed to not differ between geographical locations. Moreover, the substitution potential (potential credit) of the recycled plastic replacing the virgin plastic was assumed to be 90% no matter where the plastic wastes are treated and recycled. This means, every kg of recycled plastics can replace the need to produce 900 g of virgin plastics when they are substituted by it. Therefore, the GWP of replacing the virgin plastics with the recycled plastics reduced from 2.85 × 10⁷ kg CO2 eq. (total emissions caused by plastic packaging consumption in Iceland for the year 2020) to 2.06 × 10⁷ kg CO2 eq./FU (see Figure 7), which is almost a 28% decrease in the total impacts of the plastic packaging consumption in Iceland.
However, in reality there exists different influencing factors such as quality specifications, mechanical properties, and applications and availability that determine the substitution of the recycled plastics. In this sensitivity analysis, the substitution potential of the recycled plastics that are produced out of the plastic wastes generated in Iceland are changed to 50% and 100% (substitutes the need for virgin plastics 1:1) from the original assumption of 90%. Based on the results from Figure 7 (substitution potential of 90%), the change in the impacts of it due to the change in the substitution potential is studied in this sensitivity analysis and changes in GWP are shown below in Figure 8. The results of other indicators for this sensitivity analysis are shown in SI-10 and SI-11.
Figure 8 demonstrates that there is a 17% increase in the total GWP (total refers to the sum of the GWP of packaging, silage film, and deposit bottles) when the substitution potential of the recycled plastics decreases from 90% to 50% resulting in the total GWP increasing from 2.06 × 10⁷ kg CO2 eq./FU to 2.41 × 10⁷ kg CO2 eq./FU.

5.2.2. Transportation Distance of Plastic Wastes

The transportation distance of sending the plastic wastes from Iceland to the recycling facilities in Europe are calculated with the help of EcoTransIT [28]. However, it was assumed that the truck transport distances from the collection facilities to the port in Iceland and then receiving the wastes from the port to the recycling facilities in different countries in Europe are 100 km for the basis scenario. However, in reality it could be different owing to several factors such as availability of recycling infrastructure, logistics, and costs. Therefore, the truck distances for some countries are changed according to the geographical location. For this sensitivity analysis, the truck distances for the transportation of wastes from Iceland to countries such as Germany, Sweden, and Poland are assumed to be 500 km and distances from Iceland to countries such as Netherlands and Denmark are assumed to be 200 km. However, for the transportation of wastes that are treated in Iceland, it is still kept at a constant value of 100 km. Based on the quantity of wastes that are transported to other countries from Iceland and how they are treated in these countries (see SI-13), the environmental impacts involved in the recycling of the plastic wastes were calculated.
The percentage increases in the environmental impacts of treating the plastic wastes (wastes that are sent to Europe for treatment + wastes that remain in Iceland and treated) when there is a change in the truck transport distance across some impact indicators are shown in Table 3. The results of other impact indicators are shown in SI-15. The base scenario of the transport distance and the change in distances for the sensitivity analysis are shown in SI-12 and SI-14. From Table 3, it can be seen that there is at least a 1% increase in the total impacts of treating the plastic wastes when there is a change in the transportation distance of plastic wastes to different countries in Europe. Even though the percentage change in the environmental impacts of only the transportation between the two cases ranges from 25–86%, the percentage change in the total impacts (net value in Table 3) ranges from 1–4% across different impact indicators. For this calculation, the substitution potential for replacing virgin with the recycled plastics is assumed to be 90% and the impacts from the waste treatment and credits are the same for both the cases.

6. Conclusions

The potential environmental impacts of plastic packaging waste in Iceland and the further potential for reduction are estimated in this study, which is the first of its kind carried out in Iceland.
The results show that 0.8% of total greenhouse gas emissions per capita in Iceland come from plastic packaging demand. Moreover, recycling rates for plastic packaging are low, at only 14.2%. Therefore, there is a long way to go for Iceland to reach the European target of an overall recycling rate for plastic waste of 50% by 2025, 55% by 2030, and 60% by 2035 [43]. The results also show that Iceland must improve its waste collection and waste management. While the recycling rate is low, the results of this study show the environmental benefits of waste recycling. Scenario analysis demonstrates that when choosing the geographical destinations of recyclable plastic, there is a strong need to differentiate between geographical locations that are feasible for recycling plastics, and where other recovery options are applied. Recycling should take place in countries that rely on green energy sources, such as Sweden, Denmark, and Iceland. Incineration with energy recovery should take place in countries where energy production is based on the burning of fossil fuels such as oil and coal, which will reduce the dependency on fossil fuels. The results of this study show that there is room for improvement when it comes to managing plastic packaging waste in a more environmentally sustainable way. From the sensitivity analysis, it can be seen that factors such as the quality of recycled plastic, substitution potential of recycled plastic, transportation route, distance, and choice of location where the plastic wastes are recycled play an important role in the safe treatment of plastic wastes in a region/city/country. In general, notable improvements to increase the recycling rate can be made through better waste collection and sorting [44,45], and thus less disposal of waste (landfilling and incineration without energy recovery).
The limitations of this study are primarily related to the accuracy of the data reported to the relevant authorities, and the lack of data in certain areas, for example, plastic packaging composition. Data accuracy is a general challenge when relying on official statistics, but in the case of this study, the authors worked on minimizing data uncertainty by collaborating with key staff from the relevant authorities. Plastic packaging composition affects the LCA results in the recycling part of the assessment. It was assumed, however, that the plastic packaging composition does not vary heavily from that in Europe, as most imports come from there. Due to these facts, the results do contain unavoidable uncertainty given the current available data.
The uncertainty of our results is due to limited data accuracy. This highlights the importance of good data collection, especially for the composition of plastic types consumed in Iceland. To meet this challenge, which is not only related to plastic waste data, initiatives are being implemented to improve the overall waste data infrastructure. This aim forms part of the implementation of the EU directive 2018/852 on packaging and packaging waste [43]. Good data collection is the key to being able to conduct studies such as this one, laying an essential foundation for LCAs to guide future waste management in the right direction, towards reducing the impacts of goods. This is demonstrated in this study, which shows that the circular economy of household plastic packaging must be improved. Only 49.1% of the collected and pre-sorted packaging waste sent to Europe for recycling is actually recycled. This is despite the fact that household plastics are by law [43] separately collected, a law intended to increase recycling and reduce the landfilling of mixed household waste. There is huge potential for improvement, which will pave the way towards future research needs and recommendations.
The focus of future research on the circular economy is on recycling as the preferable end-of-life option in comparison to incineration and landfilling. This is supported by our results, but also shows that more targeted waste management, especially for end-of-life options, needs to be applied. In the context of Iceland, more in-depth research is needed, to further assess both the environmental and economic feasibility of increasing recycling in Iceland. The current results show reduced environmental impacts due to both shorter transport journeys and a higher share of renewable energy composition in the Icelandic energy mix. This option of increased recycling in Iceland is therefore worth further investigation, at all levels of society, especially from an economic perspective. The economic dimension also has to be assessed, in order to estimate the economy of size of such local infrastructure. In the case of Iceland, the recycling of plastic waste overseas results in additional environmental impacts due to transport, but how that affects the economics of plastic recycling is unknown, as that did not fall within the scope of this study.
The geographical location of this paper is Iceland, a rich country in the North Atlantic that relies heavily on imports, making plastic packaging an essential part of the daily lives of its residents. The focus has been on end-of-line measures, but it must be said that the most effective way to reduce the impacts of waste is to reduce the amount of waste, both locally and globally. Although reducing waste should be the first priority, we simultaneously need to handle our waste better, as demonstrated here. This study focuses on targeted waste management for countries that rely on the transporting and disposing of recyclable materials in other countries due to a lack of infrastructure or lower number of inhabitants.
Even though the current study is the first of its kind to assess the environmental impacts of plastic waste streams in Iceland, further studies involving other waste streams such as glass, cardboard, and other containers need to be conducted in the future. Only a holistic approach promises to identify the relevant environmental impacts of Icelandic waste management, especially when looking at environmental impacts beyond global warming potential. This study paves the way towards feasibly increasing the recycling share in Iceland, thereby contributing positively to the circular economy and sustainable development.

Supplementary Materials

The following supporting information can be downloaded at: https://www.mdpi.com/article/10.3390/su142416837/s1, S1. Data underlying LCA model; S2. Additional results [6,7,10,11,12,20,26,46,47].

Author Contributions

Conceptualization, Ó.Ö., L.S.K., V.V., R.K., H.-J.E. and S.S.; methodology, Ó.Ö., L.S.K., V.V. and S.S.; software, L.S.K.; validation, L.S.K., V.V. and S.S.; formal analysis, Ó.Ö., L.S.K., V.V. and S.S.; investigation, L.S.K., V.V. and S.S.; resources, Ó.Ö., H.-J.E. and S.S.; data curation, Ó.Ö., L.S.K., V.V., R.K. and S.S.; writing—original draft preparation, Ó.Ö., L.S.K., V.V., R.K., H.-J.E. and S.S.; writing—review and editing, Ó.Ö., L.S.K., V.V., R.K., H.-J.E. and S.S.; visualization, L.S.K., V.V. and S.S.; supervision, Ó.Ö. and S.S.; project administration, Ó.Ö. and S.S.; funding acquisition, Ó.Ö., H.-J.E. and S.S. All authors have read and agreed to the published version of the manuscript.

Funding

This research received funding from The University of Iceland Research Fund and Matvælasjóður (Food development fund) for the project UMMAT (2021–2022).

Acknowledgments

We want to acknowledge the collaboration with the Icelandic Environment Agency and their contribution to this study. We would also like to thank the Icelandic Recycling Fund for their contribution in providing the data laying the foundation for this work. Additionally, we would like to thank the recycling companies who gave us access to where they send the sorted plastics for recycling or disposal. Furthermore, we would like to thank Alois Kaufmann for support with the icon design. Finally, we would like to thank Robin Bähre, Christopher Long, and Shauna Naffah for proofreading the manuscript.

Conflicts of Interest

The authors declare no conflict of interest.

References

  1. Geyer, R.; Jambeck, J.R.; Law, K.L. Production, use, and fate of all plastics ever made. Sci. Adv. 2017, 3, e1700782. [Google Scholar] [CrossRef] [PubMed] [Green Version]
  2. Li, W.C.; Tse, H.F.; Fok, L. Plastic waste in the marine environment: A review of sources, occurrence and effects. Sci. Total Environ. 2016, 566–567, 333–349. [Google Scholar] [CrossRef] [PubMed]
  3. Zheng, J.; Suh, S. Strategies to reduce the global carbon footprint of plastics. Nat. Clim. Chang. 2019, 9, 374–378. [Google Scholar] [CrossRef]
  4. Icelandic Parliament. Lög Nr. 90 7. July 2020 on Household Plastic Applications. 2020. Available online: https://www.althingi.is/altext/stjt/2020.090.html (accessed on 25 July 2021).
  5. European Commission. Directive (EU) 2019/904 of the European Parliament and of the Council of 5 June 2019 on the Reduction of the Impact of Certain Plastic Products on the Environment. 2021. Available online: https://eur-lex.europa.eu/eli/dir/2019/904/oj (accessed on 6 May 2022).
  6. Icelandic Recycling Fund. Plastic Packaging in Iceland 2020. 2022.
  7. Icelandic Recycling Fund. Skýrsla Um Starfsemi Úrvinnslusjóds. 2020. Available online: https://www.Urvinnslusjodur.Is/Media/Arsskyrslur/Starfsskyrsla-2020.Pdf (accessed on 5 May 2022).
  8. Statistics Iceland. The Population on January 1st 2019. 2020. Available online: https://statice.is/publications/news-archive/inhabitants/the-population-on-january-1st-2019/ (accessed on 5 May 2022).
  9. Eurostat. Packaging Waste by Waste Management Operations. Online Data Code: ENV_WASPAC. 2022. Available online: http://appsso.eurostat.ec.europa.eu/nui/show.do?lang=en&dataset=env_waspac (accessed on 25 March 2022).
  10. Environment Agency of Iceland. Plastic Packaging in Iceland 2020. E-Mail Correspondence. 2021. [Google Scholar]
  11. Plastics Europe. Plastic—The Facts 2021. E-Mail Correspondence. 2022. [Google Scholar]
  12. Plastics Europe. Plastics—The Facts 2021 • Plastics Europe. 2022. Available online: https://plasticseurope.org/knowledge-hub/plastics-the-facts-2021/ (accessed on 7 June 2022).
  13. European Commission. Regulation (EC) No 2150/2002 of the European Parliament and of the Council of 25 November 2002 on Waste Statistics. 2002. Available online: https://eur-lex.europa.eu/legal-content/en/ALL/?uri=CELEX%3A32002R2150 (accessed on 27 May 2022).
  14. Statistics Iceland. The population of Iceland on January 1, 2021. 2021. Available online: https://www.statice.is/publications/news-archive/inhabitants/the-population-on-january-1st-2021/ (accessed on 7 May 2022).
  15. Plastics Europe. Quarterly Report Q3/2021. European Plastics Manufacturers (EU 27). 2022. [Google Scholar]
  16. Sarmento, P.; Motta, M.; Scott, I.J.; Pinheiro, F.L.; de Castro Neto, M. Impact of COVID-19 lockdown measures on waste production behavior in Lisbon. Waste Manag. 2022, 138, 189–198. [Google Scholar] [CrossRef] [PubMed]
  17. Fogt Jacobsen, L.; Pedersen, S.; Thøgersen, J. Drivers of and barriers to consumers’ plastic packaging waste avoidance and recycling—A systematic literature review. Waste Manag. 2022, 141, 63–78. [Google Scholar] [CrossRef] [PubMed]
  18. Endurvinnslan. Deposit System in Iceland. 2022. Available online: http://endurvinnslan.is/English/ (accessed on 7 June 2022).
  19. Úrvinnslusjóður. Icelandic Recycling Fund Heyrúlluplast. 2022. Available online: https://www.urvinnslusjodur.is/Voruflokkar/Heyrulluplast/ (accessed on 7 June 2022).
  20. Environment Agency of Iceland. Operation Permit for Handling the Wastes to SORPA. 2020. Available online: https://Ust.Is/Library/Sida/Atvinnulif/Starfsleyfi-Og-Eftirlitsskyrslur/SORPA%20-%20undirrita%c3%b0.Pdf (accessed on 20 July 2022).
  21. DIN EN ISO 14040. Environmental Management—Life Cycle Assessment—Principles and Framework (ISO 14040:2006 + Amd 1:2020). German Version EN ISO 14040:2006 + A1:2020. 2021. Available online: https://www.din.de/de/mitwirken/normenausschuesse/nagus/veroeffentlichungen/wdc-beuth:din21:325953744 (accessed on 4 February 2022).
  22. DIN EN ISO 14044. Environmental Management—Life cycle Assessment—Requirements and Guidelines (ISO 14044:2006 + Amd 1:2017 + Amd 2:2020). German Version EN ISO 14044:2006 + A1:2018 + A2:2020. 2021. Available online: https://www.din.de/de/mitwirken/normenausschuesse/nagus/veroeffentlichungen/wdc-beuth:din21:325953813 (accessed on 4 February 2022).
  23. European Commission; Joint Research Centre; Institute for Environment and Sustainability. International Reference Life Cycle Data System (ILCD) Handbook: General Guide for Life Cycle Assessment Detailed Guidance; Publications Office of the European Union: Luxembourg, 2010. [Google Scholar]
  24. European Commission; Joint Research Centre; Institute for Environment and Sustainability. International Reference Life Cycle Data System (ILCD) Handbook Framework and Requirements for Life Cycle Impact Assessment Models and Indicators; Publications Office of the European Union: Luxembourg, 2010. [Google Scholar]
  25. Sphera. GaBi LCA Software. 2022. Available online: https://gabi.sphera.com/deutsch/index/ (accessed on 24 June 2022).
  26. Sphera. GaBi Data Search. 2022. Available online: https://gabi.sphera.com/Databases/Gabi-Data-Search/ (accessed on 24 June 2022).
  27. Leiden University. CML-IA Characterisation Factors. 2016. Available online: https://www.universiteitleiden.nl/en/research/research-output/science/cml-ia-characterisation-factors (accessed on 14 June 2022).
  28. EcoTransIT World. Emission Calculator for Greenhouse Gases and Exhaust Emissions. 2021. Available online: https://www.ecotransit.org/en/ (accessed on 7 June 2022).
  29. Nessi, S.; Sinkko, T.; Bulgheroni, C.; Garcia-Gutierrez, P.; Giuntoli, J.; Konti, A.; Sanye Mengual, E.; Tonini, D.; Pant, R.; Marelli, L.; et al. Life Cycle Assessment (LCA) of Alternative Feedstocks for Plastics Production; EUR 30725 EN; Publications Office of the European Union: Luxembourg, 2021. [Google Scholar]
  30. Pure North. Plastic Type Silage Film. E-Mail Correspondence. 2022. [Google Scholar]
  31. Scheutz, C.; Kjeld, A.; Fredenslund, A.M. Methane emissions from Icelandic landfills—A comparison between measured and modelled emissions. Waste Manag. 2022, 139, 136–145. [Google Scholar] [CrossRef] [PubMed]
  32. Gulbrsansen, L.K.; Jacob, M. Nordic Costal Clean Up 2017 Report; European Commission: Brussels, Belgium, 2018; Available online: https://publications.jrc.ec.europa.eu/repository/handle/JRC125046 (accessed on 15 November 2022).
  33. de Sadeleer, I.; Aksham, C.; Stensgård, A.E.; Baxter, J. Integration of Plastic Littering in LCA Methodology and Eco-Design Tips for the Avoidance of Littering; Norwegian Institute for Sustainability Research: Kråkerøy, Norway, 2021; Available online: https://norsus.no/wp-content/uploads/OR.08.21.pdf (accessed on 15 November 2022).
  34. Icelandic Recycling Fund. Tollskra. Available online: https://vefskil.tollur.is/Tollalinan/Tav/ (accessed on 5 May 2022).
  35. Clarke, J.; Heinonen, J.; Ottelin, J. Emissions in a decarbonised economy? Global lessons from a carbon footprint analysis of Iceland. J. Clean. Prod. 2017, 166, 1175–1186. [Google Scholar] [CrossRef]
  36. Chen, Y.; Cui, Z.; Cui, X.; Liu, W.; Wang, X.; Li, X.; Li, S. Life cycle assessment of end-of-life treatments of waste plastics in China, Resources. Conserv. Recycl. 2019, 146, 348–357. [Google Scholar] [CrossRef]
  37. Al-Maaded, M.; Madi, N.K.; Kahraman, R.; Hodzic, A.; Ozerkan, N.G. An Overview of Solid Waste Management and Plastic Recycling in Qatar. J. Polym. Environ. 2012, 20, 186–194. [Google Scholar] [CrossRef]
  38. Al-Salem, S.M.; Evangelisti, S.; Lettieri, P. Life cycle assessment of alternative technologies for municipal solid waste and plastic solid waste management in the Greater London area. Chem. Eng. J. 2014, 244, 391–402. [Google Scholar] [CrossRef]
  39. Helmes, R.J.K.; Goglio, P.; Salomoni, S.; van Es, D.S.; Vural Gursel, I.; Aramyan, L. Environmental Impacts of End-of-Life Options of Biobased and Fossil-Based Polyethylene Terephthalate and High-Density Polyethylene Packaging. Sustainability 2022, 14, 11550. [Google Scholar] [CrossRef]
  40. Hou, P.; Xu, Y.; Taiebat, M.; Lastoskie, C.; Miller, S.A.; Xu, M. Life cycle assessment of end-of-life treatments for plastic film waste. J. Clean. Prod. 2018, 201, 1052–1060. [Google Scholar] [CrossRef]
  41. Kristjansdottir, T.; Jonsdottir, H. Life Cycle Analysis of Nesjavellir Geothermal Power Plant. Available online: https://orkustofnun.is/gogn/Orkusjodur/Orkusjodur-58-Life-cycle-analysis-of-Nesjavellir.pdf (accessed on 5 May 2022).
  42. Kristmannsdóttir, H.; Sigurgeirsson, M.; Ármannsson, H.; Hjartarson, H.; Ólafsson, M. Sulfur gas emissions from geothermal power plants in Iceland. Geothermics 2000, 29, 525–538. [Google Scholar] [CrossRef]
  43. European Commission. Directive (EU) 2018/852 of the European Parliament and of the Council of 30 May 2018 Amending Directive 94/62/EC on Packaging and Packaging Waste (Text with EEA Relevance). 2022. Available online: https://eur-lex.europa.eu/legal-content/EN/TXT/?uri=celex:32018L0852 (accessed on 13 June 2022).
  44. Antonopoulos, I.; Faraca, G.; Tonini, D. Recycling of post-consumer plastic packaging waste in the EU: Recovery rates, material flows, and barriers. Waste Manag. 2021, 126, 694–705. [Google Scholar] [CrossRef] [PubMed]
  45. Tallentire, C.W.; Steubing, B. The environmental benefits of improving packaging waste collection in Europe. Waste Manag. 2020, 103, 426–436. [Google Scholar] [CrossRef] [PubMed]
  46. Raghab, S.M.; Abd El Meguid, A.M.; Hegazi, H.A. Treatment of Leachate from Municipal Solid Waste Landfill. HBRC J. 2013, 9, 187–192. [Google Scholar] [CrossRef]
  47. Plastics Europe Eco-Profiles and Environmental Declarations of the European Plastics Manufacturers, Version 3.0. 2019. Available online: https://www.plasticseurope.org/en/resources/eco-profiles (accessed on 6 May 2022).
Figure 1. Collected plastic packaging waste in Iceland during 2020 (tons) based on data from the Icelandic Recycling Fund [7].
Sustainability 14 16837 g001
Figure 2. Waste streams of plastic packaging in Iceland in 2020 (in tons) based on data from the Icelandic Recycling Fund [6,7] (see supplementary information SI-1). * Not collected, remains in Iceland (end-of-life treatment unknown). Disposed plastic packaging is mainly landfilled as mixed household waste (often called municipal solid waste (MSW)) or incinerated without energy recovery. Moreover, littering or remaining in usage are possible reasons [6]. ** A total of 7.6% of disposed plastic is incinerated without energy recovery in Iceland. The rest is assumed to be landfilled as mixed household waste [6]. *** Out of scope: not packaging (other plastic waste, which ends up in plastic containers but is not refundable by the IRF). **** Out of scope: water and dirt accumulates in the silage film during use.
Sustainability 14 16837 g002
Figure 3. System boundaries. * Recycled material in Iceland fall within the system boundary and credits are included in the results for recycling shown in Figure 5.
Sustainability 14 16837 g003
Figure 4. Impact of plastic demand in Iceland for 2020 (GWP, ADP, AP, and EP).
Sustainability 14 16837 g004
Figure 6. Impacts per amount of plastic waste recycling in Iceland instead of Europe (GWP, ADP, AP, and EP).
Sustainability 14 16837 g006
Figure 7. Potential credits from recycling (primary material can be replaced by a secondary material).
Sustainability 14 16837 g007
Figure 8. Sensitivity Analysis—global warming potential (GWP) of annual plastic packaging (packaging when replacing virgin plastics with the recycled plastics of different substitution potentials (50%, 90%, and 100%).
Sustainability 14 16837 g008
Table 1. Overview of data, origin, location, and corresponding sources.
Overview of DataOriginGeographical DistributionSources
Plastic packaging demandImporters of goods and local plastic packaging producersWhole IcelandIRF [7]
Plastic waste statistics, including destinations for end-of-life treatmentsWaste handlersWhole IcelandIRF [7]
Plastic compositionUnknown for IcelandEuropean averagePlastics Europe [11,12]
Table 2. Export destinations for end-of-life treatment of Iceland’s plastic packaging waste [6].
Plastic Packaging Waste Sent to20202021Average (2020 and 2022)
Sweden46.4%21.6%34.2%
Netherlands42.2%26.8%34.6%
Germany8.3%25.6%16.8%
Poland0.4%9.2%4.8%
Denmark0.0%0.7%0.3%
Recycled pellets sent to
Great Britain2.3%16.1%9.1%
China0.4%0.0%0.2%
Table 3. Results of sensitivity analysis—change in the truck transportation distance of plastic wastes from Iceland to other countries in Europe and the percentage increase in the impacts compared to basis scenario. Negative sign in the net value refers to the fact that the credits for replacing virgin with the recycled plastic are more than the impacts arising from waste treatment and transport of the wastes.
Impacts Recycling (Basis Scenario)Recycling (Truck Transportation Distance Changed)Percentage Increase
Abiotic Depletion (ADP fossil) (MJ)transport2.73 × 1065.08 × 10686%
waste treatment5.97 × 1065.97 × 106
credits−2.17 × 10⁸−2.17 × 10⁸
net value−2.08 × 10⁸−2.06 × 1081%
Acidification Potential (AP) (kg SO2 eq.)transport2.79 × 1033.4 × 10325%
waste treatment1.32 × 1031.32 × 103
credits−2.06 × 10⁴−2.06 × 10⁴
net value−1.65 × 10⁴−1.58 × 1044%
Eutrophication Potential (EP) (kg Phosphate eq.)transport3.88 × 1025.65 × 10246%
waste treatment1.91 × 1021.91 × 102
credits−5.74 × 10³−5.74 × 10³
net value−5.16 × 10³−4.98 × 1033%
Global Warming Potential (GWP 100 years) (kg CO2 eq.)transport2.09 × 1053.82 × 10583%
waste treatment5.40 × 1055.40 × 105
credits−6.54 × 10⁶−6.54 × 10⁶
net value−5.79 × 10⁶−5.62 × 1063%
Publisher’s Note: MDPI stays neutral with regard to jurisdictional claims in published maps and institutional affiliations.

