Article

Sequence Calculation and Automatic Discrimination of Vehicle Merging Conflicts in Freeway Merging Areas

1
Guangzhou Transport Planning Research Institute Co., Ltd., Guangzhou 510030, China
2
School of Civil Engineering and Transportation, South China University of Technology, Guangzhou 510641, China
*
Author to whom correspondence should be addressed.
Sustainability 2022, 14(24), 16834; https://doi.org/10.3390/su142416834
Submission received: 7 November 2022 / Revised: 2 December 2022 / Accepted: 12 December 2022 / Published: 15 December 2022

Abstract

:
The freeway is a continuous flow facility that improves the accessibility and operational efficiency of the road network. However; freeway merging areas are accident-prone areas. In order to investigate the reasons for the high occurrence of accidents in merging areas, this paper considers the dynamic nature of traffic conflicts, constructs a sequence model of merging conflicts with Time Difference to Collision (TDTC) as the index, and implements automatic identification of merging conflicts based on the LightGBM algorithm. A UAV was used to collect vehicle trajectory data at the Guanghe Freeway in Guangzhou to verify the accuracy of automatic identification, with an accuracy rate of 91%. The results show that the most important feature of severe conflicts is the choice of the merging position. In addition, the most important feature of general conflicts is the standard deviation of speed before merging. Lastly, the most important feature of minor conflicts is the longitudinal speed difference between the ramp and mainline vehicles.

1. Introduction

In recent years the transportation industry has continued to develop, and the related trade industry has progressed with it. Transportation and its related industries have become an important basis for the development of the wider national economy in which freeways play an important role. Studies have shown that about three quarters of traffic accidents on freeways are related to frequent track crossings within merging areas [1]. Therefore, the operational quality of merging areas affects the operational efficiency and safety of freeways.
There are many factors that affect the operational quality of freeway merging areas. Early researchers have summarized three factors that are closely related to traffic accidents through traffic accident data: drivers, vehicles, and roads. However, traffic accident data are difficult to obtain. The development of Traffic Conflict Technology (TCT) has effectively solved this problem. The development of TCT has been going on for more than 50 years, but as yet there is no in-depth analysis for the dynamic nature of traffic flow.
In summary, the objective of this paper is to construct a sequence model to describe the dynamic nature of conflicts by analyzing the conflict mechanism of vehicle trajectories in the freeway merging area. The sequence model is used to further realize the automatic discrimination of traffic conflicts and to derive which important factors affect the operation quality of merging areas.

2. Related Work

2.1. Analysis of Traffic Conflicts in Freeway Merging Areas

TCT was developed in the 1960s and was first defined in detail by Perkins and Harris [2]. Subsequently, Swedish Traffic Conflict Technique was proposed by Hyden after many experimental studies. The authors established two indicators: accident time and conflict speed [3]. Since then, researchers have repeatedly proven that Traffic Conflict Technique can quantitatively evaluate the safety condition of the road [4,5,6].
Uzondu et al. explored the relationship between traffic behavior and conflicts in Nigeria. The authors used a binary logistic model to analyze the severity and influencing factors of traffic conflicts and demonstrated a strong relationship between travel direction, travel time, and conflict severity. The study also set a template for the diffusion of traffic conflict techniques in developing countries [7]. Zheng et al. used Bayesian models and Multivariate Extreme Value models to effectively evaluate non-smooth traffic for extreme-traffic conflicts and analyzed various traffic conflict indicators to determine their applicability [8,9,10,11,12,13,14]. Li used the Tracker (UAV video tracking software) to extract traffic flow parameters, selected the Time to Collision (TTC) as a conflict indicator, quantitatively analyzed traffic conflict severity, and constructed a complete traffic conflict analysis model [15]. Wen et al. constructed a conflict probability model by considering the influence of vehicle micro-operation characteristics on traffic conflicts. Then, the authors established a CP-CS fusion model by integrating conflict probability and severity via statistical data. Finally, the authors employed SSAM software to verify the model using measured traffic data [16]. Arun et al. investigated tailgating conflicts in detail and demonstrated that the modified TTC and DRAC are the best indicators for evaluating tailgating conflicts [17]. Katrakazas et al. demonstrated that fast vehicle speed and congestion are the main causes of tailgating conflicts [18].
The freeway merging area is an accident-prone area and is the focus of the current traffic conflict research [1]. Wang et al. analyzed the trajectory data of 48 vehicles within the freeway merging area and demonstrated an inherent connection between the instability of traffic flow in the freeway merging area and the frequency of traffic accidents [19]. Duan investigated the effects of different traffic organizations on conflict distribution and severity by employing VSSIM and SSAM software [20]. Zhang et al. studied the traffic flow in freeway merging areas during rain and proposed a method of speed limit control for the expressway main road in rainy environments based on macroscopic dynamic traffic flow METANET model. The results show that the reasonable speed limit under rainy weather environment is beneficial to the operational safety of merging areas. [21]. Lu et al. pointed out that the traffic conflicts between trucks in merging areas were the most serious [22]. Park et al. developed a freeway merge lane changing advisory algorithm based on vehicle-to-vehicle and vehicle-to-infrastructure communications. The algorithm advises the driver on lane changes through variable gap sizes [23].

2.2. Discrimination of Traffic Conflicts

Traffic conflict discrimination, especially automatic traffic conflict discrimination, has developed at a high rate along with the rise of autonomous driving. Considering the safe interaction between the subject vehicle and the surrounding vehicles in the study of a co-evolutionary lane-changing trajectory planning method for automated vehicles, Wu et al. established a mathematical model for the temporal and spatial risk identification of a lane change event based on the fault tree analysis method [24]. Xie et al. introduced Time to Collision (TTC) to identify rear-end conflict risk for adjacent vehicles, and proposed Hidden Markov models (HMMs) to model the rear-end conflicts at five-minute intervals. The modeling results imply that HMMs can help monitor the prevailing traffic conditions and facilitate proactive safety management [25]. Lu et al. proposed a method of identifying traffic conflict by learning the representation of TTC and driver maneuver profiles with deep unsupervised learning, and then clustering the representations into traffic conflict and non-conflict clusters [26]. Ma et al. presented a CV framework that uses the two-way time of arrival to locate the vehicles on the basis of the Intelligent Vehicle Infrastructure Cooperative Environment. The left-turn collision at the signal intersection is identified using the post-encroachment time (PET) algorithm and vehicle movement information [27]. Mayerhofer et al. presented a methodology for identifying relevant conflict points involving automated vehicles and vulnerable road users, in order to simplify the selection of adequate instances to be used in studies involving automated vehicles [28].

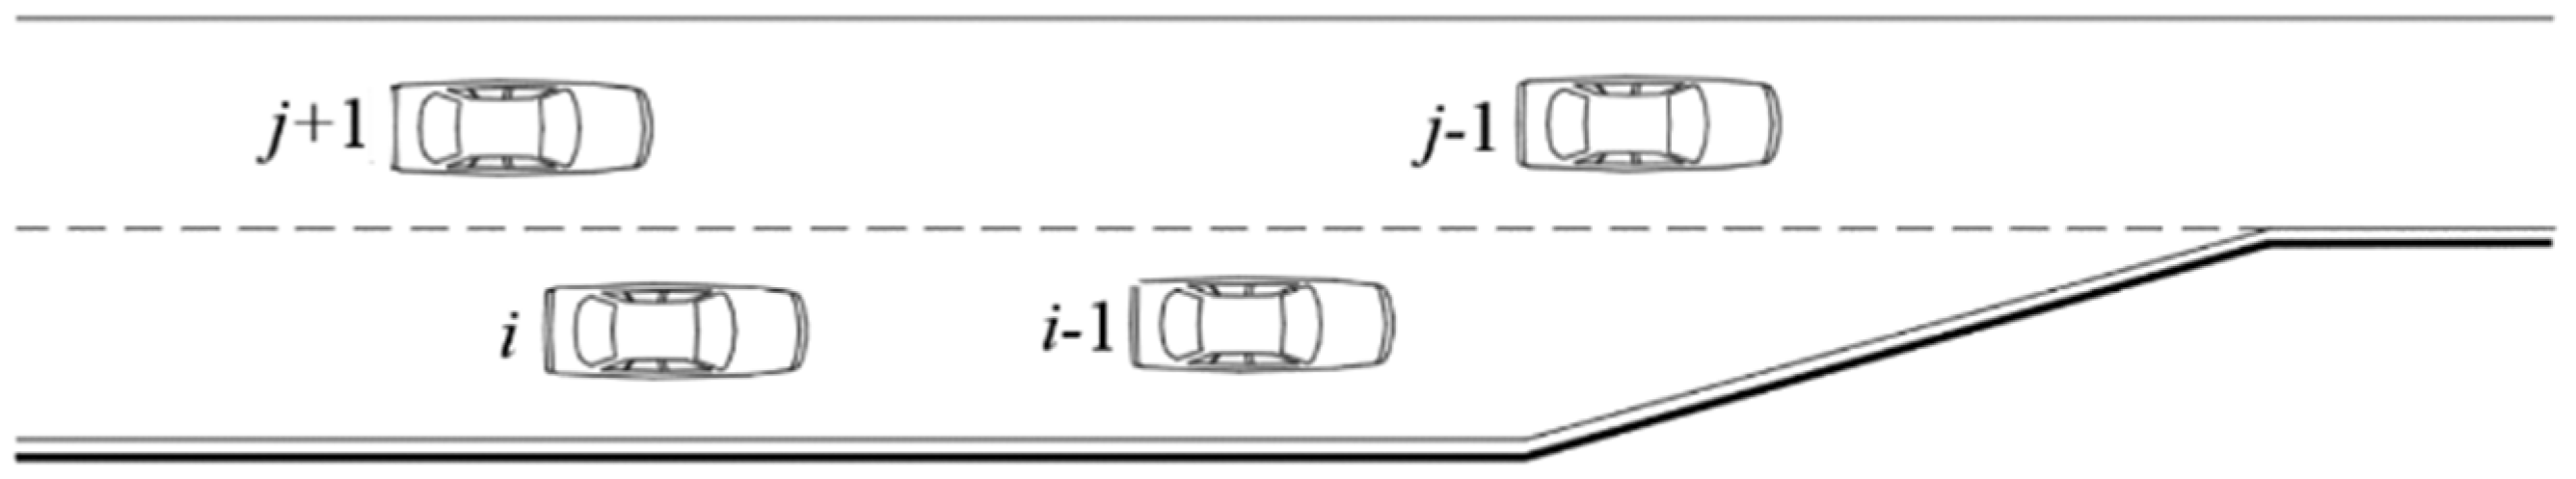
3. Conflict Mechanism of the Freeway Merging Area

Vehicle merging behavior is the process in which multiple streams of traffic in the same direction merge into a single traffic stream [29]. Therefore, a freeway merging area is defined as an area on the freeway characterized by merging. The freeway merging area consists of three parts: the mainline lane, the acceleration lane, and the entrance ramp. According to the acceleration lane form, the freeway merging area is divided into the merging area with parallel acceleration lanes and direct acceleration lanes, as shown in Figure 1. Since the majority of Chinese freeways are currently using merging areas with parallel acceleration lanes, they are the topic of merging conflict analysis conducted in this paper.
Assume that vehicles j 1 and j + 1 are in the mainline with space between them. Vehicles i and i 1 are in the acceleration lane, where vehicle i is about to merge into the mainline, whilst the merging position is the space between vehicles j 1 and j + 1 . The merging environment is shown in Figure 2.
Before changing the lane, the driver of vehicle i needs to observe the traffic flow conditions of the mainline lane. The adjustment of vehicle i ’s speed may lead to a rear-end conflict with vehicle i 1 . Then, vehicle i will be in a lateral offset state, at which point a trajectory crossover between vehicles i and j + 1 exists. Thus, a lateral conflict may arise. When the merge is completed, vehicle i needs to adjust its speed to meet the passing conditions of the mainline. During speed adjustment, vehicle i may have a rear-end conflict with a vehicle j + 1 .

4. Data Acquisition

4.1. Selection of Indicators

The commonly used traffic conflict indicators in research are:
  • Time to Collision (TTC) is defined as the time difference between two vehicles keeping their current path and speed constant from the start of the conflict to the collision [30]. TTC is applicable to the calculation of rear-end conflicts, but not to lateral conflicts.
  • Extended TTC complements the TTC with the calculation of lateral conflicts. However, the extended TTC is not accurate for the discrimination of lateral conflicts. For freeways, where the mainline vehicles are farther away, the ramp vehicles are faster and the TTC for lateral conflicts is smaller. The actual conflict in this case is not serious, indicating that the extended TTC cannot discriminate the lateral conflict effectively.
  • Post Encroachment Time (PET) is defined as the time difference between the front and rear vehicles passing the conflict point or conflict surface [31]. PET is an indicator that describes a process, which is only applied to cases where trajectories intersect and does not reflect the dynamics of the conflict.
Since the above single indicator has its limitations and scope of application, TDTC [32], — a composite indicator combining the advantages of TTC and PET — is selected as the identification indicator in this paper.
TDTC indicates the time difference between the front and rear vehicles required to reach the conflict point when the vehicle is traveling according to the current speed and trajectory. As shown in Figure 3, TDTC is calculated by formula (1). For rear-end conflicts, TDTC is calculated as TTC. For lateral conflicts, TDTC is calculated similarly to PET. However, TDTC can fully respond to the change in vehicle speed when characterizing lateral conflicts. TDTC inherits the advantages of TTC and PET and improves their disadvantages. Comprehensive analysis indicates that TDTC is more suitable as an indicator for constructing a sequence model of merging conflicts.
T D T C = s i v i s j v j ,
where s i denotes the distance between vehicle i and the conflict point (m); v i denotes the speed of vehicle i (m/s); s j denotes the distance between vehicle j and the conflict point (m); and v j denotes the speed of vehicle j (m/s).

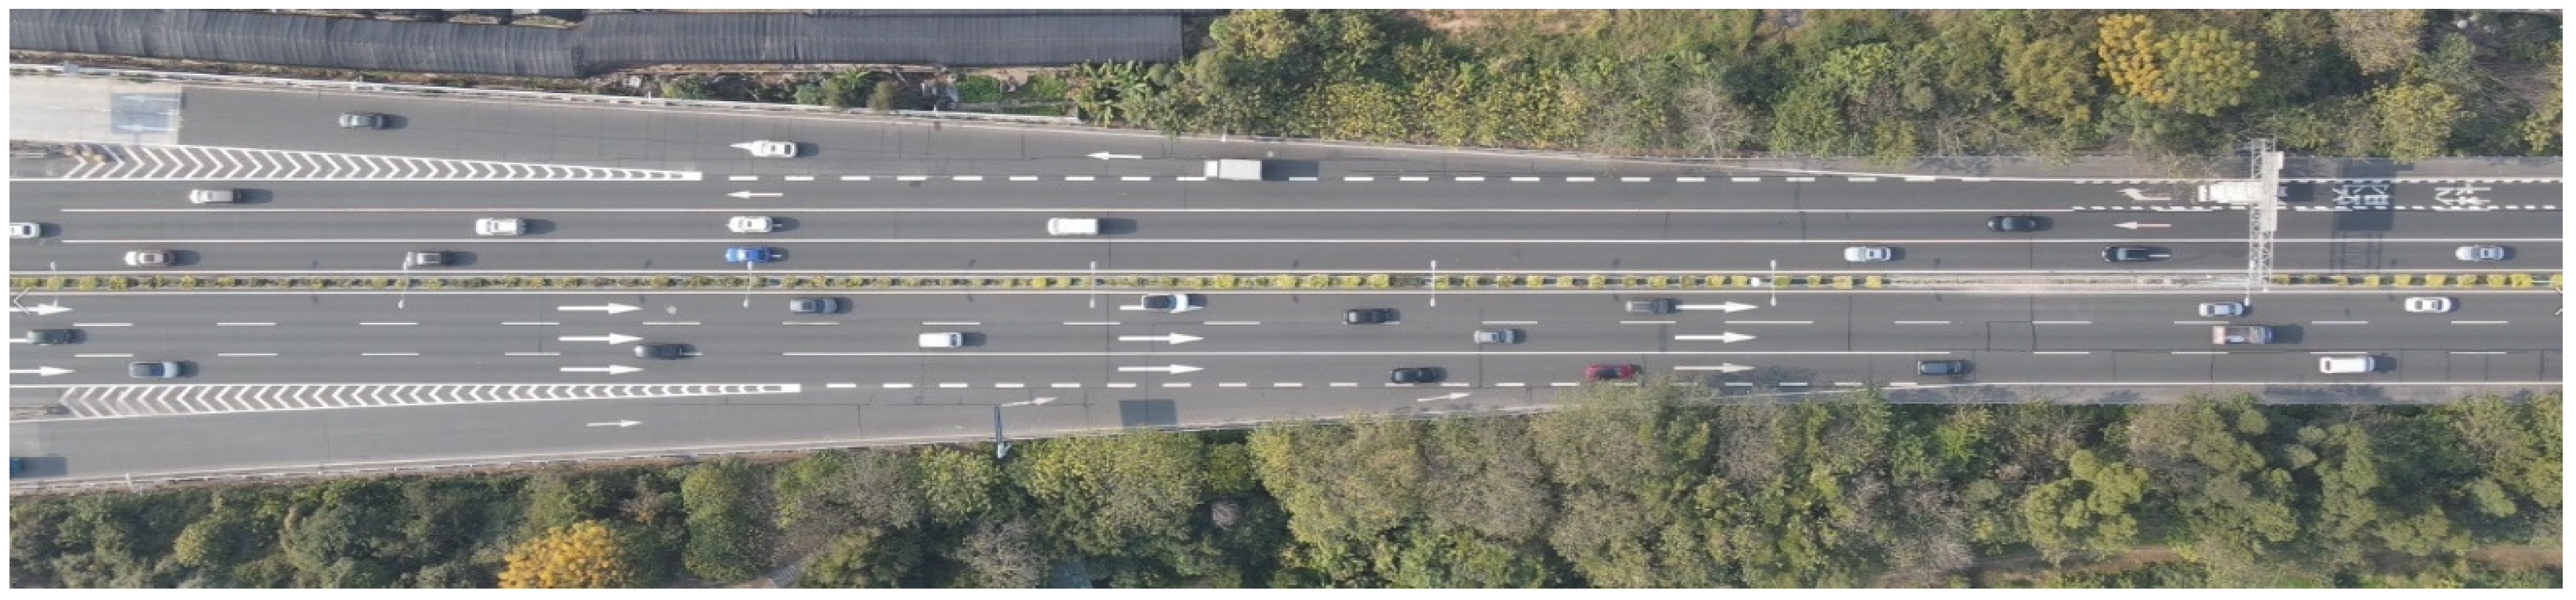
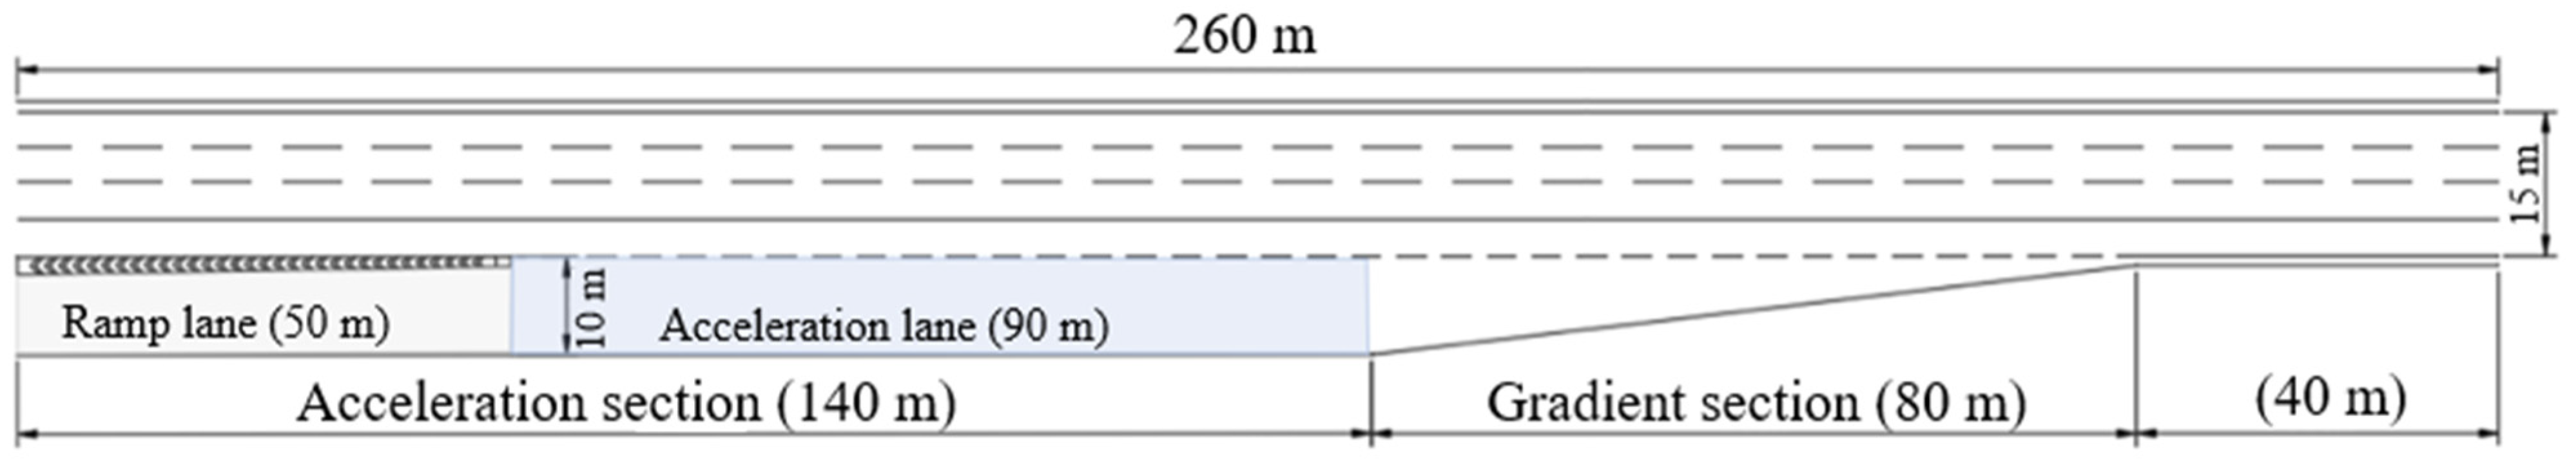
4.2. Data Collection

DJI Mavic air2 UAV was used to collect video data from the merging areas of the Guanghe Freeway in Guangzhou City at 200 m height during the morning rush hour from 8:00 to 9:00. Traffic flow in one direction was 5112 PCU/H. A snapshot of the UAV video is shown in Figure 4 and the overview of the merging area is shown in Figure 5. The video covers 260 m of roadway, with an acceleration section of 140 m and a gradient section of 80 m. The acceleration section is divided into two parts: the ramp lane (50 m) and the acceleration lane (90 m). The mainline has four lanes, each lane is 3.75 m wide, and the acceleration lane is 10 m wide.
YOLOv5-DeepSORT algorithm is applied to video data to implement vehicle trajectory recognition and parameter extraction [33,34]. After this, the Empirical Mode Decomposition (EMD) algorithm of the signal analysis method is selected for vehicle trajectory reconstruction [35,36], and Complete Ensemble Empirical Mode Decomposition with Adaptive Noise (CEEMDAN) is specifically chosen. Finally, the required training data is obtained. Dataset fields are shown in Table 1.
Vehicle 3 is determined based on Vehicle 2. As in Figure 2, if vehicle 2 is vehicle j + 1 on the mainline, vehicle 3 is vehicle j 1 . If vehicle 2 is vehicle j 1 on the mainline, vehicle 3 is vehicle j + 1 .

5. Sequence Calculation of Merging Conflicts

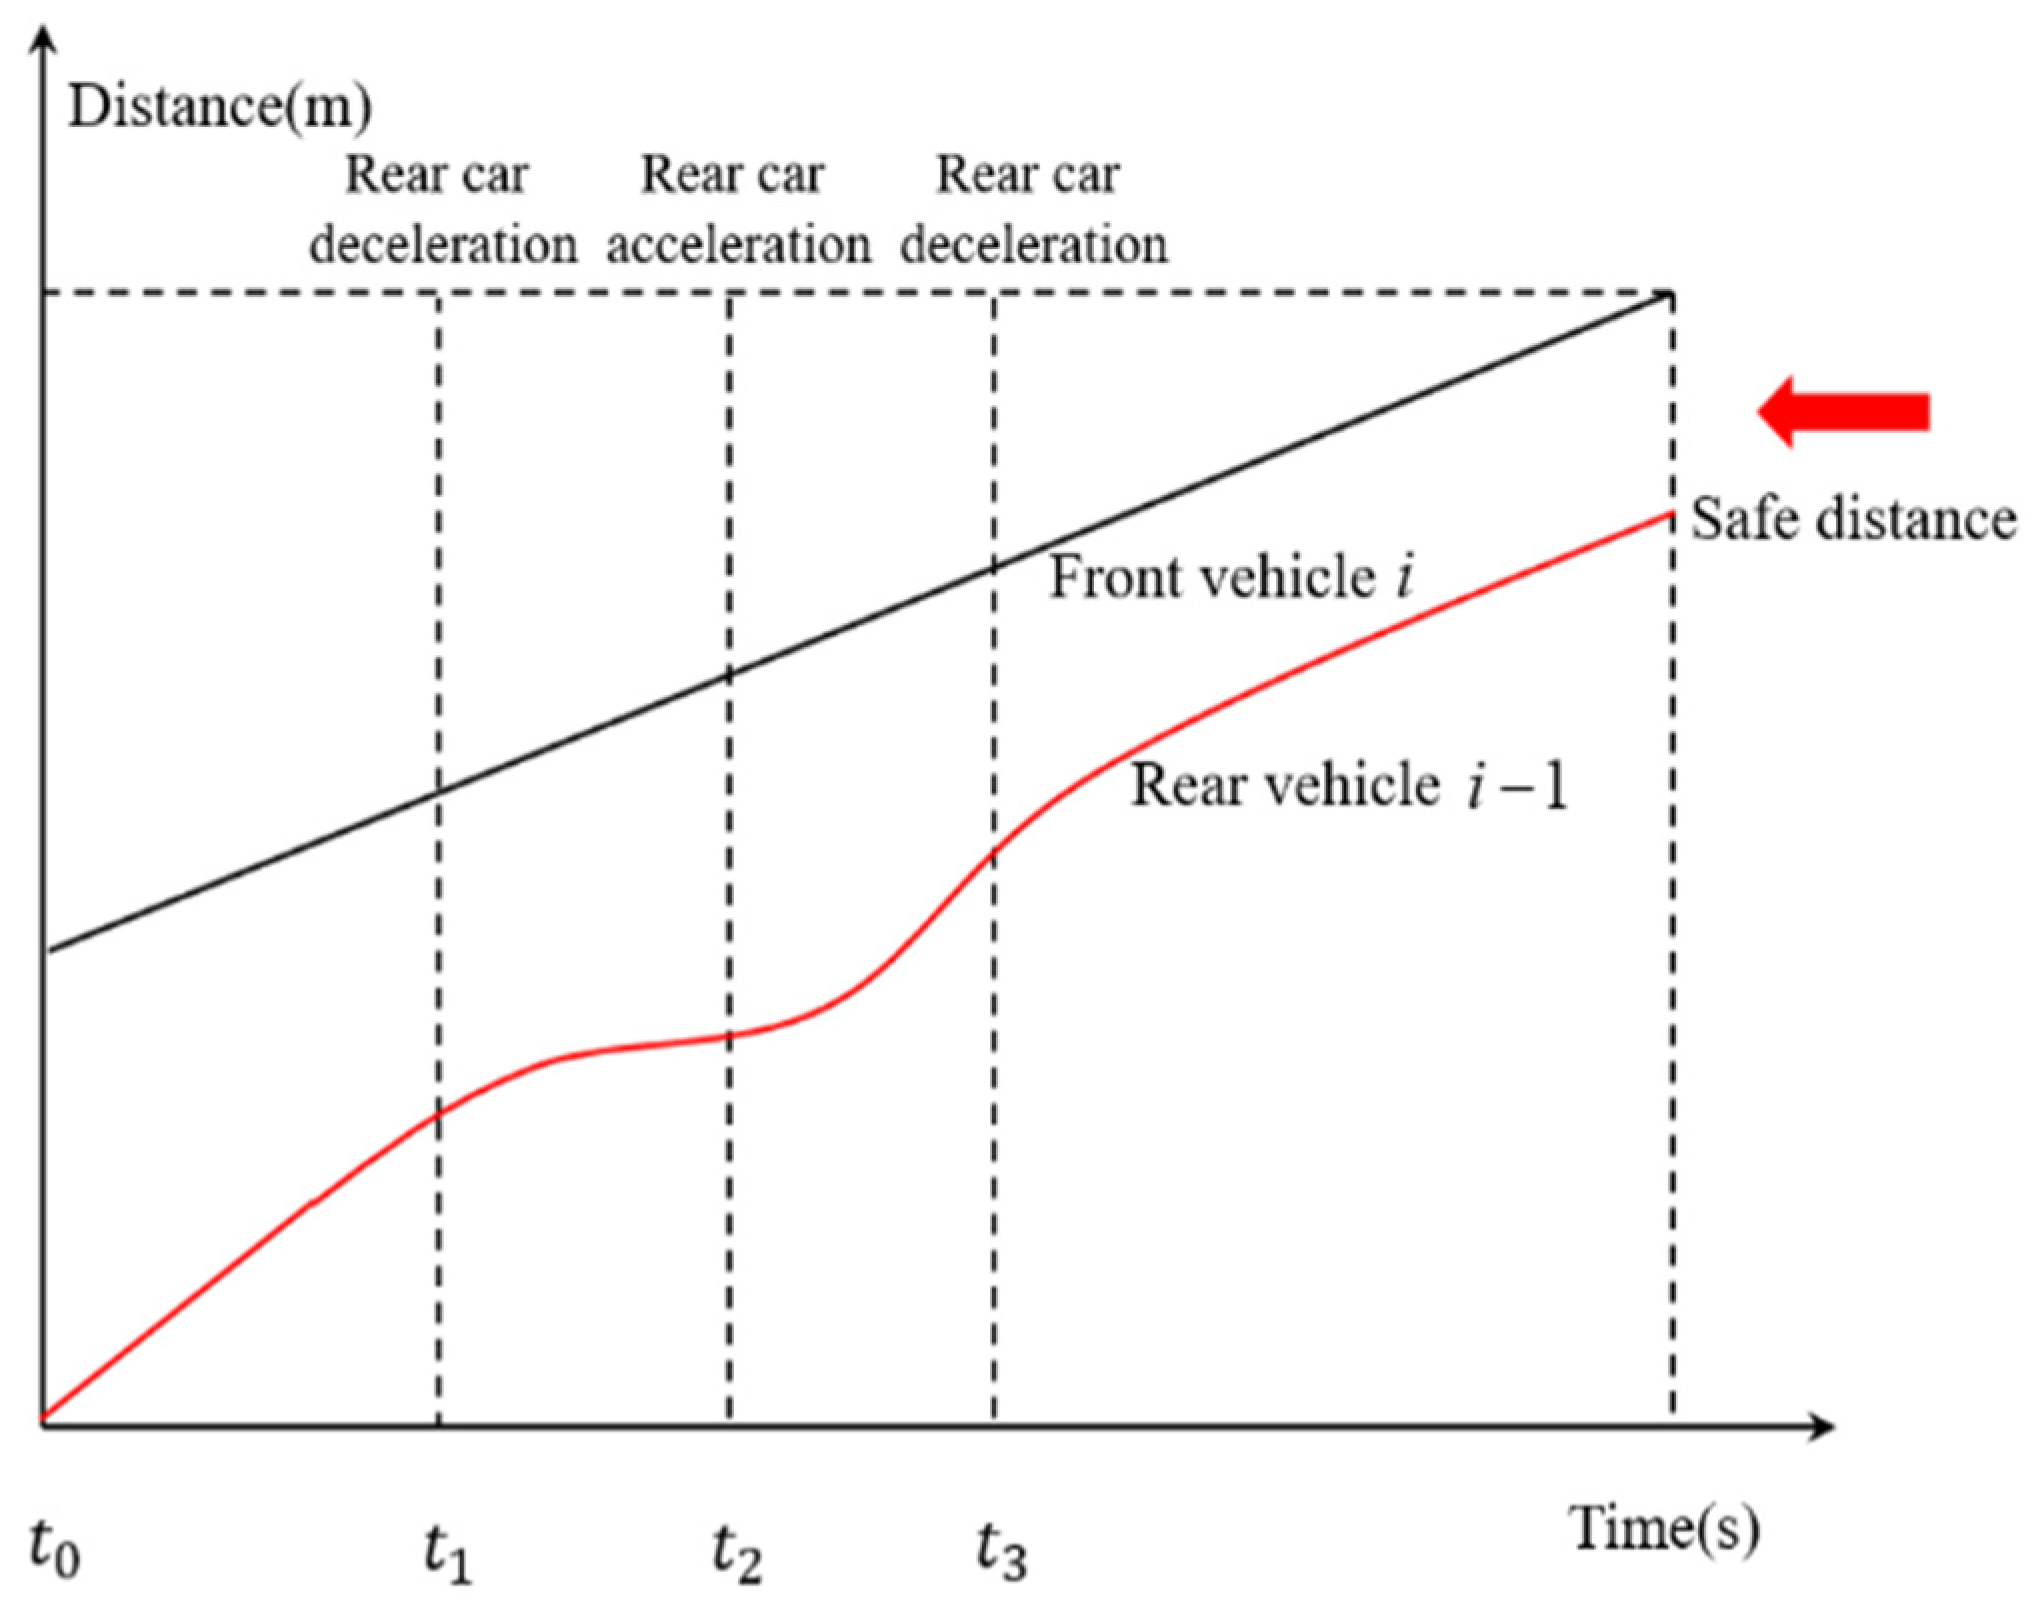
5.1. Construction of the Sequence Model of Merging Conflicts

Merging conflicts frequently occur in freeway merging areas due to significant differences in speed and alignment between the mainline and the ramps. In addition, the traffic flow of the freeway is dynamic. Since the speed and acceleration of each vehicle change with the traffic flow state, the conflict between vehicles is also dynamic. The merging conflict between the front and the following vehicles is shown in Figure 6. At moment t 0 , the front vehicle i is traveling at speed v i and the rear vehicle i 1 is traveling at speed v i 1 ( v i < v i 1 ). As the headway gradually decreases, the rear vehicle i 1 starts to decelerate from moment t 1 . The rear vehicle i 1 accelerates until moment t 2 to maintain the following state. Eventually, the rear vehicle i 1 decelerates at moment t 3 and maintains the same speed as the front vehicle i ( v i = v i 1 ).
The change in the TDTC based on the above-described process is shown in Figure 7. From t 0 to t 1 , the front and rear vehicles maintain uniform speed ( v i < v i 1 ) and the TDTC is gradually lowered. Since the rear vehicle starts to decelerate from t 1 , the rate at which TDTC decreases slows down. After this, TDTC starts to increase. At t 2 the rear vehicle starts to accelerate and TDTC starts to decrease. At t 3 the rear vehicle slows down and maintains the same speed as the front vehicle. Consequently, TDTC approaches infinity (conflict disappears).
According to Figure 7, the curve of TDTC yields two local minima. Previous studies have used the second TDTC (red dot in the figure) as a conflict indicator. However, the first TDTC also records important information about the conflict (such as the most serious conflict encountered by the rear vehicle at the first deceleration). In a realistic driving environment, the rear vehicle will accelerate and decelerate multiple times while following the front vehicle. Therefore, the TDTC curve will produce multiple minimal values. All TDTCs during the conflict process are sequentially constructed to represent the change process of the merging conflict in a realistic driving environment.
S T D T C = { T D T C ( t ) } t = t s t c ,
where t c and t s denote the time when the conflict starts and ends, respectively.
For rear-end conflicts, the conflict point is the trailing end of the front vehicle. Therefore, TDTC is calculated in the same way as TTC:
S T D T C = { T D T C ( t ) } t = t s t c = { T T C ( t ) } t = t s t c .
For lateral conflicts, the conflict zone is an area that consists of the trajectory of the ramp vehicles intersecting with the mainline vehicles. As shown in Figure 8, assuming that the vehicle’s forward direction is the x-axis and the lateral displacement is the y-axis, TDTC of the lateral conflict is defined as the time difference between the arrival of vehicle j at the intrusion line ② and the arrival of vehicle i at the intrusion line ①.
Suppose that the position of the center point of vehicle i is ( x i ( t ) , y i ( t ) ) at the moment t , the state is ( v i ( t ) , θ i ( t ) ) , the length of the vehicle is l i , and the width of the vehicle is w i , where θ is the angle of rotation between the vehicle and the x-axis (car j has a similar expression). Therefore, the TDTC sequence can be calculated as follows:
(1) Determining the intrusion line
According to Figure 8, the intrusion lines intersect at point k . Therefore, the time when vehicle i arrives at the intrusion line ① can be converted to the time when the left endpoint of vehicle i reaches point k . In addition, the time when vehicle j arrives at the intrusion line ② can be converted to the time when the right endpoint of vehicle j reaches point k .
Since vehicle j is located on the mainline, θ j ( t ) = 0 and the right endpoint of vehicle j is ( x h j ( t ) , y h j ( t ) ) = ( x j ( t ) + l j / 2 , y j ( t ) w j / 2 ) . According to the vehicle construction, the left endpoint of the car i is ( x h i ( t ) , y h i ( t ) ) , where:
x h i ( t ) = x i ( t ) + ( l i 2 ) 2 + ( w i 2 ) 2 cos ( arctan ( w i l i ) + θ i ( t ) ) ,
y h i ( t ) = y i ( t ) + ( l i 2 ) 2 + ( w i 2 ) 2 sin ( arctan ( w i l i ) + θ i ( t ) ) .
At moment t , lateral distance y c i ( t ) and corresponding time t i ( t ) for vehicle i to reach point k is as follows:
y c i ( t ) = y h j ( t ) y h i ( t ) ,
t i ( t ) = y c i ( t ) v i ( t ) sin ( θ i ( t ) ) .
Therefore, the longitudinal distance x c i ( t ) between vehicle i and point k can be expressed as:
x c i ( t ) = t i ( t ) v i ( t ) cos ( θ i ( t ) ) .
Since the lateral distance y c j ( t ) between point k and vehicle j is zero, the longitudinal distance x c j ( t ) between point k and vehicle j can be expressed as:
x c j ( t ) = x c i ( t ) + x i ( t ) x j ( t ) .
(2) Calculating the TDTC sequence
The time for vehicle i to reach point k is shown in Equation (7), and the time for vehicle j to reach point k can be expressed as:
t j ( t ) = x c j ( t ) v j ( t ) = x c i ( t ) + x i ( t ) x j ( t ) v j ( t ) .
If t i ( t ) t j ( t ) , then T D T C ( t ) = t i ( t ) t j ( t ) ; if t i ( t ) t j ( t ) , then T D T C ( t ) = t j ( t ) t i ( t ) . Thus, the TDTC sequence for lateral conflicts can be obtained as follows:
S T D T C = { T D T C ( t ) } t = t 1 t n = { | t i ( t ) t j ( t ) | } t = t 1 t n .

5.2. Validity of the Sequence Model of Merging Conflicts

The sequence model of merging conflicts proposed in this paper can be used to characterize the dynamic characteristics of merging conflicts. The main advantages of the sequence model are the ability to record the complete conflict process, data volume expansion, and data confidence improvement. For each merging maneuver, the TDTC values less than or equal to 10 s were selected for analysis [37], and the results are shown in Table 2. In general, only 1 TDTC value can be obtained at a single merging conflict using the previous method (There were 157 conflicts in the experimental data). However, the sequence model can obtain 157 conflict sequences (containing 2174 TDTC values). The distribution pattern is shown in Figure 9.
According to experimental results, a significant data imbalance exists in TDTC obtained with the previous method. Since traffic accidents are small probability events, TDTC with values between 0 and 1 are also small probability events. TDTC calculated from the sequence model is characterized by obvious distribution patterns and high data confidence conducive to conflict analysis and automatic discrimination.

6. LightGBM-Based Automatic Discrimination of Merging Conflict

Automatic discrimination of merging conflicts is a multi-classification problem, where the severity of conflicts is evaluated based on multiple features of merging conflicts. The LightGBM algorithm is a classification model based on the Gradient Boosting Decision Tree (GBDT) framework and was proposed by Microsoft Research in 2016 [38]. Compared with other classification models, such as XGBoost, AdaBoost, and Random Forest, LightGBM requires less memory, is faster, and has higher accuracy.

6.1. Principle of LightGBM

The basis of LightGBM is GBDT. GBDT is a decision tree model based on the Boosting framework and the idea of gradient descent [39]. Although GBDT has high prediction accuracy, the Boosting framework requires serial training, so the time and memory consumption for model training is large. LightGBM has a series of optimizations in terms of training speed, memory and generalization capability.
(1) Use of Gradient-based One-Side Sampling (GOSS)
The essence of LightGBM is GBDT, where each data is given a different gradient value in the actual training. The higher the gradient value, the less information the model uses. During the training process, LightGBM is able to filter out the data to be learned based on the gradient value to accelerate the training and to maintain accuracy. The GOSS algorithm also uses random sampling to prevent the imbalance of data samples, which improves the generalization ability of LightGBM.
(2) Screening tree splitting points using histograms
The traditional decision tree model uses a sorting algorithm for feature filtering, which requires traversing all features. Therefore, it is slower and takes up more memory. As shown in Figure 10, LightGBM, on the other hand, discretizes the values of the features, bins all the data, and constructs a histogram. Only the interval of the histogram needs to be judged during the screening of the optimal tree splitting points, thus greatly improving running speed and reducing memory space usage.
(3) Leaf-wise decision tree generation strategy
As shown in Figure 11, the traditional decision tree model mainly uses the level-wise strategy to generate decision trees. The level-wise strategy does not consider the splitting gain when generating leaves, so it is easy to generate more leaves with low splitting gain, which otherwise consumes a lot of memory and time. On the contrary, the leaf-wise strategy will consider the splitting gain when generating leaves, so the generated decision tree has less error and higher accuracy. However, the Leaf-wise strategy will lead to overfitting of the generated decision trees, so the generalization ability of the model needs to be improved by controlling the maximum number of layers of the decision trees.

6.2. Feature Variables of Merging Conflicts

The spatial distribution analysis of merging conflicts in freeway merging areas yields the following conclusions:
(1)
refer to Figure 5, fewer conflicts exist in the ramp lane, while more serious conflicts are present upstream of the acceleration lane;
(2)
more conflicts exist downstream of the acceleration lane and the gradient section. However, they are mostly general and minor conflicts; and
(3)
more conflicts are present at the end of the merging area; these conflicts are the most serious.
Because of the above findings, the causes are investigated within this paper by employing the analysis.
According to Table 3, at the upstream of the acceleration lane, vehicles that cause severe conflicts have a greater average speed than the other vehicles. This means that these vehicles take a riskier approach to merging into the mainline at this location (larger merging angle and faster movement). This also means that the time and space for these vehicles to make merging decisions are greatly compressed, and drivers are prone to make wrong calls. Therefore, the proportion of serious conflicts upstream of the acceleration lane is relatively large.
According to Table 4, the average speed of ramp vehicles is smaller than that of mainline vehicles before merging into the mainline. Therefore, the number of conflicts downstream of the acceleration lane and the gradient section increases. On the other hand, the speed of ramp vehicles is more stable because the number of ramp vehicles is lower than that of mainline vehicles, the headway is larger, and the variance and standard deviation are smaller than mainline vehicles. The result is that most of the above conflicts are general and minor.
After merging into the mainline, ramp vehicles need to adjust their speed to adapt to the traffic flow characteristics of the mainline. In addition, drivers need to observe the status of the lateral traffic and wait for an opportunity to merge into the inside lane of the mainline. This causes a further increase in speed difference between mainline vehicles. Therefore, there are more conflicts (mostly serious ones) at the end of the merging area.
The analysis shows that merging conflicts in freeway merging areas are closely related to the speed difference between vehicles, the merging position, the merging angle, and merging speed fluctuation. The fields in Table 1 contain only velocity, acceleration, and position. A series of data transformations, such as normalization, discretization, and mathematical changes, is performed on the training dataset fields to meet the characteristics of automatic discrimination of merging conflicts. The standardization uses z-score normalization with the following equation:
z = x μ σ ,
where σ is the standard deviation, μ is the sample mean, x is the value to be standardized, and z is the standardized value.
Discretization refers to converting continuous-type into discrete-type features by setting a threshold value. Discretization can effectively reduce the structural complexity of LightGBM and overfitting probability. Mathematical change refers to constructing new features by adding, subtracting, multiplying, and/or dividing among features. Mathematical variation can reduce the training difficulty of LightGBM and improve the model’s accuracy. Finally, the feature variables of the LightGBM-based automatic discrimination of merging conflicts are determined, as shown in Table 5.

6.3. Model Training and Result Analysis

The training results of the LightGBM model are related to set parameters. In this paper, the training speed, model accuracy, and generalization ability are considered, with the selected parameters shown in Table 6.
Random Forest, AdaBoost, XGBoost, Decision Tree, and K-nearest Neighbor model are additionally constructed to verify the performance of the automatic discriminatory model of merging conflicts. The ROC curves of all the above models after training are shown in Figure 12. The area under the ROC curve is positively correlated with the model’s accuracy; the larger the area, the higher the model’s accuracy (shown in brackets). In this paper, four cases are separately tested: severe conflict, general conflict, minor conflict, and no conflict. The results indicate that the LightGBM model is optimal for the automatic determination of various conflicts; the K-nearest Neighbor model is the least effective; the XGboost model has slightly lower discrimination accuracy for conflicts than LightGBM; Decision Tree, AdaBoost, and Random Forest are characterized by similar recognition accuracy but are insufficient for automatic discrimination of merging conflicts.
In addition, three metrics are chosen to evaluate the LightGBM model: detection rate, completion rate, and F1-Score. The detection rate represents the probability of various conflicts being identified in the overall conflicts. The completion rate represents the leakage of various conflicts, while the F1-SCORE represents a combination of the detection and completion rates. According to Table 7, the LightGBM model is characterized by a high completeness rate and an accuracy rate of 91%. Moreover, the LightGBM model can effectively identify merging conflicts in freeway merging areas.

6.4. Model Validation

Feature importance of the automatic discriminative model is analyzed in this section to verify the interpretability of the LightGBM-based automatic discriminative model for merging conflicts. The feature importance is calculated by Equation (13):
J ^ j 2 = 1 M m = 1 M J ^ j 2 ( T m ) ,
where J ^ j 2 is the feature importance of feature j on the model; M is the number of trees; and J ^ j 2 ( T m ) is the feature importance of feature j on a single tree calculated as:
J ^ j 2 ( T ) = t = 1 L 1 I ^ t 2 1 ( v t = j ) ,
where L 1 is the number of non-leaf nodes in the tree; v t is the selected feature when the internal node t is split; and I ^ t 2 is the reduction of the squared loss after the internal node t is split.
The feature importance of an automatic discrimination model for merging conflicts is calculated and shown in Table 8. For severe conflicts, the most important feature is the choice of the merging position. For general conflicts, the most important feature is the standard deviation of speed before merging. For minor conflicts, the most important feature is the longitudinal speed difference between the mainline ramp vehicles. Similarly, the analysis in Section 4.1 shows that:
(1)
three distinctive characteristics of vehicles with severe conflicts can be observed: faster speed, unstable speed, and mainly distributed upstream of the acceleration lane and the end of the merging area;
(2)
two distinctive characteristics of vehicles with general and minor conflicts can be observed: more stable speed and smaller speed difference with the mainline vehicles.
The above analysis shows a clear correlation between the training results of the model and the conclusions drawn in Section 4.1. This confirms that the model constructed in this paper is characterized by strong interpretability and validity.

7. Conclusions

In order to investigate the reasons behind the high occurrence of accidents in freeway merging areas, this paper accomplished the following work and drew the corresponding conclusions:
(1)
We analyzed the mechanism behind freeway merging conflicts. On the basis of considering the dynamic nature of traffic conflicts, a sequence model of merging conflicts in freeway merging areas was constructed to reflect the dynamic nature of traffic conflicts by using Time Difference to Collision (TDTC) as the indicator of freeway merging conflicts.
(2)
The vehicle trajectory data of the merging area of Guanghe Freeway in Guangzhou City were collected by using a UAV. Based on the conflict sequence model, an exploratory analysis of the conflict data was conducted to filter out the relevant features. An automatic discrimination model of merging conflicts was constructed with the LightGBM algorithm at its core. After training, the model achieved an overall accuracy rate of 91% for merging conflict discrimination. In addition, the proposed model outperformed the random forest, AdaBoost, XGBoost, decision tree, and K-nearest neighbor models in check-all and check-accuracy rates. Lastly, the automatic discriminative model was proven to be highly interpretable and effective.
(3)
The results show that the most important feature of severe conflicts is the choice of the merging position. In addition, the most important feature of general conflicts is the standard deviation of speed before merging. Lastly, the most important feature of minor conflicts is the longitudinal speed difference between the ramp and mainline vehicles.
Compared with previous studies, the main contributions of this paper are three-fold. On the one hand, a conflict sequence model is constructed using TDTC as an indicator. While representing the dynamic nature of traffic conflicts, the amount of data of traffic conflicts is expanded. On the other hand, the automatic discrimination of traffic conflicts is realized based on LightGBM, which lays the foundation for safety warning features of driver assistance systems and autonomous driving. In addition, the important features that cause conflicts were identified through analysis, which lays the foundation for subsequent traffic conflict research.
However, the proposed automatic discrimination model is only valid for the freeway merging areas and does not consider other typical freeway sections. Therefore, based on the existing research, subsequent investigations can consider the similarities and differences between freeway merging areas and other typical sections. Thus, the generalization ability of the automatic discrimination model for merging conflicts can be further improved.

Author Contributions

Conceptualization, W.Q. and W.W.; methodology, W.W.; software, W.W.; validation, W.Q., H.W., W.W. and J.H.; formal analysis, J.H.; investigation, W.W. and H.W.; resources, W.Q.; data curation, W.W.; writing—original draft preparation, H.W.; writing—review and editing, W.Q. and H.W.; visualization, W.W.; supervision, W.Q.; project administration, J.H. All authors have read and agreed to the published version of the manuscript.

Funding

This work was supported by the National Natural Science Foundation of China (No. 52072131), the Key Research Projects of Universities in Guangdong Province (No. 2019KZDXM009), the Natural Science Foundation of Guangdong Province (No. 2022A1515010123), and the Special Innovative Projects of Universities in Guangdong Province (No. 2019GKTSCX036).

Institutional Review Board Statement

Not applicable.

Informed Consent Statement

Not applicable.

Data Availability Statement

Not applicable.

Acknowledgments

The material support of company Guangzhou Northring Intelligent Transport Technology Co., Ltd., Guangzhou, China, is acknowledged.

Conflicts of Interest

The authors declare no conflict of interest.

References

  1. Za, W. Study on Traffic Conflicts Prediction and Safety Evaluation in Highway Convergence Zone. Master’s Thesis, Chongqing Jiaotong University, Chongqing, China, 2020. [Google Scholar]
  2. Wali, B.; Khattak, A.J.; Karnowski, T. Exploring microscopic driving volatility in naturalistic driving environment prior to involvement in safety critical events—Concept of event-based driving volatility. Accid. Anal. Prev. 2019, 132, 105277. [Google Scholar] [CrossRef] [PubMed]
  3. Essa, M.; Sayed, T. Traffic conflict models to evaluate the safety of signalized intersections at the cycle level. Transp. Res. Part C Emerg. Technol. 2018, 89, 289–302. [Google Scholar] [CrossRef]
  4. Tarko, A.P. A unifying view on traffic conflicts and their connection with crashes. Accid. Anal. Prev. 2021, 158, 106187. [Google Scholar] [CrossRef]
  5. Weng, J.; Xue, S.; Yang, Y.; Yan, X.; Qu, X. In-depth analysis of drivers’ merging behavior and rear-end crash risks in work zone merging areas. Accid. Anal. Prev. 2015, 77, 51–61. [Google Scholar] [CrossRef] [PubMed]
  6. Weng, J.; Li, G.; Yu, Y. Time-dependent drivers’ merging behavior model in work zone merging areas. Transp. Res. Part C Emerg. Technol. 2017, 80, 409–422. [Google Scholar] [CrossRef]
  7. Uzondu, C.; Jamson, S.; Lai, F. Exploratory study involving observation of traffic behavior and conflicts in Nigeria using the Traffic Conflict Technique. Saf. Sci. 2018, 110, 273–284. [Google Scholar] [CrossRef]
  8. Zheng, L.; Sayed, T.; Essa, M. Bayesian hierarchical modeling of the non-stationary traffic conflict extremes for crash estimation. Anal. Methods Accid. Res. 2019, 23, 100100. [Google Scholar] [CrossRef]
  9. Fu, C.; Sayed, T.; Zheng, L. Multivariate Bayesian hierarchical modeling of the non-stationary traffic conflict extremes for crash estimation. Anal. Methods Accid. Res. 2020, 28, 100135. [Google Scholar] [CrossRef]
  10. Zheng, L.; Sayed, T. A bivariate Bayesian hierarchical extreme value model for traffic conflict-based crash estimation. Anal. Methods Accid. Res. 2020, 25, 100111. [Google Scholar] [CrossRef]
  11. Zheng, L.; Sayed, T. Comparison of traffic conflict indicators for crash estimation using peak over threshold approach. Transp. Res. Rec. 2019, 2673, 493–502. [Google Scholar] [CrossRef]
  12. Zheng, L.; Sayed, T.; Mannering, F. Modeling traffic conflicts for use in road safety analysis: A review of analytic methods and future directions. Anal. Methods Accid. Res. 2021, 29, 100142. [Google Scholar] [CrossRef]
  13. Fu, C.; Sayed, T. A multivariate method for evaluating safety from conflict extremes in real time. Anal. Methods Accid. Res. 2022, 36, 100244. [Google Scholar] [CrossRef]
  14. Fu, C.; Sayed, T. Random parameters Bayesian hierarchical extreme value modeling approach with heterogeneity in means and variances for traffic conflict-based crash estimation. J. Transp. Eng. Part A Syst. 2022, 149, 04022056. [Google Scholar] [CrossRef]
  15. Shen, L. Freeway Interchange Traffic Safety Analysis Method Based on Traffic Conflict Technique. Ph.D. Thesis, Southeast University, Nanjing, China, 2017. [Google Scholar]
  16. Wen, H.Y.; Wu, J.B.; Qi, W.W. CP-CS Fusion Model for On-Ramp Merging Area on the Highway. J. South China Univ. Technol. 2020, 48, 50–57. [Google Scholar]
  17. Arun, A.; Haque, M.M.; Washington, S.; Sayed, T.; Mannering, F. How many are enough?: Investigating the effectiveness of multiple conflict indicators for crash frequency-by-severity estimation by automated traffic conflict analysis. Transp. Res. Part C Emerg. Technol. 2022, 138, 103653. [Google Scholar] [CrossRef]
  18. Katrakazas, C.; Theofilatos, A.; Islam, M.A.; Papadimitriou, E.; Dimitriou, L.; Antoniou, C. Prediction of rear-end conflict frequency using multiple-location traffic parameters. Accid. Anal. Prev. 2021, 152, 106007. [Google Scholar] [CrossRef]
  19. Wang, J.; Wen, C.; Zhang, X.; Xu, T.; Zhang, Y. Difference of Vehicle Following Behavior in Different Lanes of Freeway Merging Area. Transp. Res. 2020, 6, 59–65. [Google Scholar] [CrossRef]
  20. Xinpeng, D. Study on Selection of Super-Multi-Lane Expressway Traffic Organization Mode Based on Traffic Efficiency in Merging Area. Master’s Thesis, Chang’an University, Xi’an, China, 2021. [Google Scholar]
  21. Zhang, X.; Wang, K.; Tao, H. Research on Speed Limit Method of Expressway Main Road Based on Rainy Environment and Its Influence on Vehicle Confluence. In Proceedings of the 19th COTA International Conference of Transportation, Nanjing, China, 6–8 July 2019; pp. 3512–3523. [Google Scholar]
  22. Lu, Y.; Cheng, K.; Zhang, Y.; Chen, X.; Zou, Y. Analysis of lane-change conflict between cars and trucks at merging section using UAV video data. arXiv 2022, arXiv:2201.07881. [Google Scholar]
  23. Park, H.; Bhamidipati, C.; Smith, B. Development and Evaluation of Enhanced IntelliDrive-Enabled Lane Changing Advisory Algorithm to Address Freeway Merge Conflict. Transp. Res. Rec. J. Transp. Res. Board 2011, 2243, 146–157. [Google Scholar] [CrossRef]
  24. Wu, J.; Chen, X.; Bie, Y.; Zhou, W. A co-evolutionary lane-changing trajectory planning method for automated vehicles based on the instantaneous risk identification. Accid. Anal. Prev. 2023, 180, 106907. [Google Scholar] [CrossRef]
  25. Xie, K.; Ozbay, K.; Yang, H.; Li, C. Mining automatically extracted vehicle trajectory data for proactive safety analytics. Transp. Res. Part C Emerg. Technol. 2019, 106, 61–72. [Google Scholar] [CrossRef]
  26. Lu, J.; Grembek, O.; Hansen, M. Learning the representation of surrogate safety measures to identify traffic conflict. Accid. Anal. Prev. 2022, 174, 106755. [Google Scholar] [CrossRef]
  27. Ma, Y.; Zhu, J. Left-turn conflict identification at signal intersections based on vehicle trajectory reconstruction under real-time communication conditions. Accid. Anal. Prev. 2021, 150, 105933. [Google Scholar] [CrossRef]
  28. Mayerhofer, A.; Haas, I.; Gabriel, F.; Friedrich, B. Identifying Conflict Points for the Examination of Automated Vehicles in the Presence of Vulnerable Road Users. Transp. Res. Procedia 2020, 47, 609–616. [Google Scholar] [CrossRef]
  29. Xin, G. Study on Traffic Conflicts Prediction Model of Freeway Interchange Merging Areas. Ph.D. Thesis, Southeast University, Nanjing, China, 2020. [Google Scholar]
  30. Riedmaier, S.; Ponn, T.; Ludwig, D.; Schick, B.; Diermeyer, F. Survey on scenario-based safety assessment of automated vehicles. IEEE Access 2020, 8, 87456–87477. [Google Scholar] [CrossRef]
  31. Allen, B.L.; Shin, B.T.; Cooper, P. Analysis of traffic conflicts and collisions. Transp. Res. Rec. 1978, 667, 67–74. [Google Scholar]
  32. Zhang, Y.; Liu, S.; Qiu, Z.; Yao, D.; Peng, L. Pedestrian-vehicle conflict parameter analysis and safety evaluation. J. Harbin Inst. Technol. 2012, 44, 123–128. [Google Scholar]
  33. Kuznetsova, A.; Maleva, T.; Soloviev, V. Detecting apples in orchards using YOLOv3 and YOLOv5 in general and close-up images. In Proceedings of the International Symposium on Neural Networks, Cairo, Egypt, 4–6 December 2020; pp. 233–243. [Google Scholar]
  34. Wojke, N.; Bewley, A.; Paulus, D. Simple online and realtime tracking with a deep association metric. In Proceedings of the 2017 IEEE International Conference on Image Processing (ICIP), Beijing, China, 17–20 September 2017; pp. 3645–3649. [Google Scholar]
  35. Wang, T. Research on EMD Algorithm and Its Application in Signal Denoising. Ph.D. Thesis, Harbin Engineering University, Harbin, China, 2010. [Google Scholar]
  36. Wu, Z.; Huang, N.E. Ensemble empirical mode decomposition: A noise-assisted data analysis method. Adv. Adapt. Data Anal. 2009, 1, 1–41. [Google Scholar] [CrossRef]
  37. Zhao, X.; Wang, P.; Zhu, S.; Jiang, R.; Zou, H. Spatial Distribution of Traffic Conflicts in Interchange Merging Area Based on Video Recognition. J. Highw. Transp. Res. Dev. 2021, 38, 90–99. [Google Scholar]
  38. Meng, Q. LightGBM: A Highly Efficient Gradient Boosting Decision Tree. In Proceedings of the 31st Conference on Neural Information Processing Systems (NIPS 2017), Long Beach, CA, USA, 4–9 December 2018; pp. 3147–3155. [Google Scholar]
  39. Friedman, J.H. Greedy function approximation: A gradient boosting machine. Ann. Stat. 2000, 29, 1189–1232. [Google Scholar] [CrossRef]
Figure 1. (a) Merging area with parallel acceleration lanes; (b) Merging area with direct acceleration lanes.
Sustainability 14 16834 g001
Figure 2. Driving environment in the freeway merging area.
Sustainability 14 16834 g002
Figure 3. Schematic diagram of TDTC index calculation.
Sustainability 14 16834 g003
Figure 4. A snapshot of the UAV video.
Sustainability 14 16834 g004
Figure 5. Merging areas of the Guanghe freeway.
Sustainability 14 16834 g005
Figure 6. Process of vehicle merging conflicts.
Sustainability 14 16834 g006
Figure 7. Time-varying law of TDTC.
Sustainability 14 16834 g007
Figure 8. Schematic diagram of lateral conflict calculation.
Sustainability 14 16834 g008
Figure 9. Comparative verification of the conflict sequence.
Sustainability 14 16834 g009
Figure 10. Histogram algorithm structure diagram.
Sustainability 14 16834 g010
Figure 11. Decision tree growth strategy.
Sustainability 14 16834 g011
Figure 12. ROC curve for automatic discrimination of merging conflicts.
Sustainability 14 16834 g012
Table 1. Training dataset.
NO.Field NameMeaning
1ID-1The ID of the ramp Vehicle 1
2X-1The longitudinal position of ramp Vehicle 1
3Y-1The lateral position of ramp Vehicle 1
4VX-1Longitudinal speed of ramp Vehicle 1
5VY-1Lateral speed of ramp Vehicle 1
6AX-1Longitudinal acceleration of ramp Vehicle 1
7AY-1The lateral acceleration of ramp Vehicle 1
8ID-2The ID of the mainline Vehicle 2
9X-2The longitudinal position of mainline Vehicle 2
10Y-2The lateral position of mainline Vehicle 2
11VX-2Longitudinal speed of mainline Vehicle 2
12VY-2Lateral speed of mainline Vehicle 2
13AX-2Longitudinal acceleration of mainline Vehicle 2
14AY-2The lateral acceleration of mainline Vehicle 2
15ID-3The ID of the mainline Vehicle 3
16X-3The longitudinal position of mainline Vehicle 3
17Y-3The lateral position of mainline Vehicle 3
18VX-3Longitudinal speed of mainline Vehicle 3
19VY-3Lateral speed of mainline Vehicle 3
20AX-3Longitudinal acceleration of mainline Vehicle 3
21AY-3The lateral acceleration of mainline Vehicle 3
22TDTCThe merging conflict between Vehicle 1 and 2
Table 2. Conflict data collection.
CategoryNumber
Merging trajectory294
Number of TDTC obtained by using the previous method157
Number of merging conflict sequences157
Number of TDTC contained in the conflict sequences2174
Table 3. Vehicle speed comparison at the upstream of the acceleration lane.
CategoryAverage Speed (m/s)
Vehicles causing serious conflicts16.5
Other merging vehicles14.8
Table 4. Speed comparison between mainline vehicles and ramp vehicles.
Mainline VehicleRamp Vehicle before Merging into the MainlineRamp Vehicle after Merging into the Mainline
Average speed20.4318.1617.03
Speed variance5.022.328.41
Standard deviation2.201.452.69
Table 5. Feature variables of LightGBM.
Variable ClassificationVariableTypeRangeMeaning
Dependent variable y Discrete variable0–3Severity of conflict
Independent variable x 1 Continuous variable0.2–22.3 (m/s)The lateral speed difference between the ramp vehicle and the ahead mainline vehicle
x 2 Continuous variable3.4–28.4 (m/s)The longitudinal speed difference between the ramp vehicle and the ahead mainline vehicle
x 3 Continuous variable0.1–22.3 (m)Lateral distance difference between the ramp vehicle and the ahead mainline vehicle
x 4 Continuous variable7.6–20.5 (m)Longitudinal distance difference between the ramp vehicle and the ahead mainline vehicle
x 5 Continuous variable0–18.2 (m/s)The lateral speed difference between the ramp vehicle and the back mainline vehicle
x 6 Continuous variable0–4.5 (m/s)The longitudinal speed difference between the ramp vehicle and the back mainline vehicle
x 7 Continuous variable0.1–25 (m)Lateral distance difference between the ramp vehicle and the back mainline vehicle
x 8 Continuous variable8.3–25 (m)Longitudinal distance difference between the ramp vehicle and the back mainline vehicle
x 9 Continuous variable0–3.67Standard deviation before merging
x 10 Continuous variable0–5.35Standard deviation after merging
x 11 Discrete variable1–3Merging position of ramp vehicles
x 12 Continuous variable−1.5–1.1 ( m / s 2 )The lateral acceleration of the ramp vehicle
x 13 Continuous variable−3.9–3.9 ( m / s 2 )Longitudinal acceleration of the ramp vehicle
x 14 Continuous variable−2.8–2.0 ( m / s 2 )The lateral acceleration of the ahead mainline vehicle
x 15 Continuous variable−4.0–4.5 ( m / s 2 )Longitudinal acceleration of the ahead mainline vehicle
x 16 Continuous variable−1.8–1.9 ( m / s 2 )The lateral acceleration of the back mainline vehicle
x 17 Continuous variable−4.0–3.9 ( m / s 2 )Longitudinal acceleration of the back mainline vehicle
x 18 Continuous variable−3.14–−3.07Merging Angle
x 19 Continuous variable11.4–251.9 (m)Headway between the mainline vehicles
Table 6. Parameter settings of the automatic discrimination model for merging conflicts.
ParameterDescriptionValue
boosting_typeTraining methodGBDT
objectiveTraining objectiveMulti-classification
metricEvaluation indicatorsMulti-classification log loss
n_estimatorsNumber of iterations5000
learning_rateLearning rate0.05
max_depthMaximum depth1000
num_leavesNumber of leaves of a single tree50
min_data_in_leafMinimum number of samples of leaf nodes4
max_binFeature capacity25
early_stopping_roundNumber of iterations required to stop early500
Table 7. Evaluation indexes of the automatic discrimination model of merging conflicts.
CategoryDetection RateCompletion RateF1-SCORE
Severe conflict0.870.820.84
General conflict0.880.870.88
Minor conflict0.890.720.80
No conflict0.930.970.95
Correct rate---0.91
Macro average-0.890.850.87
Weighted average-0.910.910.91
Table 8. Feature importance of an automatic discrimination model of merging conflicts.
FeatureSevere ConflictGeneral ConflictMinor ConflictNo ConflictTotalOrder of Importance
x 8 1.860.722.883.028.481
x 6 0.590.903.332.957.772
x 11 1.870.350.030.182.443
x 5 1.040.280.400.712.434
x 9 0.590.920.230.682.415
x 7 0.400.730.500.662.296
x 10 0.800.540.300.462.117
x 3 0.550.320.230.241.348
x 17 0.760.080.270.151.269
x 18 0.340.220.180.331.0710
x 4 0.340.290.120.241.0011
x 19 0.430.160.110.250.9512
x 12 0.190.070.200.110.5613
x 16 0.180.060.140.080.4514
x 13 0.150.090.160.060.4515
x 14 0.130.110.160.030.4216
x 1 0.180.040.110.030.3617
x 2 0.070.060.100.100.3318
x 15 0.070.040.120.040.2919
Publisher’s Note: MDPI stays neutral with regard to jurisdictional claims in published maps and institutional affiliations.

