Article

Experimental Study on the Axial Compression Performance of Glued Wood Hollow Cylinders Reinforced with BFRP

1
School of Civil Engineering, Central South University of Forestry and Technology, Changsha 410004, China
2
School of Civil Engineering, Xiangtan University, Xiangtan 411100, China
3
China Railway City Construction Group Construction Technology Co., Ltd., Xiangtan 411100, China
4
Taizhou Xintong Information Technology Co., Ltd., Taizhou 225312, China
*
Author to whom correspondence should be addressed.
Sustainability 2022, 14(24), 16827; https://doi.org/10.3390/su142416827
Submission received: 17 November 2022 / Revised: 9 December 2022 / Accepted: 13 December 2022 / Published: 15 December 2022

Abstract

:
The present paper investigates the impact of basalt fiber reinforced polymer (BFRP) on the axial compression performance of glued wood hollow cylinders. This study aims to facilitate the application of BFRP in the field of structural reinforcement of glued wood hollow columns. Ten glued laminated wood hollow columns of the same size were designed and placed into five groups (ZC1 and ZRC2 to ZRC5), of which one group (ZC1), with a total of two pure wooden columns, was not arranged with BFRP, and the remaining two wooden columns in each group were arranged with BFRP at different distances. The destruction mode, ultimate load capacity, load–displacement curve, load–strain curve, and ultimate load capacity–total area of the BFRP paste curve of each specimen were obtained by conducting axial compression tests on five groups of wood columns reinforced with different basalt fiber cloths, which revealed the damage mechanism, the relationship between the ultimate load capacity and total area of BFRP paste, and pointed out the most effective area ratio. The test results show that the destruction mode of axially pressed, glued, laminated wood hollow columns is typical compression buckling damage, mainly manifested as follows: the wood at the middle or end of the specimen under pressure first buckles; then, with the increase in load, the specimen is crushed; at this time, the maximum ultimate bearing capacity of each specimen is in the range of 296.77~375.85 kN, the maximum longitudinal displacement is in the range of 2.77~3.38 mm, and longitudinal cracks appear at the end. It is worth noting that the growth rate of the ultimate bearing capacity varies with the increase in the total area of the BFRP paste. When the total area of the BFRP paste is less than a 3.2 × 105 mm2 range value, the growth rate of the ultimate bearing capacity is faster, and then, the growth rate gradually becomes slower. The optimum BFRP paste area ratio can be taken as k = 0.59. The ultimate bearing capacity after reinforcement increases from 11.06% to 26.65% compared with the pure wood column. According to GB50005-2017, “wood structure design standards” improve the hollow wood column bearing capacity calculation method and fit the BFRP reinforced hollow wood column’s ultimate bearing capacity calculation formula; the errors are within ±10%, which can provide a reference for the practical application of BFRP in the field of reinforcing glued wood hollow cylindrical structures.

1. Introduction

In recent years, the awareness of green development, energy saving, and emission reduction has gradually become popular in the construction field [1,2,3]; in this context, wood is widely used in the construction industry because of the advantages of being lightweight, renewable, and environmental protective [4,5,6] compared with traditional construction materials [7]. China is a large country with abundant wood resources and has built many famous wooden structures since ancient times, such as the Forbidden City in Beijing and the Wujiao Pavilion in Suzhou [8,9]. However, pure wood in wood structures has many natural disadvantages compared with glued wood, such as more knots and the tendency to corrode in humid environments. Therefore, with the passage of time, studies have shown how to strengthen the structural elements of buildings with strengthening and restoration methods [10,11], enhance the strength and stiffness of wood structures [12,13,14,15,16,17], and extend the life of wood buildings without damaging the main structure of wood buildings, thus guaranteeing the normal stresses of existing wood buildings.
At present, many scholars in China and abroad have conducted research on different types of columns and how to strengthen them, and some progress has been made. For example, some scholars [18,19,20] studied the mechanical properties of concrete columns reinforced with basalt fabric fiber reinforced polymer (BFRP). The results showed that the compressive load capacity was significantly higher compared with unreinforced columns, as follows: the peak load and ductility of BFRP-reinforced concrete columns were increased by 5% to 62% and 160.0% to 415.2%, respectively. However, they did not study the compressive performance of BFRP-reinforced wood columns; therefore, it is worth noting that, with the increasing demand of society for sustainable and green building structures, the study of the compressive properties of BFRP-reinforced wooden columns becomes increasingly important, as wood is a better, environmentally friendly material. Some scholars [21,22,23] conducted compression tests on pure wood columns. The tests showed that the pure wood column structure has better axial compression performance, which is revealed by the fact that the down-grain compressive strength of wood compared with the down-grain tensile strength and down-grain shear strength increased by 203.92% to 350% and 462.5 to 868.75%, respectively. However, pure wood columns are less used in wood frame buildings because of many drawbacks, such as more wood knots and unstable forces, and more glued wood column structures are used. Some scholars conducted [24,25] compression tests on prefabricated glulam wood columns reinforced with glass-fiber-reinforced polymer (GFRP) or carbon-fiber-reinforced polymer (CFRP), but they did not use BFRP for glulam wood reinforcement. However, it is worth noting that BFRP has better tensile strength and other mechanical properties compared with GFRP and CFRP [26,27,28,29]; specifically, the tensile strength of BFRP is 31.57% and 8.57% higher than that of GFRP and CFRP, respectively, which can strengthen the wood column structure in practical glue-laminated wood column-reinforcement applications. However, there are few studies on BFRP-reinforced glued wood columns. Wang Jinghui [30] conducted experimental investigations and analyses on the compression performance of columns reinforced by BFRP and studied the effect of different BFRP arrangement parameters (number of BFRP layers, BFRP width) on the axial compression performance of glued laminated wood columns. It was found that different BFRP arrangement parameters had different improvement rates on the axial compression bearing capacity of glued laminated wood, among which, changing the number of BFRP layers contributed the most to the improvement rate of the axial compression bearing capacity of glued laminated wood, and the axial compression bearing capacity specifically increased by 21.37%; changing the BFRP width on the axial compression bearing capacity of glued laminated wood only increased it by 11.68%. It should be noted that they did not study the effect of different spacings of BFRP on the axial compression performance of glued laminated wood and did not provide a single parameter to control the BFRP arrangement scheme with different spacing. Some scholars [31,32,33] conducted axial compression tests on BFRP-reinforced glued laminated wood solid or square hollow cylinders. It was found that the axial compression load capacity did not decrease linearly with the reduction in wood consumption; specifically, the wood consumption of square hollow columns was reduced by 14% to 26% compared with solid columns, but the axial compression load capacity of square hollow columns was only reduced by 3.26% to 7.81% compared with solid columns, indicating that the axial compression load of the glued laminated wood columns with hollow sections did not decrease linearly with the lessened wood consumption. However, the hollow cross-sectional shape of BFRP-reinforced glued laminated wood cylinders in practical engineering applications is mostly circular. Some scholars conducted bias pressure tests on BFRP-reinforced glued laminated wood columns. It was found that the bearing capacity of BFRP-reinforced glued laminated wood columns was significantly improved, specifically, by 6.35% to 18.19%. It is worth noting that they did not study the axial compression performance of glued laminated wood columns under BFRP reinforcement, but there are still more axially compressed glued laminated wood column structures under BFRP reinforcement in practical engineering applications. In view of the shortcomings of the above researchers, we have found that the axial compressive mechanical properties of glued wood hollow columns reinforced by basalt fiber reinforced polymer (BFRP) have not been studied, and the research in the field of the axial compression mechanical properties of glued wood hollow columns with different BFRP spacing arrangements is lacking. However, basalt fiber reinforced rolymer (BFRP), as a new concept of FRP and composite fiber materials, is an ideal material for strengthening and repairing ancient buildings and timber structures in practical applications. Therefore, in order to promote the application of BFRP in glulam hollow cylinder structures, the mechanical properties of glued wood hollow cylinders with different BFRP distance arrangements under axial compression are investigated. An effective BFRP total area is given in this paper so that—when the same volume of glued wood hollow cylinders is strengthened with BFRP in practical engineering applications—there is a convenient way to select the best BFRP arrangement scheme among BFRP spacing schemes according to the most effective BFRP total area in numerous applications, i.e., the single variable of the total BFRP area is used to control the number and spacing of BFRP arrangements. In order to solve the problem of how to determine the total area of effective BFRP for the volume of glulam hollow cylinders different from those in this paper, this paper proposes the concept of BFRP area ratio, that is, the ratio of the total area of BFRP to the area covered by the column body. By keeping the cross-section and volume of the glulam hollow cylinder unchanged, the effective BFRP total area of a glulam hollow cylinder with a known volume and the total surface area of the wood column can be scaled to determine the effective BFRP total area of glulam hollow cylinders in practical engineering. This study provides a technical reference and theoretical basis for strengthening and restoring the wooden structures of timber-frame buildings or ancient buildings with different spacing arrangements of BFRP.
2. Materials and Methods

2.1. Specimens Design

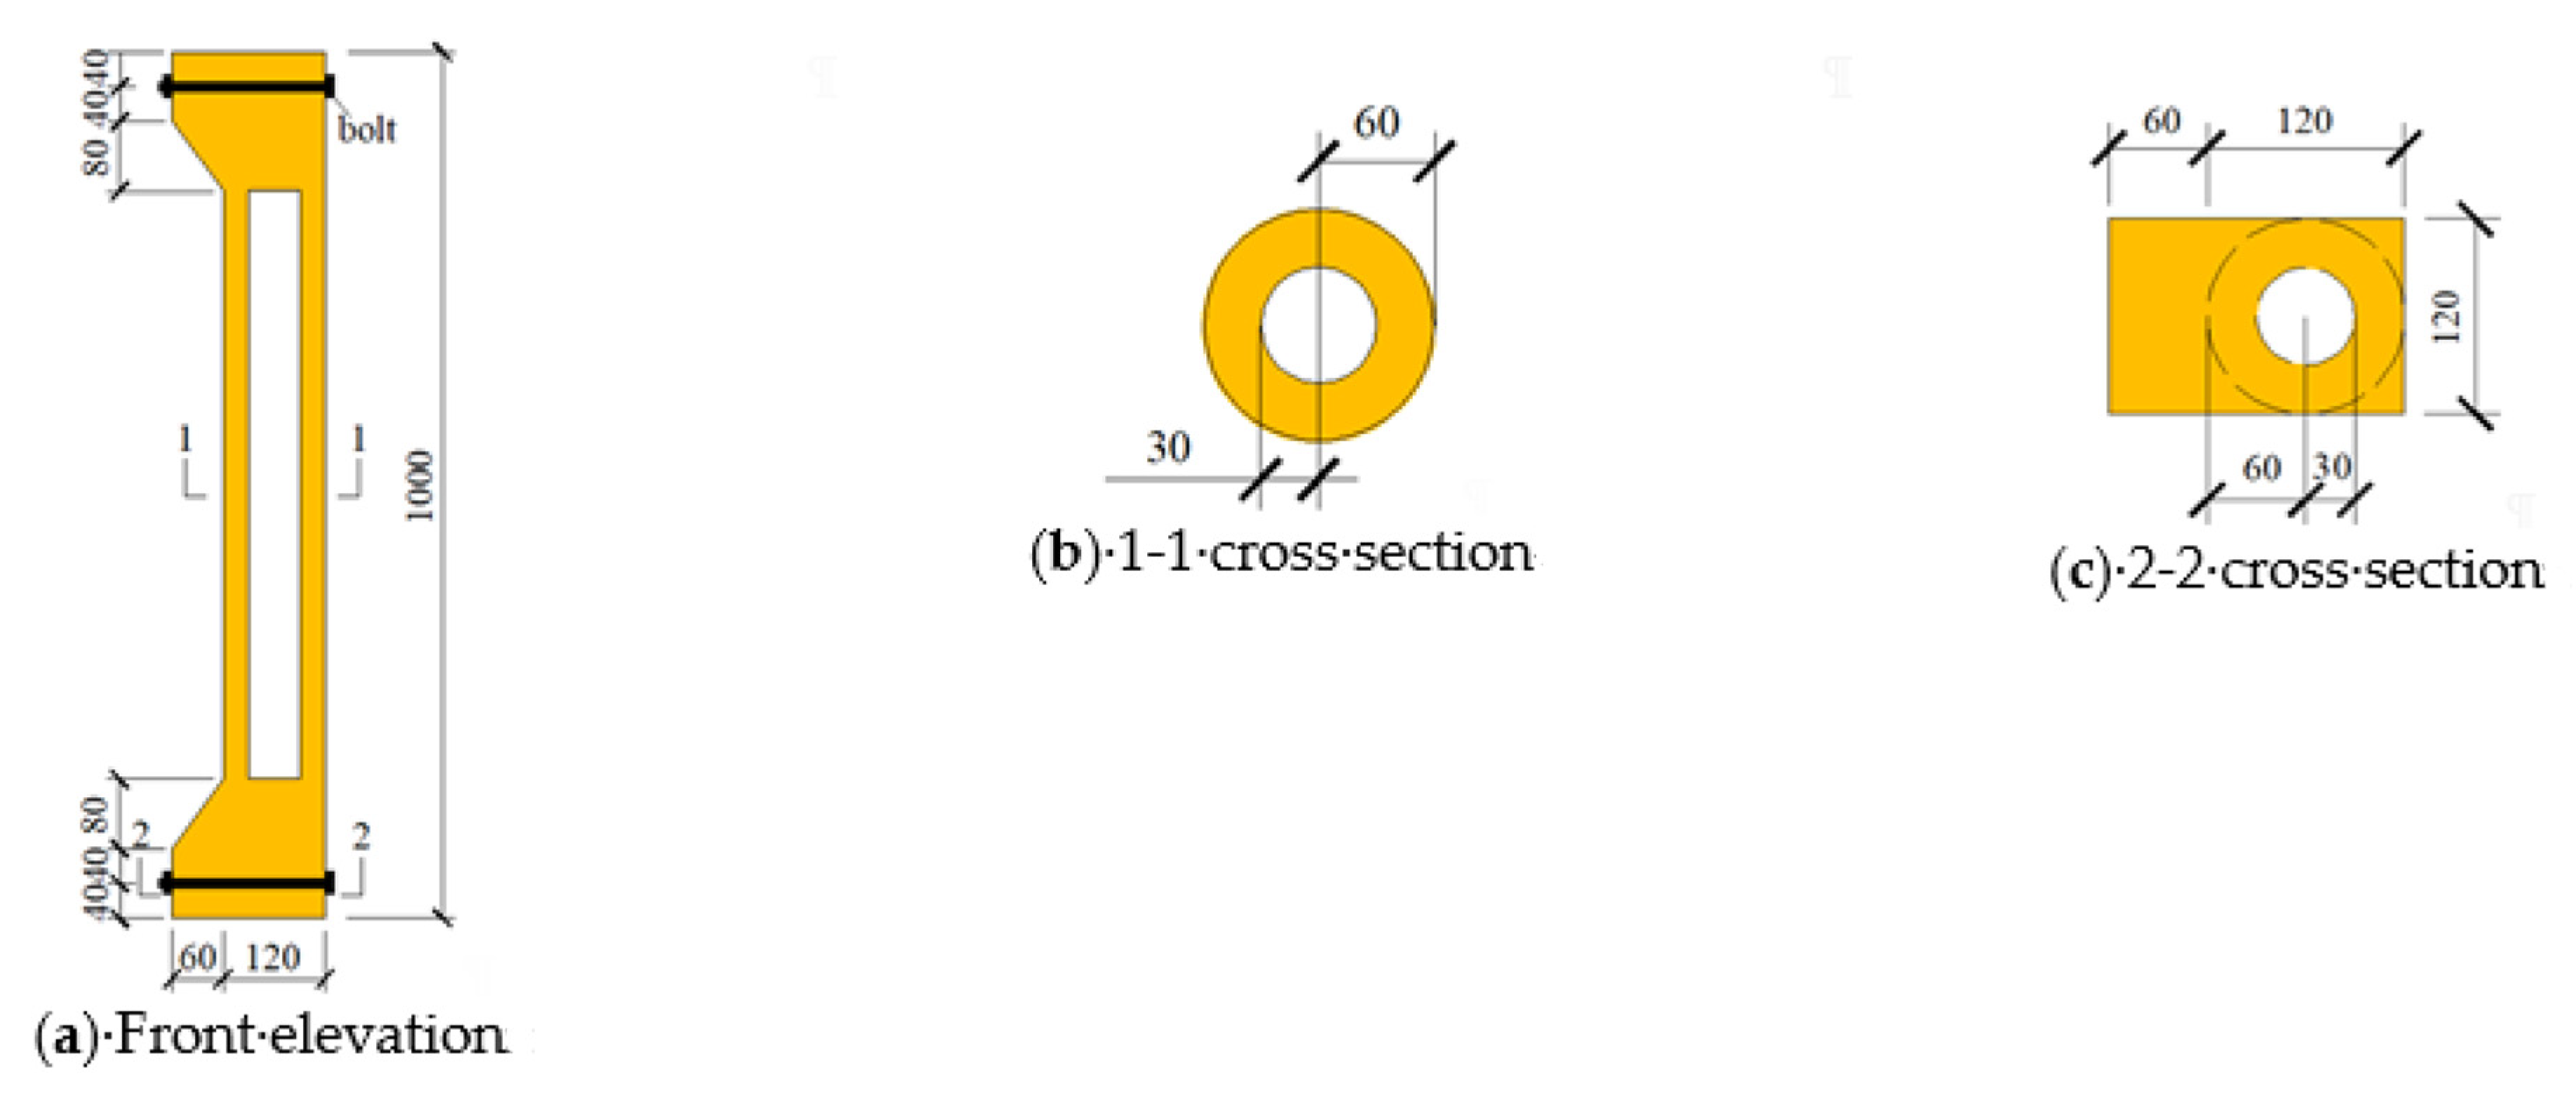
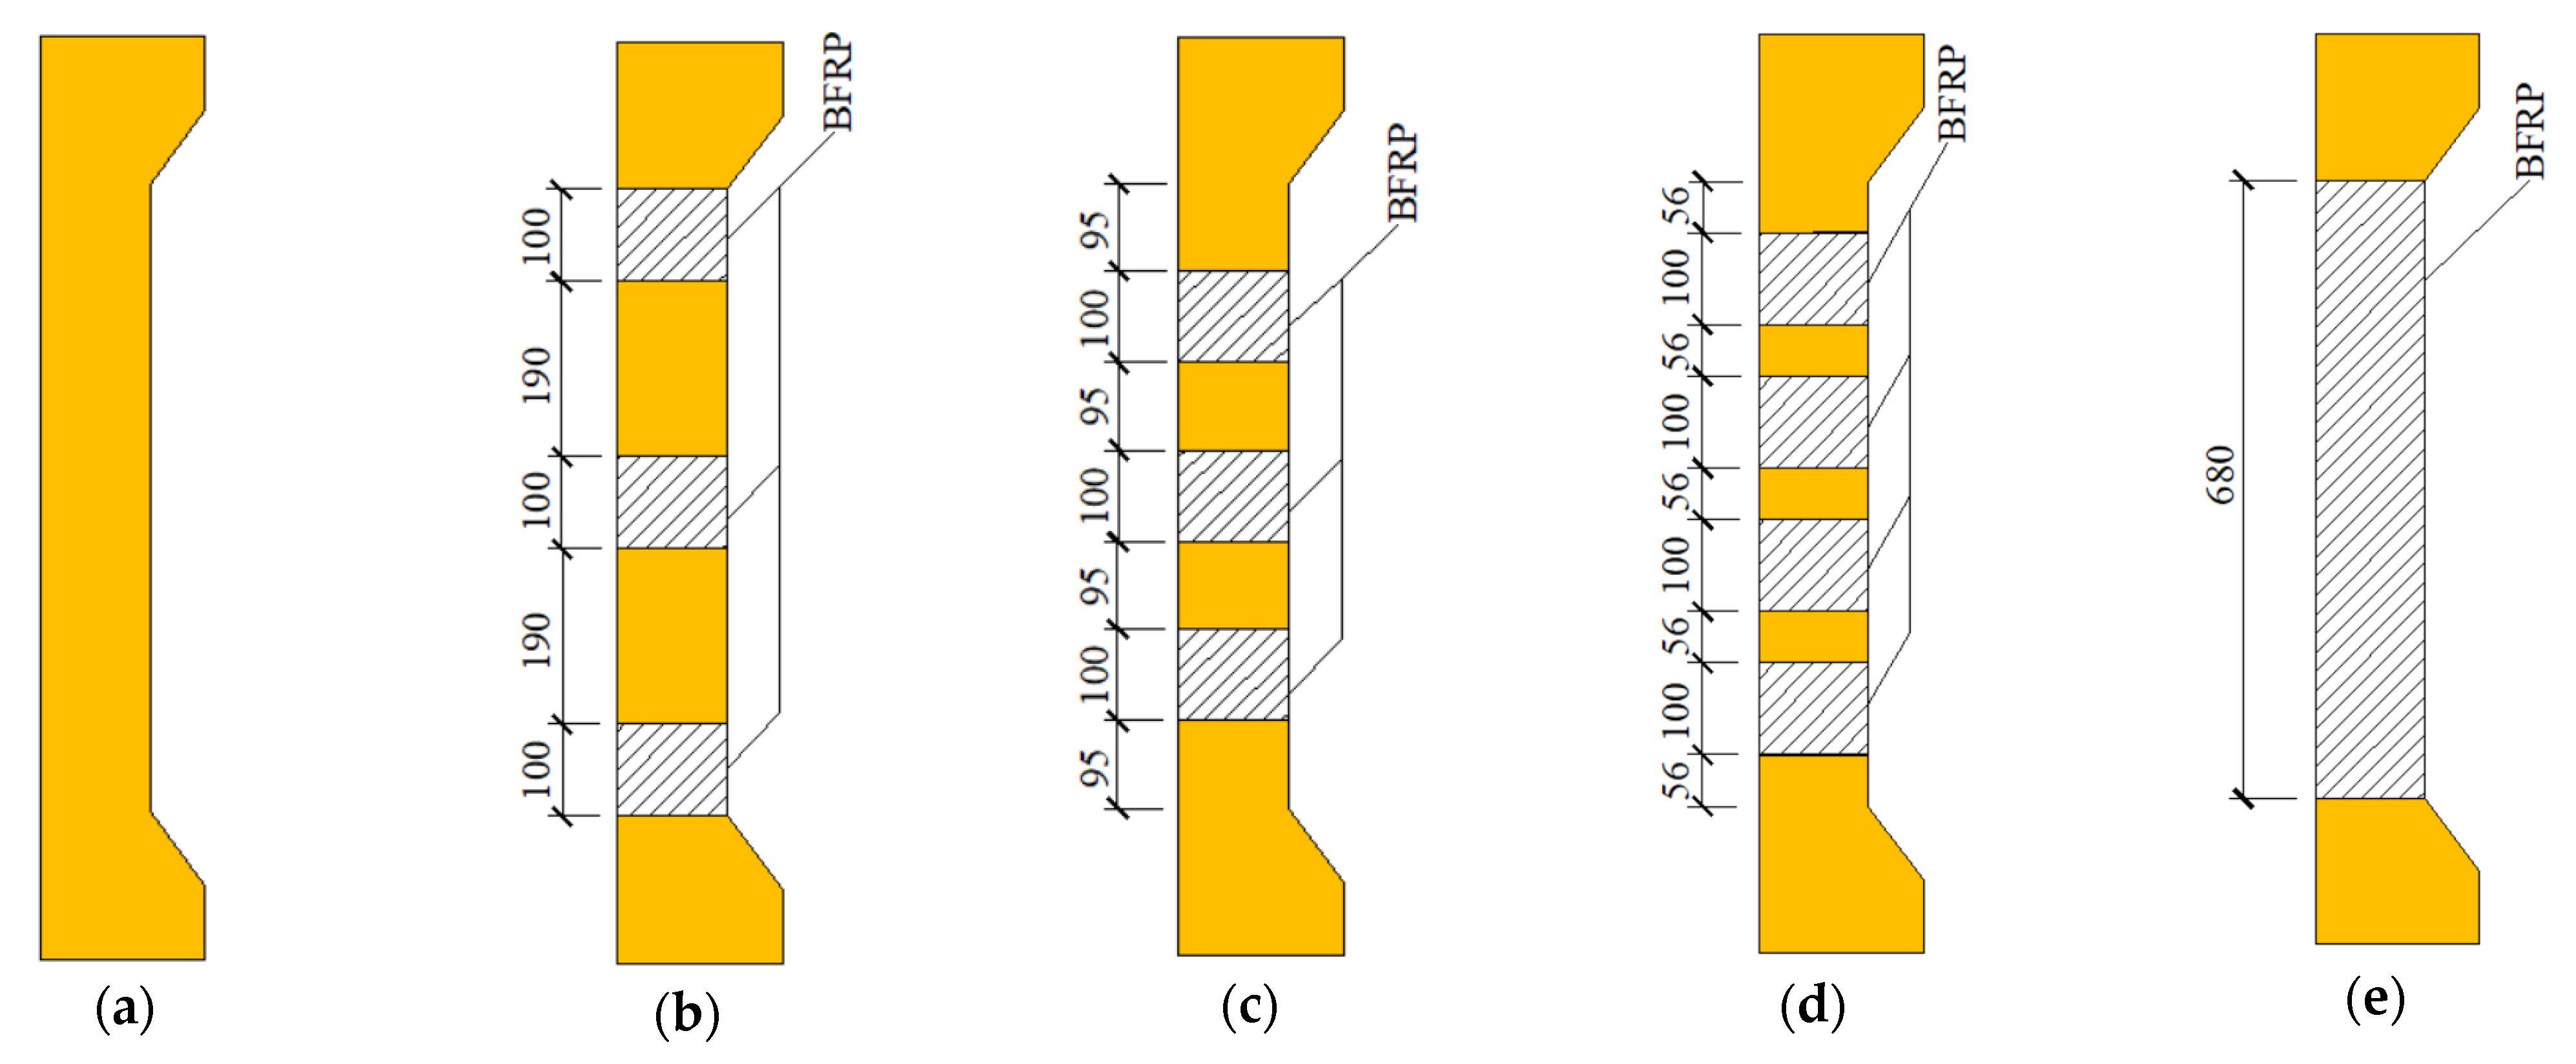
Referring to the relevant provisions in the Standard for the Design of Timber Structures [34] and ASTMD198 [35], 10 glued wood hollow cylindrical specimens with the same external dimensions were designed and fabricated in this paper to conduct axial compression tests. To facilitate axial compression loading, bull legs were pasted at both ends of the wooden columns. Considering that the shear force on the glued surface of the bull legs was too large during the test and could easily cause dislodgement, the bull legs were also strengthened with bolts at the ends of the columns during fabrication. The specific specimen dimensions are shown in Table 1 and Figure 1. According to the different BFRP arrangements, the 10 specimens were divided into 5 groups with 2 specimens in each group (Table 2 and Figure 2), and the specific BFRP arrangement of each group was as follows: in the first group (ZC1), wooden column specimens were not pasted with BFRP; in the second group (ZRC2), wooden column specimens were pasted with 3 strips of BFRP with 190 mm spacing; in the third group (ZRC3), wooden column specimens were pasted with 3 strips of BFRP with 95 mm spacing; and in the fifth group (ZRC5), wooden column specimens were pasted with 4 strips of BFRP with 56 mm spacing. In order to avoid the early destruction of the end of the specimen due to the stress concentration and to improve the BFRP reinforcement effect, two layers of BFRP (total thickness, 1.4 mm) were pasted to it, and the BFRP ring lap length was 47 mm.

2.2. Specimen Fabrication

The specimens required for this test were processed from pretreated domestic Hingan larch-sawn timber, BFRP, and structural adhesive. Referring to the Standard for the Design of Timber Structures [34], the test specimen fabrication process is shown in Figure 3. First, two boards with dimensions of 120 mm × 30 mm × 1000 mm were glued together and planed out into a semicircle, and for the fabrication aspect, the other half was also made according to this method; then, the two planed-out semicircle specimens were glued to a glued wood hollow cylinder and maintained under pressure for 24 h, followed by rounding off the external surface of the wood column. Finally, the BFRP was reinforced along the radial direction.

2.3. Material Properties

Timber properties were tested according to the ASTM standard [35]. The mechanical properties of the wood were obtained from the results of simplified tests according to the Manual for the Structural Design of Wood [36]. The mechanical properties of the structural adhesives and BFRP were in accordance with European Code EN14545 [37,38]. The basic mechanical properties of the wood, structural adhesive, and BFRP are listed in Table 3, Table 4 and Table 5, respectively.

2.4. Test Method and Test Measurement Points

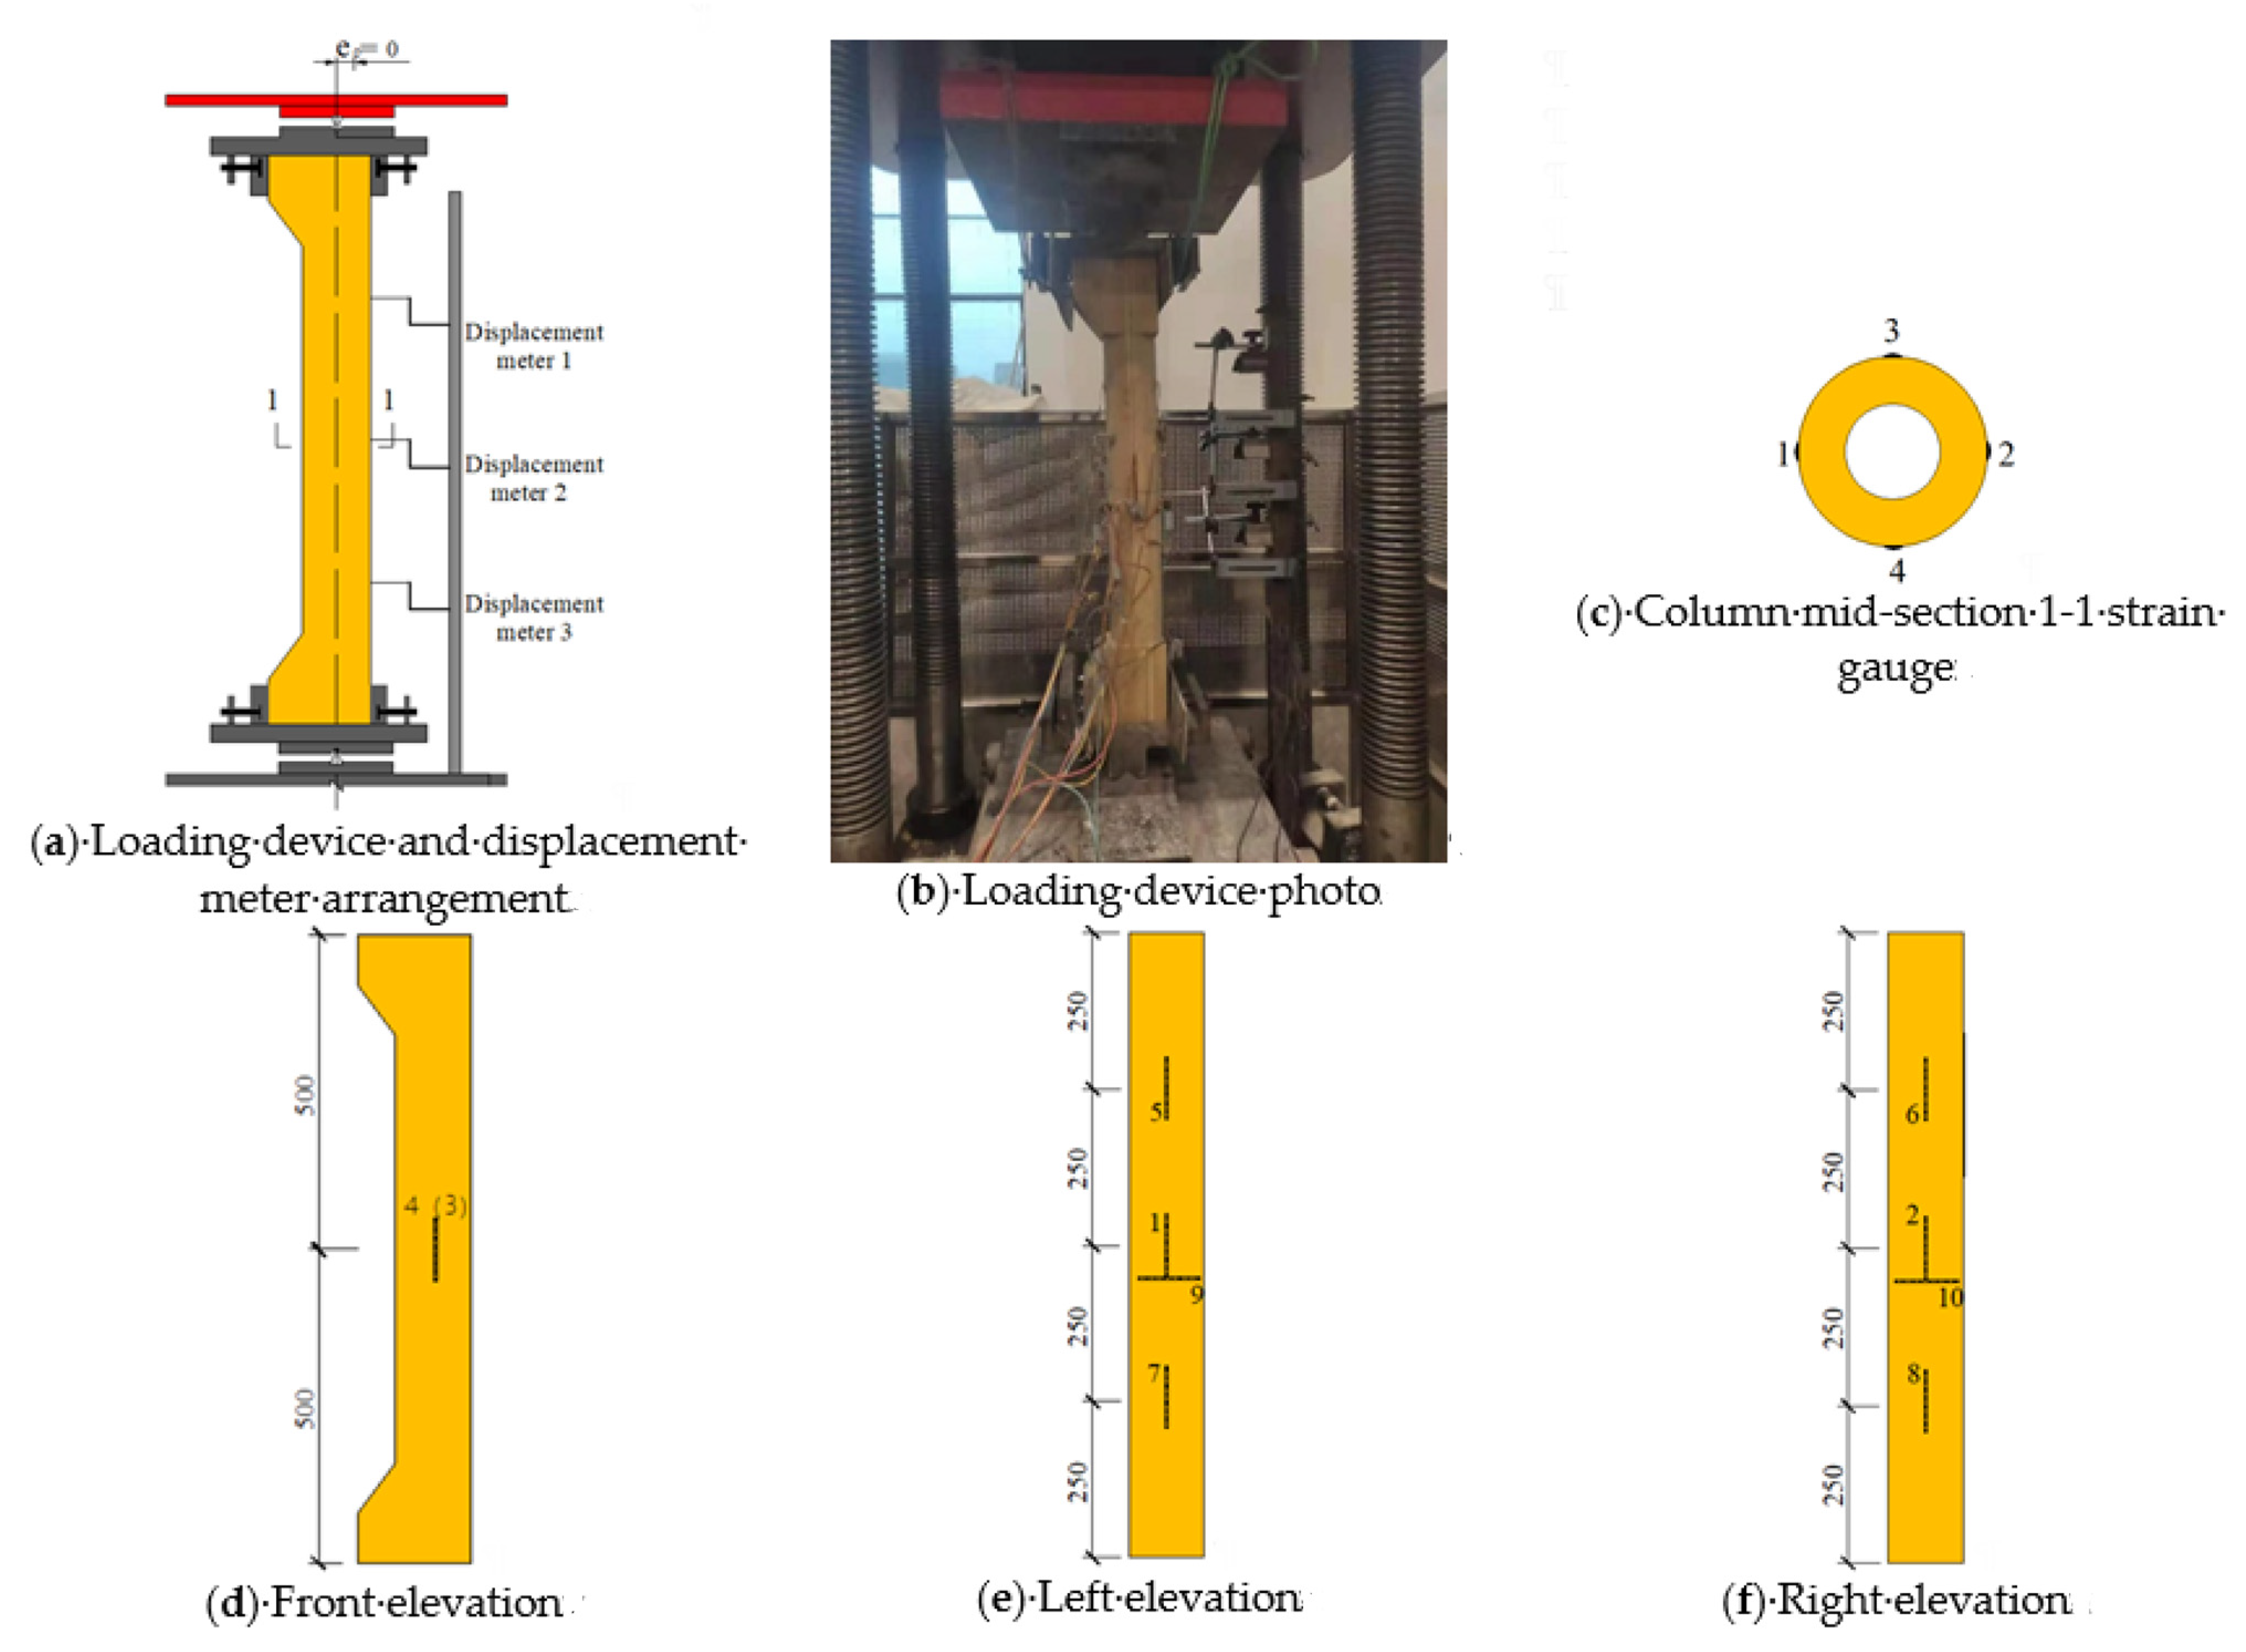
The test was conducted at the Structural Experiment Center of the School of Civil Engineering, Central South University of Forestry Technology. The loading device arrangement shown in Figure 4b includes a 5000 kN electro-hydraulic servo pressure tester (manufactured by Shanghai Hualong Testing Instruments Co.), a DH3861 test system, 100 mm range and 200 mm range displacement transducers, 120-80AA strain gauges, etc. In the early stage, in order to ensure the stability of this loading and the accuracy of the geometric alignment, crosslines were marked on both ends of the wooden column and at the loading plate before the geometric alignment of the wooden column was carried out. According to the Standard for the Design of Timber Structures [34], the two ends of the press were equipped with ball hinges for the axial compression testing of the wood structural members, so there was no need to install additional supports, and the specimen was clamped by the bolts on both sides of the knife hinge after the specimen was installed to prevent the specimen from shifting during the loading process, thus causing an impact from bias pressure.
The arrangement of displacement gauges and strain gauges is shown in Figure 4. In total, 3 transverse displacement gauges were arranged at the 1/4, 1/2, and 3/4 heights of the specimen to measure the transverse deflection of the specimen at that point. The vertical strain gauges were arranged on all four sides of the column. No. 1 and No. 2 strain gauges were arranged symmetrically on the compressive and tensile sides of the column, respectively; No. 3 and No. 4 strain gauges were arranged symmetrically on the neutral axis of the section; No. 5 and No. 7 vertical strain gauges were arranged at the 1/4 and 3/4 heights of the compressive side of the member, respectively; No. 6 and No. 8 vertical strain gauges were arranged at the 1/4 and 3/4 heights of the tensile side of the member, respectively; No. 9 and No. 10 transverse strain gauges were arranged at the 1/4 and 3/4 heights of the member, respectively; and No. 9 and No. 10 transverse strain gauges were arranged on the compressive and tensile sides of the middle section of the member, respectively.
Before the formal loading of the test, preloading was carried out to eliminate the assembly gap and inelastic deformation of the device. The preloading was carried out slowly at a speed of 5 kN/min, and the load was held for one minute until the load reached 15 kN, while the strain was observed on both sides through the strain collector to judge whether the geometric alignment of the specimen was accurate. The test was conducted with load control first and displacement control later, and the load control was graded according to 10% of the theoretical ultimate load, with 15 kN per level and a 15 kN/min loading speed; the holding time was 1 min, and when the load reached the 7th level, which was 70% of the theoretical ultimate load, the specimen was loaded at a loading speed of 2 mm/min according to the displacement control until it was damaged.

3. Results and Discussion

3.1. Failure Mode and Mechanism

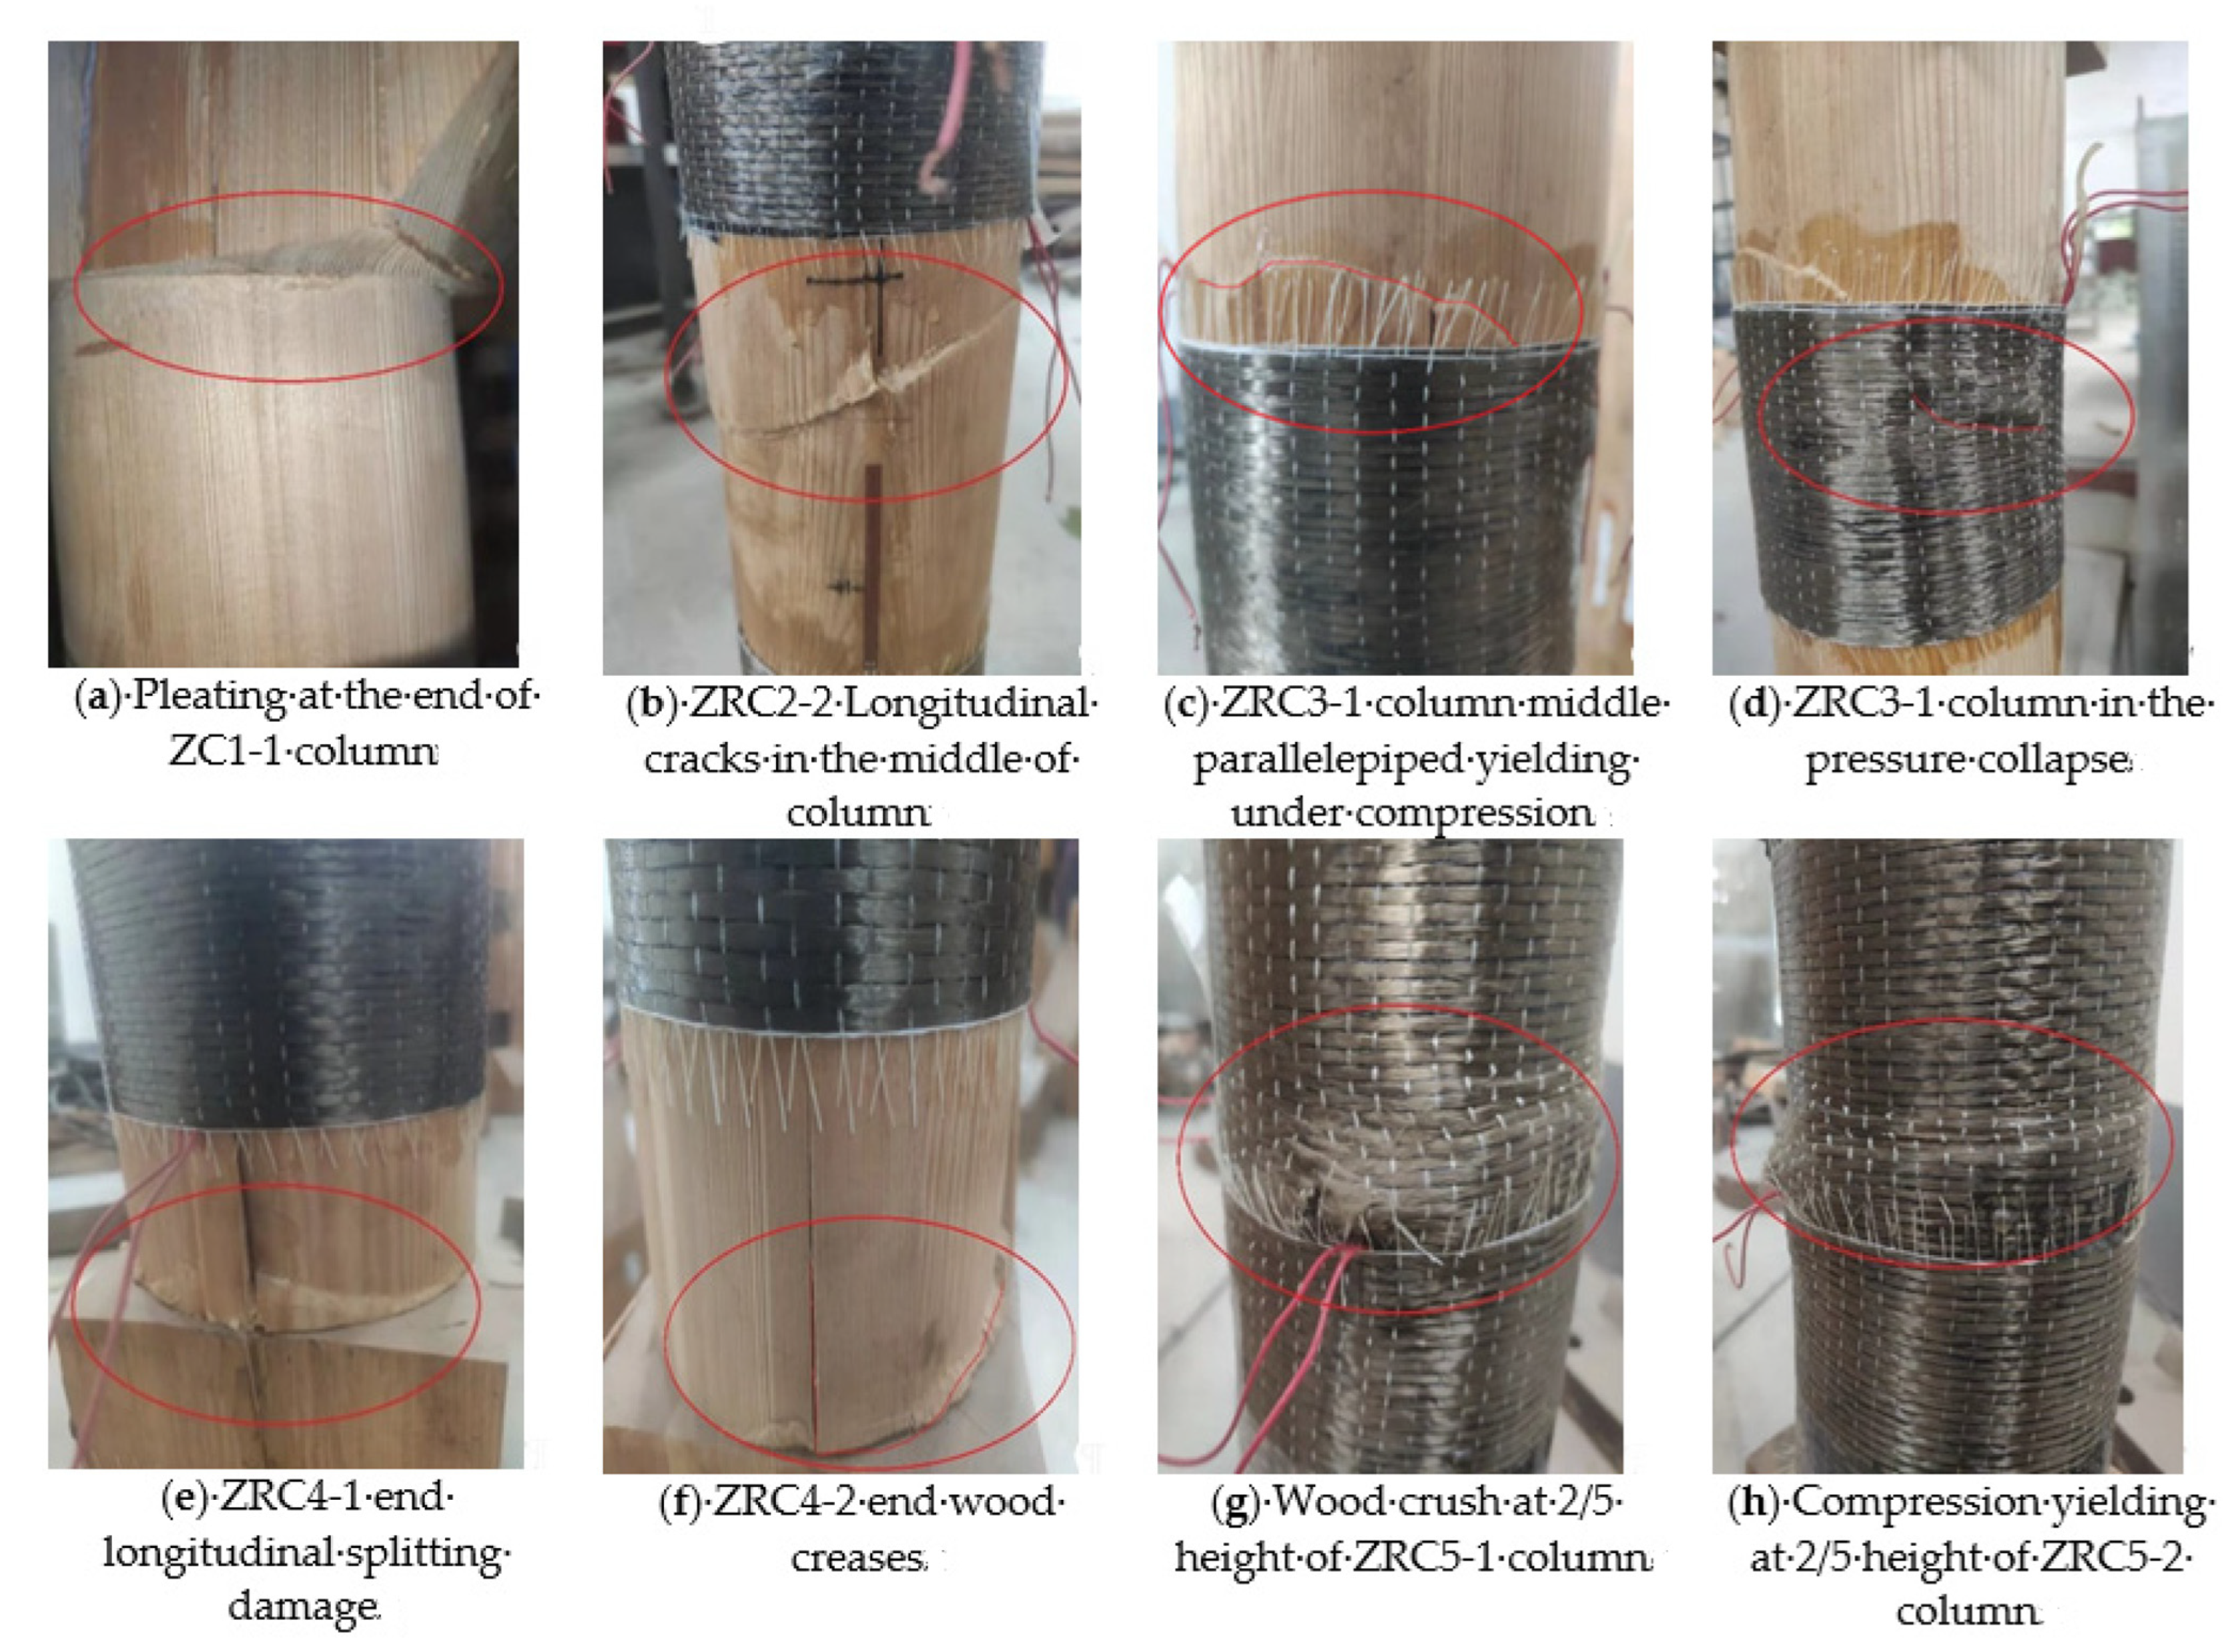
For all specimens, the load–strain curves were linear at the beginning of loading, and the full section was compressed from the strain values. For the pure wood column, ZC1, when the load was close to the ultimate load, the wood on the compressed side of the end of the specimen yielded under compression, and folds appeared at the connection between the end bull leg and the column body (Figure 5a). For the ZRC2 specimen, there was no obvious change before reaching the ultimate load; only a fine wood fiber tearing sound appeared when reaching 310 kN, and then, the load continued to increase until reaching the ultimate load, when a continuous wood fiber tearing sound appeared. Then, the load began to decrease; the damage phenomenon for the wood grain was more sparse where the folds appeared, with the grain yielding under pressure, and longitudinal cracks appeared (Figure 5b). For the ZRC3 specimen, the load reached 186 kN when the fine wood fiber made the sound of a rupture; at 207 kN, a “da “ sound occurred. When the load rose steadily, a wood fiber tearing sound occurred more and more frequently, especially after reaching 237 kN, but the appearance did not display obvious abnormalities. Upon reaching the ultimate load of 296 kN, a larger wood fiber tearing sound occurred continuously, and then, the load began to decline. The damage phenomenon was caused by the collapse of the column, and the wood grain distribution irregular area showed obvious folds (Figure 5c,d). For the ZRC4 specimen, when the ultimate load was reached, the end of the specimen yielded to compression with the grain and then collapsed, and vertical splitting damage occurred (Figure 5e,f). Finally, for the full-applied BFRP column, ZRC5, when the load increased to 330 kN, a fine wood fiber tearing sound occurred, and after reaching 360 kN, a continuous and fine wood fiber tearing sound occurred. After reaching the ultimate load of 375.8 kN, the tearing sound intensified, and the final damage phenomenon was that the column was crushed at 1/3 of its height. The fiber cloth showed obvious bulging and a little fiber filament fracture on the outer side (Figure 5g,h).
Failure mode: From the specimen phenomena, it can be seen that the pure wood hollow cylinders in the axial compression group and the glued laminated wood hollow round columns with BFRP reinforcement both belong to the typical compression buckling failure mode. The main failure mode of both types of specimens is that the wood in the middle or at the end of the compression side first buckles, and then, the specimens are crushed as the load increases. Only group 4 (ZRC4) specimens showed longitudinal splitting damage at the end.
Failure mechanism: For the axially compressed glued wood hollow column in this test, the full cross-section is compressed under the load, and for the wood column without a BFRP restraint, transverse grain tensile damage may occur before the wood reaches its smooth grain compressive strength, leading to longitudinal splitting cracks, which is due to the low transverse grain tensile strength of the wood relative to its smooth grain compressive strength. Therefore, as the load increases, the compression stress in the area of the column body not wrapped in BFRP reacts. In addition, the yielding and crushing in the wrapped area is due to the presence of wood knots in the cross-section, resulting in lower compressive strength in the smooth grain; however, due to the restraining effect of BFRP, there is still a certain compressive stiffness and bearing capacity. BFRP improves the compressive bearing capacity of the wood column but does not change its failure mode.

3.2. Comparative Analysis of Ultimate Bearing Capacity

Table 6 shows the longitudinal and transverse displacements, ultimate bearing capacity, and stress values of each axial compression specimen. As can be seen from Table 6, the errors in the experimental measurement values in two specimens in each group are small, among which, the maximum error is in the longitudinal displacement values of the specimens in the ZCR2 group (ZCR2-1 and ZCR2-2), and this maximum error is only 9.17%; the minimum error is in the ultimate load values of the specimens in the ZCR5 group (ZCR5-1 and ZCR5-2), and the minimum error is only 1.97%. Referring to the statistically relevant specifications, the average value can be taken as the representative value of the measured data of each group of specimens.
As can be seen from Table 6, the ultimate bearing capacity of the BFRP-reinforced wooden columns compared with the pure wooden columns increased to different degrees, among which, the wooden columns full of BFRP increased the most, reaching 26.65%; the bearing capacity of the ZRC2 and ZRC3 specimens are closer; the bearing capacity increased by about 11~14% compared with that of the C1 specimen. Looking at the comparison between specimens ZRC2 and ZRC3, the number of BFRP arrangements is the same, but the lifting rate of ZRC3 is slightly higher than that of ZRC2. The main reason is that the BFRP arrangement of ZRC2 has larger spacing and is arranged at the end, while the BFRP arrangement of ZRC3 has a smaller spacing and is mainly arranged in the middle of the specimen. Furthermore, the stress in the column of the axial compression column is larger, and the transverse deformation is also larger, so it is more beneficial to improve the ultimate bearing capacity of the wood column by placing BFRP centrally in the column and restricting the transverse deformation of the wood in the middle of the column.

3.3. Load–Displacement Curve

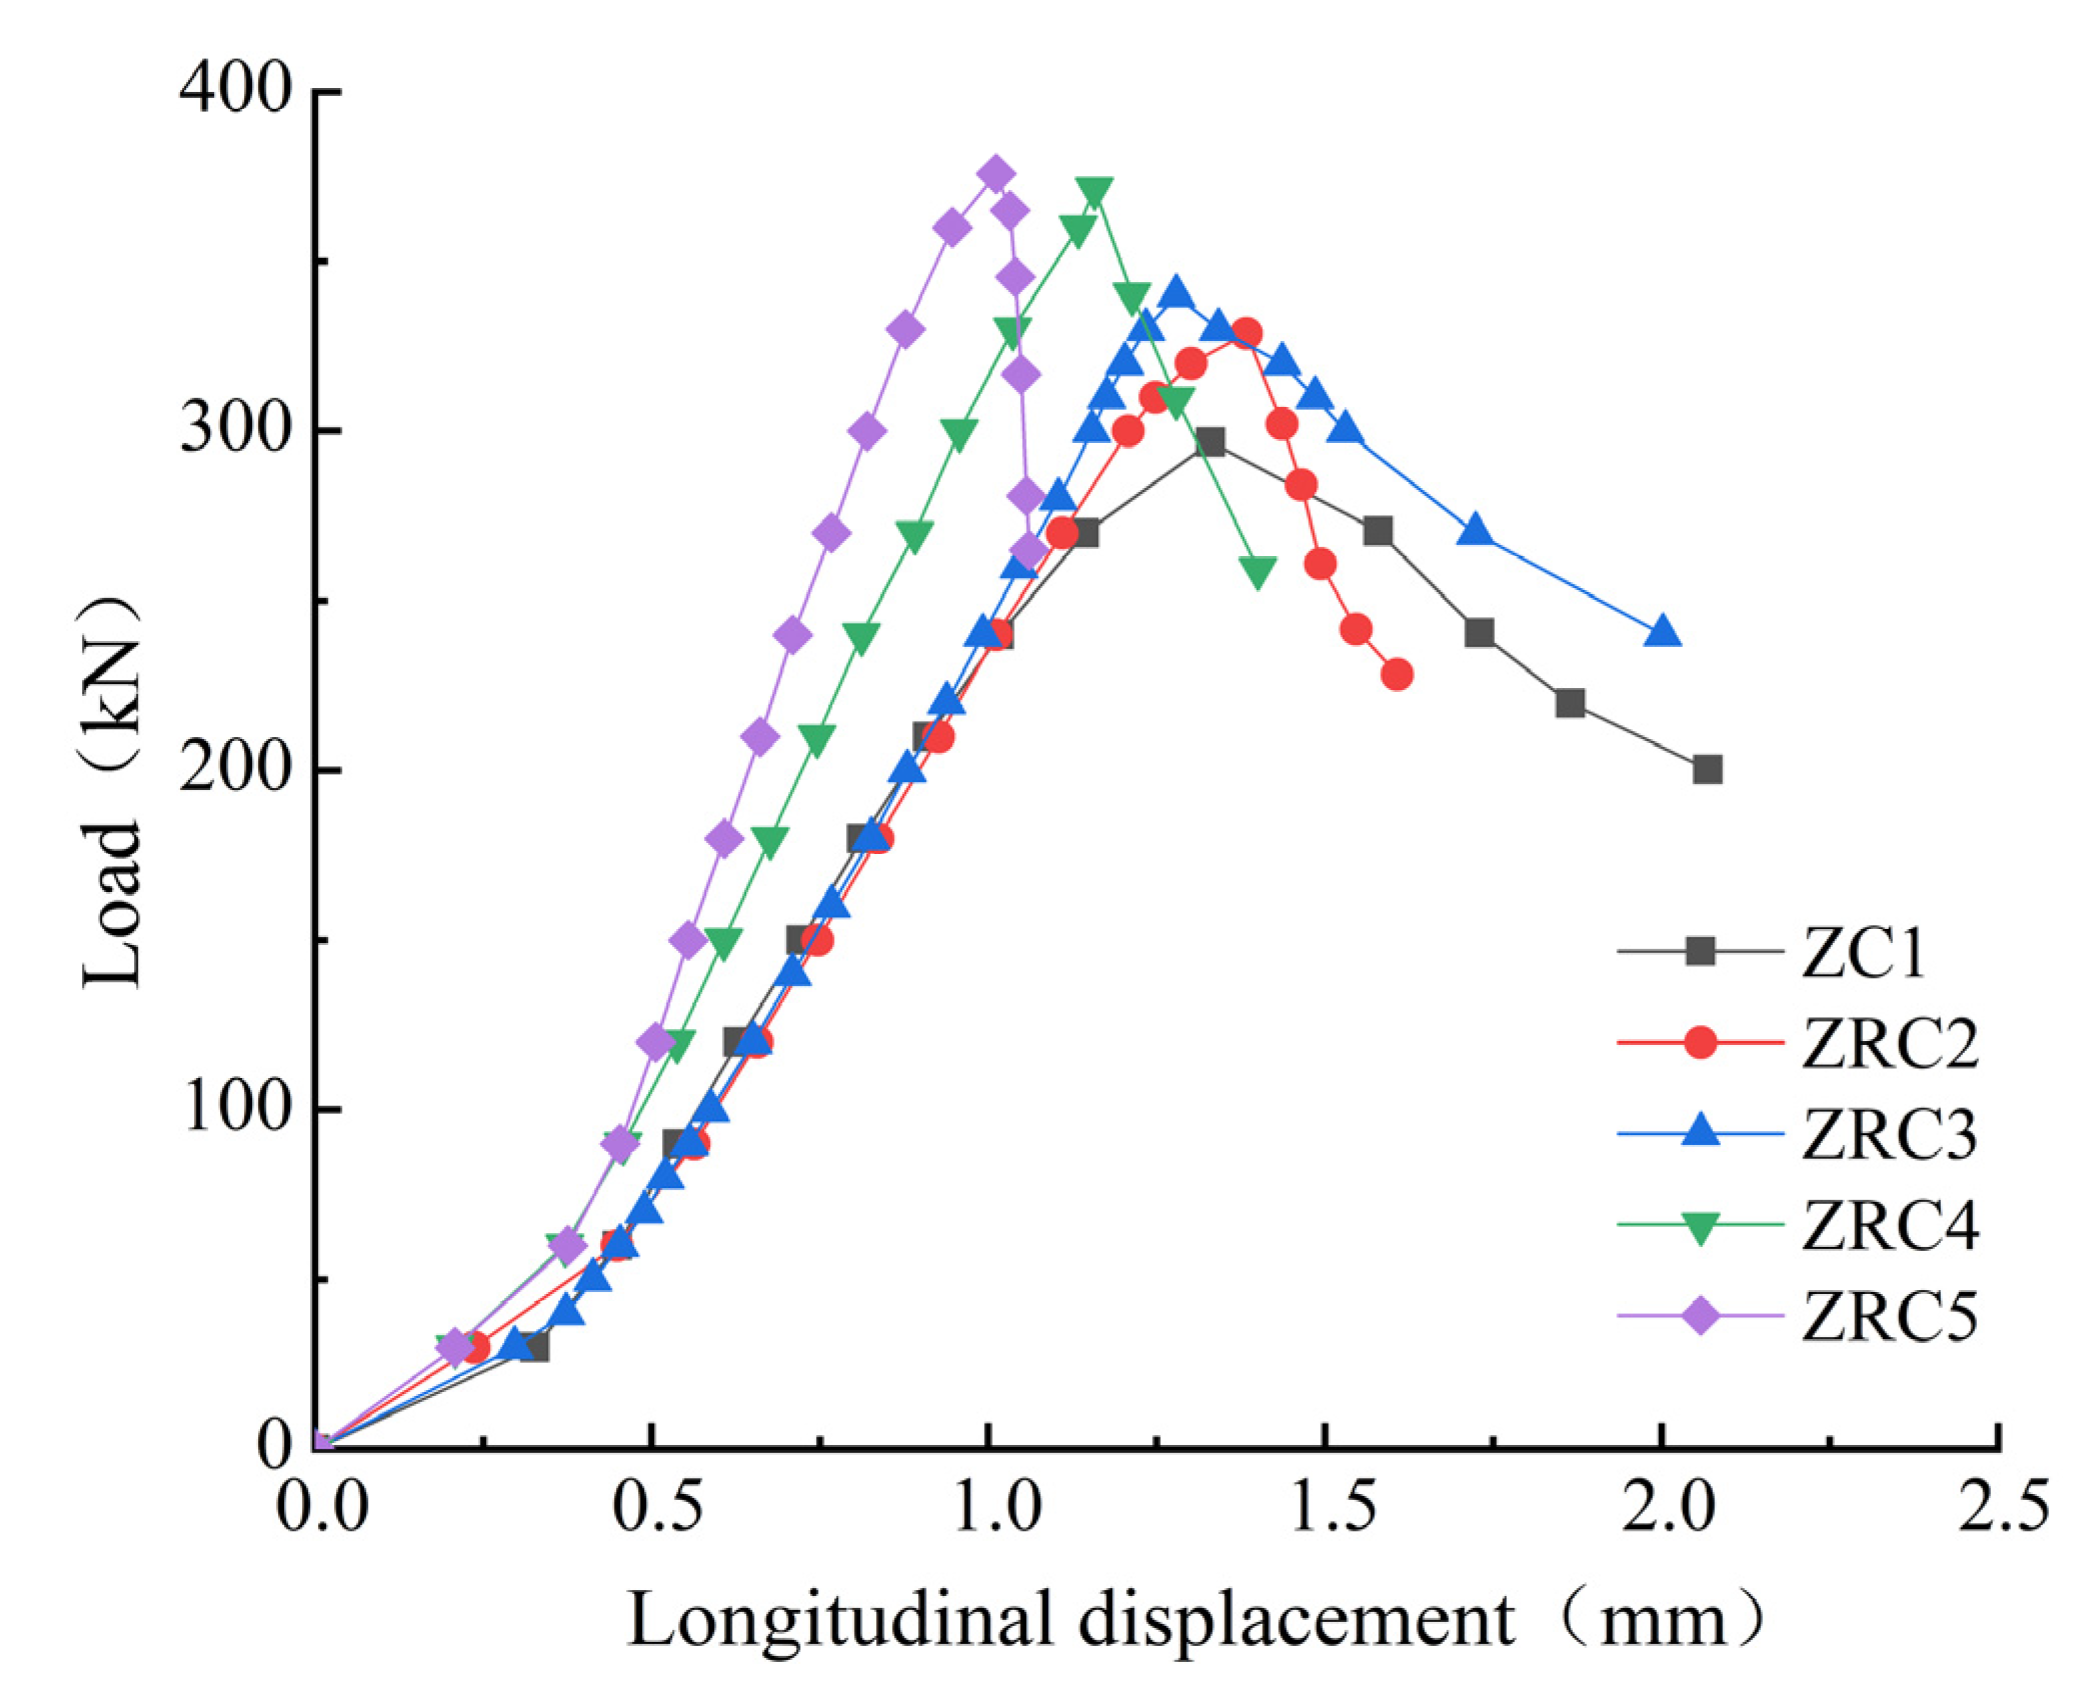
As can be seen from Table 6, the errors in the experimental measurement values of the two specimens in each group are small, and the error range is between 1.97% and 9.17%. It is known from the statistically related specification that the average value can be taken as the representative value of the measured data of each group of specimens; therefore, in this paper, the load–longitudinal displacement curve (Figure 6) was drawn by taking the average values of the load and longitudinal displacement of each specimen in the two groups of axial compression, where a positive longitudinal displacement indicated that the compression of the member occurred. From Figure 6, it can be seen that when the load reached about 30 kN, the assembly gap and inelastic deformation of the specimens were eliminated, and all the specimens began to enter the elastic stage. The inelastic deformation in the early stage did not differ much, and the slopes of ZC1, ZRC2, and ZRC3 were basically the same after entering the elastic stage, which means that there was no big difference in the stiffness of their elastic stages; only when the ultimate load was reached did they enter the plastic stage. The slopes of ZRC2 and ZRC3 were basically the same after entering the elastic phase, which means that there was no big difference in the stiffness of their elastic phases, but there was a difference when the ultimate load reached the plastic phase. Compared with ZRC2, with the same number of pastes, ZRC3 had a better effect on load capacity improvement. The load–longitudinal displacement curves of all specimens were basically linear before the wood reached its yield strength; after the wood reached the compressive yield limit, the load-deflection was nonlinear; after the ultimate load (maximum load) was reached, the bearing capacity of the member began to decrease, but the longitudinal displacement continued to increase, and the loads of ZC1 and ZRC3 decreased slowly with a smoother trend as the displacement continued to increase, indicating that the glued laminated wood hollow cylinder had entered the plastic deformation. The load of ZC1 and ZRC3 decreased slowly with a smoother trend as the displacement continued to increase, indicating that the glued hollow cylinder had entered the plastic deformation stage. The plastic deformation capacity of these two groups was stronger, but their residual stiffness was smaller than the other three groups. From the beginning of loading to the ultimate bearing capacity, when the longitudinal displacement was the same, the ZRC5 column with full BFRP was subjected to the largest load, which means that its longitudinal compressive stiffness was the largest, followed by ZRC4. The ultimate bearing capacity of both groups is not much different; only the stiffness is slightly different, but both are larger than the other three groups. The table test shows that pasting BFRP can effectively increase the longitudinal compressive stiffness of wooden columns, and the more paste on an area, the more obvious the effect. When the pasted area is equal, the smaller the spacing from the middle to the two ends, the better the effect.

3.4. Load–Strain Curve

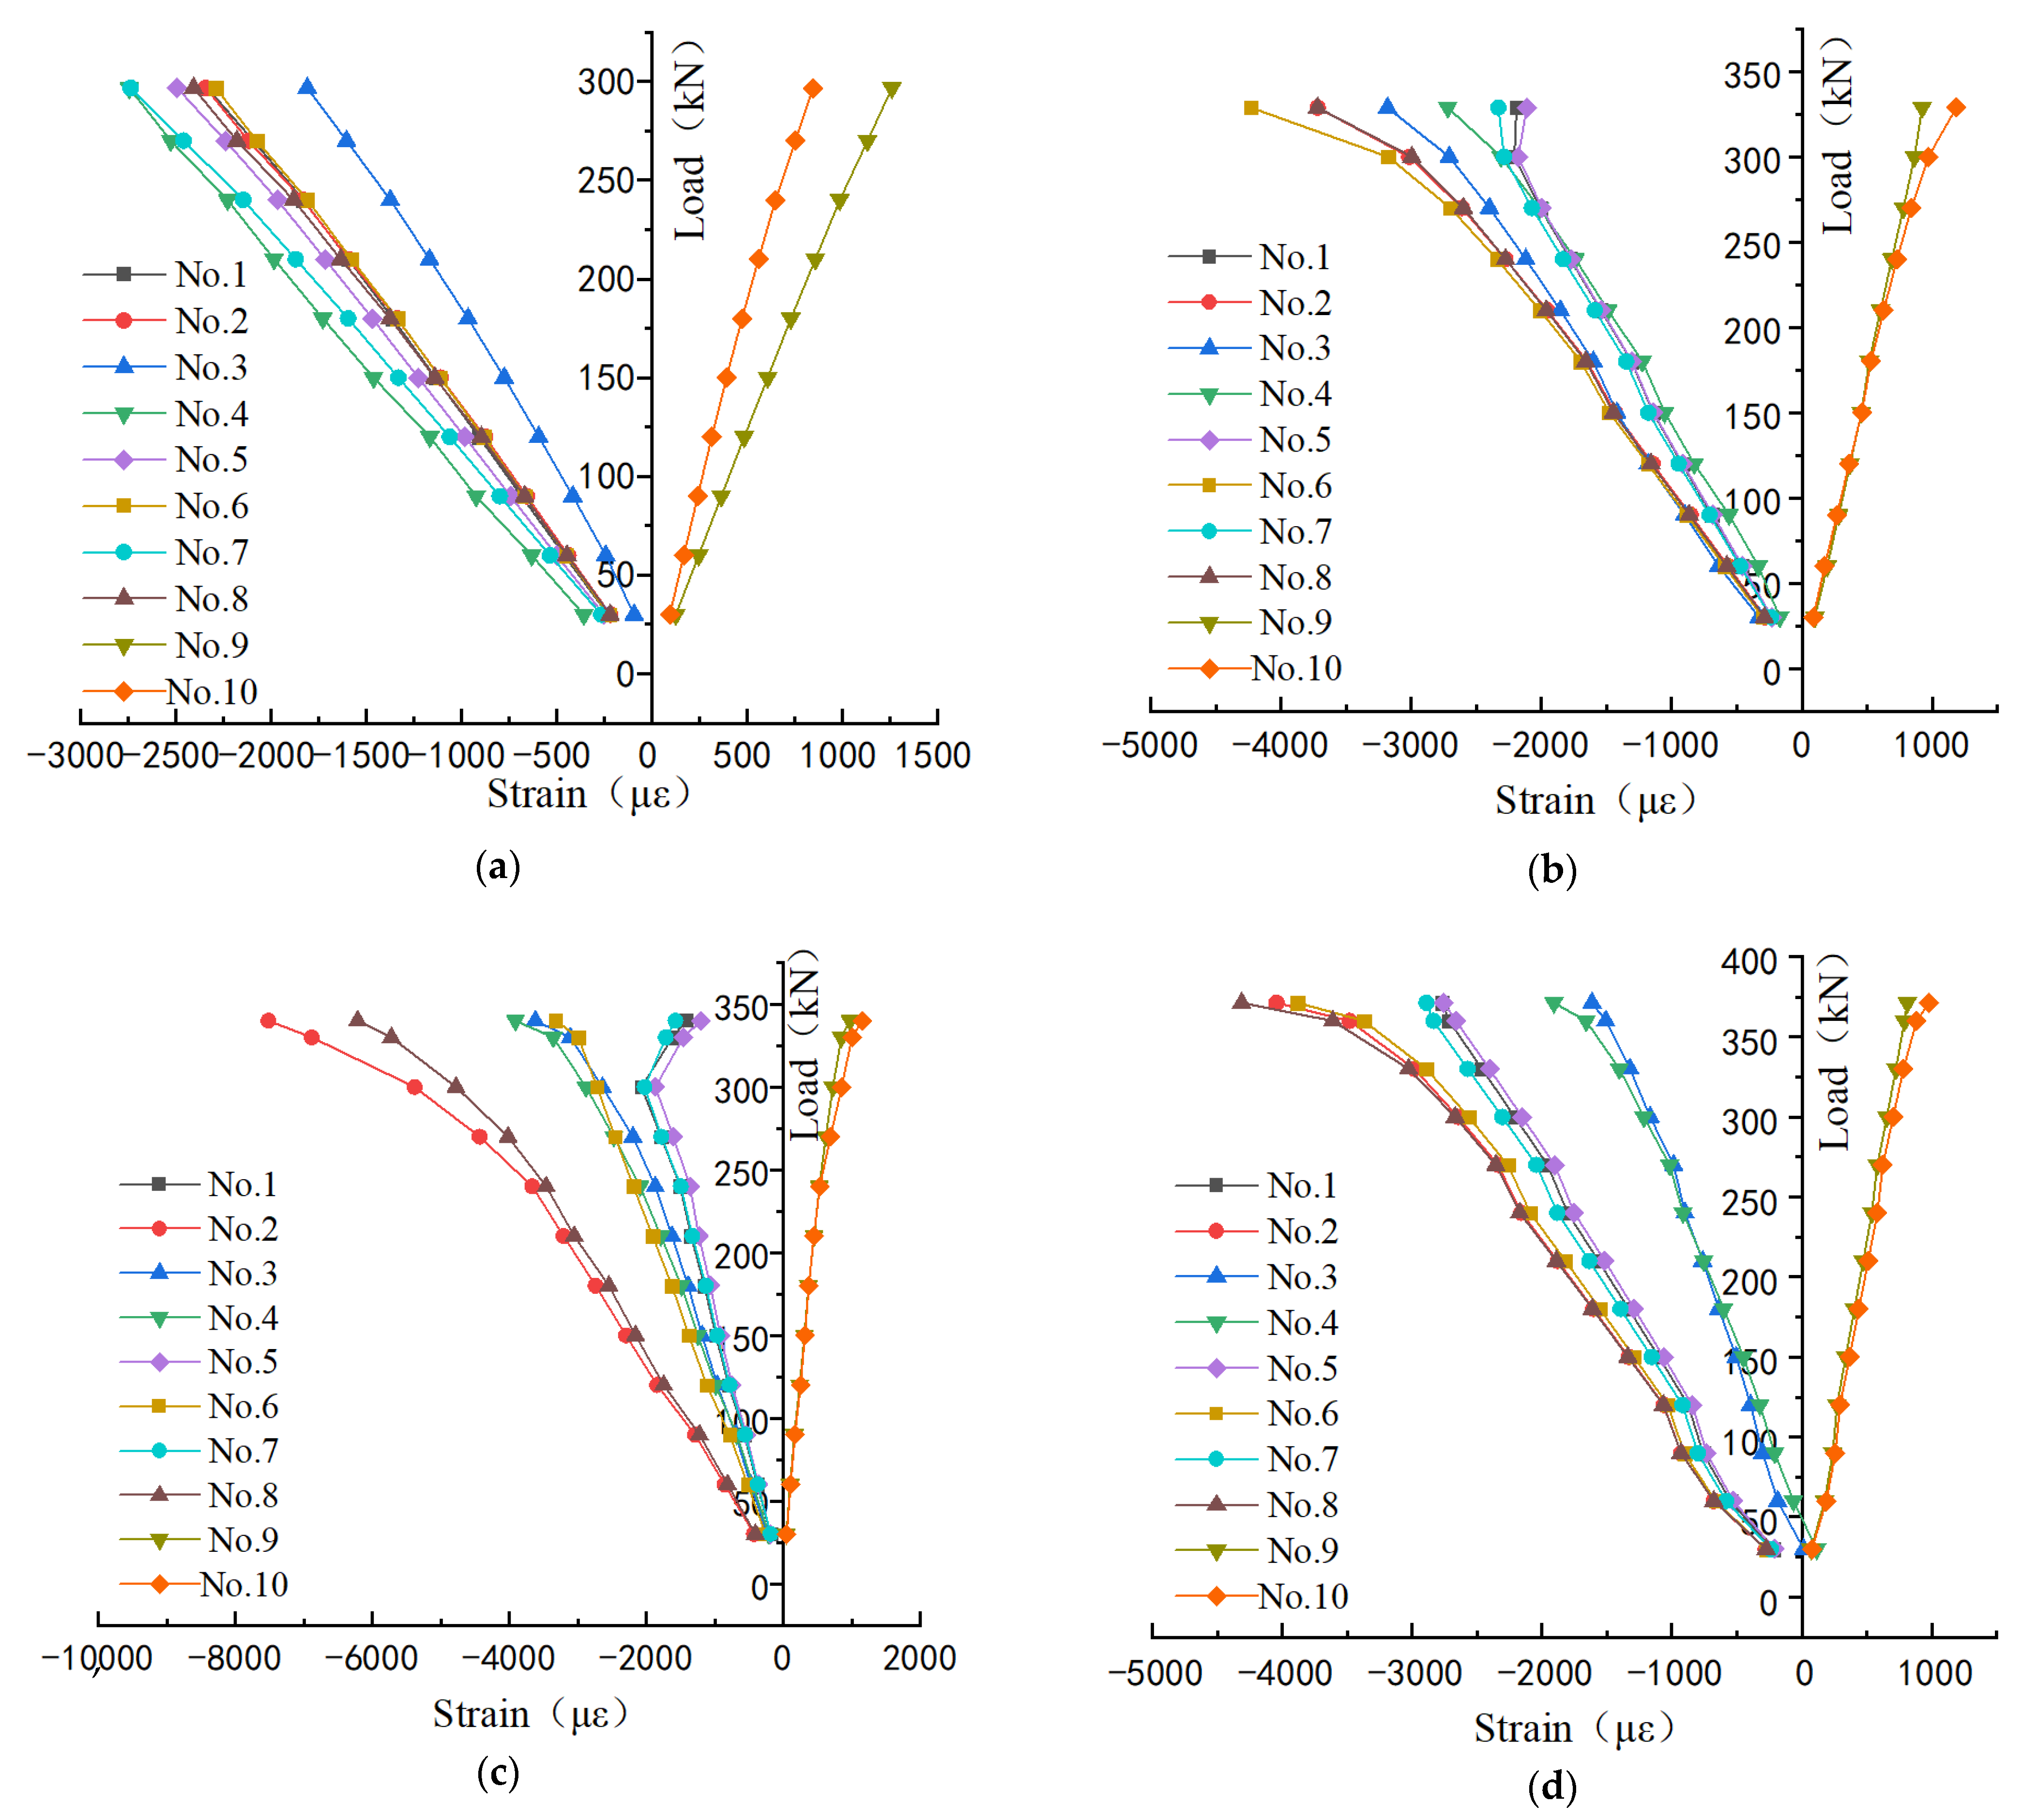
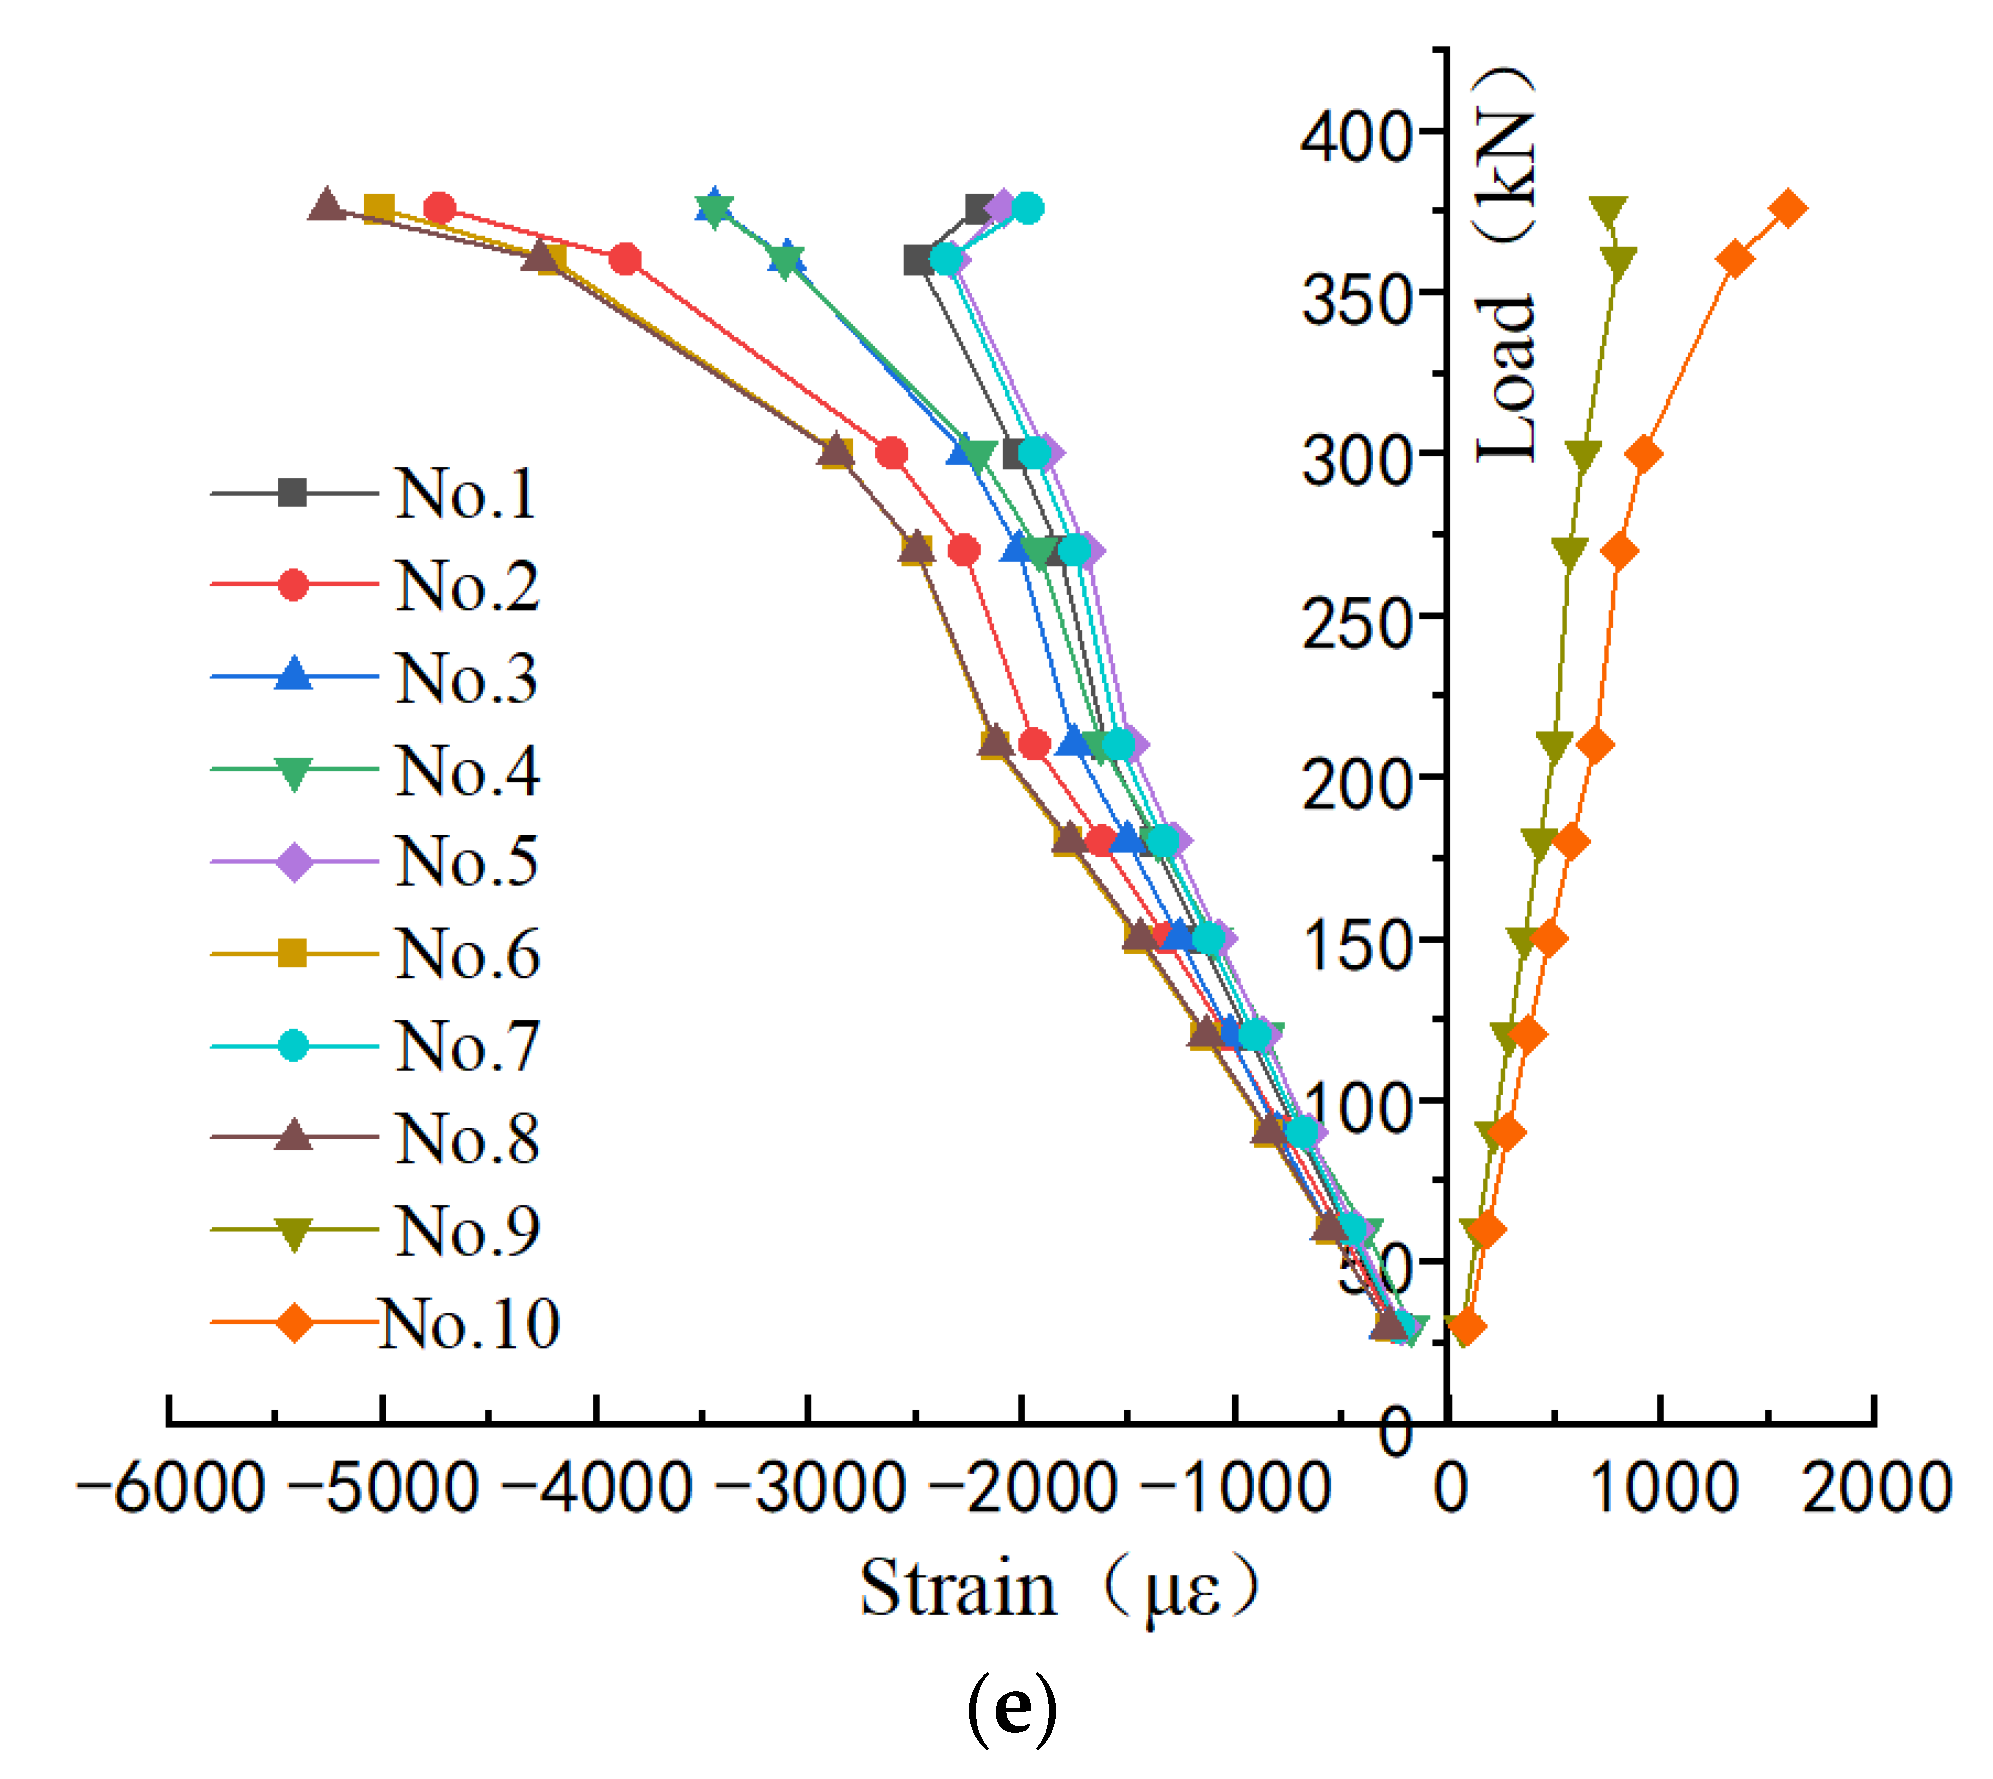
In the test, six strain gauges numbered 1, 2, 3, 4, 9, and 10 were pasted in the middle position of the specimen column, and vertical strain gauges were also arranged at 1/4 and 3/4 of the tensile and compressive sides, respectively. As a reference, numbers 5, 6, 7, and 8 were used, among which, Nos. 1, 5, and 7 were vertical strain gauges on the compressive side, and Nos. 2, 6, and 8 were vertical strain gauges on the tensile side. Nos. 3 and 4 were vertical strain gauges at the geometric neutral axis of the section; Nos. 9 and 10 were transverse strain gauges in the middle section (Figure 4). No. 3 and No. 4 are the vertical strain gauges at the geometric neutral axis of the section; No. 9 and No. 10 were the transverse strain gauges of the central section (Figure 4). The load–strain relationship curves of each measurement point (the average value of two specimens in each group) were obtained via measurement (Figure 7); the values of longitudinal compressive strain and transverse tensile strain on the compressive side of the wooden column under ultimate load-bearing capacity are provided in Table 7. As can be seen from Table 7, the errors in the experimentally measured values of the two specimens in each group were small. For example, the maximum error was 6.42% for the transverse tensile strain values of the ZCR5 group specimens (ZCR5-1 and ZCR5-2), and the minimum error was 1.54% for the longitudinal compressive strain values of the ZCR3 group specimens (ZCR3-1 and ZCR3-2). It is worth noting that the error range of each specimen was between 1.54% and 6.42%. Referring to the statistical specifications, the average value was taken as the representative value of the measured data for each group of specimens. Among them, the tensile strain was positive, and the compressive strain was negative.
As can be seen from Figure 7, at the beginning of loading, the specimen was in the elastic stage, and the load–strain varies linearly; when the load approaches the ultimate load, the load–strain varies nonlinearly. Strain gauges Nos. 1–8 were measured under compression so that the full section is under compression, and strain gauges Nos. 9–10 were measured under tension in the cross-section. There is no obvious plastic phase in ZC1 in the figure; this is because the yielding of the specimen occurred at the end, and there was no strain gauge arrangement at the end position. The column body did not have an obvious yielding phenomenon, so the figure shows that it was in the linear phase. ZRC2 is the location where the No. 6 strain gauge first entered the plastic stage and then yielded, and the No. 5 strain on the opposite side of it began to decrease until the No. 6 area was crushed. ZRC3 and ZRC2 have the same damage pattern in the diagram; both were compressed when the side first yielded, and then, the compressive stress on the other side began to decrease, so the strain on that side also began to decrease accordingly. Both had the same damage pattern. The mode was the same, but the destruction phenomenon was slightly different; ZRC4 is near where the No. 2 strain gauge first entered the plastic stage and then yielded due to the destruction phenomenon, which is in line with it. The crushing and splitting damage occurred at the end position. The side of specimen ZRC5—Nos. 2, 6, and 8—was the first to fail, and this side almost entered the plastic stage at the same time. Furthermore, the plastic change length of ZRC5 was longer than that of the other four groups, indicating that after entering the plastic stage, the wood fiber was damaged; however, due to the restraint effect of BFRP, it still had a certain bearing capacity, which was especially obvious when the load exceeded 300 kN. Compared with ZRC4, the load entering the plastic stage was smaller than ZRC4, but the bearing capacity was slightly higher than ZRC4, indicating that ZRC5’s ultimate bearing capacity was smaller than ZRC4 in the same pasting area and mode, which was caused by the difference in the material itself. The material performance of ZRC5 was slightly worse than that of ZRC4. Therefore, it can show that BFRP has a good effect on improving the ultimate bearing capacity of wooden columns, especially when fully pasted. The ultimate transverse tensile strain of Nos. 9 and 10 of the four groups of BFRP-reinforced specimens decreased to different degrees compared with that of the pure wood column, indicating that BFRP can effectively restrain the transverse tensile strain of a wood column, thus improving the bearing capacity of the member.
Table 7 plots the strain limit value in the column, which shows that the transverse tensile strain value of the BFRP-pasted wood column was obviously reduced compared with the pure wood column, while the longitudinal compressive strain was increased. The greater the longitudinal compressive strain is, the stronger the ultimate bearing capacity is in the case of similar moduli of elasticity. The longitudinal compressive strain of ZRC3 increased more because the yielding area was in the BFRP wrapping in the column, and it could continue to be compressed, so the strain was larger. ZRC5 with full paste had the best effect and the highest load capacity improvement value, but from an economic point of view, the paste area of ZRC4 was 58.9%, and the load capacity improvement value was 25.12%, while the paste area of ZRC5 was 100%, and the load capacity improvement value was 26.65%; therefore, the BFRP paste method of ZRC4 is the best.

3.5. Glued Wood Hollow Cylindrical Circular BFRP Reinforcement Effect

After being reinforced with BFRP, the glued laminated wood hollow cylinder’s axial compression bearing capacity significantly improved. In order to compare the economic performance between the consumption of BFRP and the axial compression bearing capacity of the column, this paper has drawn an ultimate bearing capacity–BFRP-pasted total area diagram (Figure 8), in which the BFRP-pasted total area is the product of the single ring area of BFRP and the total number of BFRP rings. The data at each point are the average test values of each group of specimens. It is worth noting that, from Table 8, the errors in the ultimate bearing capacity values of the two groups of specimens are small; specifically, the error range is controlled in 5.9% of them. From a statistics-related perspective, it is known that the average value can be taken as the representative value of the measured data of each group of specimens. As shown in Figure 8, the ultimate bearing capacity increases gradually as the total area of BFRP paste increases. When the total area of BFRP is less than 3.2 × 105 mm2 (BFRP area ratio k = 0.59), the ultimate bearing capacity curve rises faster, and then, the curve rises slowly. Considering the amount of BFRP, the best BFRP area ratio is k = 0.59; the corresponding ultimate bearing capacity is 371.3 kN; the corresponding specimen is ZRC4; and the best BFRP arrangement is two layers, with four-strip layers and each strip spaced at 56 mm.

4. Theoretical Calculations

Calculation of Bearing Capacity of Axially Compressed Members

According to the Wood Structure Design Standard [39] (GB50005-2017), the bearing capacity calculation formula for axially compressed members is divided into two types:
It is according to the strength test when
N A n f c
It is according to the stability test when
N φ A n f c
where fc is the design value of smooth compressive strength; N is the design value of axial pressure (N); An is the net cross-sectional area of the compressed member (mm2); A0 is the calculated area (when there is no gap, take A0 = A; when the gap is not at the edge, take A0 = 0.9 A; and when the gap is at the edge, take A0 = An); and φ is the stability coefficient of the axially compressed member.
Taking equal signs on both sides of Equations (1) and (2) and then finishing, we can obtain
N = f c A n
N = φ f c A n
The test results are brought into the above formula. A0 = An because, although the “gap” is not at the edge, it is axisymmetric, and A0 = An is taken only when the “gap” is at the edge and symmetric, as specified in 5.1.3 of the standard [39]. Although there is no specific provision for the value of An in the test model, the test model is equivalent to this provision in terms of the nature of the force. The first strength formula obtained the fc for 35 MPa, and the second stability formula obtained the fc for 36.87 MPa. The two results were entered into ABAQUS for simulation, and we compared the error of the ultimate bearing capacity. Finally, we concluded that the error in the results calculated using the stability test formula was smaller; the error of the former was 2.7%, while the error of the latter was 2.3%, obviously using stability. The error in the results calculated by the calculation formula is smaller; that is, the ultimate bearing capacity of glued wood hollow cylindrical axial compression members can be calculated by using Formula (4), and it is customary in engineering design to take into account the initial defects when the wooden column is under pressure and use Formula (4) to calculate the bearing capacity.
It is worth noting the value of the stability coefficient, φ, for axially compressed members, which is calculated with Equation (5).
λ c = c c β E k f ck
When   λ > λ c ,   φ = a c π 2 β E k λ 2 f ck
When   λ λ c ,   φ = 1 1 + λ 2 f ck b c π 2 β E k
where λ is the length-to-slenderness ratio of the compressed member; f ck is the standard value of the compressive strength of the compressed member material (N/mm2); E k is the standard value of the modulus of elasticity of the member material (N/mm2); a c , b c , c c is the material correlation coefficient according to the value in Table 5-1-4 of the standard [39]; and β is the material shear deformation correlation coefficient according to the value in Table 5-1-4 in the standard [39].
In the above equation, Ek/fck is not derived according to the wood structure design standard [39], but instead, according to the results of this test, Ek is obtained from the stress–strain curve of ZC1 in the test results. Thus, Ek/fck is 418.26, which is brought into Equation (5) to obtain λc as 72.3, and, finally, φ is about 0.947.

5. Numerical Analysis

In order to better study the axial compression performance of BFRP on glued wood hollow cylinders after reinforcement, finite element models of five groups (ZC1 and ZRC2 to ZRC5) of glued wood hollow cylinders with the same dimensions as the test specimens in this paper were established based on the ABAQUS software, and the numerical simulation results were compared with the experimental results to verify the rationality of the finite element models.

5.1. Building a Finite Element Model

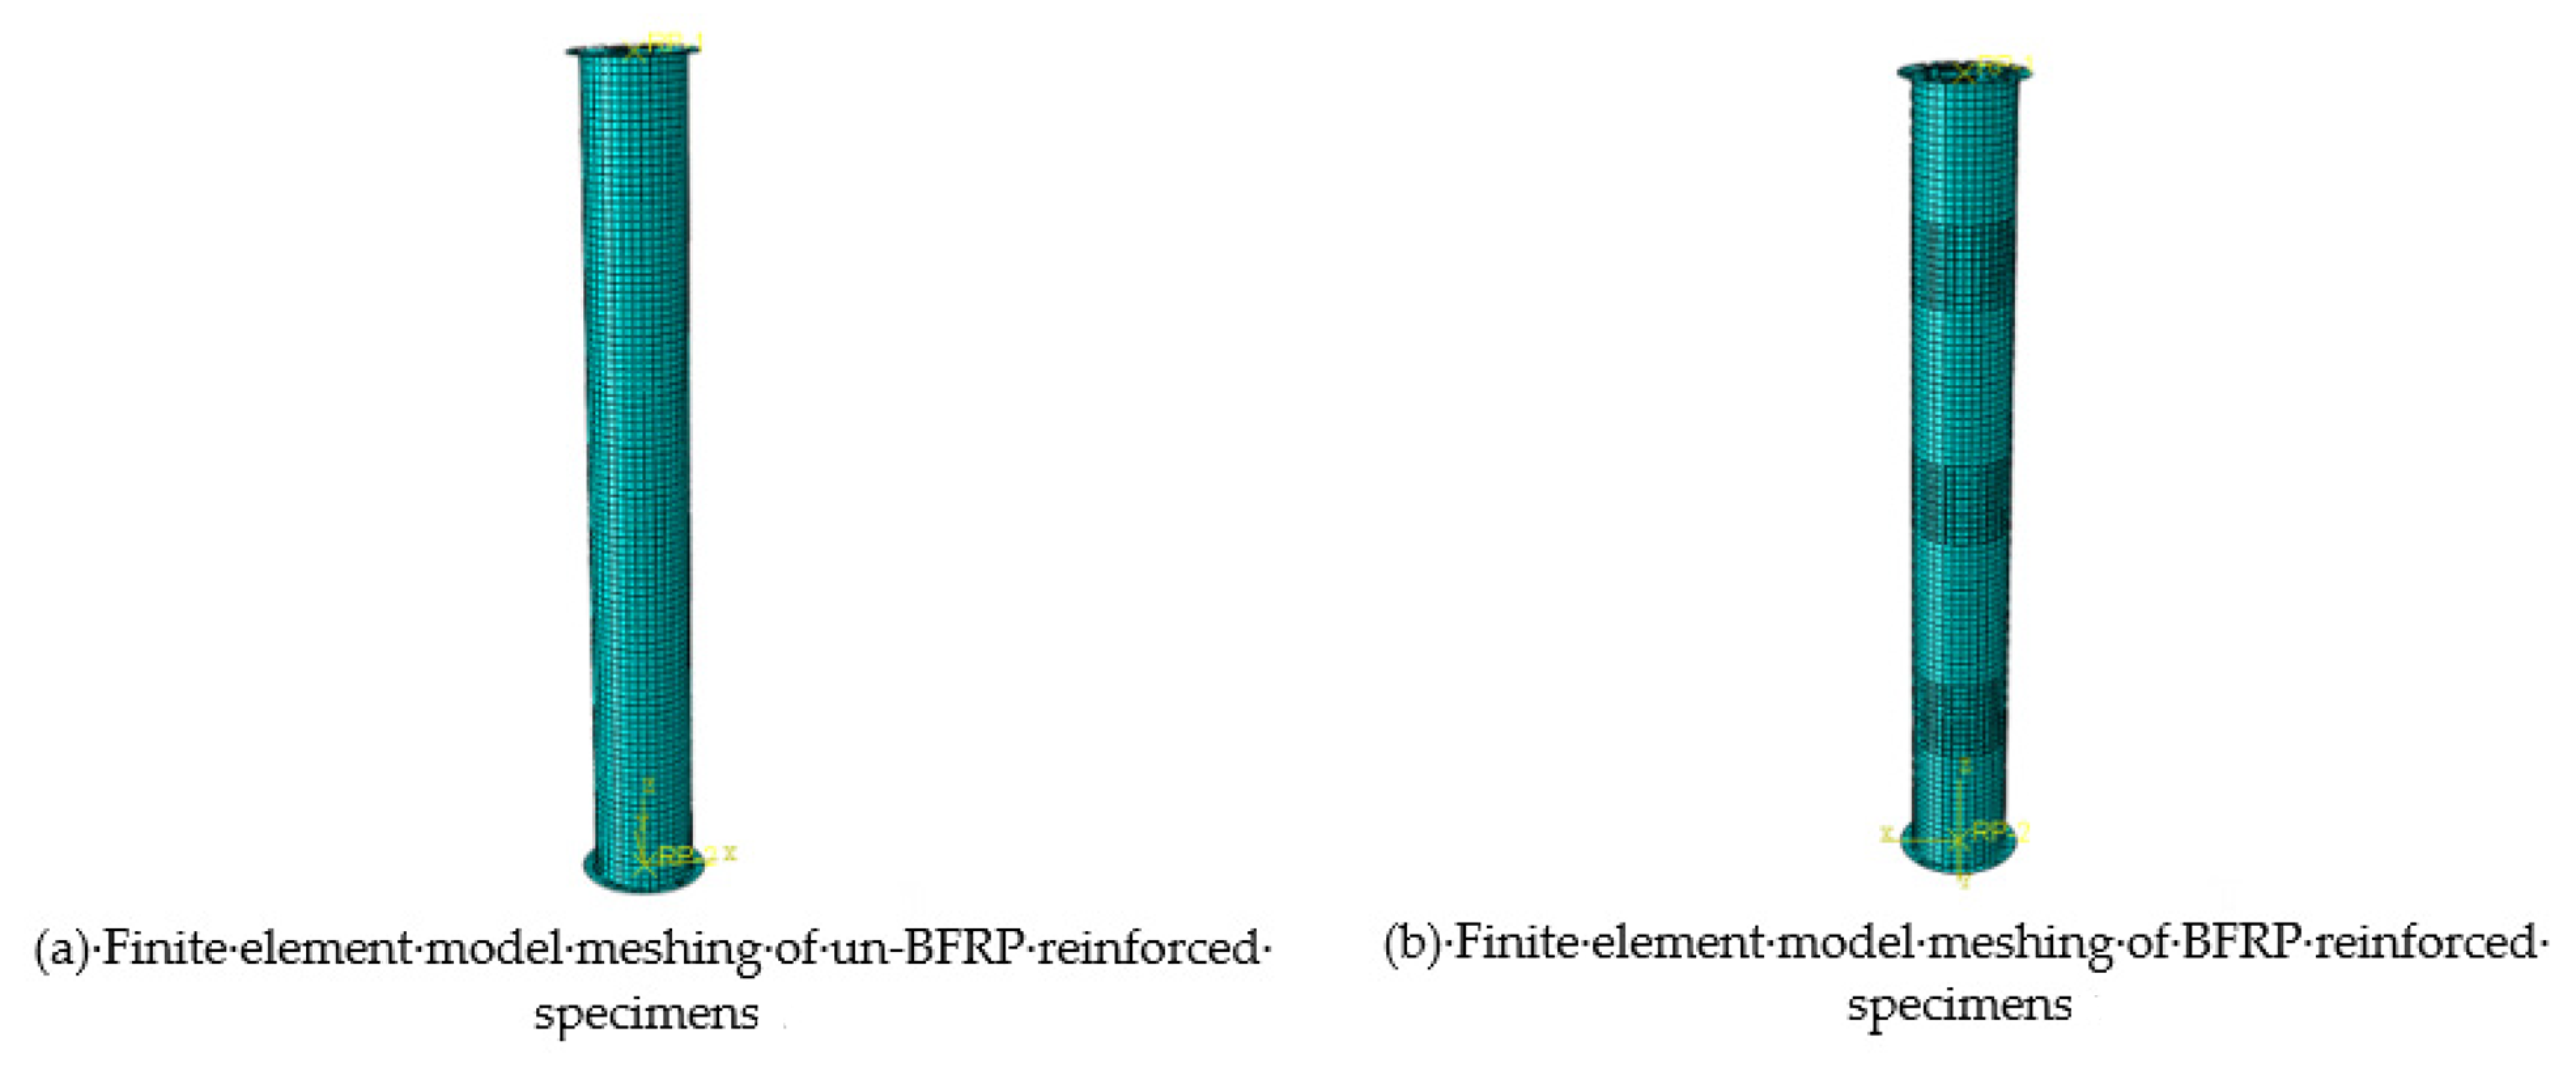
Both the BFRP-unreinforced hollow cylindrical specimen and the reinforced hollow cylindrical specimen were modeled in the ABAQUS software in 3D, where the bull leg part was simplified in the model building, and a square loading plate of 120 mm * 120 mm was created on the loading surface of both ends of the wooden column. Eight-node linear hexahedral cells (C3D8R) were used to model the wooden column, BFRP, and square loading plate and divide the mesh. The wooden plate was divided using a 10 mm mesh; the BFRP was divided into a 6 mm mesh; since the loading plate would not be damaged, it was divided into a 20 mm mesh, and its properties were set to an analytic rigid body. The final finite element model of the meshing of the BFRP-unreinforced hollow cylindrical specimen (ZC1) and the reinforced hollow cylindrical specimen (ZRC2) is shown in Figure 9.

5.2. Ontogenetic Relationship of Materials

Wood is an orthotropic anisotropic material, and the elastic–plastic behavior of wood under tensile and compressive stresses is achieved by using engineering constants and Hill’s yield criterion, respectively. Referring to the American Handbook of Wood Construction [35], the physical and mechanical parameters of wood are shown in Table 9, and referring to the wood timber properties tests of Zhou Jiale, the yield strength of wood is shown in Table 10.

5.3. Model Validation

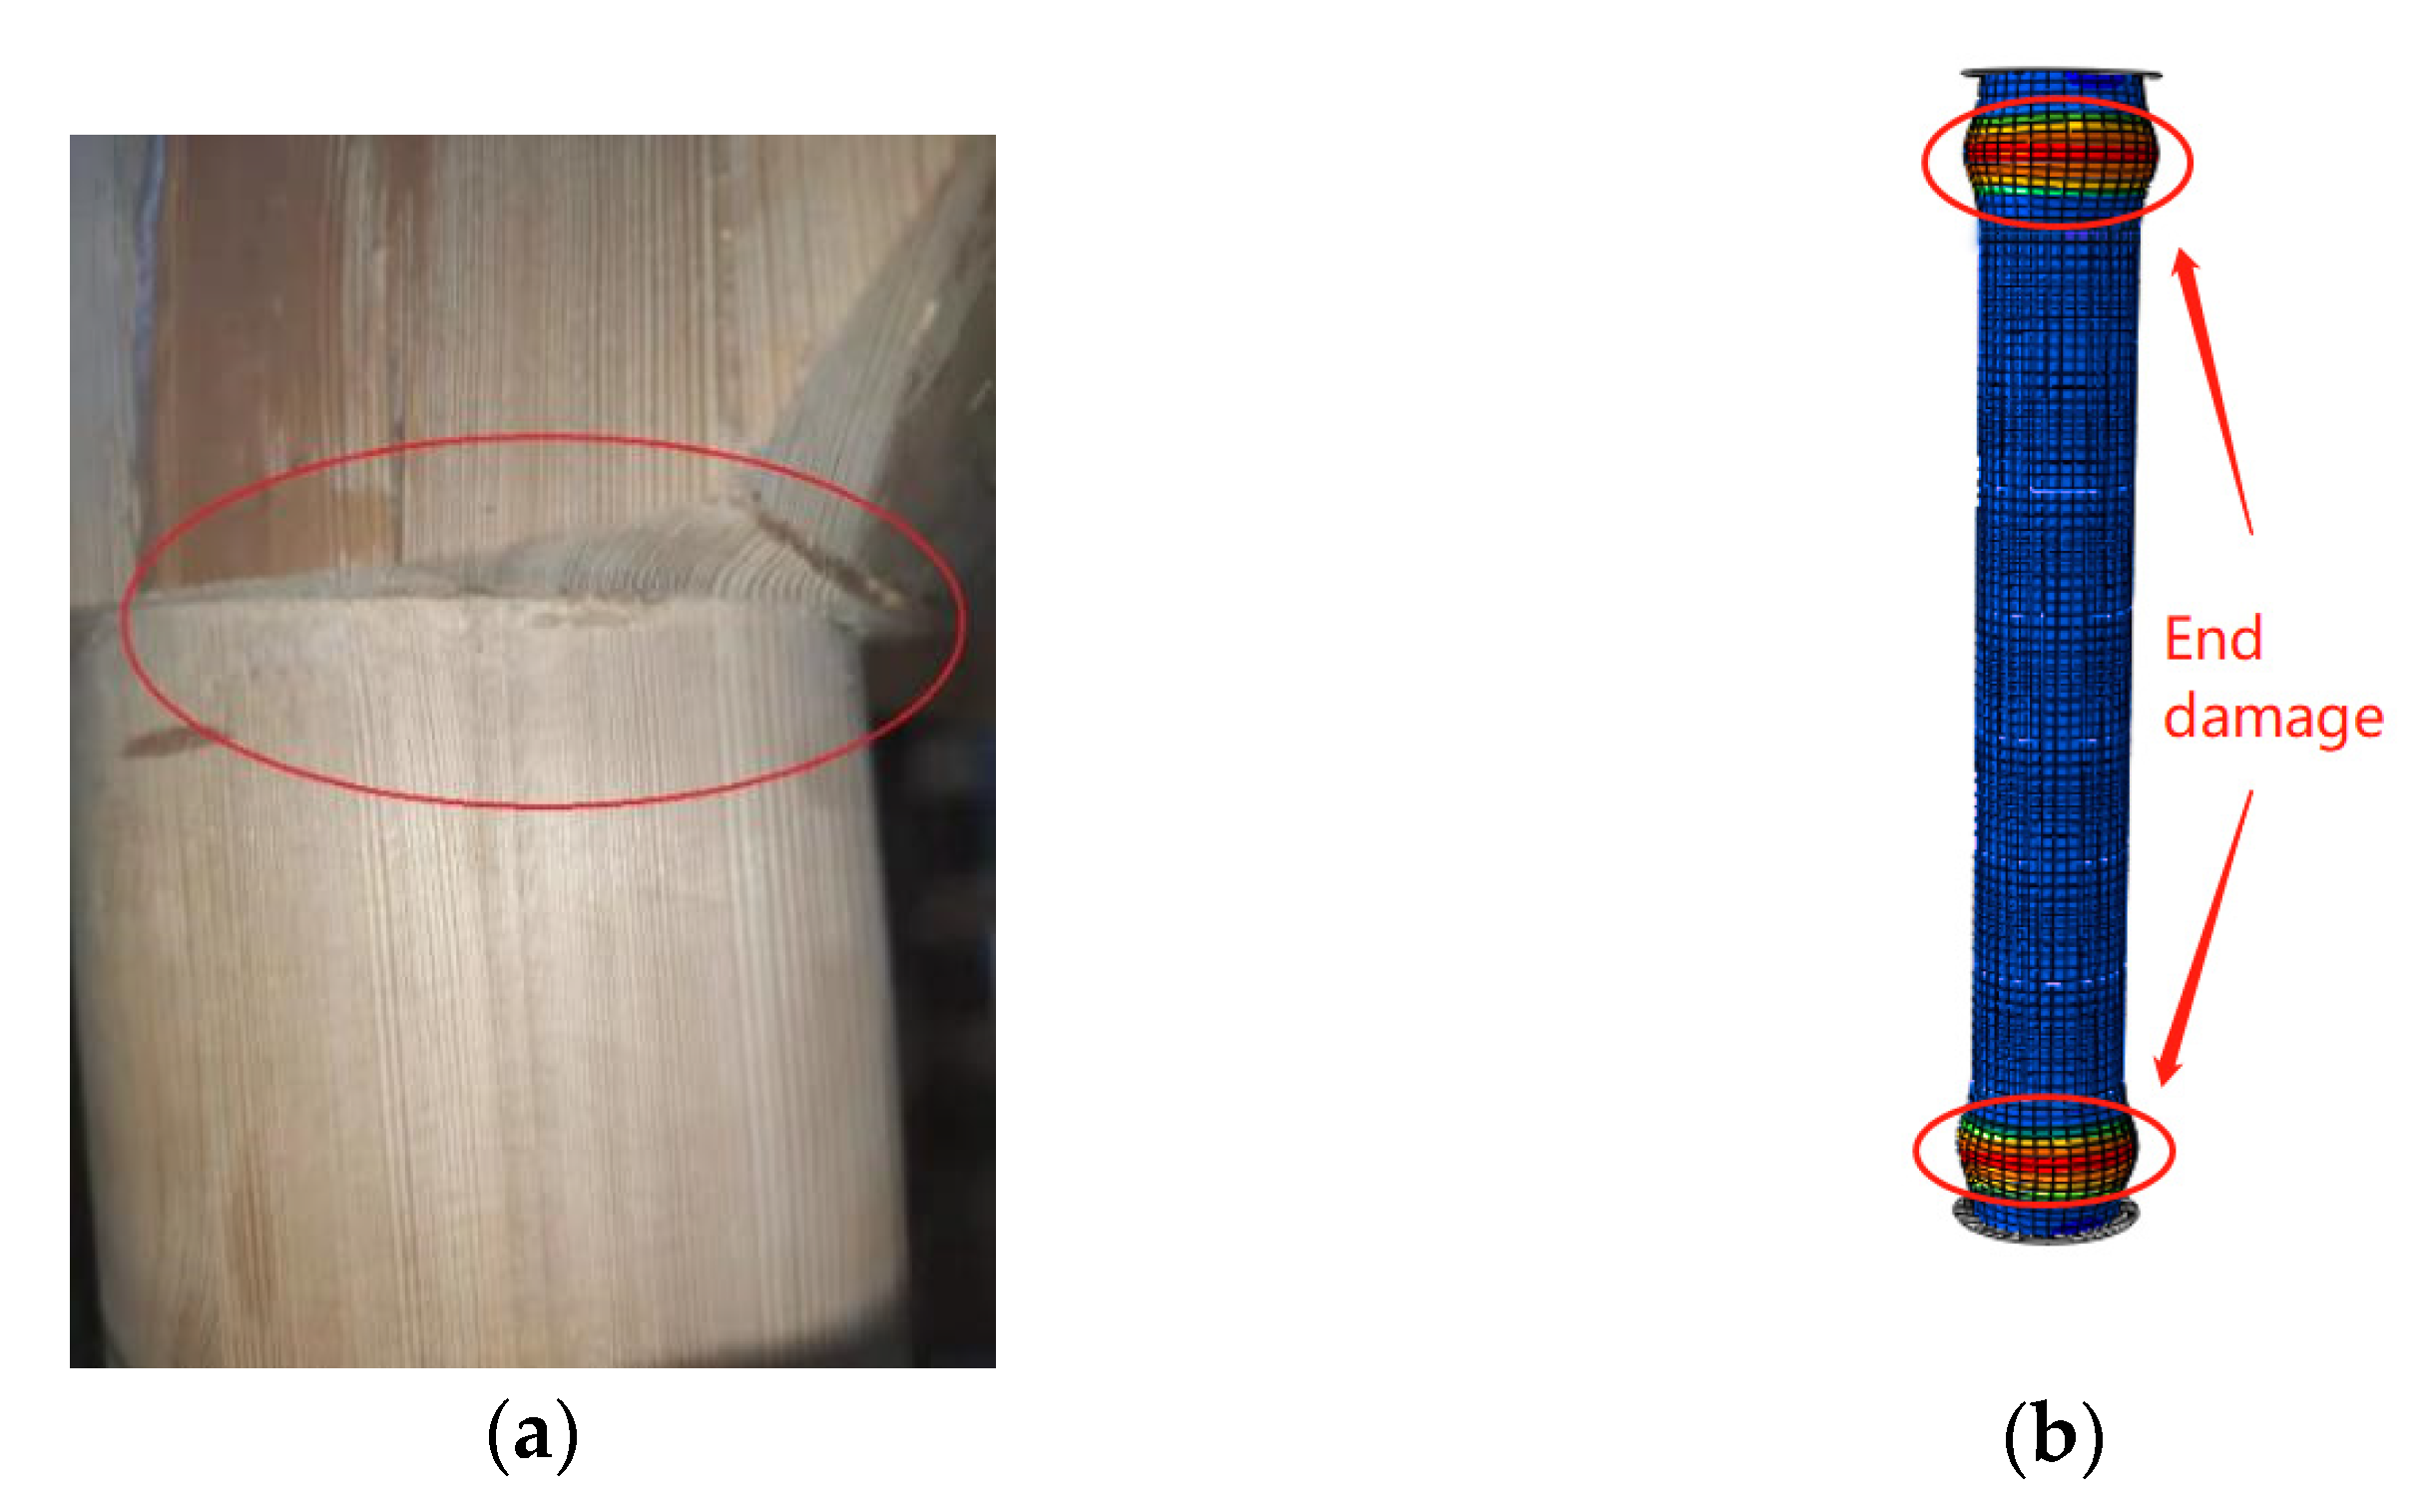
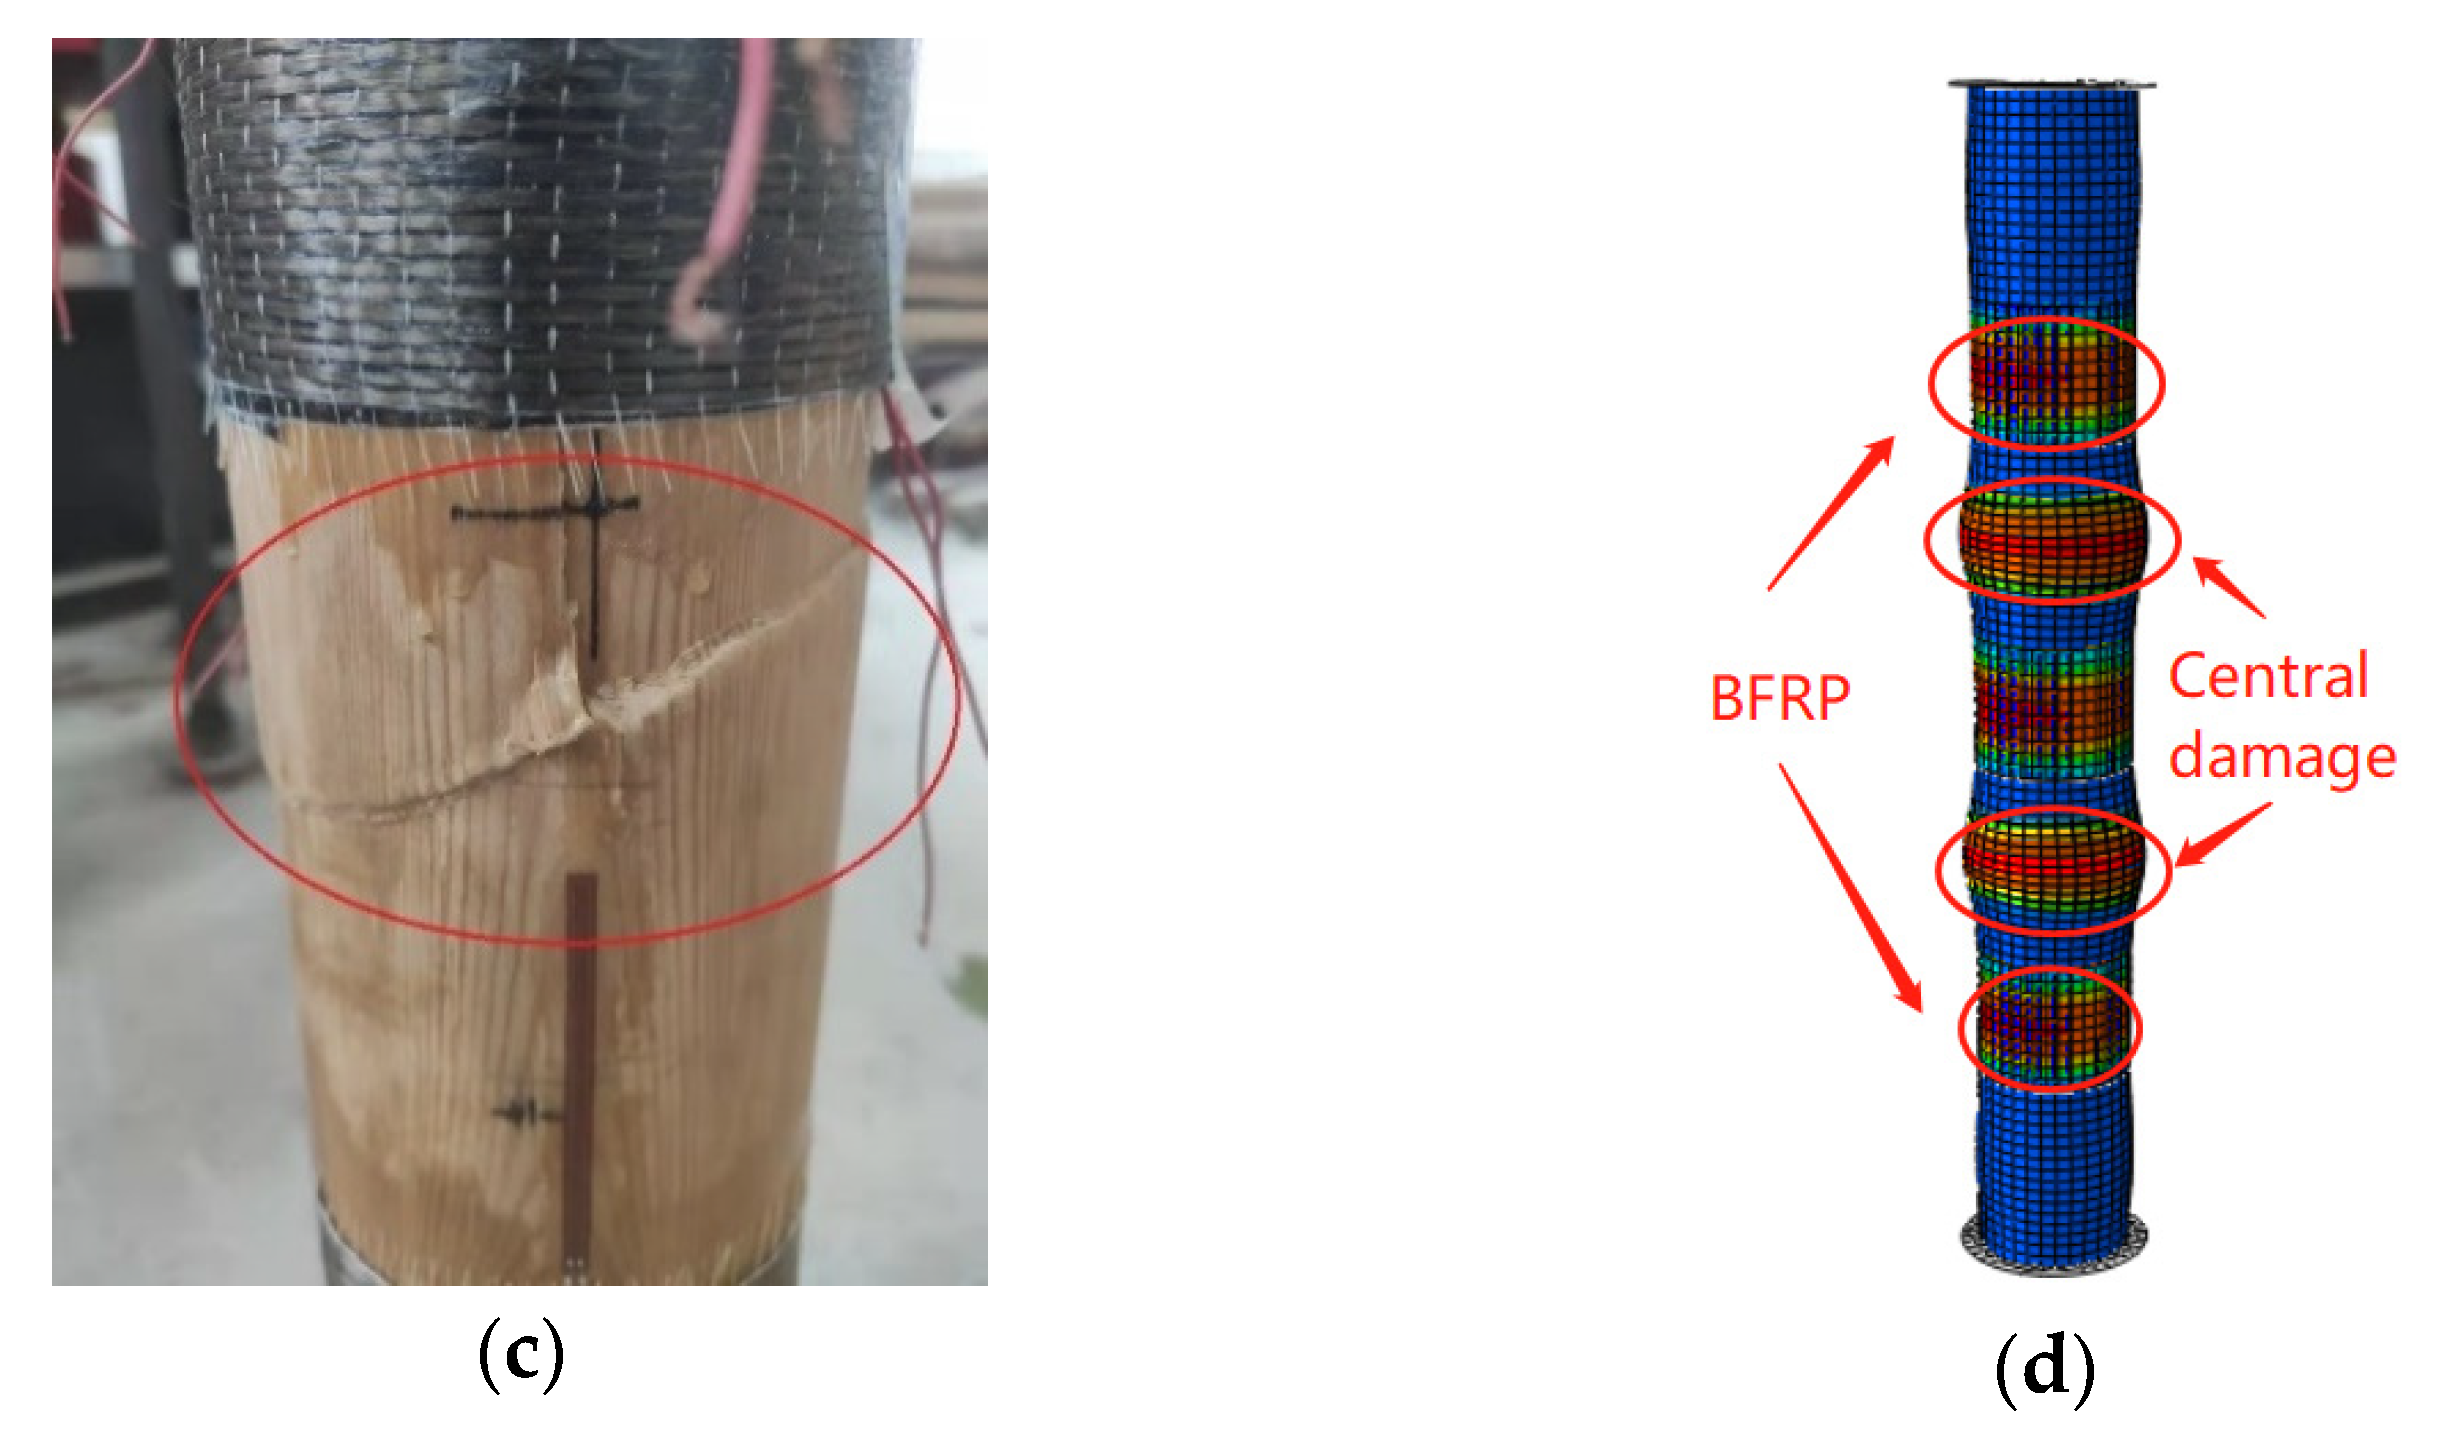
In this paper, a total of ten three-dimensional models for five groups (ZC1 and ZRC2 to ZRC5) were established using finite elements, in which the model dimensions of the ZC1 and ZRC2 to ZRC5 groups were the same as the actual dimensions of the test specimens. The accuracy of the finite element model was verified by comparing the numerical analysis results with the experimental results. For example, from the specimen damage (Figure 10), it can be seen that. when the specimen reached the ultimate bearing capacity, the damage pattern of the finite element model of the specimen in the ZC1 group of glued laminated wood hollow cylinders without BFRP reinforcement was the same as the damage pattern of the actual specimen in the test; the damage pattern of the specimen in the ZRC2 group of glued laminated wood hollow cylinders with BFRP reinforcement was the same as the damage pattern of the actual specimen in the test; and the damage pattern of the specimen in the middle of the test was the same. The damage patterns of the two groups of ZRC specimens with BFRP reinforcement were the same as those of the actual test specimens, and the damage occurred in the middle of the specimens (Figure 10c,d).
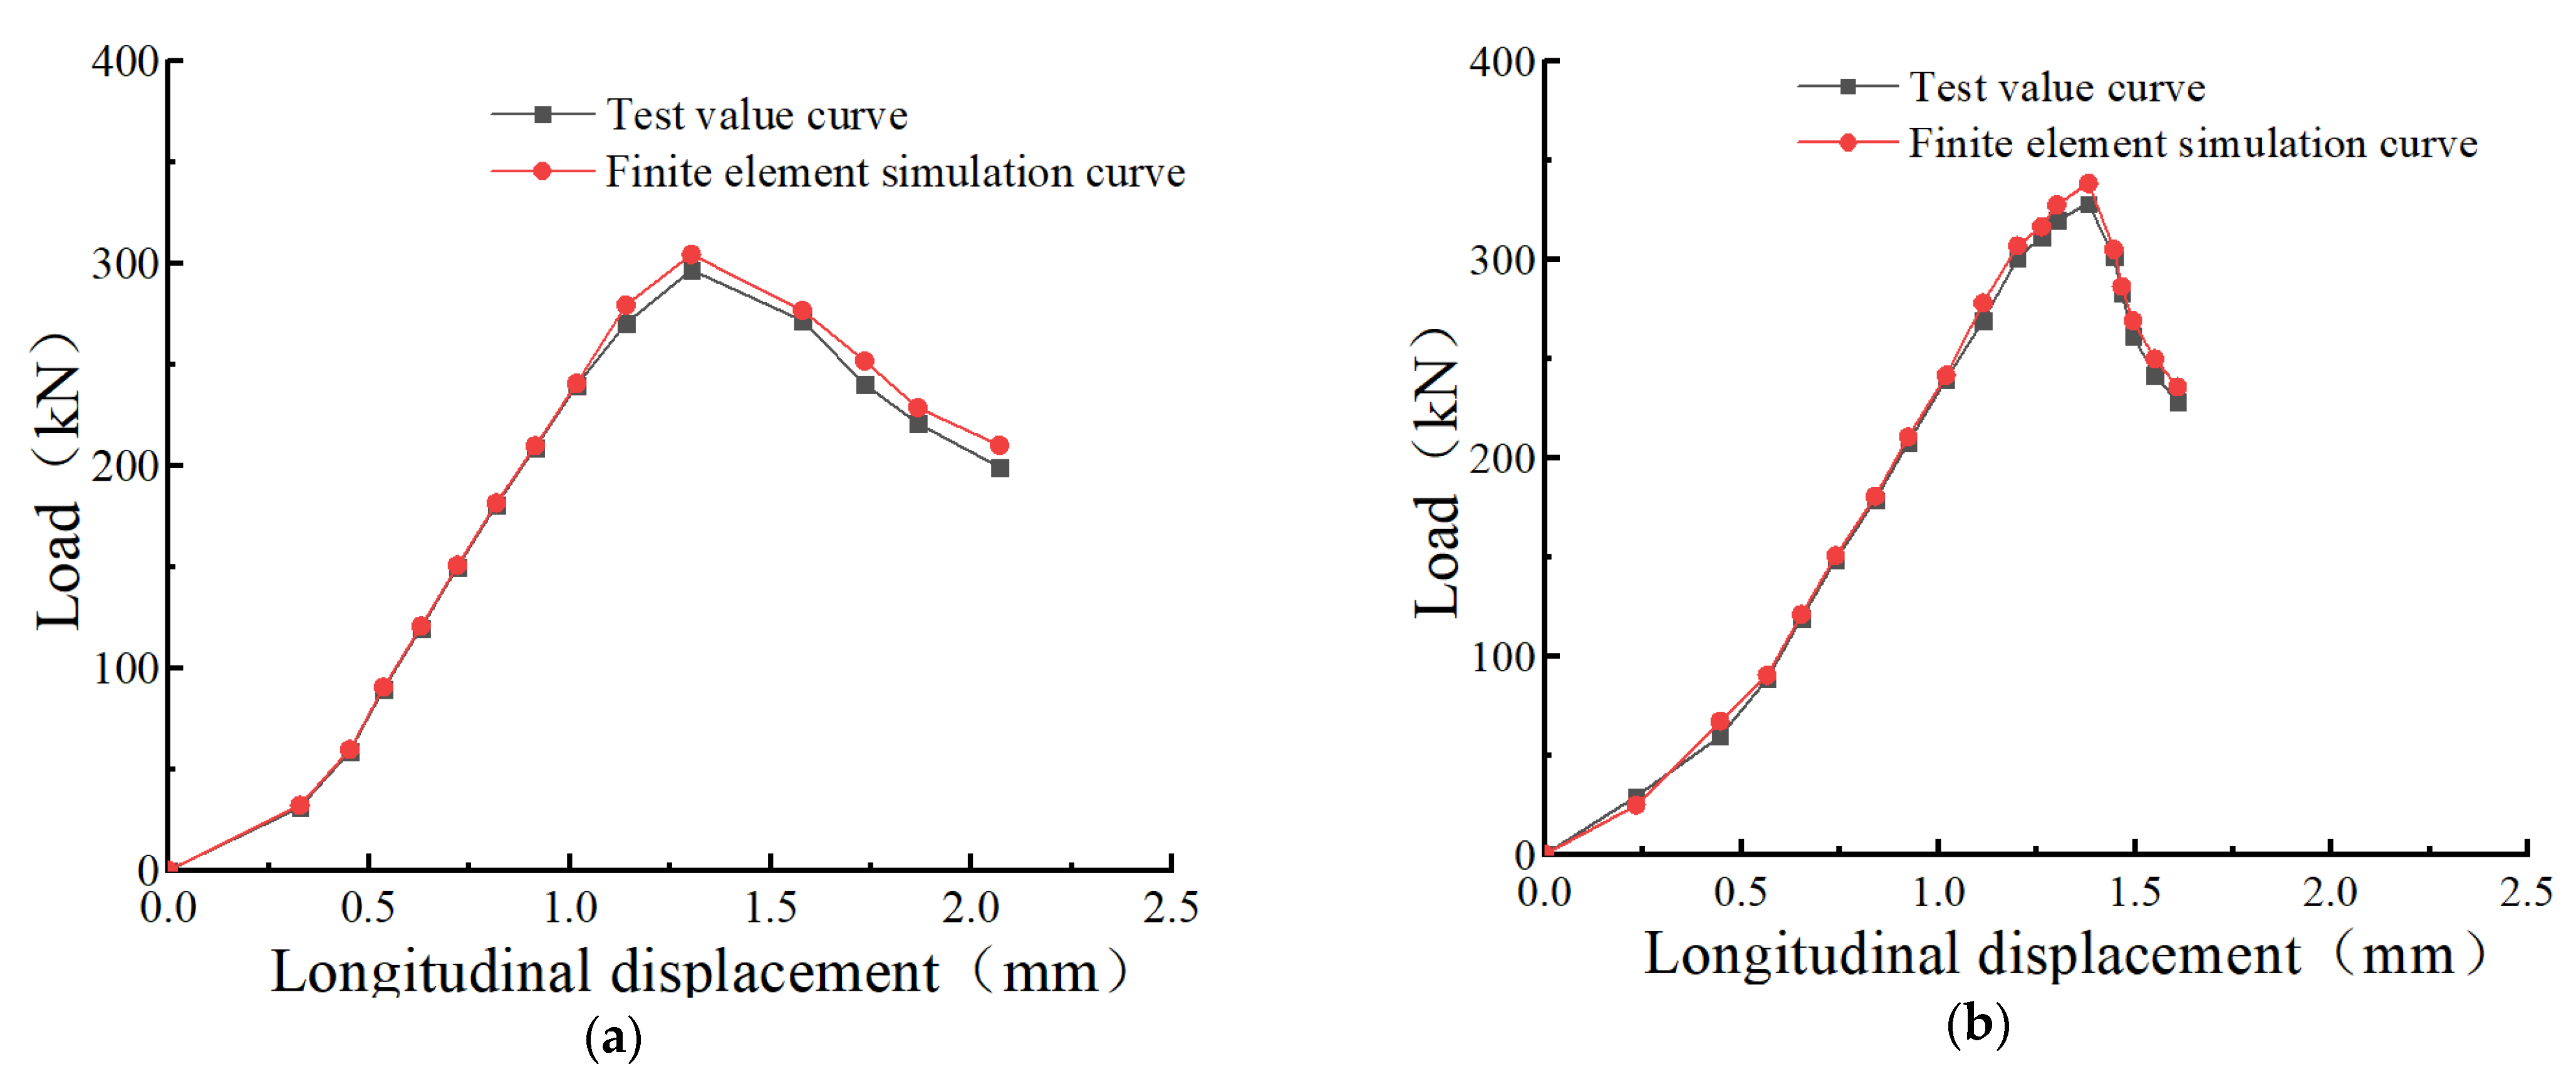
The load–longitudinal displacement curves were also compared to verify the accuracy of the finite element model in terms of nonlinear responses. As shown in Figure 11, the load–longitudinal displacement curves generated by the finite element models of the specimens in groups ZC1 and ZRC2 and the load–longitudinal displacement curves measured by the actual specimens in the test were in good agreement, as evinced by the maximum loads of 301.27 kN and 334.56 kN for the specimens in groups ZC1 and ZRC2 in the finite element models, respectively. The relative errors between both of them, and the maximum loads measured in the test, were measured. The relative error between both and the maximum load measured by the test was controlled within 3%, which indicates that the established finite element model is accurate and effective.

5.4. Comparison of Finite Element Values and Actual Test Values

After verifying the accuracy of the finite element model, the calculated values of the theoretical bearing capacity of glued laminated wood specimens (ZC1 and ZRC2 to ZRC5) under different BFRP diameter spacing arrangement parameters were compared with the finite element values.
Two quantitative factors were extracted from different BFRP pasting methods in the axial pressure group, the BFRP pasting rate, ρ, and pasting distance, d, where the spacing of BFRP in each group was equidistant, and the pasted BFRP was symmetrical about the middle of the column. Thus, the BFRP pasting method can be measured with these two indicators, and a pasting coefficient, βB (Figure 12), is proposed here to quantitatively measure the influence of the BFRP pasting area and paste spacing on the ultimate bearing capacity of glued wood hollow cylinders based on the pasting coefficient. The pasting coefficient βB is calculated as follows.
β B = ρ × b / ( b + d )
where βB is the BFRP paste factor; ρ is the BFRP paste rate (BFRP paste area/paste area); d is the BFRP paste spacing; and b is the width of BFRP.
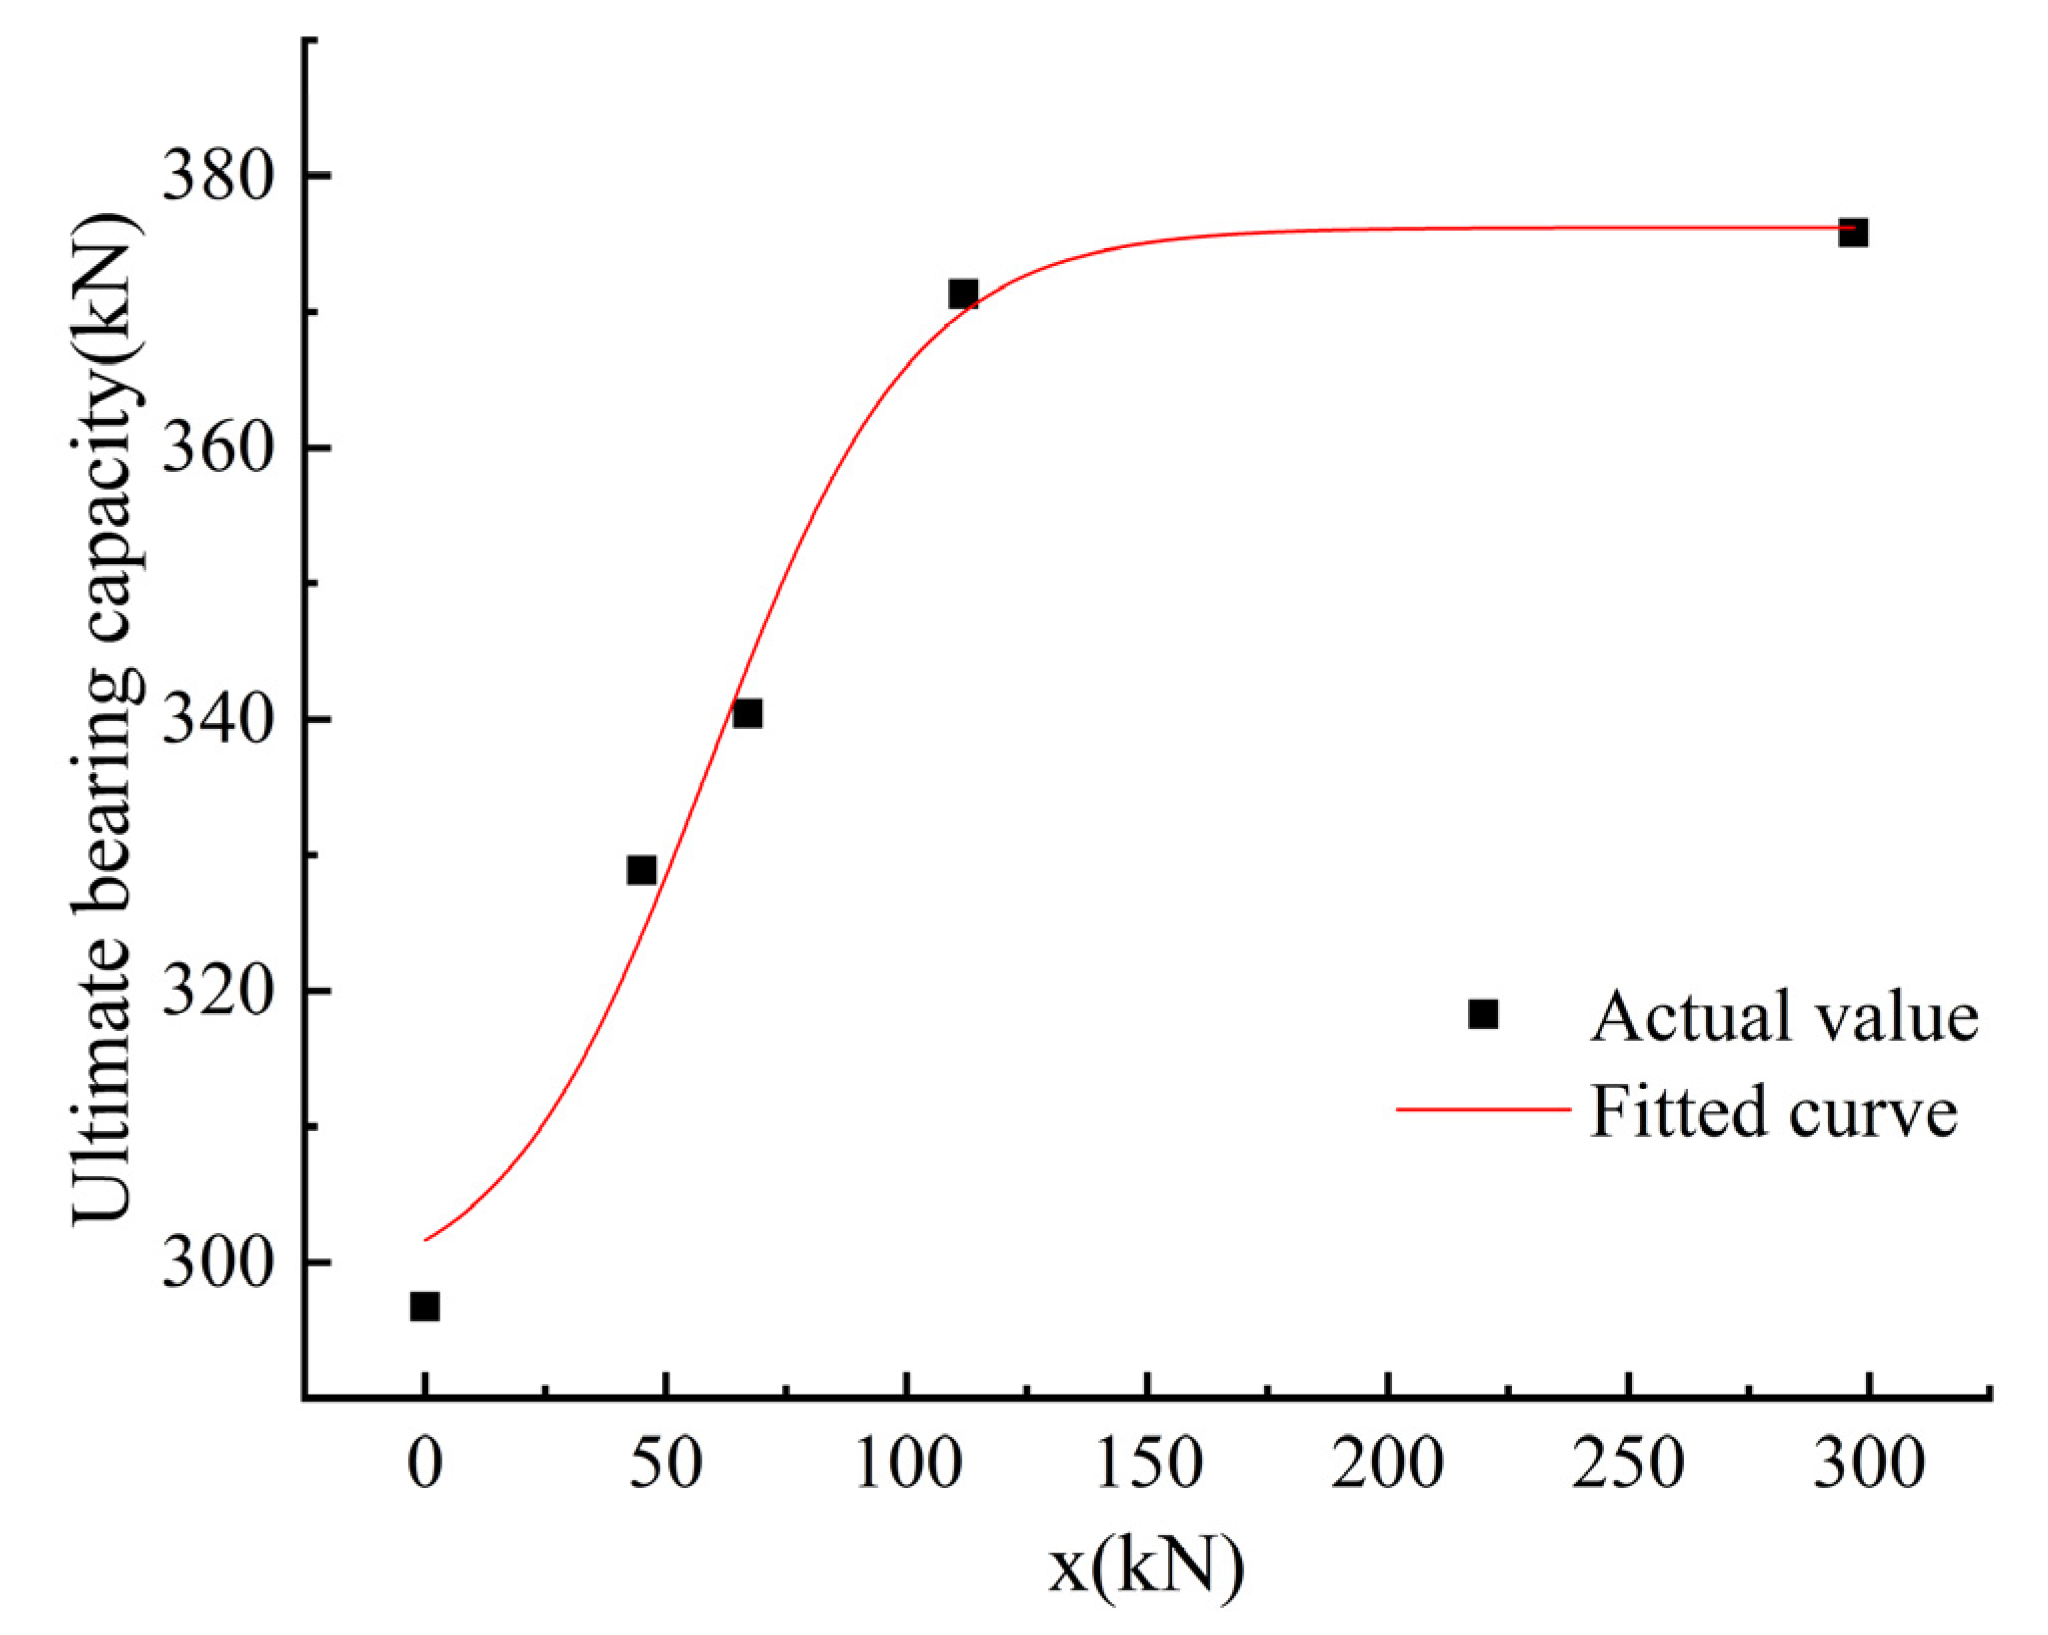
In order to increase the reliability of the calculation results, other components with differently distanced BFRP arrangements were simulated using ABAQUS, and then, the variable x was made to be F e + β B F e ; thus, the finite element and experimental data were fitted, as shown in Figure 13, and the final fitted Equation (10) calculation results with errors are shown in Table 10.
F aB = F a + 79.45 1 + 10 0.02 × ( 58.86 β B × F a )
F a = φ A n f c
where F aB is the calculated value of axial compression ultimate bearing capacity of a glued laminated wood hollow cylinder after BFRP reinforcement (kN); F a is the calculated value of the axial compression of the ultimate bearing capacity of a glued laminated wood hollow cylinder without reinforcement (kN); β B is the coefficient of BFRP adhesion; and f c is the actual value of the smooth-grain compressive strength (MPa).
From the data in Table 11, it can be seen that the ultimate bearing capacity equation of a wood column after BFRP-strengthening can be obtained by improving the Boltzmann function equation; the calculation result is more consistent with the actual value, and the maximum error is only 1.67%, so it can be used for the calculation of the ultimate axial compression load capacity of a glued laminated wood hollow cylinder reinforced by BFRP. The ultimate axial compression load value fitted by the finite element model in this paper is also basically the same as the ultimate load value measured by the test, and the maximum error is only 2.67%, which shows that this finite element model is effective.

6. Conclusions

In this paper, using the BFR-reinforced glued wood hollow cylindrical axial compressive-load-bearing model test, the following preliminary conclusions can be obtained.
(1) For BFRP-reinforced and -unreinforced glued laminated wood hollow cylinders under an axial pressure load, with an increase in the load, both the middle and end of the compressed side of the wood were first flexed, and then, with an increase in the load, the specimens were finally crushed. Only group 4 (ZRC4) specimens showed longitudinal splitting damage at the end, which is typical of axial compression buckling damage.
(2) Compared with the pure wood columns without BFRP reinforcement, the ultimate compressive load capacity of all groups of specimens increased to different degrees, among which, the load capacity of the wooden column covered with BFRP in group ZRC5 increased the most, reaching 26.65%. The specimens in group ZRC4 were the second, with an increase of 25.12%; the specimens in groups ZRC3 and ZCR2 were the lowest, respectively. The specimens of the ZRC3 and ZCR2 groups had the lowest ultimate load capacity increases at 14.56% and 11.06%, respectively. The ultimate load capacity of glued wood hollow cylinders can be effectively improved using this method of BFRP adhesion.
(3) The ultimate bearing capacity of each glued wood hollow cylinder gradually increased with an increase in the total area of the BFRP paste. The best BFRP area ratio can be taken as k = 0.59 by combining the BFRP dosage, economy, and force performance.
After calculation and comparison, it was found that the ultimate bearing capacity calculation for axially compressed wood columns in the Wood Structure Design Standard [39] was not applicable to hollow wood columns, so it was corrected, and the error between the corrected calculated value and the actual value was within ±10%. In addition, the ultimate bearing capacity calculation formula for hollow columns after BFRP reinforcement was fitted, and the calculated error value was also less than ±10%, which has a certain reliability.

Author Contributions

Conceptualization, J.W. and R.L.; methodology, J.W. and R.L.; software, R.L.; validation, Z.W., Q.P. and Y.Z.; formal analysis, Z.W.; resources, J.W.; data curation, R.L.; writing—original draft preparation, R.L.; writing—review and editing, J.W.; visualization, R.L.; supervision, J.W.; project administration, J.W.; funding acquisition, J.W. All authors have read and agreed to the published version of the manuscript.

Funding

This work was supported by Central South University of Forestry and Technology (Grant No. 9010263203077).

Institutional Review Board Statement

Not applicable.

Informed Consent Statement

Not applicable.

Data Availability Statement

All data, models, and code generated or used in this study are available upon request from the corresponding author.

Conflicts of Interest

The authors declare no conflict of interest.

References

  1. Zhang, Y.; Wang, H.; Gao, W.; Wang, F.; Zhou, N.; Kammen, D.M.; Ying, X. A Survey of the Status and Chalenges of Green Building Development in Various Countries. Sustainability 2019, 11, 5385. [Google Scholar] [CrossRef] [Green Version]
  2. Medvedkina, Y.A.; Khodochenko, A.V. Market power of green buildings in sustainable development goals. IOP Conf. Ser. Mater. Sci. Eng. 2019, 698, 77045. [Google Scholar] [CrossRef] [Green Version]
  3. Luo, L.; Chen, Y. Research on Application of Green and Low-carbon Building Technology. IOP Conf. Ser. Earth Environ. Sci. 2020, 474, 22033. [Google Scholar] [CrossRef]
  4. Balasbaneh, A.T.; Sher, W.; Yeoh, D. Recommending a new building structure to alleviate environmental impact in tropical climates: Increasing the use of wood in construction. Int. J. Life Cycle Assess. 2022, 27, 885–901. [Google Scholar] [CrossRef]
  5. Werner, F.; Richter, K. Wooden building products in comparative LCA. Int. J. Life Cycle Assess. 2007, 12, 470. [Google Scholar]
  6. Zvirgzdins, J.; Plotka, K.; Geipele, S. Circular economy in built environment and real estate industry. In Proceedings of the 13th International Conference Modern Building Materials, Structures and Techniques, Vilnius, Lithuania, 16–17 May 2019; pp. 704–713. [Google Scholar]
  7. Iqbal, A. Developments in Tall Wood and Hybrid Buildings and Environmental Impacts. Sustainability 2021, 13, 11881. [Google Scholar] [CrossRef]
  8. Zhao, H.T. Chinese Ancient Building Structure and Its Earthquake Resistance; Science Press: Beijing, China, 2012. [Google Scholar]
  9. Ren, X. Building Globalization: Transnational Architecture Production in Urban China; University of Chicago Press: Chicago, IL, USA, 2011. [Google Scholar]
  10. Hollaway, L.C.; Teng, J.G. Strengthening and Rehabilitation of Civil Infrastructures Using Fibre-Reinforced Polymers (FRP) Composites; Woodhead Publishing: Cambridge, UK, 2008. [Google Scholar]
  11. Bank, L.C. Composites for Construction: Structural Design with FRP Materials; John Wiley & Sons: Hoboken, NJ, USA, 2006. [Google Scholar]
  12. Taheri, F.; Nagaraj, M.; Khosravi, P. Buckling response of glue-laminated columns reinforced with fiber-reinforced plastic sheets. Compos. Struct. 2009, 88, 481–490. [Google Scholar] [CrossRef]
  13. Raftery, G.M.; Whelan, C. Low-grade glued laminated timber beams reinforced using improved arrangements of bonded-in GFRP rods. Constr. Build. Mater. 2014, 52, 209–220. [Google Scholar] [CrossRef]
  14. Nguyen, T.V.A.; Le, R.R.; Caron, J.F. Multi-reinforcement of timber beams with composite materials: Experiments and fracture modeling. Compos. Struct. 2015, 123, 233–245. [Google Scholar] [CrossRef]
  15. Ghanbari, G.T.; Russo, T.; Valipour, H.R. Lightweight timber I-beams reinforced by composite materials. Compos. Struct. 2020, 233, 111579. [Google Scholar] [CrossRef]
  16. Triantafillou, T.C. Shear reinforcement of wood using FRP materials. Mater. Civil. Eng. 1997, 9, 65–69. [Google Scholar] [CrossRef]
  17. Kropf, F.W.; Meierhofer, U.A. Strengthening, Retrofitting and Upgrading of Timber Structures with High-Strength Fibres. Struct. Eng. Int. 2000, 10, 178–181. [Google Scholar] [CrossRef]
  18. Na, L.; Wang, P.L.; Yiyan, L.; Shan, L. Corroded reinforced concrete columns strengthened with basalt fibre reinforced ECC under axial compression. Compos. Struct. 2022, 303, 116328. [Google Scholar]
  19. Tulendinov, T.; Zesers, A.; Tamužs, V. Behavior of Concrete Cylinders Strengthened with a Basalt-FRP and Subjected to Mechanical Loads and Elevated Temperatures. Mech. Compos. Mater. 2017, 53, 471–478. [Google Scholar] [CrossRef]
  20. Li, Y.; Hung, J.; Syu, J.; Chang, S.; Kuo, W.S. Influence of Sizing of Basalt Fiber on the Mechanical Behavior of Basalt Fiber Reinforced Concrete. Mater. Res. Technol. 2022, 21, 295–307. [Google Scholar] [CrossRef]
  21. Agaewal, S.K.; Kaushik, S.K. Investigation on solid timber columns. Inst. Eng. 1989, 70, 103–107. [Google Scholar]
  22. Li, H.T.; Su, J.W.; Zhang, Q.S.; Deeks, A.J.; Hui, D. Mechanical performance of laminated bamboo column under axial com-pression. Compos. Part B Eng. 2015, 79, 374–382. [Google Scholar] [CrossRef]
  23. Wang, X.; Zhou, A.; Zhao, L.; Chui, Y.H. Mechanical properties of wood columns with rectangular hollow cross section. Constr. Build. Mater. 2019, 214, 133–142. [Google Scholar] [CrossRef]
  24. Otoom, O.F.; Lokuge, W.; Karunasena, W.; Manalo, A.C.; Ozbakkaloglu, T.; Ehsani, M.R. Flexural behaviour of circular timber columns strengthened by glass fibre rein-forced polymer wrapping system. Structures 2022, 38, 1349–1367. [Google Scholar] [CrossRef]
  25. Chen, Q.; Chen, C.W.; Yu, F.; Shen, B.; Tan, C. Experimental Study on CFRP Strengthening Hollow Wooden Column and Strengthening Effect. IOP Conf. Ser.: Earth Environ. Sci. 2020, 455, 12009. [Google Scholar] [CrossRef]
  26. An Outstanding Para-Aramid Combining Unique Properties. Available online: https://www.teijinaramid.com/mooring-lines/96b27bfbff8f0ca54eaf038ff7efd299.pdf (accessed on 12 December 2022).
  27. Product Manual, Zhe Jiang GBF Basalt Fiber Co., Ltd. Available online: http://www.chinagbf.com/product/584.html (accessed on 12 December 2022).
  28. Zhou, Z.H.; Liu, W.Q. Experimental study on timber columns strengthened by CFRP subjected to axial compression. Earthq. Resist. Eng. Retrofit 2006, 3, 47–51. [Google Scholar]
  29. Khelifa, M.; Lahouar, M.A.; Celzard, A. Flexural strengthening of finger-jointed spruce timber beams with cfrp. J. Adhes. Technol. 2015, 29, 2104–2116. [Google Scholar] [CrossRef]
  30. Wang, J.H.; Wang, G.B.; Han, Q.Z.; Zhang, L.; Han, F.X.; Liu, Q. Experimental study on axial compressive behavior of long square poplar columns strengthened with BFRP. Sel. Pap. 2020 Ind. Build. Acad. Exch. Conf. 2020, 1, 293–297. [Google Scholar]
  31. Zhou, L.; Liu, Q.; Ma, S.Q.; Han, X. Eccentric compression behavior of long poplar columns externally reinforced by BFRP. J. Wood Sci. 2021, 67, 2. [Google Scholar] [CrossRef]
  32. Wang, J.H.; Wang, G.B.; Han, Q.Z.; Zhang, L.; Han, F.X.; Liu, Q. Experimental study of the mechanical properties of xinjiang poplar rectangular section long columns under eccentric com-pression. Indust. Build. 2020, 4, 44–48. [Google Scholar]
  33. Fernando, D.; Frangi, A.; Kobel, P. Behaviour of basalt fibre reinforced polymer strengthened timber laminates under tensile loading. Eng. Struct. 2016, 117, 437–456. [Google Scholar] [CrossRef]
  34. GB/T 50329-2012; Standard for Test Methods of Timber Structures, CN-GB. National Standard of the People’s Republic of China: Beijing, China, 2012; pp. 4–15.
  35. ASTMD 198–99; Standard Test Methods of Static Tests of Lumber in Structural Sizes[s]. ASTM International: West Conshohocken, PA, USA, 2003.
  36. Design Handbook for Timber Structures Editorial Committee. Design Handbook for Timber Structures; Architecture & Building Press: Beijing, China, 2005; pp. 43–48. [Google Scholar]
  37. EN 1995-1-1-2008; DD ENV1995-1-1; Eurocode 8: Application and Development of Construction Adhesives. British Standards Institution: London, UK, 1994; pp. 73–92.
  38. EN 1995-1-1-2008; DD ENV1995-1-1; Eurocode 5: Application and Development of BFRP. British Standards Institution: London, UK, 1994; pp. 46–52.
  39. GB 50005-2017; Standard for Design of Timber Strutures. Ministry of Housing and Urban-Rural Development of the People’s Republic of China. National Standard of the People’s Republic of China: Beijing, China, 2017; pp. 41–60.
Figure 1. Component dimensions.
Sustainability 14 16827 g001
Figure 2. Different BFRP arrangement for each group of specimens (mm). (a) BFRP arrangement of wooden columns in group ZC1; (b) BFRP arrangement of wooden columns in group ZRC2; (c) BFRP arrangement of wooden columns in group ZRC3; (d) PFRP arrangement of wooden columns in group ZRC4; (e) BFRP arrangement of wooden columns in group ZRC5.
Sustainability 14 16827 g002
Figure 3. Schematic diagram of glued wood hollow cylinder fabrication (unit: mm).(a) The process of making glued laminated wood hollow circular section columns; (b) Test piece fabrication; (c) Plane into hollow; (d) Wooden post gluing; (e) Finished test pieces.
Sustainability 14 16827 g003
Figure 4. Displacement gauge and strain gauge arrangement.
Sustainability 14 16827 g004
Figure 5. Specimen damage.
Sustainability 14 16827 g005
Figure 6. Load–longitudinal displacement.
Sustainability 14 16827 g006
Figure 7. Load–strain curve. (a) ZC1; (b) ZRC2; (c) ZRC3; (d) ZRC4; (e) ZRC5.
Sustainability 14 16827 g007aSustainability 14 16827 g007b
Figure 8. Ultimate load-bearing capacity–total area of BFRP paste.
Sustainability 14 16827 g008
Figure 9. Finite element model of the specimen.
Sustainability 14 16827 g009
Figure 10. Specimen test actual damage and finite element damage. (a) ZC1 test specimen end damage; (b) ZC1 finite element model end damage; (c) ZRC2 test specimen end damage; (d) ZRC2 finite element model end damage.
Sustainability 14 16827 g010aSustainability 14 16827 g010b
Figure 11. Load–longitudinal displacement of specimen test—finite element. (a) ZC1; (b) ZRC2.
Sustainability 14 16827 g011
Figure 12. Schematic diagram of βB taking on value.
Sustainability 14 16827 g012
Figure 13. Bearing capacity fitting after BFRP reinforcement.
Sustainability 14 16827 g013
Table 1. Specimen size.
Outer Diameter D (mm)Inner Diameter d (mm)Aspect RatioHeight (mm)
1206029.811000
Table 2. BFRP layout of specimen groupings.
Specimen No.Number of Specimens (Root)Number of BFRP (Strip)BFRP Distance (mm)
ZC120/
ZRC223190
ZRC32395
ZRC42456
ZRC5270
Notes: Z stands for axial pressure group; R stands for enhanced.
Table 3. Mechanical property parameters of wood taken from Refs. [35,36].
Density (g/cm3)Water Content (%)Tensile Strength (MPa)Compressive Strength (MPa)Flexural Strength (MPa)Modulus of Elasticity (MPa)
0.6612128.6846.0486.2310,300
Table 4. Physical and mechanical properties of structural adhesive taken from Ref. [37].
Solids Content (%)Shear Strength (MPa)Tensile Strength (MPa)Compressive Strength (MPa)Wood Breakage Rate (%)Modulus of Elasticity (MPa)
58 ± 3≥10≥40≥75≥70≥3500
Table 5. Main performance indicators of BFRP taken from Ref. [38].
Modulus of Elasticity (GPa)Compressive Strength (MPa)Thickness (mm)Elongation at Break (%)
26.215750.72.2
Table 6. Ultimate bearing capacity of axial compression groups.
SpecimenLongitudinal Displacement (mm)Average Value of Longitudinal Displacement Per Group (mm)Ultimate Load (kN)Average Value of Ultimate Load Per Group (kN)Stress (MPa)Average Value of Stress Per Group (MPa)Load Capacity Improvement Rate (%)
ZC1-12.682.77291.31296.7732.9935.000
ZC1-22.86302.2337.07
ZRC2-13.583.38338.13328.8539.8138.7911.06
ZRC2-23.18319.5737.77
ZRC3-12.802.98348.21340.0039.6240.1114.56
ZRC3-23.16331.7940.60
ZRC4-12.602.79367.67371.3342.9143.8025.12
ZRC4-22.98374.9944.69
ZRC5-12.792.83372.19375.8543.5144.3326.65
ZRC5-22.87379.5145.15
Table 7. Tension and compression strains under ultimate bearing capacities.
SpecimenLongitudinal Compressive Strain (με)Average Longitudinal Compressive Strain of Each Group (με)Transverse Tensile Strain (με)Average Value of Transverse Tensile Strain for Each Group (με)Vertical Strain Improvement Rate (%)Horizontal Strain Improvement Rate (%)Ultimate Load (kN)Average Value of Ultimate Load Per Group (kN)
ZC1-1−2676−2744127212600.00.0291.31296.77
ZC1-2−28121248302.23
ZRC2-1−3777−37181167118535.5−6.0338.13328.85
ZRC2-2−36591203319.57
ZRC3-1−5194−52341163115092.3−8.7348.21340.40
ZRC3-2−52741137331.79
ZRC4-1−3988−404499298047.4−22.2367.67371.30
ZRC4-2−4101968374.99
ZRC5-1−4676−473076175172.4−40.4372.19375.83
ZRC5-2−4784741379.51
Table 8. Ultimate bearing capacity of glued laminated wood columns; BFRP arrangement parameters.
Specimen No. p u (kN) p a (kN) S p (mm2) S t (mm2) k
ZC1-1291.31296.770544,667.920
ZC1-2302.23
ZRC2-1338.13328.85150,294.670.27
ZRC2-2319.57
ZRC3-1348.21340.40150,294.670.27
ZRC3-2331.79
ZRC4-1367.67371.30320,392.890.59
ZRC4-2374.99
ZRC5-1372.19375.83544,667.921
ZRC5-2379.51
Notes: p u and p a are the ultimate bearing capacity and the average value of the ultimate bearing capacity of each group of specimens, S p and S t are the total area of BFRP paste and the total area of the wooden column body, respectively, where the total area of the BFRP paste is the product of the single ring area of the BFRP and the total number of BFRP rings. k is the ratio of the total area of BFRP paste to the total area of the wooden column body, referred to as the BFRP area ratio.
Table 9. Timber physical and mechanical indicators.
Engineering Constant E T (MPa) E R (MPa) E L (MPa) G L R (MPa) G L T (MPa) G R T (MPa) u L R u L T u R T
Calculated values16,9001690845126810143040.360.480.53
Table 10. Timber yield strength ratio.
Yield Strength Ratio R 11 R 22 R 33 R 13 R 23 R 12
Values1.0000.8360.7770.9860.8160.816
Table 11. Improvements to the formula for the bearing capacity’s calculated value—finite element value and actual value comparison.
Specimen No. β B (kN) F a (kN) F (kN) F aB (kN) Error in Test Value and Calculated Value (%)Finite Element Simulation Value (kN)Error between Test Value and Finite Element Value (%)
ZC10296.77296.77301.721.67301.271.49
ZRC20.152296.77328.85324.32−1.38334.561.74
ZRC30.226296.77340343.921.03349.122.67
ZRC40.377296.77371.33369.86−0.39378.772.10
ZRC51296.77375.85376.220.10384.181.41
Publisher’s Note: MDPI stays neutral with regard to jurisdictional claims in published maps and institutional affiliations.