
A Multi-Criteria Decision-Making Framework for Sustainable Supplier Selection in the Circular Economy and Industry 4.0 Era

Abstract
1. Introduction
2. Theoretical Framework and Literature Review
2.1. Industry 4.0 and Circular Economy
2.2. Sustainable Supply Chains Management (SSCM)
2.3. Green Supplier Selection and Industry 4.0
3. Methodology
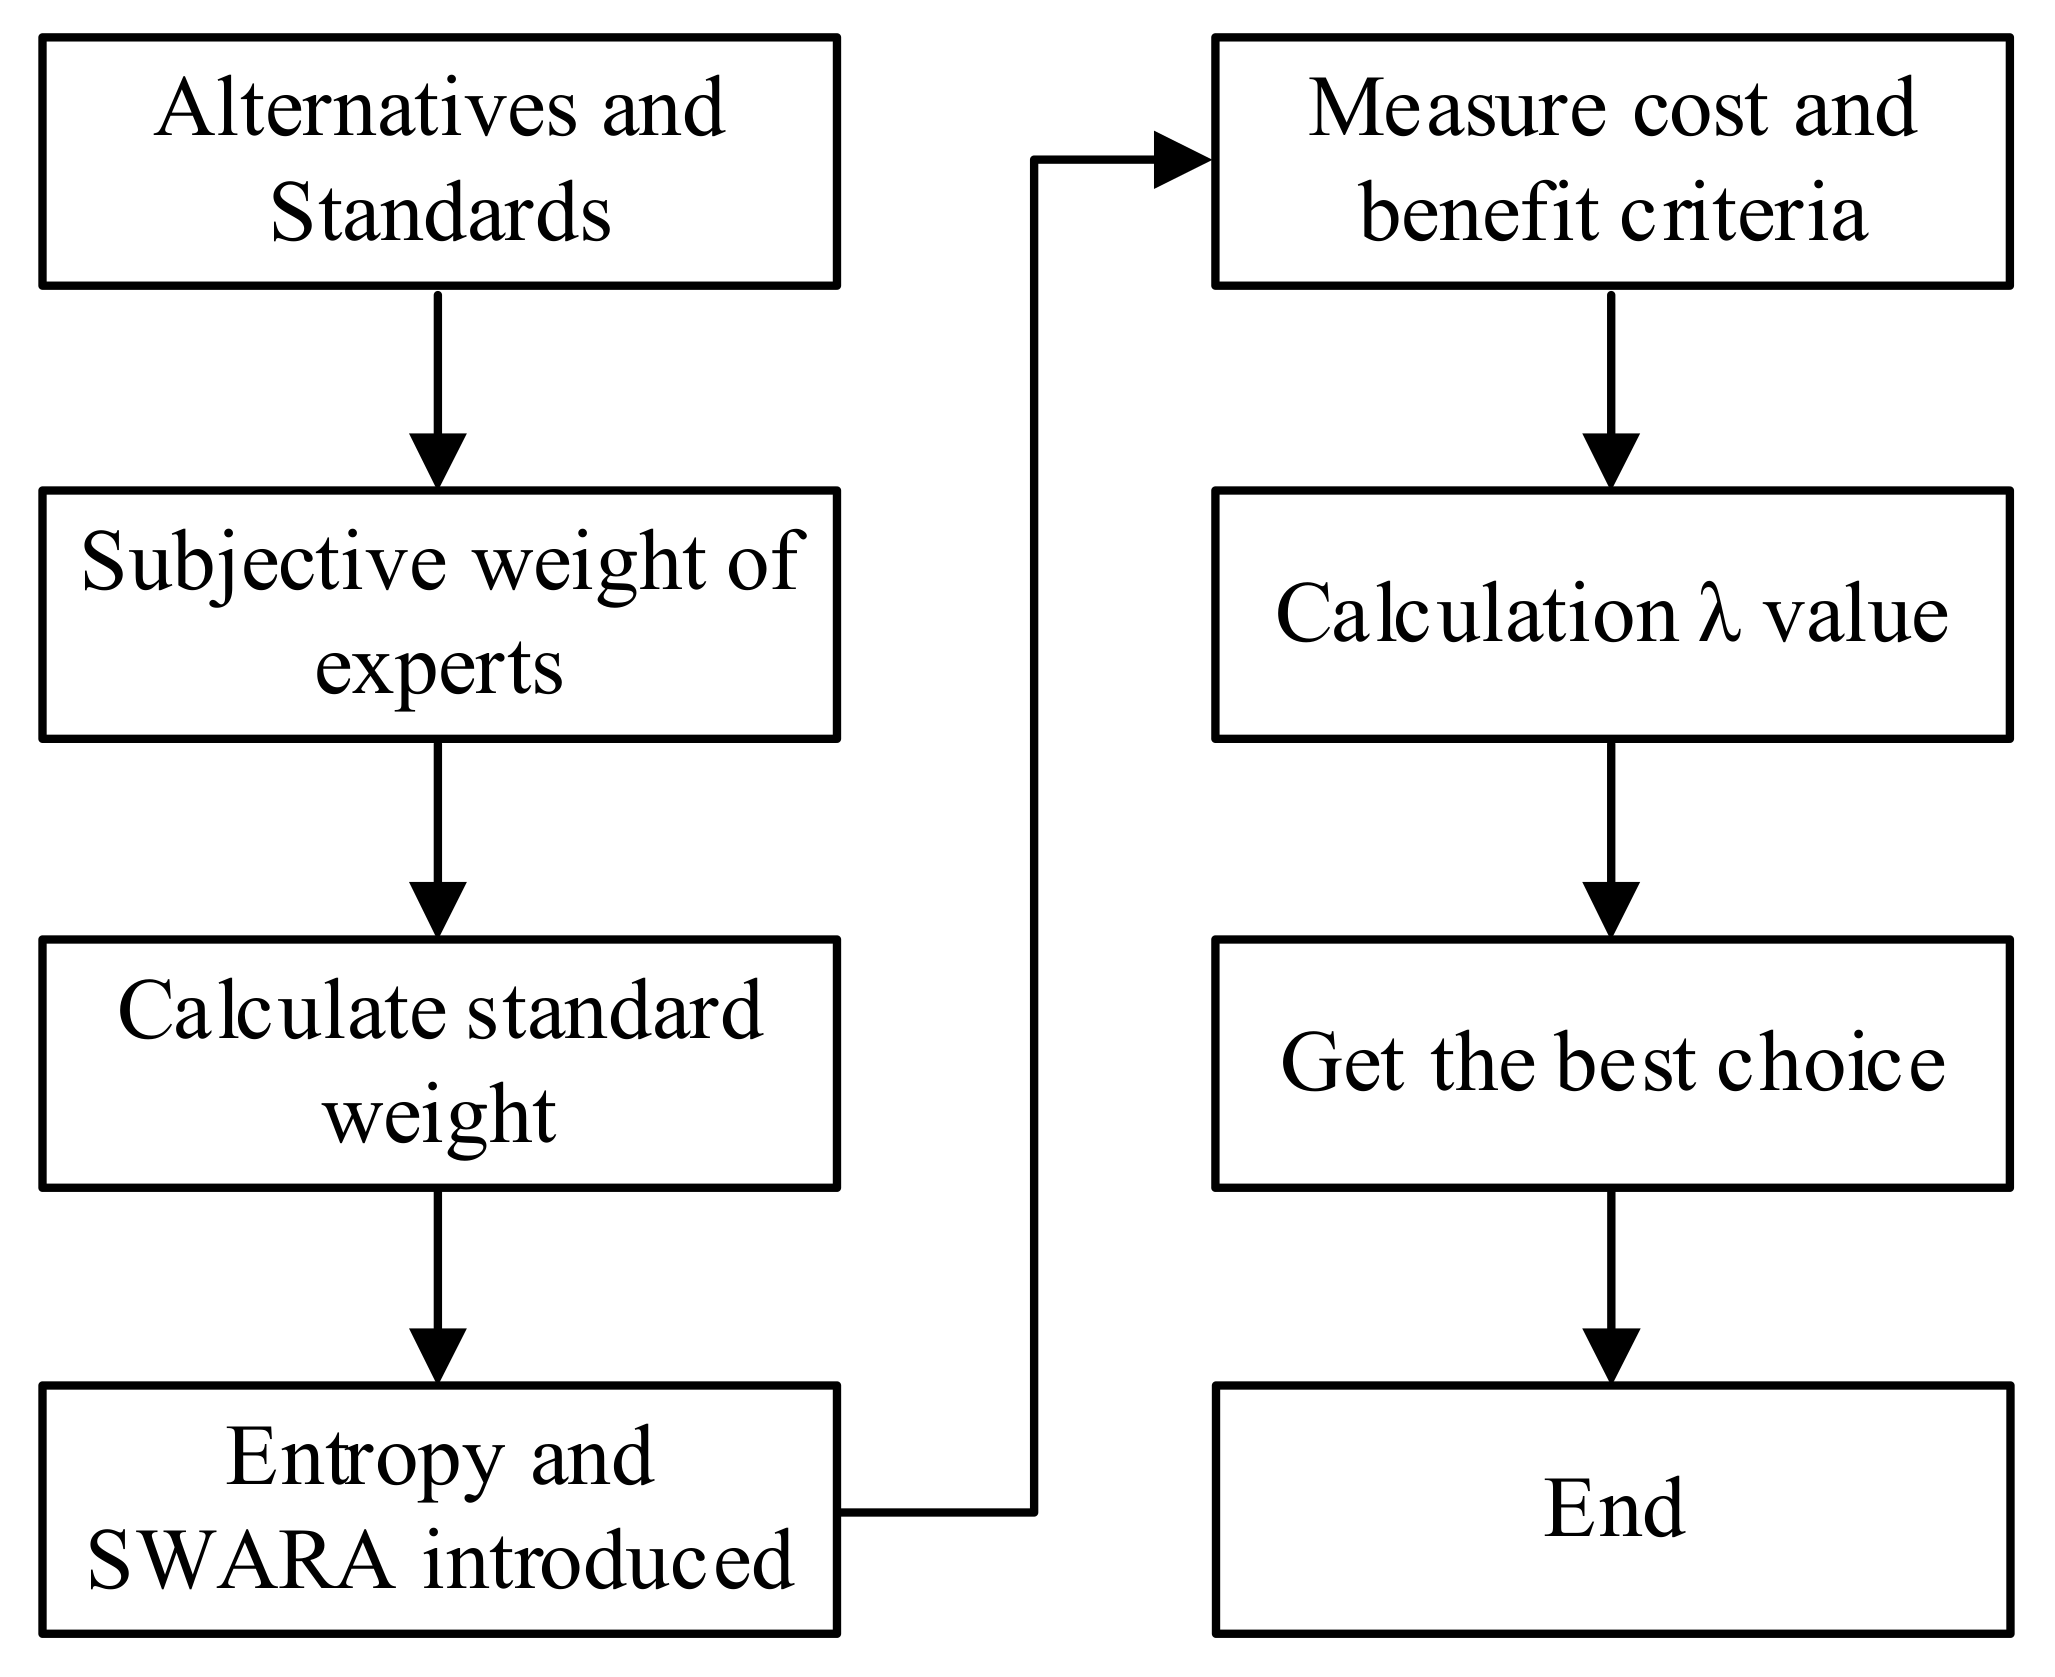
3.1. Empirical Framework
3.2. Entropy Measure for Pythagorean Fuzzy Sets
3.3. Pythagorean Fuzzy Entropy SWARA COPRAS Method
- First.
- Step 1: Create an alternative and a set of criteria.
- Second.
- Step 2: Assessment of weights based on the expert decision.
- Third.
- Step 3: Criteria weights for decision matrices.
- Fourth.
- Step 4: Criteria weights calculation through entropy and SWARA method.
- Calculation of the score values:
- B.
- Criteria Ranking.
- C.
- Calculate the average value’s relative importance.
- D.
- Estimation of comparative coefficient.
- E.
- Weights calculation.
- F.
- In this step the scaled weight is calculated as follows:
- Fifth.
- Step 5: We measured the sum of values for cost and benefit type criteria.
- Sixth.
- Step 6: The value of of ith option can be calculated as follows:
- Seventh.
- Step 7: The relative values of available options are used to specify the options for the priority degree in this method.
- Eighth.
- Step 8: The following is the formula for calculating each option degree of utility:
4. Results and Discussion
4.1. Case Study
4.2. The Evaluation of Alternative and Criteria
4.3. Criteria Weights USING ENTROPY and SWARA-COPRAS Method
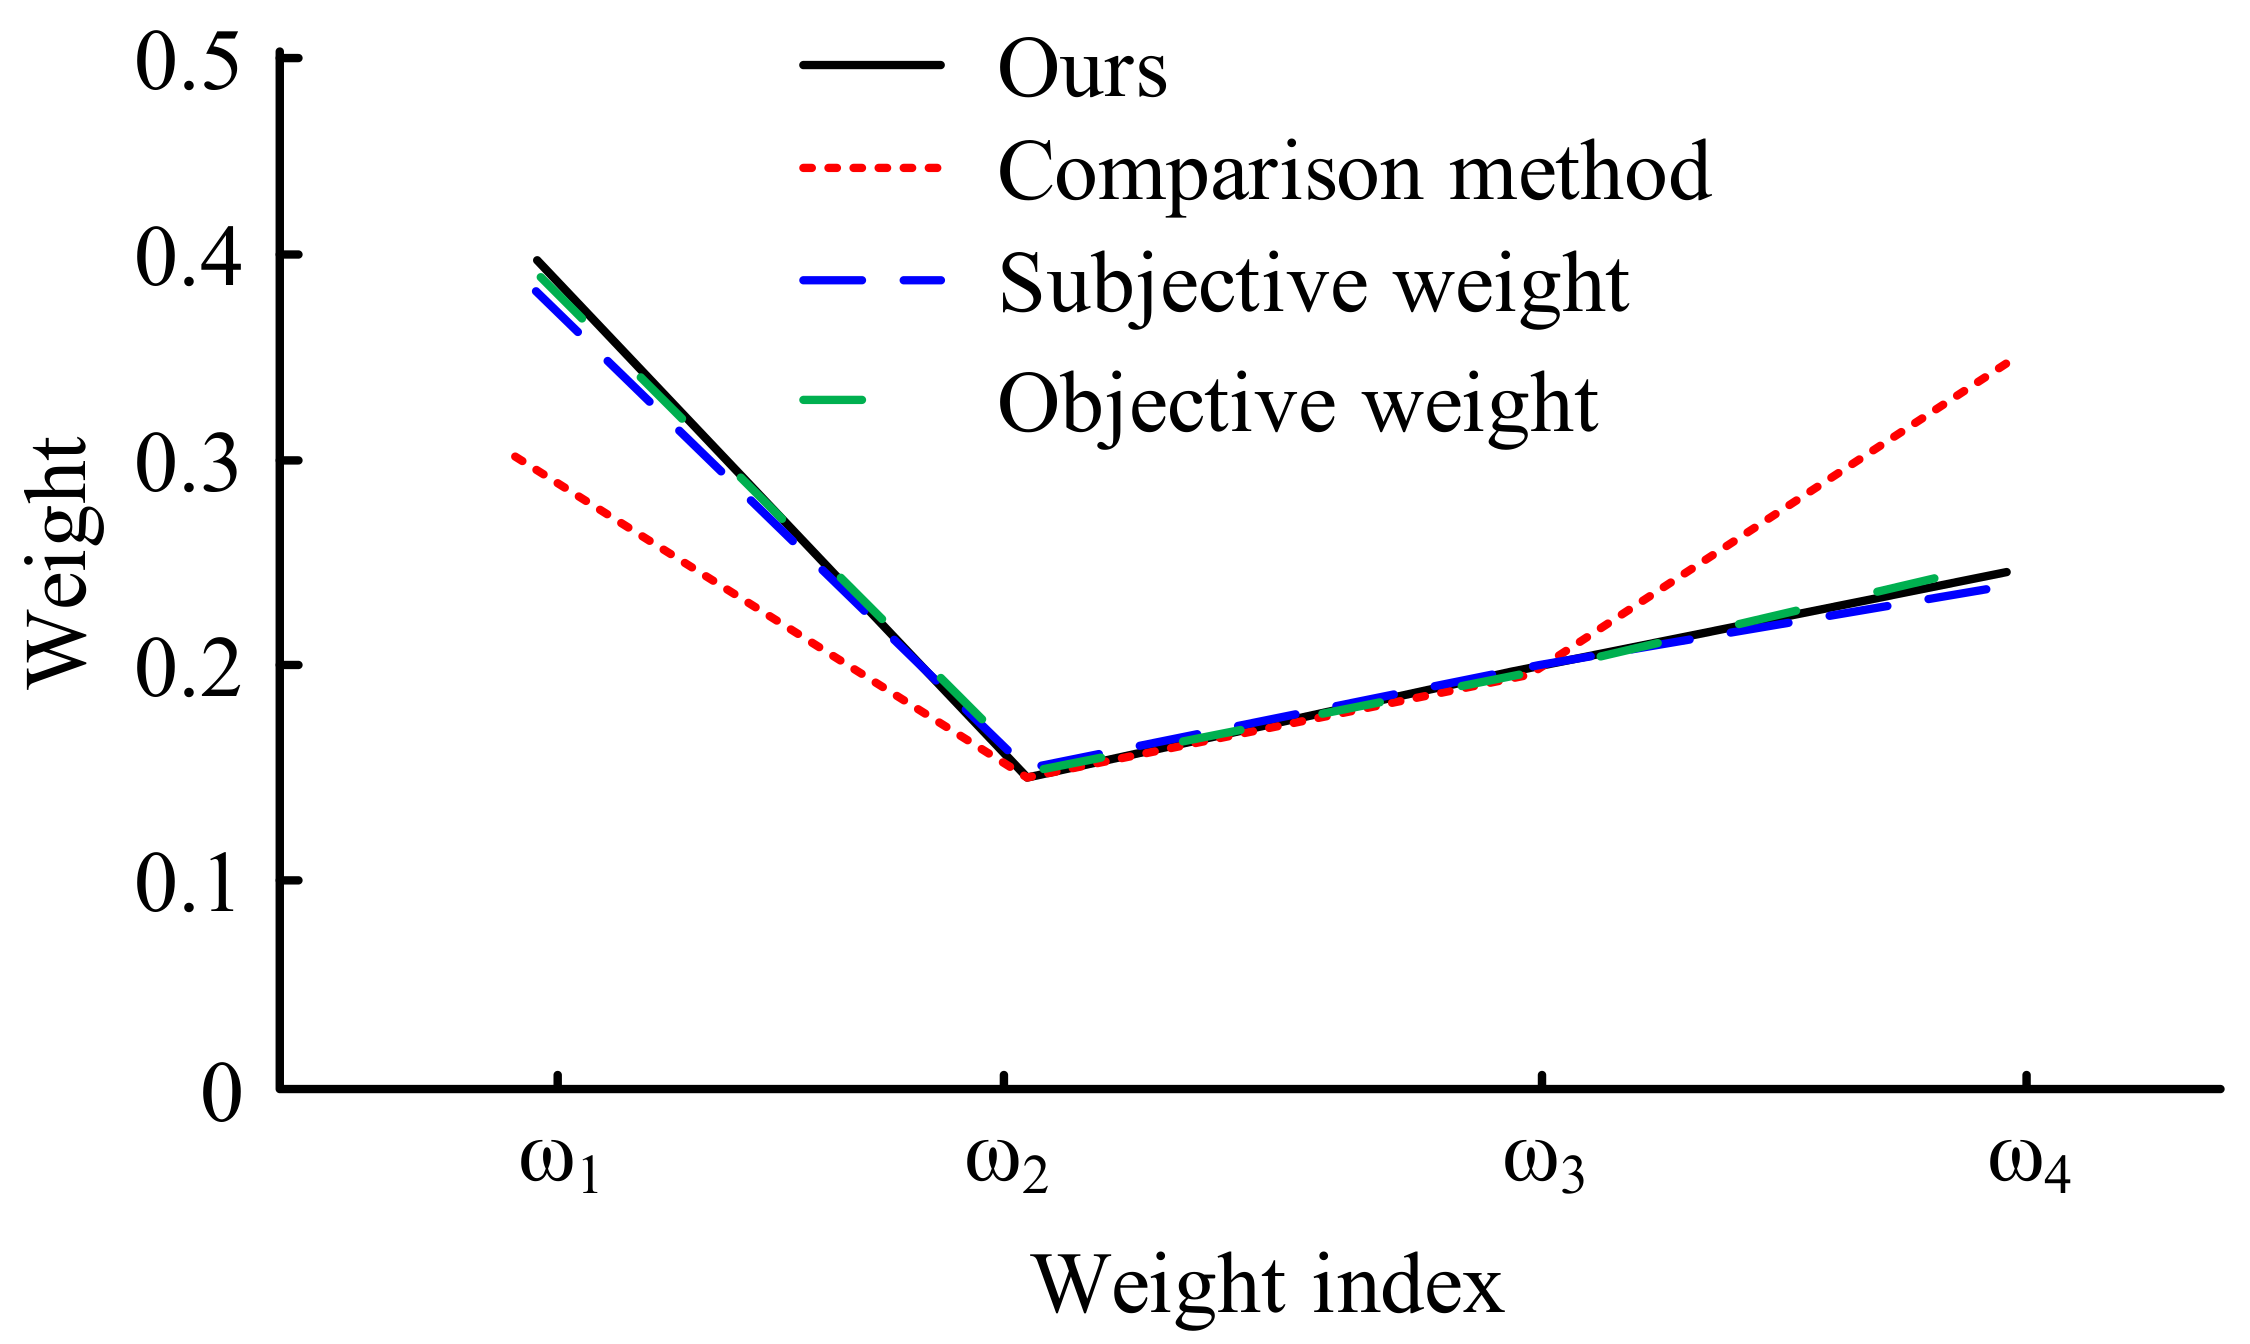
4.4. Sensitivity Analysis
5. Conclusions
5.1. Policy Implications
5.2. Study Limitations and Future Direction
Author Contributions
Funding
Institutional Review Board Statement
Informed Consent Statement
Data Availability Statement
Conflicts of Interest
References
- Elavarasan, R.M.; Pugazhendhi, R.; Shafiullah, G.M.; Irfan, M.; Anvari-Moghaddam, A. A hover view over effectual approaches on pandemic management for sustainable cities—The endowment of prospective technologies with revitalization strategies. Sustain. Cities Soc. 2021, 68, 102789. [Google Scholar] [CrossRef] [PubMed]
- Irfan, M.; Ahmad, M. Modeling consumers’ information acquisition and 5G technology utilization: Is personality relevant? Pers. Individ. Dif. 2022, 188, 111450. [Google Scholar] [CrossRef]
- Yang, C.; Hao, Y.; Irfan, M. Energy consumption structural adjustment and carbon neutrality in the post-COVID-19 era. Struct. Chang. Econ. Dyn. 2021, 59, 442–453. [Google Scholar] [CrossRef] [PubMed]
- Razzaq, A.; Cui, Y.; Irfan, M.; Maneengam, A. Asymmetric effects of fine particulate matter and stringency policy on COVID-19 intensity. Int. J. Environ. Health Res. 2022, 1–13. [Google Scholar] [CrossRef]
- Upadhyay, A.; Mukhuty, S.; Kumar, V.; Kazancoglu, Y. Blockchain technology and the circular economy: Implications for sustainability and social responsibility. J. Clean. Prod. 2021, 293, 126130. [Google Scholar] [CrossRef]
- Belhadi, A.; Kamble, S.S.; Jabbour, C.J.; Mani, V.; Khan, S.A.; Touriki, F.E. A self-assessment tool for evaluating the integration of circular economy and industry 4.0 principles in closed-loop supply chains. Int. J. Prod. Econ. 2021, 245, 108372. [Google Scholar] [CrossRef]
- Tang, C.; Irfan, M.; Razzaq, A.; Dagar, V. Natural resources and financial development: Role of business regulations in testing the resource-curse hypothesis in ASEAN countries. Resour. Policy 2022, 76, 102612. [Google Scholar] [CrossRef]
- Latif, Y.; Shunqi, G.; Bashir, S.; Iqbal, W.; Ali, S.; Ramzan, M. COVID-19 and stock exchange return variation: Empirical evidences from econometric estimation. Environ. Sci. Pollut. Res. 2021, 28, 60019–60031. [Google Scholar] [CrossRef]
- Yumei, H.; Iqbal, W.; Irfan, M.; Fatima, A. The dynamics of public spending on sustainable green economy: Role of technological innovation and industrial structure effects. Environ. Sci. Pollut. Res. 2021, 1, 22970–22988. [Google Scholar] [CrossRef]
- Khokhar, M.; Hou, Y.; Rafique, M.A.; Iqbal, W. Evaluating the social sustainability criteria of supply chain management in manufacturing industries: A role of BWM in MCDM. Probl. Ekorozwoju 2020, 15, 185–194. [Google Scholar] [CrossRef]
- Yu, F.; Schweisfurth, T. Industry 4.0 technology implementation in SMEs—A survey in the Danish-German border region. Int. J. Innov. Stud. 2020, 4, 76–84. [Google Scholar] [CrossRef]
- Tang, C.; Xue, Y.; Wu, H.; Irfan, M.; Hao, Y. How does telecommunications infrastructure affect eco-efficiency? Evidence from a quasi-natural experiment in China. Technol. Soc. 2022, 69, 101963. [Google Scholar] [CrossRef]
- Soo, V.K.; Doolan, M.; Compston, P.; Duflou, J.R.; Peeters, J.; Umeda, Y. The influence of end-of-life regulation on vehicle material circularity: A comparison of Europe, Japan, Australia and the US. Resour. Conserv. Recycl. 2021, 168, 105294. [Google Scholar] [CrossRef]
- Xiang, H.; Chau, K.Y.; Iqbal, W.; Irfan, M.; Dagar, V. Determinants of Social Commerce Usage and Online Impulse Purchase: Implications for Business and Digital Revolution. Front. Psychol. 2022, 13, 837042. [Google Scholar] [CrossRef] [PubMed]
- Fang, Z.; Razzaq, A.; Mohsin, M.; Irfan, M. Spatial spillovers and threshold effects of internet development and entrepreneurship on green innovation efficiency in China. Technol. Soc. 2022, 68, 101844. [Google Scholar] [CrossRef]
- Irfan, M.; Ahmad, M. Relating consumers’ information and willingness to buy electric vehicles: Does personality matter? Transp. Res. Part D Transp. Environ. 2021, 100, 103049. [Google Scholar] [CrossRef]
- Malesios, C.; De, D.; Moursellas, A.; Kumar, P. Socio-Economic Planning Sciences Sustainability performance analysis of small and medium sized enterprises: Criteria, methods and framework. Socioecon. Plann. Sci. 2021, 75, 100993. [Google Scholar] [CrossRef]
- Irfan, M.; Ahmad, M.; Fareed, Z.; Iqbal, N.; Sharif, A.; Wu, H. On the indirect environmental outcomes of COVID-19: Short-term revival with futuristic long-term implications. Int. J. Environ. Health Res. 2021, 32, 1271–1281. [Google Scholar] [CrossRef]
- Khokhar, M.; Iqbal, W.; Hou, Y.; Abbas, M.; Fatima, A. Assessing supply chain performance from the perspective of pakistan’s manufacturing industry through social sustainability. Processes 2020, 8, 1064. [Google Scholar] [CrossRef]
- Rao, F.; Tang, Y.M.; Chau, K.Y.; Iqbal, W.; Abbas, M. Assessment of energy poverty and key influencing factors in N11 countries. Sustain. Prod. Consum. 2022, 30, 1–15. [Google Scholar] [CrossRef]
- Casals, L.C.; Amante García, B.; Canal, C. Second life batteries lifespan: Rest of useful life and environmental analysis. J.Environ. Manag. 2019, 232, 354–363. [Google Scholar] [CrossRef] [PubMed]
- Geng, R.; Mansouri, S.A.; Aktas, E. The relationship between green supply chain management and performance: A meta-analysis of empirical evidences in Asian emerging economies. Int. J. Prod. 2017, 183, 245–258. [Google Scholar] [CrossRef]
- Achi, A.; Adeola, O.; Achi, F.C. CSR and green process innovation as antecedents of micro, small, and medium enterprise performance: Moderating role of perceived environmental volatility. J. Bus Res. 2022, 139, 771–781. [Google Scholar] [CrossRef]
- Mubarik, M.; Raja MohdRasi, R.Z.; Mubarak, M.F.; Ashraf, R. Impact of blockchain technology on green supply chain practices: Evidence from emerging economy. Manag. Environ. Qual. An. Int. J. 2021, 32, 1023–1039. [Google Scholar] [CrossRef]
- Bi, G.; Luo, Y.; Ding, J.; Liang, L. Environmental performance analysis of Chinese industry from a slacks-based perspective. Ann. Oper. Res. 2015, 228, 65–80. [Google Scholar] [CrossRef]
- Yadav, G.; Luthra, S.; Jakhar, S.K.; Mangla, S.K.; Rai, D.P. A framework to overcome sustainable supply chain challenges through solution measures of industry 4.0 and circular economy: An automotive case. J. Clean. Prod. 2020, 254, 120112. [Google Scholar] [CrossRef]
- Hopkins, J.L. An investigation into emerging industry 4.0 technologies as drivers of supply chain innovation in Australia. Comput. Ind. 2021, 125, 103323. [Google Scholar] [CrossRef]
- Ullah, U.; Bhatti, F.A.; Maud, A.R.; Asim, M.I.; Khurshid, K.; Maqsood, M. IoT-enabled computer vision-based parts inspection system for SME 4.0. Microprocess. Microsyst. 2021, 87, 104354. [Google Scholar] [CrossRef]
- Turkyilmaz, A.; Dikhanbayeva, D.; Suleiman, Z.; Shaikholla, S.; Shehab, E. Industry 4.0: Challenges and opportunities for Kazakhstan SMEs. Procedia CIRP 2021, 96, 213–218. [Google Scholar] [CrossRef]
- Zhang, Y.; Abbas, M.; Iqbal, W. Perceptions of GHG emissions and renewable energy sources in Europe, Australia and the USA. Environ. Sci. Pollut. Res. 2022, 29, 5971–5987. [Google Scholar] [CrossRef]
- Huang, H.; Chau, K.Y.; Iqbal, W.; Fatima, A. Assessing the role of financing in sustainable business environment. Environ. Sci. Pollut. 2022, 29, 7889–7906. [Google Scholar] [CrossRef] [PubMed]
- Sakthivadivel, M.; Nirmala, A.; Sakthivadivel, J.; Mukhilan, R.R.; Tennyson, S. Physicochemical and biological parameters of water at industrial sites of metropolitan city of Chennai, Tamil Nadu, India. Water Conserv. Manag. 2021, 4, 90–98. [Google Scholar] [CrossRef]
- Zheng, Y.; Han, W.; Yang, R. Does government behaviour or enterprise investment improve regional innovation performance?—Evidence from China. Int. J. Technol. Manag. 2021, 85, 274–296. [Google Scholar] [CrossRef]
- Kolla, S.; Minufekr, M.; Plapper, P. Deriving essential components of lean and industry 4.0 assessment model for manufacturing SMEs. Procedia CIRP 2019, 81, 753–758. [Google Scholar] [CrossRef]
- Lei, W.; Hui, Z.; Xiang, L.; Zelin, Z.; Xu-Hui, X.; Evans, S. Optimal Remanufacturing Service Resource Allocation for Generalized Growth of Retired Mechanical Products: Maximizing Matching Efficiency. IEEE Access 2021, 9, 89655–89674. [Google Scholar] [CrossRef]
- Lezoche, M.; Hernandez, J.E.; Díaz, M.D.M.E.A.; Panetto, H.; Kacprzyk, J. Agri-food 4.0: A survey of the supply chains and technologies for the future agriculture. Comput. Ind. 2020, 117, 103187. [Google Scholar] [CrossRef]
- Müller, J.M.; Buliga, O.; Voigt, K.-I. The role of absorptive capacity and innovation strategy in the design of industry 4.0 business Models—A comparison between SMEs and large enterprises. Eur. Manag. J. 2021, 39, 333–343. [Google Scholar] [CrossRef]
- Khan, S.A.R.; Razzaq, A.; Yu, Z.; Miller, S. Industry 4.0 and circular economy practices: A new era business strategies for environmental sustainability. Bus Strateg. Environ. 2021, 30, 4001–4014. [Google Scholar] [CrossRef]
- Fei, L.; Deng, Y.; Hu, Y. DS-VIKOR: A New Multi-criteria Decision-Making Method for Supplier Selection. Int. J. Fuzzy 2019, 21, 157–175. [Google Scholar] [CrossRef]
- Shao, X.F.; Liu, W.; Li, Y.; Chaudhry, H.R.; Yue, X.G. Multistage implementation framework for smart supply chain management under industry 4.0. Technol. Forecast Soc. Chang. 2021, 162, 120354. [Google Scholar] [CrossRef]
- Rees, W.E. Ecological footprints and appropriated carrying capacity: What urban economics leaves out. Ecol. Footpr. 1996, 4, 121–130. [Google Scholar] [CrossRef]
- Elkington, J. Partnerships from cannibals with forks: The triple bottom line of 21st-century business. Environ. Qual. Manag. 1998, 8, 37–51. [Google Scholar] [CrossRef]
- Allenby, B.R. Implementing industrial ecology: The AT&T matrix system. Interfaces 2000, 30, 42–54. [Google Scholar] [CrossRef]
- Ehrenfeld, J. Eco-efficiency. J. Ind. Ecol. 2005, 9, 6–8. [Google Scholar] [CrossRef]
- Matos, S.; Hall, J. Integrating sustainable development in the supply chain: The case of life cycle assessment in oil and gas and agricultural biotechnology. J. Oper. Manag. 2007, 25, 1083–1102. [Google Scholar] [CrossRef]
- Murphy, J.; Gouldson, A. Environmental policy and industrial innovation: Integrating environment and economy through ecological modernisation. Geoforum 2000, 31, 33–44. [Google Scholar] [CrossRef]
- Park, J.; Sarkis, J.; Wu, Z. Creating integrated business and environmental value within the context of China’s circular economy and ecological modernization. J. Clean. Prod. 2010, 18, 1494–1501. [Google Scholar] [CrossRef]
- Söderholm, P.; Bergquist, A.K.; Söderholm, K. Environmental Regulation in the Pulp and Paper Industry: Impacts and Challenges. Curr. Rep. 2019, 5, 185–198. [Google Scholar] [CrossRef]
- Gupta, H.; Kumar, A.; Wasan, P. Industry 4.0, cleaner production and circular economy: An integrative framework for evaluating ethical and sustainable business performance of manufacturing organizations. J. Clean. Prod. 2021, 295, 126253. [Google Scholar] [CrossRef]
- Dalenogare, L.S.; Benitez, G.B.; Ayala, N.F.; Frank, A.G. The expected contribution of Industry 4.0 technologies for industrial performance. Int. J. Prod. 2018, 204, 383–394. [Google Scholar] [CrossRef]
- Dev, N.K.; Shankar, R.; Swami, S. Diffusion of green products in Industry 4.0: Reverse logistics issues during design of inventory and production planning system. Int. J. Prod. Econ. 2020, 223, 107519. [Google Scholar] [CrossRef]
- Gul, M.; Ak, M.F. A comparative outline for quantifying risk ratings in occupational health and safety risk assessment. J. Clean. Prod. 2018, 196, 653–664. [Google Scholar] [CrossRef]
- Gul, M. Application of Pythagorean fuzzy AHP and VIKOR methods in occupational health and safety risk assessment: The case of a gun and rifle barrel external surface oxidation and colouring unit. Int. J. Occup. Saf. Erg. 2018, 26, 705–718. [Google Scholar] [CrossRef] [PubMed]
- Ghadimi, P.; Wang, C.; Lim, M.K.; Heavey, C. Intelligent sustainable supplier selection using multi-agent technology: Theory and application for Industry 4.0 supply chains. Comput. Ind. Eng. 2019, 127, 588–600. [Google Scholar] [CrossRef]
- Gupta, H.; Barua, M.K. A framework to overcome barriers to green innovation in SMEs using BWM and Fuzzy TOPSIS. Sci. Total Environ. 2018, 633, 122–139. [Google Scholar] [CrossRef] [PubMed]
- Das, S.; Das, R.; Tripathy, B.C. Multi-criteria group decision making model using single-valued neutrosophic set. LogForum 2020, 16, 421–429. [Google Scholar] [CrossRef]
- Banaeian, N.; Mobli, H.; Fahimnia, B.; Nielsen, I.E.; Omid, M. Green supplier selection using fuzzy group decision making methods: A case study from the agri-food industry. Comput. Oper. Res. 2018, 89, 337–347. [Google Scholar] [CrossRef]
- Chen, Z.; Ming, X.; Zhou, T.; Chang, Y. Sustainable supplier selection for smart supply chain considering internal and external uncertainty: An integrated rough-fuzzy approach. Appl. Soft. Comput. 2020, 87, 106004. [Google Scholar] [CrossRef]
- Hasan, M.M.; Jiang, D.; Ullah, A.M.M.S.; Noor-E-Alam, M. Resilient supplier selection in logistics 4.0 with heterogeneous information. Expert Syst. Appl. 2020, 139, 112799. [Google Scholar] [CrossRef]
- Çalık, A. A novel Pythagorean fuzzy AHP and fuzzy TOPSIS methodology for green supplier selection in the Industry 4.0 era. Soft Comput. 2021, 25, 2253–2265. [Google Scholar] [CrossRef]
- Stock, T.; Obenaus, M.; Kunz, S.; Kohl, H. Industry 4.0 as enabler for a sustainable development: A qualitative assessment of its ecological and social potential. Process Saf. Environ. Prot. 2018, 118, 254–267. [Google Scholar] [CrossRef]
- Schmitt, P.; Schmitt, J.; Engelmann, B. Evaluation of proceedings for SMEs to conduct I4.0 projects. Procedia CIRP 2019, 86, 257–263. [Google Scholar] [CrossRef]
- Kumar, S.; Raut, R.D.; Nayal, K.; Kraus, S.; Yadav, V.S.; Narkhede, B.E. To identify industry 4.0 and circular economy adoption barriers in the agriculture supply chain by using ISM-ANP. J. Clean. Prod. 2021, 293, 126023. [Google Scholar] [CrossRef]
- Junge, A.L.; Straube, F. Sustainable supply chains—Digital transformation technologies’ impact on the social and environmental dimension. Procedia Manuf. 2020, 43, 736–742. [Google Scholar] [CrossRef]
- Centobelli, P.; Cerchione, R.; Esposito, E. Pursuing supply chain sustainable development goals through the adoption of green practices and enabling technologies: A cross-country analysis of LSPs. Technol. Forecast. Soc. Chang. 2020, 153, 119920. [Google Scholar] [CrossRef]
- Pagell, M.; Shevchenko, A. Why research in sustainable supply chain management should have no future. J. Supply Chain. Manag. 2014, 50, 44–55. [Google Scholar] [CrossRef]
- Kouhizadeh, M.; Saberi, S.; Sarkis, J. Blockchain technology and the sustainable supply chain: Theoretically exploring adoption barriers. Int. J. Prod. Econ. 2021, 231, 107831. [Google Scholar] [CrossRef]
- Wu, Z.; Jia, F. Toward a theory of supply chain fields—Understanding the institutional process of supply chain localization. J. Oper. Manag. 2018, 58–59, 27–41. [Google Scholar] [CrossRef]
- Seuring, S.; Müller, M. From a literature review to a conceptual framework for sustainable supply chain management. J. Clean. Prod. 2008, 16, 1699–1710. [Google Scholar] [CrossRef]
- Koberg, E.; Longoni, A. A systematic review of sustainable supply chain management in global supply chains. J. Clean. Prod. 2019, 207, 1084–1098. [Google Scholar] [CrossRef]
- Majumdar, A.; Sinha, S.K. Analyzing the barriers of green textile supply chain management in Southeast Asia using interpretive structural modeling. Sustain. Prod. Consum. 2019, 17, 176–187. [Google Scholar] [CrossRef]
- Bhutta, M.K.S.; Muzaffar, A.; Egilmez, G.; Huq, F.; Malik, M.N.; Warraich, M.A. Environmental sustainability, innovation capacity, and supply chain management practices nexus: A mixed methods research approach. Sustain. Prod. Consum. 2021, 28, 1508–1521. [Google Scholar] [CrossRef]
- Bor, J.K.M. Green Supply Chain Management Practices and Performance of Food and Beverage Processing Sector in Kenya. 2021. Available online: http://ir.jkuat.ac.ke/handle/123456789/5498 (accessed on 7 April 2022).
- Govindan, K.; Rajendran, S.; Sarkis, J.; Murugesan, P. Multi criteria decision making approaches for green supplier evaluation and selection: A literature review. J. Clean. Prod. 2015, 98, 66–83. [Google Scholar] [CrossRef]
- Wu, B.; Wang, Q.; Fang, C.H.; Tsai, F.S.; Xia, Y. Capital flight for family? Exploring the moderating effects of social connections on capital outflow of family business. J. Int. Financ. Mark Inst. Money 2022, 77, 101491. [Google Scholar] [CrossRef]
- Mubarik, M.S.; Kazmi, S.H.A.; Zaman, S.I. Application of gray DEMATEL-ANP in green-strategic sourcing. Technol. Soc. 2021, 64, 101524. [Google Scholar] [CrossRef]
- Yazdani, M.; Chatterjee, P.; Zavadskas, E.K.; HashemkhaniZolfani, S. Integrated QFD-MCDM framework for green supplier selection. J. Clean. Prod. 2017, 142, 3728–3740. [Google Scholar] [CrossRef]
- Gupta, H.; Barua, M.K. Supplier selection among SMEs on the basis of their green innovation ability using BWM and fuzzy TOPSIS. J. Clean. Prod. 2017, 152, 242–258. [Google Scholar] [CrossRef]
- Yu, Y.; Huo, B. The impact of environmental orientation on supplier green management and financial performance: The moderating role of relational capital. J. Clean. Prod. 2019, 211, 628–639. [Google Scholar] [CrossRef]
- Zhang, Z.; Liu, S.; Niu, B. Coordination mechanism of dual-channel closed-loop supply chains considering product quality and return. J. Clean. Prod. 2020, 248, 119273. [Google Scholar] [CrossRef]
- Govindan, K.; Khodaverdi, R.; Vafadarnikjoo, A. Intuitionistic fuzzy based DEMATEL method for developing green practices and performances in a green supply chain. Expert Syst. Appl. 2015, 42, 7207–7220. [Google Scholar] [CrossRef]
- Khurana, S.; Haleem, A.; Luthra, S.; Mannan, B. Evaluating critical factors to implement sustainable oriented innovation practices: An analysis of micro, small, and medium manufacturing enterprises. J. Clean. Prod. 2021, 285, 125377. [Google Scholar] [CrossRef]
- Atanassov, K.T. Interval Valued Intuitionistic Fuzzy Sets. In Intuitionistic Fuzzy Sets; Physica: Heidelberg, Germany, 1999; pp. 139–177. [Google Scholar] [CrossRef]
- Zhuang, M.; Zhu, W.; Huang, L.; Pan, W.T. Research of influence mechanism of corporate social responsibility for smart cities on consumers’ purchasing intention. Libr. Hi Tech. 2021. ahead-of-print. [Google Scholar] [CrossRef]
- Maliene, V.; Dixon-Gough, R.; Malys, N. Dispersion of relative importance values contributes to the ranking uncertainty: Sensitivity analysis of Multiple Criteria Decision-Making methods. Appl. Soft Comput. 2018, 67, 286–298. [Google Scholar] [CrossRef]
- Mousavi-Nasab, S.H.; Sotoudeh-Anvari, A. A new multi-criteria decision making approach for sustainable material selection problem: A critical study on rank reversal problem. J. Clean. Prod. 2018, 182, 466–484. [Google Scholar] [CrossRef]
- Ghorabaee, M.K.; Amiri, M.; Zavadskas, E.K.; Turskis, Z.; Antucheviciene, J. A new hybrid simulation-based assignment approach for evaluating airlines with multiple service quality criteria. J. Air Transp. Manag. 2017, 63, 45–60. [Google Scholar] [CrossRef]
- Balali, A.; Hakimelahi, A.; Valipour, A. Identification and prioritization of passive energy consumption optimization measures in the building industry: An Iranian case study. J. Build. Eng. 2020, 30, 101239. [Google Scholar] [CrossRef]
- Rani, P.; Mishra, A.R.; Mardani, A. An extended Pythagorean fuzzy complex proportional assessment approach with new entropy and score function: Application in pharmacological therapy selection for type 2 diabetes. Appl. Soft Comput. 2020, 94, 106441. [Google Scholar] [CrossRef]
- Xu, J.; Dang, C. A novel fractional moments-based maximum entropy method for high-dimensional reliability analysis. Appl. Math. Model. 2019, 75, 749–768. [Google Scholar] [CrossRef]
- Saraswat, S.K.; Digalwar, A.K. Evaluation of energy alternatives for sustainable development of energy sector in India: An integrated Shannon’s entropy fuzzy multi-criteria decision approach. Renew Energy 2021, 171, 58–74. [Google Scholar] [CrossRef]
- Wang, Z.; Yao, L.; Chen, G.; Ding, J. Modified multiscale weighted permutation entropy and optimized support vector machine method for rolling bearing fault diagnosis with complex signals. ISA Trans. 2021, 114, 470–484. [Google Scholar] [CrossRef]
- Sharma, A.; Belokar, R.M.; Kumar, S. Multi-Response Optimization of Al2024/red mud MMC using Hybrid Taguchi-GRA-Entropy Optimization Technique. Mater. Today Proc. 2018, 5, 4748–4760. [Google Scholar] [CrossRef]
- Teerawattana, R.; Yang, Y.-C. Environmental Performance Indicators for Green Port Policy Evaluation: Case Study of Laem Chabang Port. Asian J. Shipp. Logist. 2019, 35, 63–69. [Google Scholar] [CrossRef]
- Alipour, M.; Hafezi, R.; Rani, P.; Hafezi, M.; Mardani, A. A new Pythagorean fuzzy-based decision-making method through entropy measure for fuel cell and hydrogen components supplier selection. Energy 2021, 234, 121208. [Google Scholar] [CrossRef]
- Shen, L.; Huang, Z.; Wong, S.W.; Liao, S.; Lou, Y. A holistic evaluation of smart city performance in the context of China. J. Clean. Prod. 2018, 200, 667–679. [Google Scholar] [CrossRef]
- Dobos, I.; Vörösmarty, G. Supplier selection: Comparison of DEA models with additive and reciprocal data. Cent. Eur. J. Oper. Res. 2020, 29, 447–462. [Google Scholar] [CrossRef]
- Kannan, D. Role of multiple stakeholders and the critical success factor theory for the sustainable supplier selection process. Int. J. Prod. 2018, 195, 391–418. [Google Scholar] [CrossRef]
- Schramm, V.B.; Cabral, L.P.B.; Schramm, F. Approaches for supporting sustainable supplier selection—A literature review. J. Clean. Prod. 2020, 273, 123089. [Google Scholar] [CrossRef]
- Giannakis, M.; Dubey, R.; Vlachos, I.; Ju, Y. Supplier sustainability performance evaluation using the analytic network process. J. Clean. Prod. 2020, 247, 119439. [Google Scholar] [CrossRef]
- Gupta, S.; Soni, U.; Kumar, G. Green supplier selection using multi-criterion decision making under fuzzy environment: A case study in automotive industry. Comput. Ind. Eng. 2019, 136, 663–680. [Google Scholar] [CrossRef]
- Meidute-Kavaliauskiene, I.; Yıldız, B.; Çiğdem, Ş.; Činčikaitė, R. An Integrated Impact of Blockchain on Supply. Logistics 2021, 5, 33. [Google Scholar] [CrossRef]
- Iqbal, W.; Fatima, A.; Yumei, H.; Abbas, Q.; Iram, R. Oil supply risk and affecting parameters associated with oil supplementation and disruption. J. Clean. Prod. 2020, 255, 120187. [Google Scholar] [CrossRef]
- Iqbal, W.; Tang, Y.M.; Lijun, M.; Chau, K.Y.; Xuan, W.; Fatima, A. Energy policy paradox on environmental performance: The moderating role of renewable energy patents. J. Environ. Manag. 2021, 297, 113230. [Google Scholar] [CrossRef] [PubMed]
- Irfan, M.; Akhtar, N.; Ahmad, M.; Shahzad, F.; Elavarasan, R.M.; Wu, H.; Yang, C. Assessing public willingness to wear face masks during the COVID-19 pandemic: Fresh insights from the theory of planned behavior. Int. J. Environ. Res. Public Health 2021, 18, 4577. [Google Scholar] [CrossRef] [PubMed]
- Irfan, M.; Razzaq, A.; Suksatan, W.; Sharif, A.; Elavarasan, R.M.; Yang, C.; Hao, Y.; Rauf, A. Asymmetric impact of temperature on COVID-19 spread in India: Evidence from quantile-on-quantile regression approach. J. Therm. Biol. 2022, 104, 103101. [Google Scholar] [CrossRef] [PubMed]
- Khokhar, M.; Zia, S.; Islam, T.; Sharma, A.; Iqbal, W.; Irshad, M. Going green supply chain management during COVID-19, assessing the best supplier selection criteria: A triple bottom line (tbl) approach. Probl. Ekorozwoju 2022, 17, 36–51. [Google Scholar] [CrossRef]
- Sarkis, J. A strategic decision framework for green supply chain management. J. Clean. Prod. 2003, 11, 397–409. [Google Scholar] [CrossRef]
- Shao, L.; Zhang, H.; Irfan, M. How public expenditure in recreational and cultural industry and socioeconomic status caused environmental sustainability in OECD countries? Econ. Res. Istraživanja 2021, 35, 4625–4642. [Google Scholar] [CrossRef]
- Jain, N.; Singh, A.R. Sustainable supplier selection under must-be criteria through Fuzzy inference system. J. Clean. Prod. 2020, 248, 119275. [Google Scholar] [CrossRef]
- Yu, Z.; Khan, S.A.R.; Umar, M. Circular economy practices and industry 4.0 technologies: A strategic move of automobile industry. Bus Strateg. Environ. 2021, 31, 796–809. [Google Scholar] [CrossRef]


| Reference | Method | Industry 4.0 and Circular Economy Features | Case Example |
|---|---|---|---|
| (Gul and Ak 2018) [52] | FTOPSIS, PFAHP | Rejection rate, Cost/price, delivery delay, Industry 4.0 technology | - |
| (Gul 2018) [53] | FVIKOR | cognitive computing, IoT, cloud computing, Cyber-Physical Systems (CPS) | A cement factory |
| (Ghadimi et al., 2019) [54] | Multi-Agent Systems (MASs) approach | Customer, Leadership, operation, product, culture, governance, people, technology, organization, and quality | Manufacturing firms |
| (Gupta et al., 2019) [55] | AHP, WASPAS and TOPSIS | Selective waste collection, product life cycle, waste sorting, product assembly, product selling, product printing, waste treatment | Automotive industry |
| (Dev et al., 2019) [51] | Rough-fuzzy DEMATEL-TOPSIS | Green purchasing, green design, green manufacturing, green and smart logistics, internal management awareness | A case study in new energy vehicle transmission |
| (Das et al., 2020) [56] | Single-valued neutrosophic numbers | 3D printing, automated guided vehicles, robotics | Automotive sector |
| (Banaeian et al., 2018) [57] | TOPSIS, VIKOR, and GRA methods | Big data, Additive manufacturing, cloud computing, autonomous robots, augmented reality, automatic vehicles, blockchain, cybersecurity, IoT, and artificial intelligence | Agri-food industry |
| (Chen et al., 2020) [58] | TOPSIS and Multi-Choice Goal Programming, Decision Support System, | traceability, Digitalization, supplier’s resource flexibility, agility, supply chain density, cybersecurity risk management, re-engineering, automation disruption, supply chain complexity, supply chain visibility, and information management, supplier reliability | Hypothetical case study |
| (Hasan et al., 2020) [59] | Fuzzy based TOPSIS method | Supply chain flexibility, Supply chain integration, intelligent inventory control, visibility through channels, communication, customer focus level, supply chain security, lead time improvement | Textile industry |
| (Çalık 2021) [60] | Pythagorean fuzzy AHP and fuzzy TOPSIS | Real-time capabilities and interoperability, virtualization, service orientation, cost of the recycled-material supplier, decentralization | Agricultural tools and machinery company |
| Summary | Industry 4.0 technology, network physical system, selective waste collection, green procurement, green intelligent logistics, internal management awareness, supply chain flexibility, cost of recycled materials suppliers | / | |
| Author | Content | Time |
|---|---|---|
| Seuring and Müller [69] | Consider the three goals of sustainable development: economy, environment and society | 2008 |
| Koberg and Longoni [70] | Policy support, social behavior and corporate image will promote the integration of sustainable development into the supply chain | 2019 |
| Majumdar and Sinha [71] | Sustainability to manage supply chain risk | 2019 |
| Bor [73] | Emergencies and disasters will affect the company’s image and financial health | 2021 |
| Author | Content | Time |
|---|---|---|
| Yazdani [77] | The selection of green suppliers should include the concepts of economy, green and sustainability | 2017 |
| Gupta [55] | Quantitative technology of economic sustainability considering environmental and social factors | 2021 |
| Zhang [80] | Invented fuzzy set theory | 2020 |
| Zhuang [84] | Introduce COPRAS to solve the MCDM problem | 2021 |
| Mubarik [76] | Combining ANP and fuzzy COPRAS to solve the fuzzy soft decision problem | 2021 |
| Dimension | Criteria | Reference |
|---|---|---|
| Economic dimensions (EC) | Product cost/price (ECO1) | (Dobos and Vörösmarty 2020) [97] |
| Quality of production (ECO3) | (Gupta et al., 2019) [55] | |
| Efficient production methods (ECO4) | (Govindan et al., 2015b) [74] | |
| Access to finance and financial availability for implementing Industry 4.0 within circular economy (ECO5) | (Hasan et al., 2020) [59] | |
| Information technology (IT) facilities (ECO6) | (Ghadimi et al., 2019) [54] | |
| Environmental dimensions (ENV) | Regular environmental audits (ENV1) | (Chen et al., 2020) [58] |
| Green product design (ENV2) | (Banaeian et al., 2018) [57] | |
| Environmental competence (ENV3) | (Çalık 2021) [60] | |
| Presence of training facilities (ENV4) | (Kannan 2018) [98] | |
| Collaboration in environmental initiatives using Industry 4.0 technologies (ENV5) | (Schramm et al., 2020) [99] | |
| Readiness to apply Industry 4.0 in green initiatives (ENV6) | (Giannakis et al., 2020) [100] | |
| R&D in environmental issues using Industry 4.0 technologies (ENV7) | (Mubarik et al., 2021b) [76] | |
| Social dimensions (SC) | Compliance with regulations (SOC1) | (Chen et al., 2020) [58] |
| Information disclosure (SOC2) | (Banaeian et al., 2018) [57] | |
| Social responsibility (SOC3) | (Çalık 2021) [60] | |
| Work safety procedures (SOC4) | (Hasan et al., 2020) [59] |
| Linguistic Values | PFNs |
|---|---|
| Extremely Very important | (0.9000, 0.1500) |
| Very very important | (0.8000, 0.2500) |
| Very important | (0.7000, 0.4000) |
| Important | (0.6000, 0.4500) |
| Less important | (0.3500, 0.7000) |
| Very less important | (0.1500, 0.9500) |
| Experts | LVs | PFNs | Weights |
|---|---|---|---|
| DM1 | Very very important | (0. 8000, 0.2500) | 0.5205 |
| DM2 | Very important | (0. 7500, 0.3500) | 0.4479 |
| DM3 | Important | (0. 6500, 0.4000) | 0.3816 |
| Criteria | S1 | S2 | S3 | S4 | S5 |
|---|---|---|---|---|---|
| ECO1 | (MH, H, M) | (MH, ML, VL) | (VL, L, ML) | (MH, L, M) | (VH, M, L) |
| ECO2 | (MH, L, H) | (L, ML, VL) | (H, L, ML) | (VH, VL, VVH) | (L, VH, MH) |
| ECO3 | (H, MH, M) | (H, MH, ML) | (MH, H, VVH) | (L, H, VH) | (L, MH, VVH) |
| ECO4 | (L, MH, VL) | (L, H, VH) | (H, ML, H) | (VH, VH, MH) | (VH, ML, L) |
| ECO5 | (VH, L, ML) | (M, L, MH) | (VH, ML, L) | (H, VH, L) | (VH, L, ML) |
| ENV1 | (H, MH, ML) | (L, MH, M) | (H, L, M) | (VL, VVH, H) | (H, VH, VL) |
| ENV2 | (VVH, LH, H) | (VL, H, VH) | (H, ML, VH) | (VL, ML, H) | (VH, ML, MH) |
| ENV3 | (M, H, ML) | (VH, H, M) | (H, L, ML) | (VVH, H, ML) | (L, ML, H) |
| ENV4 | (M, L, ML) | (H, VH, MH) | (VH, M, ML) | (VVH, MH, ML) | (H, VH, VVH) |
| ENV5 | (H, MH, ML) | (L, M, VL) | (H, VH, MH) | (L, H, MH) | (H, ML, L) |
| ENV6 | (M, ML, VL) | (ML, L, H) | (H, MH, VH) | (VVH, ML, L) | (M, L, ML) |
| ENV7 | (ML, VH, MH) | (H, L, ML) | (H, MH, VH) | (VH, ML, L) | (VH, H, VL) |
| SOC1 | (H, L, ML) | (VH, MH, L) | (H, M, L) | (VH, ML, L) | (VH, VVH, MH) |
| SOC2 | (M, VL, VVL) | (L, ML, VL) | (VH, H, ML) | (VH, H, L) | (H, VH, MH) |
| SOC3 | (M, ML, L) | (H, ML, VH) | (VVH, L, M) | (H, L, ML) | (L, VL, VVL) |
| SOC4 | (M, L, VL) | (MH, H, L) | (H, MH, VVH) | (M, VH, VVH) | (VL, L, ML) |
| Criteria | S1 | S2 | S3 | S4 | S5 |
|---|---|---|---|---|---|
| ECO1 | (0.620, 0.502, 0.603) | (0.597, 0.553, 0.582) | (0.733, 0.421, 0.534) | (0.847, 0.277, 0.453) | (0.687, 0.450, 0.571) |
| ECO2 | (0.491, 0.634, 0.597) | (0.772, 0.380, 0.509) | (0.711, 0.444, 0.544) | (0.800, 0.350, 0.487) | (0.686, 0.456, 0.567) |
| ECO3 | (0.321, 0.760, 0.565) | (0.377, 0.713, 0.591) | (0.521, 0.613, 0.594) | (0.585, 0.586, 0.560) | (0.234, 0.824, 0.516) |
| ECO4 | (0.448, 0.610, 0.597) | (0.349, 0.747, 0.509) | (0.481, 0.660, 0.544) | (0.667, 0.494, 0.487) | (0.274, 0.816, 0.567) |
| ECO5 | (0.200, 0.850, 0.487) | (0.337, 0.733, 0.591) | (0.620, 0.522, 0.586) | (0.875, 0.241, 0.421) | (0.326, 0.754, 0.570) |
| ENV1 | (0.818, 0.320, 0.478) | (0.522, 0.616, 0.590) | (0.526, 0.612, 0.591) | (0.455, 0.682, 0.573) | (0.732, 0.422, 0.534) |
| ENV2 | (0.637, 0.495, 0.591) | (0.466, 0.677, 0.570) | (0.308, 0.771, 0.558) | (0.525, 0.579, 0.624) | (0.604, 0.536, 0.590) |
| ENV3 | (0.614, 0.562, 0.555) | (0.318, 0.758, 0.569) | (0.587, 0.572, 0.573) | (0.628, 0.549, 0.551) | (0.593, 0.567, 0.572) |
| ENV4 | (0.515, 0.622, 0.591) | (0.319, 0.766, 0.558) | (0.289, 0.792, 0.538) | (0.638, 0.523, 0.565) | (0.587, 0.572, 0.573) |
| ENV5 | (0.787, 0.354, 0.505) | (0.515, 0.622, 0.591) | (0.522, 0.616, 0.590) | (0.653, 0.508, 0.561) | (0.775, 0.369, 0.513) |
| ENV6 | (0.297, 0.789, 0.539) | (0.269, 0.788, 0.554) | (0.587, 0.572, 0.573) | (0.593, 0.567, 0.572) | (0.604, 0.557, 0.570) |
| ENV7 | (0.732, 0.422, 0.535) | (0.466, 0.677, 0.570) | (0.481, 0.660, 0.578) | (0.492, 0.638, 0.593) | (0.795, 0.344, 0.499) |
| SOC1 | (0.579, 0.568, 0.585) | (0.300, 0.774, 0.557) | (0.658, 0.502, 0.561) | (0.702, 0.458, 0.545) | (0.769, 0.385, 0.510) |
| SOC2 | (0.667, 0.494, 0.557) | (0.491, 0.634, 0.597) | (0.297, 0.789, 0.539) | (0.512, 0.637, 0.576) | (0.686, 0.475, 0.552) |
| SOC3 | (0.484, 0.644, 0.593) | (0.492, 0.638, 0.593) | (0.515, 0.622, 0.591) | (0.653, 0.508, 0.561) | (0.638, 0.523, 0.565) |
| SOC4 | (0.574, 0.572, 0.586) | (0.364, 0.720, 0.591) | (0.616, 0.534, 0.579) | (0.265, 0.789, 0.555) | (0.620, 0.502, 0.603) |
| Sub-Criteria | Fuzzy Average Weights | Crisp Values |
|---|---|---|
| ECO1 | 0.728, 0.426, 0.537 | 0.7077 |
| ECO2 | 0.484, 0.644, 0.593 | 0.4305 |
| ECO3 | 0.709, 0.433, 0.557 | 0.6899 |
| ECO4 | 0.644, 0.516, 0.576 | 0.6027 |
| ECO5 | 0.723, 0.433, 0.539 | 0.7004 |
| ENV1 | 0.308, 0.771, 0.558 | 0.2625 |
| ENV2 | 0.477, 0.676, 0.562 | 0.4043 |
| ENV3 | 0.465, 0.704, 0.537 | 0.3780 |
| ENV4 | 0.739, 0.414, 0.532 | 0.7214 |
| ENV5 | 0.340, 0.736, 0.586 | 0.3014 |
| ENV6 | 0.659, 0.517, 0.546 | 0.6132 |
| ENV7 | 0.559, 0.533, 0.635 | 0.5397 |
| SOC1 | 0.545, 0.597, 0.588 | 0.4935 |
| SOC2 | 0.272, 0.782, 0.561 | 0.2426 |
| SOC3 | 0.507, 0.603, 0.616 | 0.4683 |
| SOC4 | 0.781, 0.348, 0.519 | 0.7812 |
| Criteria | Crisp Values | ||||
|---|---|---|---|---|---|
| ECO5 | 0.8160 | 0.0669 | 0.8664 | 0.9776 | 0.0738 |
| SOC2 | 0.7541 | 0.0629 | 0.9161 | 0.9247 | 0.0698 |
| ECO6 | 0.7392 | 0.0140 | 0.8772 | 0.9128 | 0.0689 |
| ECO1 | 0.7322 | 0.0080 | 0.8728 | 0.9068 | 0.0678 |
| ENV4 | 0.7212 | 0.0110 | 0.8754 | 0.8978 | 0.0678 |
| ENV7 | 0.6404 | 0.0798 | 0.9296 | 0.8370 | 0.0629 |
| ENV2 | 0.6295 | 0.0110 | 0.8754 | 0.8279 | 0.0618 |
| SOC4 | 0.6135 | 0.0170 | 0.8790 | 0.8160 | 0.0618 |
| ENV3 | 0.5636 | 0.0499 | 0.9053 | 0.7811 | 0.0589 |
| ECO4 | 0.5158 | 0.0479 | 0.9043 | 0.7481 | 0.0559 |
| ENV6 | 0.4898 | 0.0259 | 0.8872 | 0.7302 | 0.0549 |
| ENV5 | 0.4499 | 0.0399 | 0.8980 | 0.7053 | 0.0550 |
| SOC1 | 0.4369 | 0.0130 | 0.8772 | 0.6963 | 0.0529 |
| ECO3 | 0.4229 | 0.0140 | 0.8772 | 0.6873 | 0.0519 |
| SOC3 | 0.3950 | 0.0279 | 0.8881 | 0.6714 | 0.0509 |
| ENV1 | 0.3471 | 0.0479 | 0.9043 | 0.6424 | 0.0479 |
| Alternatives | ||||||
| S1 | (0.552, 0.619, 0.558) | 0.438 | (0.222, 0.921, 0.320) | 0.101 | 0.635 | 92.713 |
| S2 | (0.388, 0.741, 0.549) | 0.286 | (0.288, 0.896, 0.337) | 0.14 | 0.428 | 62.506 |
| S3 | (0.506, 0.657, 0.559) | 0.391 | (0.314, 0.882, 0.350) | 0.16 | 0.516 | 75.307 |
| S4 | (0.583, 0.595, 0.553) | 0.468 | (0.381, 0.847, 0.371) | 0.214 | 0.561 | 81.957 |
| S5 | (0.610, 0.568, 0.553) | 0.499 | (0.273, 0.902, 0.334) | 0.131 | 0.651 | 95.000 |
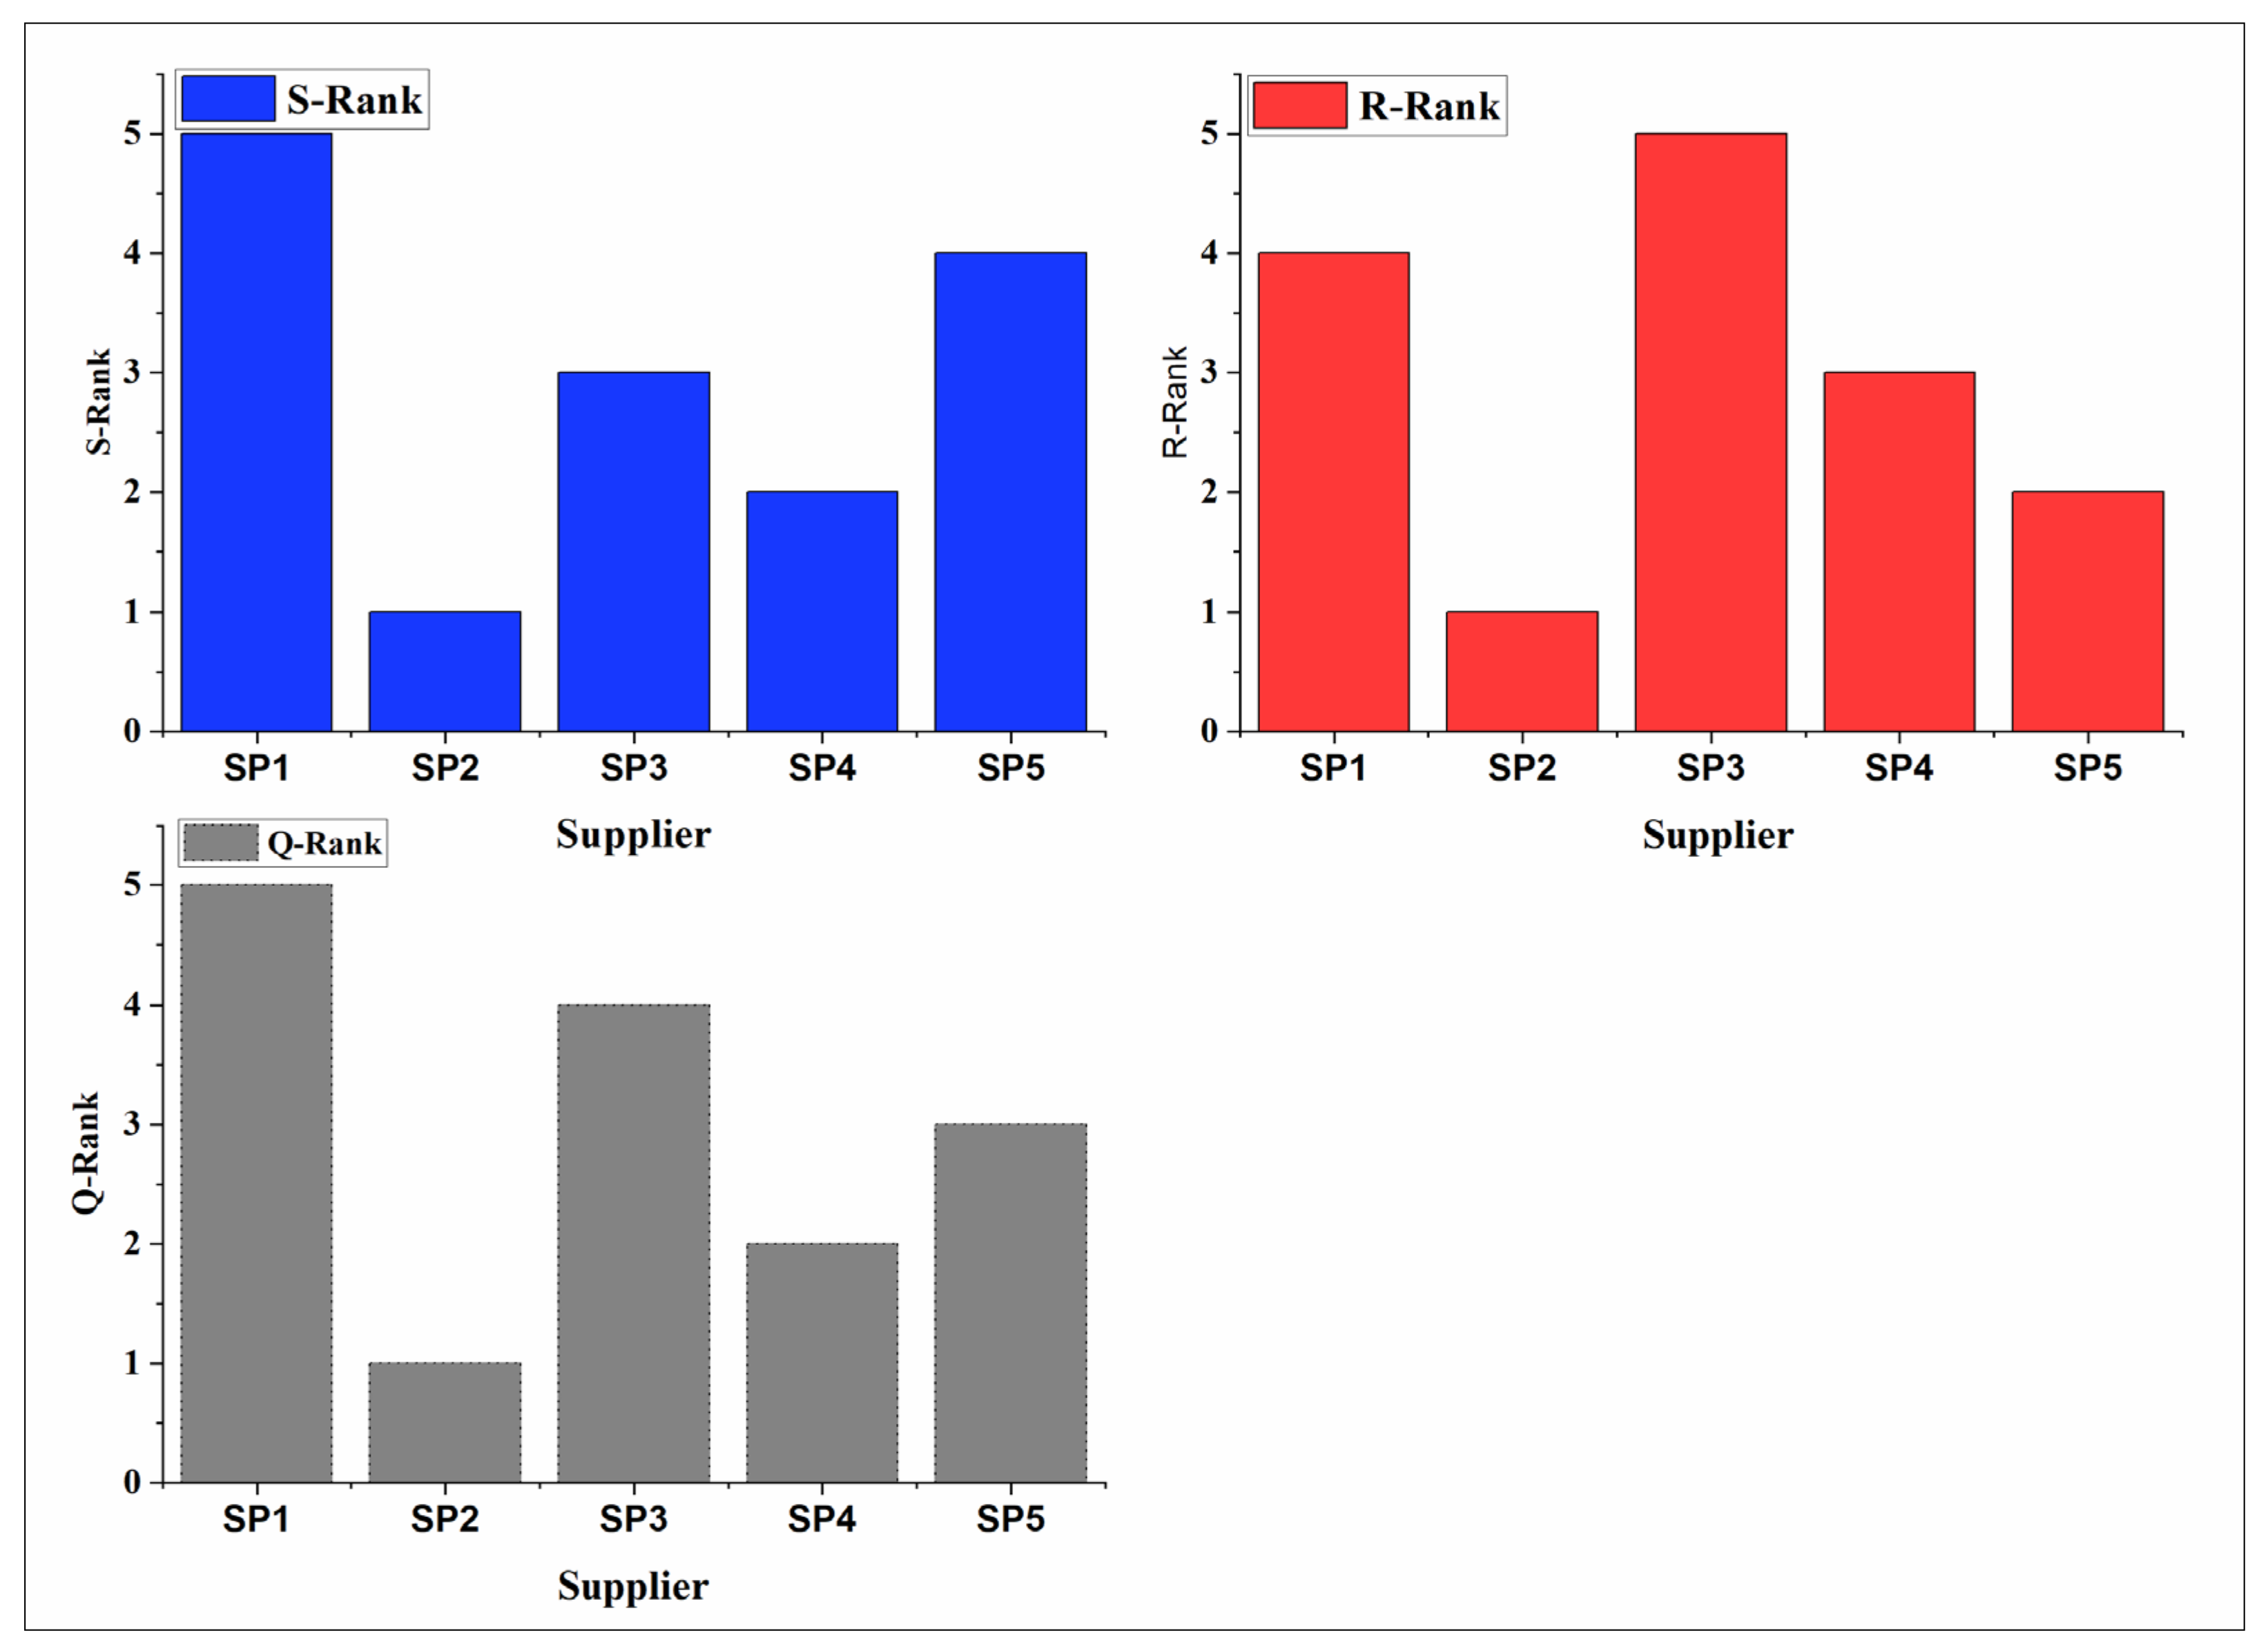
| Supplier | R | Rank | S | Rank | Q | Rank |
|---|---|---|---|---|---|---|
| S5 | 0.1529 | 1 | 0.8915 | 1 | 0.9072 | 1 |
| S1 | 0.1461 | 2 | 0.7308 | 2 | 0.7288 | 2 |
| S4 | 0.1060 | 4 | 0.4211 | 3 | 0.6093 | 3 |
| S3 | 0.1110 | 3 | 0.4169 | 4 | 0.4461 | 4 |
| S2 | 0.0924 | 5 | 0.3569 | 5 | 0.3175 | 5 |
Publisher’s Note: MDPI stays neutral with regard to jurisdictional claims in published maps and institutional affiliations. |
© 2022 by the authors. Licensee MDPI, Basel, Switzerland. This article is an open access article distributed under the terms and conditions of the Creative Commons Attribution (CC BY) license (https://creativecommons.org/licenses/by/4.0/).
Share and Cite
Xie, Z.; Tian, G.; Tao, Y. A Multi-Criteria Decision-Making Framework for Sustainable Supplier Selection in the Circular Economy and Industry 4.0 Era. Sustainability 2022, 14, 16809. https://doi.org/10.3390/su142416809
Xie Z, Tian G, Tao Y. A Multi-Criteria Decision-Making Framework for Sustainable Supplier Selection in the Circular Economy and Industry 4.0 Era. Sustainability. 2022; 14(24):16809. https://doi.org/10.3390/su142416809
Chicago/Turabian StyleXie, Ziyuan, Guixian Tian, and Yongchao Tao. 2022. "A Multi-Criteria Decision-Making Framework for Sustainable Supplier Selection in the Circular Economy and Industry 4.0 Era" Sustainability 14, no. 24: 16809. https://doi.org/10.3390/su142416809
APA StyleXie, Z., Tian, G., & Tao, Y. (2022). A Multi-Criteria Decision-Making Framework for Sustainable Supplier Selection in the Circular Economy and Industry 4.0 Era. Sustainability, 14(24), 16809. https://doi.org/10.3390/su142416809