Abstract
Land is a vital component of nature around the world and is essential for humans, terrestrial plants, and animals. However, urbanization is growing worldwide and the groundwater quality in urban areas is declining due to rapid development, industrialization, and pollution. Hence, it is important to determine the hydrogeochemistry and changes concerning land use and land cover (LULC). This study was conducted to investigate the hydrogeochemical mechanism of Sargodha, one of Pakistan’s fastest-growing cities, during 2015 and 2021 under two different LULC indices named normalized difference vegetation index (NDVI) and normalized difference built-up index (NDBI). Forty-eight groundwater samples were collected in 2015 and 2021 to assess groundwater quality for domestic use and irrigation. The Piper diagram revealed that (Ca2++Mg2+–HCO3−+CO32−) and (Na++K+–SO42−+Cl−) were the main components of hydrogeochemistry in both years. The Gibbs plot and silicate weathering of groundwater samples indicated that rock dominance and silicate weathering played a major role in aquifers. Additionally, the results showed that 4% of the groundwater in 2015 and 21% of the groundwater samples in 2021 were unfit for human consumption. However, 37% and 40% of samples were considered not fit for irrigation in 2015 and 2021, respectively. The LULC, NDVI, and NDBI clearly revealed higher urban areas in 2021 compared to 2015. The relationship between groundwater parameters and land use land cover indices (NDVI and NDBI) explained that none had a major relationship. The non-carcinogenic risk showed health quotient HQ < 1, indicating no severe health risk due to nitrate (NO3−) exposure in the city. The current study suggests conducting future investigations considering a larger scale to recommend efficient management strategies, urbanization planning, and ensuring safe irrigation and drinking water to prevent groundwater pollution.
Keywords:
groundwater; hydrogeochemistry; land use; NDBI; NDVI; health risks model; non-carcinogenic risk 1. Introduction
Land is an essential component of nature worldwide for wildlife, and urbanization is also rising worldwide, which pollutes the environment [1]. The most accessible and important source of fresh water on the planet is groundwater for drinking, agricultural, and industrial purposes, and for the advancement of society [2,3,4,5,6,7]. Evaluating groundwater quality is essential to conserving the ecological environment and forms the basis of the sustainable use of local groundwater resources [8,9,10]. Chemical and microbiological pollution in groundwater regularly threatens its quality [11,12,13,14]. Nitrate (NO3−) is a global contaminant in groundwater and prolonged use of NO3−-contaminated groundwater can cause a blue baby syndrome in infants, while contaminated groundwater due to heavy metal can cause cancer in the lungs, liver, kidneys, bladder, and skin [15,16]. Due to industrial, agricultural, and population growth, the world’s natural resources are overexploited and climate change threatens billions of people’s agriculture, food security, and rural livelihoods [10]. Land cover (LC) is the land’s physical qualities, such as forest, mountains, and water, while land use (LU) is the change in land cover owing to human activities and needs, like roads and urban infrastructure [17,18]. Urbanization, industrialization, and mining has affected land cover and water quality in recent years. However, more than four billion people live in urban areas, and it is estimated that more than two-thirds of the world’s population will reside in urban areas by 2050. Land use land cover (LULC) models combine natural and social aspects of human activity in time and place [19,20]. Human activities have profoundly influenced ecosystem processes, biodiversity, hydrology, and climate in recent years, and urbanization in some locations may impact land use and soil physical and chemical qualities [21,22,23,24]. Land use land cover may be analyzed using remote sensing (RS) and geographic information system (GIS); RS- and GIS-based groundwater contamination assessments were given improved environment and ecosystem management features [24,25,26,27]. Different RS information has helped spatial studies of urban patterns, planning, and variance on global, regional, and local scales in recent years; such information links local environmental study to international, national, and regional management and protection of LULC [28].
The US Geological Survey (USGS) started assessing the effects of LULC change on groundwater quality in 1984 [29]. Many scholars have investigated groundwater quality and LULC changes since 1984 [30,31,32,33,34]. Extreme urbanization and LULC changes negatively affect groundwater quality [35,36]. The LULC directly affects groundwater pollution through human activities on the land surface [37,38,39]. LULC and its alterations impact natural drivers on the groundwater and urban groundwater quality and quantity [40,41]. Population increase, agricultural growth, mineral development, and changes in management strategies may reduce groundwater quality [42]. Pakistan is one of thirty-six nations with very high baseline water stress levels; 80% of available water is susceptible to household, agricultural, and industrial shortages, water resource deficit, and storage capacity [43,44,45]. In recent decades, several causes have weakened Pakistan’s groundwater [46]. Most LULC and groundwater quality research were conducted on basin or sub-catchment area sizes [47,48]. The surface environment has been used to study groundwater quality in recent years [49,50]. The chemical composition of aquifers is critical for groundwater safety and is closely linked to human health hazards. Induced by exposure to pollutants in groundwater via different pathways, there have been various studies in Pakistan on the health implications of hazardous components in groundwater [51,52,53]. Land cover has been compared with hydrochemistry on various time scales [54,55]. In recent years, the use of remote sensing indices, like normalized difference vegetation index (NDVI), normalized difference built-up index (NDBI), and normalized difference water index (NDWI) for water management, is increasing [56]. NDVI is an effective indicator of plant or vegetation density which can be used to investigate how vegetation indices affect groundwater quality.
In recent decades, the groundwater sources of Pakistan, especially in Sargodha, are significantly vulnerable due to rapid industrialization, mining activities, agricultural practices, and urbanization which have made the groundwater sources susceptible both in terms of quality and quantity. Therefore, examining the link between groundwater quality, urbanization, normalized difference vegetation index (NDVI), and normalized difference built-up index (NDBI) patterns is necessary. This study examines the changes in the quality of groundwater used for irrigation and drinking, and the relationship between vegetation, built-up indices with groundwater quality, and the health risk model in 2015 and 2021.
2. Materials and Methods
2.1. Study Area
Sargodha is a city in Punjab, Pakistan’s most populous province, lies between 31°34′ to 32°36′ N and 72°10′ to 73°18′ E, covering an area of 5854 km2 (Figure 1), and is surrounded by the Chenab river and the Jhang and Khushab districts [57]. The recharge processes of aquifer are rain and surface water. The climate is hot and semiarid; the temperature is 23.8 °C and it has 410 mm of precipitation annually [58]. The average potential evapotranspiration (PET) in 2015 was 89.09 mm and it increased to 95.17 mm in 2021. Wheat, rice, sugarcane, and cotton are the main crops. Exploratory drilling discovered that 1500 m thick quaternary alluvium (Kharana Hills) covered Precambrian basement rocks, shattering the plain’s flat relief. Meander-belt deposits, stream-belt deposits, and flood-plain deposits cover the region. The soils are alluvial material carried by the Indus and its streams. The thickness of different strata of alluvial deposits varies greatly from one another. The soil has a modest quantity of fine sand and clay, and gravel, sand, silt, and clay make up the alluvial complex; silty or clay sand contains pebbles made of siltstone and mudstone [59]. Alluvial deposits provide a cohesive non-artesian aquifer while being diverse [60]. The strata in the uppermost 300 feet are very productive despite their compact nature. The water table in the region is 2 to 7 m deep, with an average depth of 3.5 m [59].
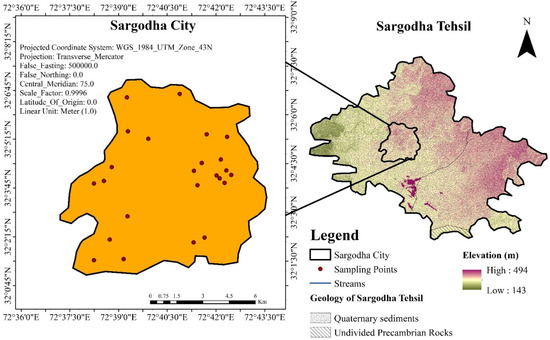
Figure 1.
Study area map with sampling location and geology of the study area.
2.2. Hydrogeochemical Analysis
In this study, 48 groundwater samples were collected from the shallow aquifer of Sargodha city in 2015 and 2021. The locations of each site were recorded using a portable GPS device (Figure 1) before sampling; each well was pumped for 10 min to remove residual water and obtain stable chemical conditions. Samples were collected in washed plastic bottles, rinsed, and washed 3–4 times with water to be tested. The samples were further analyzed by the standard methods of American Public Health Association (APHA 2005) [61]. The EC, pH, and turbidity were measured on-site using calibrated portable meters (JENCO, San Diego, CA, USA). Samples were labeled, stored, and transferred to the laboratory for physicochemical analysis. An electronic analytical balance measured total dissolved solids (TDS). Major cations, including Mg2+, Ca2+, K+, Na+, Fe2+, and As, were measured by flame atomic absorption spectrometry and the accuracy was 95–98%. However, anions such as NO3−, F−, and SO42− were determined by ultraviolet-visible (UV-VIS) spectrophotometer (Analytik Jena, Jena, Germany), while Cl− and HCO3− were analyzed by titration methods. Finally, the samples were checked for accuracy by (Equation (1)) to determine percentage charge balance errors.
Here the unit of cations and anions is meq/L; the physicochemical analysis with % CBE within ± 5% are considered perfect for further analysis.
Further, the groundwater data were analyzed to investigate the hydrogeochemistry of the Piper, 1994 [62] diagram drawn using Golden Software Grapher 18.3. Origin v19 computed and displayed the Gibbs plot and silicate weathering to characterize the primary ionic water facies exhibiting the water chemistry in the research area. Correlation analysis (CA) and principal component analysis (PCA) were performed on the raw data using the software IBM SPSS statistical package to depict the substantial associative link between the groundwater variables and NDVI and NDBI. Quality measures were weighted to evaluate groundwater for drinking and the following equations calculated the water quality index (WQI) [63].
Hence, the relative weight is Wi and the weight of each parameter is wi. While n is the total number of parameters investigated, qi is the quality rating scale, Ci is each parameter’s concentration, Si is the WHO standard, and SIi and Wi are the sub-indices and the relative weights for the ith parameter. Irrigation of the groundwater was assessed by the sodium adsorption ratio (SAR) [64] and sodium percentage (Na%) [65], which were calculated using the following equations.
2.3. Data Acquisition and Spatial Distribution
The Landsat 8 satellite images with the OLI/TIRS sensor were downloaded for 2015 and 2021 from the US Geological Survey (USGS) website (earthexplorer.usgs.gov/, accessed on 1 May 2015 and 1 May 2021) for analyzing land use and land cover, normalized difference vegetation index (NDVI), and normalized difference built-up index (NDBI). These satellite images have 11 bands and 30 m resolution, and the images were downloaded during March, when the groundwater samples were also collected. In addition, there were less cloud interferences in this month.
Inverse Distance Weighted (IDW) is a popular deterministic interpolation technique and it presumes that the interconnection rate among the adjacent points is comparable to the distance between those points. Each interpolated point has a similar weight to the inverse of the point’s distance from the known point [66] and Equation (8) was used to calculate the values.
Here, Z(yo) is the interpolated value of an unknown point, yi is the data value at ith point, n is the value of total sampling data, β is the weighting power, and hij is the distance between interpolated values and sampled data.
2.4. Classification of Land Use Land Cover (LULC)
The LULC of the Sargodha district was analyzed for 2015 and 2021 to study the changes in LULC patterns within 6 years. In this study, we downloaded the Landsat 8 from collection 2 level-1, which was atmospherically and radiometrically corrected and a better version than collection 1. For LULC classification, maximum likelihood classification was followed. The signature file was created by collecting 100 ground control points from Sargodha city. An accuracy assessment was also conducted using Google Earth images to validate the classification. The overall accuracy in 2015 and 2021 was 83% and 87%, respectively. Kappa accuracy assessment was also chosen to determine the accuracy and the coefficients were 0.81 and 0.90 in 2015 and 2021, respectively.
2.5. Spectral Indices
Landsat-8 OLI-TIRS imageries of 2015 and 2021 were used for the spectral indices. The spectral indices normalized difference vegetation index (NDVI) and normalized difference built-up index (NDBI) were determined by Landsat-8 OLI-TIRS by following the method suggested by Tucker and Sellers (1986) and Xu (2007) [67,68], respectively, with Equations (9) and (10). These indices were calculated using raster calculator in ArcGIS.
2.6. Human Health Risks Model
In risk assessment, the adverse human health impacts of exposure to environmental risks are determined by NO3− due to rapid urbanization and anthropogenic activities [69]. The following equation can compute a particular element’s average daily oral dose.
Here, C is the pollutant concentration in groundwater (mg/L). IR is the ingestion rate of drinking water (L/d), and in this study, the ingestion rate of water is 2.5 L/d for adults, 0.7 L/d for children, and 0.3 L/day for infants [70]. The recommended values of EF are 365 days per year for adults, children, and infants; ED stands for exposure duration (30 years for adults, 12 years for children, and 1 year for infants) [71]. BW is a person’s body weight (kg), with 60 kg for adults, 20 kg for children, and 10 kg for infants. AT signifies an average time for the non-carcinogenic health effect in days and in the present study, the average time for adults is 14,600 days, for children 4380 days, and 365 days for infants. The non-carcinogenic risk from drinking water consumption was analyzed using the oral hazard quotient (HQ) [72].
RfD means reference dosage for non-carcinogenic pollutants through drinking water exposure pathways. Hence the value of RfD for NO3− exposure is 1.6 mg/kg/day [73].
3. Results and Discussion
3.1. Characteristics of Groundwater
The analytical results of the groundwater parameters during 2015 and 2021 are presented in Figure 2. The physiochemical results showed higher EC in both 2015 (370–30,000 µS/cm) and 2021 (310–22,140 µS/cm), with an average of 5848 and 4802.5 µS/cm, respectively. Human activities and dissolution of minerals in groundwater often generate such large fluctuations in EC. The pH of the groundwater in 2015 and 2021 ranged 6.7–8.4 in 2015 and 6.9–7.7 in 2021, representing a slightly acidic to slightly alkaline condition. Turbidity in groundwater was not much affected, but the total dissolved solids (TDS) signified dissolved minerals ranged 207–13,997.4 and 178–13,804 mg/L, with mean values of 3045.8 and 3061.8 mg/L, in 2015 and 2021 in groundwater, respectively. The TDS and EC of the groundwater in most sites were found to exceed the desirable limit due to longer residence time [11,44]. This investigation implies that reaction of geochemical, water-rock interactions, and anthropogenic activity contaminated groundwater in region [74]. Higher TDS and EC values were observed in 2021, estimating long-term water-rock interaction and the effects of evapotranspiration compared to 2015 [11,44]. Hardness in groundwater was observed at 50–3400 mg/L in 2015 and 90–3800 mg/L in 2021, reflecting the lithological properties of the strata [75]. The presence of cations in the groundwater was observed in the following order: Na+ > Mg2+ > Ca2+ > K+ > Fe2+. The Na+ ranged 26–3820 and 10–3560 mg/L, averaging 825.2 and 690.3 mg/L. The magnesium concentration varied 4.9–583.2 and 7–656 mg/L, averaging 126.2 and 131.2 mg/L. While the concentration of Ca2+ ranged 12–480 and 24–820 mg/L, averaging 118.1 and 183.6 mg/L, the cation exchange may also impact the greater concentration of sodium over calcium in groundwater [44]. Due to weathering and dissociation of contaminated salts originating from geologic matter through the dissolution of alkaline earth metal salts and hosted minerals in groundwater, dissolution may increase the cation concentrations in groundwater [11]. The presence of anions in the groundwater was in the following order: Cl− > SO42− > HCO3− > NO3− > F−, thus, the bicarbonates ranged 130–1190 and 130.0–1120 mg/L, averaging 512.7 and 506.45 mg/L; and chloride in 2015 and 2021 varied 12.3–7210 mg/L and 7–7630 mg/L, with an average of 894.1 and 1110.7 mg/L. Higher bicarbonates and chloride in groundwater might be caused by sewage and irrigated land water seepage [76]. Sulphate varied 22–2640 and 21–2010 mg/L, with an average of 715.7 and 573.04 mg/L. This suggests origins from the dissolution of sulphate-supported minerals such as sulphate leaching from fertilizers due to extensive agricultural activities (ammonium sulphate, sulphate salts) [11,44]. Nitrate ranged 0.1–14.4 and 4.2–18 mg/L, with an average of 8 and 11.08 mg/L in 2015 and 2021, respectively. Higher nitrate in 2021 groundwater suggests an impact due to anthropogenic practices observed. Nitrate in groundwater comes from fertilizers and human activities, including cattle confinement, leaky septic or sewage infrastructure, and chemical or manure storage [77]. Fluoride varied 0.2–1.5 and 0.03–1.5 mg/L, with an average value of 0.8 and 0.6 mg/L, and arsenic ranged from 0.21 to 1.35 μg/L, with an average of 3.1 and 2.3 μg/L, respectively. The fluoride and arsenic are not affecting the groundwater quality of the study area much because less minerals are available in the aquifers, and our results support the study [11,44].
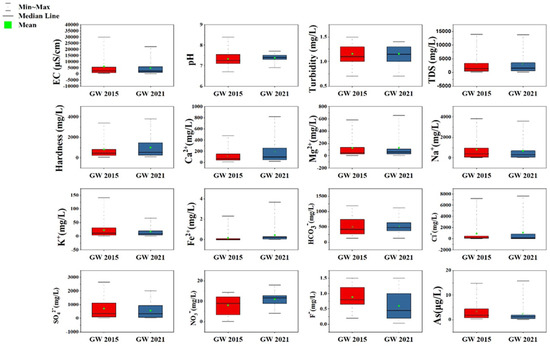
Figure 2.
Box and whisker plot of statistical groundwater parameters of 2015 and 2021 in the study area.
3.2. Hydrogeochemical Evolution and Silicate Weathering Effects
The Piper diagram (Piper 1944) is often used to define the types of hydrogeochemistry of the groundwater regulated by main cations and anions [11,62]. The groundwater samples of Sargodha city in 2015 and 2021 are presented in Figure 3a. In the lower-left triangle, most groundwater samples were plotted in zones D and C, and few were in zone A. It explains the dominance of Na+ during 2015 and 2021, i.e., mixed water quality. Groundwater samples from 2015 and 2021 were plotted in zones D and E in the bottom right triangle. This shows almost zero domination of bicarbonate ions, i.e., mixed water quality type. Most groundwater samples in the middle upper rhombus were plotted in zones 1 and 3. This shows that hydrogeochemical types were (Ca2++Mg2+)–(HCO3−+CO32−) and (Na++K+–SO42−+Cl−), while only a few samples in zone 5 and 6 showed the mixed water type. This suggests that silicate weathering and rock-water interaction influenced many ions in groundwater chemistry in both 2015 and 2021.
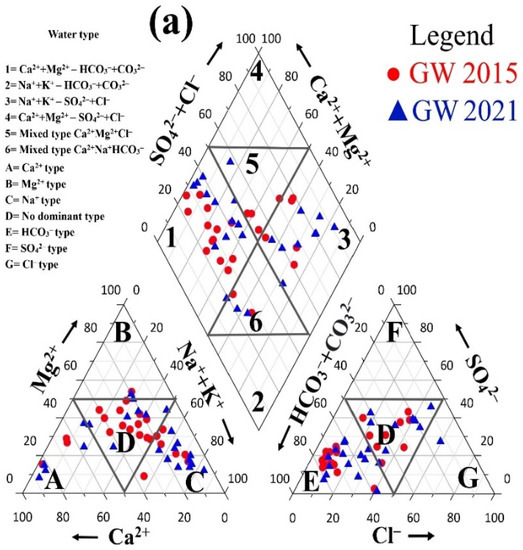
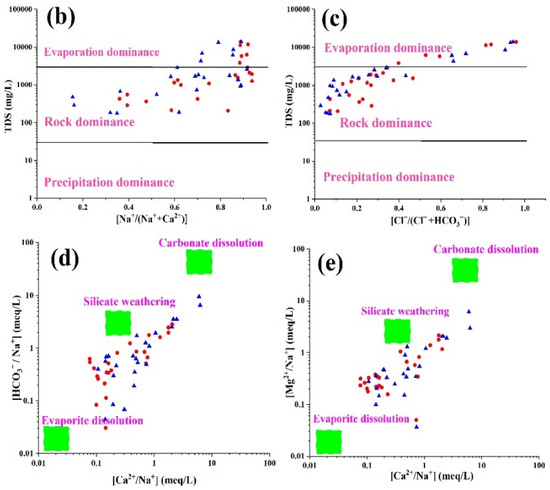
Figure 3.
(a) Piper diagram of hydrogeochemistry. (b) Gibbs Plot (TDS vs. Na+/Na++Ca2+). (c) Gibbs Plot (TDS vs. Cl−/Cl−+HCO3−). (d) Silicate weathering (HCO3−/Na+) vs. (Ca2+/Na+) (e) Silicate weathering (Mg2+/Na+) vs. (Ca2+/Na+).
Furthermore, chemical changes in groundwater are caused by long-term anthropogenic activities. Gibbs [78] built an effective diagram comparing [TDS vs. Na+/(Na++Ca2+)] (Figure 3b) and [TDS vs. Cl−/(Cl−+HCO3−)] (Figure 3c) to identify groundwater characteristics of Sargodha city in 2015 and 2021 for the influencing hydrogeochemistry. The plot consists of two sub-diagrams, each subdivided into three portions reflecting groundwater’s most important evolutionary processes: evaporation dominance, rock dominance, and precipitation dominance [11,44,78]. Plot [TDS vs. Na+/(Na++Ca2+)] shows virtually all groundwater samples displayed in the center area of the two sub-diagrams, with only a few samples at the top. This suggests that rock weathering and water-rock interactions were the most important variables controlling groundwater chemical development in Sargodha. Moreover, [TDS vs. Cl−/(Cl−+HCO3−)] shows that the majority of samples in the right sub-diagram were plotted on the line’s left side, Cl−/(Cl−+HCO3−). This shows that the Cl−/(Cl−+HCO3−) values were less than 0.3, indicating that bicarbonate was the predominating anion. The samples that fall beyond the evaporation, rock, and precipitation dominance may have been influenced by anthropogenic activity, showing the source of nitrate in the study region [79]. This is consistent with the results that the groundwater of Sargodha City in 2015 and 2021 were mainly bicarbonate type.
The most effective groundwater geochemical processes involve chemical weathering, silicate, and dissolution of sodium magnesium and carbonate mineral source ions. The HCO3−/Na+ vs. Ca2+/Na+ (Figure 3d) and Mg2+/Na+ vs. Ca2+/Na+ (Figure 3e) plots are used to determine the origins of Ca2+ and Na+ ions, respectively. Water chemistry is strongly influenced by silicate weathering, as shown by the plots, which show that Na+ is much more abundant than Ca2+, Mg2+, and HCO32−. The increased solubility of sodium in comparison to calcium is practical in water samples affected by silicate weathering [80]. The plot also suggests that due to weathering, saline/alkaline soil enriched with alkalis and groundwater residence time, it also indicates lithological variation [81]. Silicate weathering is suggested as a source in groundwater due to potassium and sodium ions.
3.3. Drinking and Irrigation Groundwater Quality
To evaluate suitability for drinking purposes, the water quality index (WQI) was computed [8,11,44]. The groundwater of 2015 indicates that seven samples (29%) are considered excellent, nine samples (37.5%) are good, six samples (25%) are poor, one sample (4%) is considered very poor, and one sample (4%) is considered unsuitable for drinking. Meanwhile, in the groundwater of 2021, a total of eight samples (33%) are classified as good, seven samples (29%) are classified as poor, four samples (17%) are classified as very poor, and five samples (21%) are unsuitable, with no sample being excellent. However, compared to the groundwater quality of 2021, the groundwater quality of 2015 is much better. The groundwater vulnerability in 2021 becomes high due to urbanization and anthropogenic activities, which may cause the different contaminated physiochemical parameters of groundwater. Spatial variation of water quality (WQI) map is depicted in Figure 4a. However, groundwater in Sargodha city was not good enough or even poor, which may be attributed to anthropogenic activities, water-rock interactions, and silicate weathering.
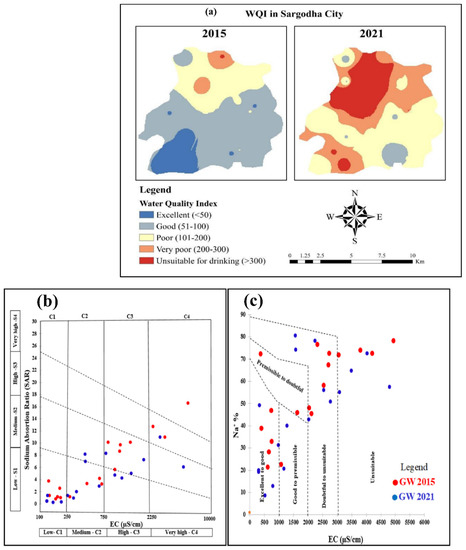
Figure 4.
(a) Spatial distribution map of Water Quality Index (WQI) for drinking purposes, (b) sodium adsorption ratio (SAR), and (c) sodium percentage ratio (Na+%).
Groundwater hazards depend on salinity; the SAR describes salt hazards, which can diminish soil permeability [11,81]. In the 2015 groundwater investigation, six samples (25%) are C1S1, four samples (17%) are C2S2, considered low to medium and considered good for irrigation, while five samples (21%) are C3S2, three samples (12%) are C4S3, S4, and one sample (4%) is C4S4, which are considered not fit for irrigation in 2015. Similarly, in the groundwater samples of 2021, four samples (17%) are C1S1, six samples (25%) are C2S2, considered fit, while five samples (21%) lie in C3, S1S2, and two samples (8%) in C4S2S3, which are considered not fit for irrigation in 2021. This is due to salinity, which is the naturally occurring dissolved inorganic solids in natural water; thus, increasing the total dissolved solids (TDS) and the total dissolved chemical load (TCL) are both indicators of salinization. Increased levels of Na+, HCO3−, and CO32− dissolved ions in irrigation water have a negative impact on soil fertility and crop productivity, as shown in the EC plot (Figure 4b). The Wilcox diagram was also used to evaluate the appropriateness of groundwater for irrigation [65]. The high salt content might cause the soil to harden and impair its permeability [82]. It can be seen in Figure 4c that most of the samples of 2015 and 2021 were classified as doubtful to unsuitable, implying that the groundwater is not fit for irrigation, which is due to the industrial activity near the location and become high value of EC, resulting in the strong rock-water interaction, which leads to cation exchange shows that the groundwater is unsuitable for irrigation [83]. Thus, 37% and 40% of samples are not fit for irrigation in 2015 and 2021, respectively.
3.4. Land Use Land Cover Status
Land use land cover in Sargodha city during 2015 and 2021 is shown in Figure 5, which indicates more urbanized area and bare land but less agricultural lands and dense vegetation in 2021 compared to 2015. Table 1 presents the total area (km2) of water bodies, urban areas, bare fields, agricultural lands, and densely vegetated areas. It is clear that in 2015, the central part of the city had bare lands and agricultural lands, which were converted to urban areas in 2021. Also, there were agricultural fields in the southwestern part of the study area, but those lands were cleared for some reason and converted to bare lands in 2021. Ashraf et al. (2022) studied spatio-temporal variation in land use and land cover from 1987 to 2017, and our LULC map of 2015 is nearly similar to their 2017 map [84].
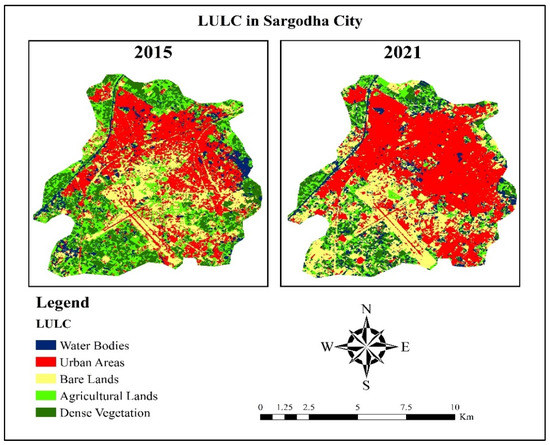
Figure 5.
Land Use Land Cover of 2015 and 2021 of Sargodha city.

Table 1.
Status of land use and land cover during 2015 and 2021.
During 2015, the total areas of water bodies, urban areas, bare land, agricultural land, and densely vegetated area were 8.61 km2 (11.35%), 24.53 km2 (32.34%), 15.57 km2 (20.53%), 12.73 km2 (16.79%), and 16.31 km2 (21.51%), respectively. In 2021, the total areas of water bodies, urban areas, bare land, agricultural land, and densely vegetated area were 6.70 km2 (8.83%), 33.77 km2 (44.53%), 20.03 km2 (26.41%), 7.73 km2 (10.19%), and 5.70 km2 (7.52%), respectively. From 2015 to 2021, total urban area and bare land increased by 9.24 km2 (37.67%) and 4.46 km2 (28.64%), respectively, whereas water body, agricultural area, and densely vegetated area decreased by 1.91 km2 (28.51%), 5 km2 (39.28%), and 10.61 km2 (65.05%), respectively.
3.5. Normalized Difference Vegetation Index (NDVI) and Normalized Difference Built-Up Index (NDBI)
NDVI and NDBI of Sargodha city in 2015 and 2021 are shown in Figure 6a,b. The results show that 2021 had a lower NDVI than 2015. It is an indicator of clearing the vegetated and agricultural fields for urbanization. In 2015, the northern region of Sargodha had a small, densely vegetated area and the southern to southwestern region of the city had moderate vegetation. However, in 2021, the city had no dense vegetation and the southern and southwestern regions had mostly sparse vegetation. The NDBI status of Sargodha city shows higher urbanization in 2021 than 2015. During 2015, the city’s northern, southwestern, southeastern, and western regions were less developed and had bare soil or vegetation. However, in 2021, many places in the southeastern and southwestern regions were converted to urban areas. The vegetated areas from NDVI and urbanized areas from NDBI during 2015 and 2021 agree with the scenarios of the LULC map.
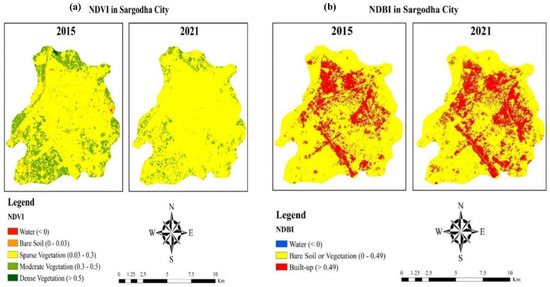
Figure 6.
(a) Normalized difference vegetation index (NDVI) and (b) Normalized difference built-up index (NDBI) of Sargodha city.
3.6. Relationship between Groundwater and NDVI and NDBI
Pearson correlation analysis was done to determine the correlation among the water parameters, NDVI, and NDBI in 2015 and 2021 (Table 2). In both years, NDVI and NDBI did not correlate well with the chemical parameters of water, but NDVI showed a significantly negative correlation with NDBI at p < 0.001 with r = −0.86 and r = −0.94 in 2015 and in 2021, respectively. Alam et al. (2022) also found a negative correlation between NDBI and NDVI, concluding that NDVI shows a decreasing trend when urbanization increases and our findings concur with theirs [85]. Without these two LULC indices, As and Fe2+ did not reveal any correlation with other water quality parameters either. The Pearson correlation matrix reveals that the significance level of the relationships among some parameters have changed from 2015 to 2021. For example, during 2015, pH showed a negative correlation with HCO3− at p < 0.001 significance level and at p < 0.01 with NO3− and K+. With turbidity and Mg2+, pH negatively correlated at p < 0.05. However, in 2021, the relationships between pH and these chemical parameters were negative but insignificant. Siddique et al. (2022) also showed a negative correlation between pH, SO42− and NO3−. EC showed a significant positive correlation (p < 0.001) with TDS, Na+, Ca2+, Mg2+, Hardness, F−, Cl−, and SO42− [66]. The relationships were similar in 2021 between EC and other parameters, except F− (p < 0.01). Similar to EC, TDS also showed a positively significant relationship at p < 0.001 with F− in 2015 and at p < 0.01 in 2021. The HCO3− revealed a significant positive correlation with EC (p < 0.05), Na+ (p < 0.01), TDS (p < 0.05), Mg2+ (p < 0.01), Hardness (p < 0.01), NO3− (p < 0.05), and Turbidity (p < 0.05) in 2015, but during 2021, HCO3− did not have any correlation with these parameters. In 2015, water hardness showed a positive but not significant correlation with turbidity, but in 2021, the relationship was negative at p < 0.01 significance level. Our study concurred with the investigation by Baloch et al. [11].
Table 2.
Pearson correlation matrix of 2015 and 2021 groundwater physiochemical characteristics with NDVI and NDBI.
Moreover, factor analysis is a strong statistical technique for the factors that reflect specific elements, and the higher the factor value, the greater their contribution to groundwater chemistry. Factor analysis clarifies the components’ pragmatic association as shown in Table 3 and Figure 7. Factor loadings <0.75 are classified as high, 0.40 to 0.75 as moderate, and below 0.40 as low loading [86,87]. The factor analysis for groundwater samples in 2015 extracted three factors with a total variability (TV) of 74.69%. F1 with 49.9% (TV) is represented by strong positive loadings of EC, TDS, Ca2+, Mg2+, Na+, Cl−, F−, and SO42−, moderate loadings for HCO3−, and low with and negative with the rest of the parameters. Factor 2 is observed with a variance of 13%, with low loadings or even negative loading with most parameters except K+, HCO3−, NO3−, and NDVI, which have moderate loadings. Factor 3, with 11.3% of the variance, is represented by low and negative loading except for Fe2+, HCO3−, and NDBI. This indicated that 2015 NDVI and NDBI in F1, F2, and F3 correlate with opposites. The factor analysis for groundwater samples in 2021 extracted three factors with a TV of 70.6% (Table 3). F1 explains 47.9% of total variance, showing strong loadings of EC, TDS, Hardness, Ca2+, Mg2+, Na+, Cl−, and SO42−; moderate loadings of HCO3− and low or negative with the rest of the parameters. Factor 2, with 12.4% TV, represents a substantial decrease and negative relation with all parameters, except for NDVI, with high loading, and K+, HCO3−, with moderate loadings. Similarly, factor 3, with a variance of 10.24%, represents only moderate loadings of NDBI and has opposite relation with NDVI (−0.503). Chemical weathering, dissolution, and ion exchange reactions are responsible for Factor 1. While NDVI and NDBI influenced F2 and F3, the opposite was due to the greater loading of nitrate in groundwater. Compared to factor 1, factors 2 and 3 may be associated with anthropogenic activities, including rapid urbanization, agriculture, and domestic sewage [78].
Table 3.
Factor loading of 2015 and 2021 for groundwater physiochemical characteristics with NDVI and NDBI.
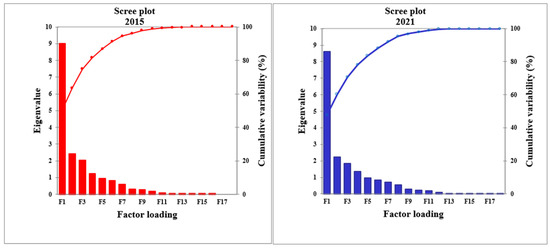
Figure 7.
Scree plot of factor loading analysis.
3.7. Spatial Variation of Nitrate Associated with Risk Assessment
The CDI and HQ values for adults, children, and infants via drinking groundwater ingestion are summarized in Table 4. The spatial distributions of NO3− in 2015 and 2021 to investigate spatio-temporal by using Kriging interpolation (Figure 8a). In 2015, the NO3− concentration is mostly within permissible limits due to less urbanization as discussed for the LULC of 2015, while in 2021, NO3− concentration exceeds 10 mg/L distributed throughout the study area, except for a few locations southwest and northeast. The high concentration NO3− distributed in the middle of the southeast and southwest areas due to high urbanization was also investigated through satellite images of 2021. The range of NO3− values in 2015 was 0.1–14.4 mg/L, with an average of 8 mg/L, and in 2021, the range was 4.2–18 mg/L, with an average of 11.08 mg/L. Higher nitrate in 2021 groundwater suggests an impact due to anthropogenic practices, which may cause health risks. The mean non-carcinogenic hazard quotient (HQ < 1) for adults, children, and infants indicates no severe health risk due to nitrate exposure (Figure 8b). Yet compared to 2015, 2021 has greater values; if anthropogenic activities are not controlled, they may cause severe health issues in the future [4].
Table 4.
Results of the non-carcinogenic risks of nitrate ingestion from drinking groundwater.
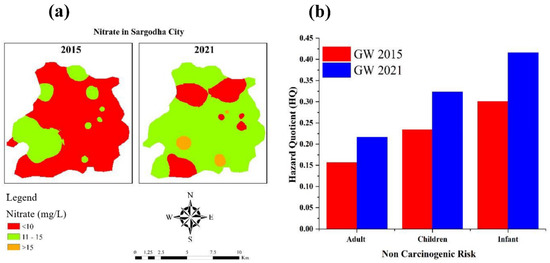
Figure 8.
(a) Spatial distribution map of NO3−; (b) non-carcinogenic hazard quotient (HQ) of 2015 and 2021 Sargodha city.
4. Conclusions
This study investigated hydrogeochemistry and urbanization of Sargodha City in 2015 and 2021. Multiple studies and analyses were used to investigate the correlations between hydrogeochemistry, LULC, NDVI, and NDBI. This research concludes that groundwater quality decreased in 2021 compared to 2015. The dominant type of groundwater samples in both years in the city was (Ca2++Mg2+–HCO3−+CO32−) and (Na++K+–SO42−+Cl−), and rock weathering was the most important source of groundwater hydrogeochemical compositions. In 2015, 4% of groundwater was unsuitable for drinking, while 21% was unsuitable for drinking purposes in 2021. However, 37% and 40% of samples were not fit for irrigation in 2015 and 2021, respectively, because of high EC and Na+. The other major factors for declining groundwater quality are urbanization and increasing water demand for domestic, agricultural, and industrial purposes. As a result, a sharp deterioration in drinking water quality has been observed. Urbanization may cause increased wastewater discharge, construction buildings, and other anthropogenic activities. A significant percentage of agricultural lands and vegetated areas were converted to urban areas in 2021. Our findings also revealed higher non-carcinogenic health risks in 2021, with a greater HQ than in 2015. However, we did not find any health problems due to NO3− exposure. Since non-carcinogenic health risk has increased in 2021 compared to 2015, this research strongly suggests managing groundwater and reducing pollution, which may cause severe health issues in the near future. Also, proper urban planning is required because of the haphazard clearance of agricultural and forest areas. Therefore, it is recommended that the country’s decision-making authority takes action to prevent groundwater contamination.
Author Contributions
Writing—original draft, M.Y.J.B.; supervision, W.Z.; formal analysis, B.A.A.S.; software formal analysis, A.N.; review and editing, A.A.M.E., A.E.A.E., M.O.B., A.F.M.S.E. and K.a.A.M.; visualization, J.I. All authors have read and agreed to the published version of the manuscript.
Funding
This work was supported by the Graduate Innovation Fund of Jilin University (No. 101832020CX251).
Institutional Review Board Statement
Not applicable.
Informed Consent Statement
Not applicable.
Data Availability Statement
The data presented in this study are available on request from the first or corresponding authors.
Acknowledgments
The authors are gratefully acknowledge the help of editors, reviewers and all his team.
Conflicts of Interest
The authors declare no conflict of interest.
References
- Hussain, S.; Mubeen, M.; Karuppannan, S. Land use and land cover (LULC) change analysis using TM, ETM+ and OLI Landsat images in district of Okara, Punjab, Pakistan. Phys. Chem. Earth Parts A/B/C 2022, 126, 103117. [Google Scholar] [CrossRef]
- Baloch, M.Y.J.; Su, C.; Talpur, S.A.; Iqbal, J.; Bajwa, K. Arsenic Removal from Groundwater using Iron Pyrite: Influences Factors and Removal Mechanism. J. Earth Sci. 2022, 6. [Google Scholar] [CrossRef]
- Jat Baloch, M.Y.; Zhang, W.; Zhang, D.; Al Shoumik, B.A.; Iqbal, J.; Li, S.; Chai, J.; Farooq, M.A.; Parkash, A. Evolution Mechanism of Arsenic Enrichment in Groundwater and Associated Health Risks in Southern Punjab, Pakistan. Int. J. Environ. Res. Public Health 2022, 19, 13325. [Google Scholar] [CrossRef] [PubMed]
- Noori, R.; Maghrebi, M.; Mirchi, A.; Tang, Q.; Bhattarai, R.; Sadegh, M.; Noury, M.; Torabi Haghighi, A.; Kløve, B.; Madani, K. Anthropogenic depletion of Iran’s aquifers. Proc. Natl. Acad. Sci. USA 2021, 118, e2024221118. [Google Scholar] [CrossRef] [PubMed]
- Hegazy, M.H.; Essam, A.; Elnaggar, A.Y.; Hussein, E.E. Heavy Metal Removal from the Water of the River Nile Using Riverbank Filtration. Water 2021, 13, 3642. [Google Scholar] [CrossRef]
- Ramachandran, V.; Ramalakshmi, R.; Kavin, B.P.; Hussain, I.; Almaliki, A.H.; Almaliki, A.A.; Elnaggar, A.Y.; Hussein, E.E. Exploiting IoT and its enabled technologies for irrigation needs in agriculture. Water 2022, 14, 719. [Google Scholar]
- Baloch, M.Y.J.; Mangi, S.H. Treatment of synthetic greywater by using banana, orange and sapodilla peels as a low cost activated carbon. J. Mater. Environ. Sci. 2019, 10, 966–986. [Google Scholar]
- Talpur, S.A.; Noonari, T.M.; Rashid, A.; Ahmed, A.; Jat Baloch, M.Y.; Talpur, H.A.; Soomro, M.H. Hydrogeochemical signatures and suitability assessment of groundwater with elevated fluoride in unconfined aquifers Badin district, Sindh, Pakistan. SN Appl. Sci. 2020, 2, 1038. [Google Scholar] [CrossRef]
- Fouad, M.; Hussein, E.E.; Jirka, B. Assessment of numerical groundwater models. Int. J. Sci. Eng. Res. 2018, 9, 951–974. [Google Scholar]
- Hussein, E.E.; Fouad, M.; Gad, M.I. Prediction of the pollutants movements from the polluted industrial zone in 10th of Ramadan city to the Quaternary aquifer. Appl. Water Sci. 2019, 9, 1–19. [Google Scholar] [CrossRef]
- Jat Baloch, M.Y.; Zhang, W.; Chai, J.; Li, S.; Alqurashi, M.; Rehman, G.; Tariq, A.; Talpur, S.A.; Iqbal, J.; Munir, M. Shallow Groundwater Quality Assessment and Its Suitability Analysis for Drinking and Irrigation Purposes. Water 2021, 13, 3361. [Google Scholar] [CrossRef]
- Baloch, M.Y.J.; Talpur, S.A.; Talpur, H.A.; Iqbal, J.; Mangi, S.H.; Memon, S. Effects of Arsenic Toxicity on the Environment and Its Remediation Techniques: A Review. J. Water Environ. Technol. 2020, 18, 275–289. [Google Scholar] [CrossRef]
- Zhang, W.; Chai, J.; Li, S.; Wang, X.; Wu, S.; Liang, Z.; Baloch, M.Y.J.; Silva, L.F.; Zhang, D. Physiological characteristics, geochemical properties and hydrological variables influencing pathogen migration in subsurface system: What we know or not? Geosci. Front. 2022, 13, 101346. [Google Scholar] [CrossRef]
- Zhang, W.; Zhu, Y.; Gu, R.; Liang, Z.; Xu, W.; Jat Baloch, M.Y. Health Risk Assessment during In Situ Remediation of Cr(VI)-Contaminated Groundwater by Permeable Reactive Barriers: A Field-Scale Study. Int. J. Environ. Res. Public Health 2022, 19, 13079. [Google Scholar] [CrossRef]
- Han, D.; Currell, M. Review of drivers and threats to coastal groundwater quality in China. Sci. Total Environ. 2022, 806, 150913. [Google Scholar] [CrossRef]
- Balogun, M.A.; Anumah, A.O.; Adegoke, K.A.; Maxakato, N.W. Environmental health impacts and controlling measures of anthropogenic activities on groundwater quality in Southwestern Nigeria. Environ. Monit. Assess. 2022, 194, 1–36. [Google Scholar] [CrossRef] [PubMed]
- Pelorosso, R.; Leone, A.; Boccia, L. Land cover and land use change in the Italian central Apennines: A comparison of assessment methods. Appl. Geogr. 2009, 29, 35–48. [Google Scholar] [CrossRef]
- Kidane, M.; Tolessa, T.; Bezie, A.; Kessete, N.; Endrias, M. Evaluating the impacts of climate and land use/land cover (LU/LC) dynamics on the Hydrological Responses of the Upper Blue Nile in the Central Highlands of Ethiopia. Spat. Inf. Res. 2019, 27, 151–167. [Google Scholar] [CrossRef]
- Roy, P.S.; Ramachandran, R.M.; Paul, O.; Thakur, P.K.; Ravan, S.; Behera, M.D.; Sarangi, C.; Kanawade, V.P. Anthropogenic Land Use and Land Cover Changes—A Review on Its Environmental Consequences and Climate Change. J. Indian Soc. Remote Sens. 2022, 50, 1615–1640. [Google Scholar] [CrossRef]
- Ortiz-Oliveros, H.; Ávila-Pérez, P.; Cruz-González, D.; Villalva-Hernández, A.; Lara-Almazán, N.; Torres-García, I. Society. Climatic and hydrological variations caused by Land Use/Land Cover changes in the Valley of Toluca, Mexico: A rapid assessment. Sustain. Cities Soc. 2022, 85, 104074. [Google Scholar] [CrossRef]
- Usman, M.; Liedl, R.; Shahid, M.; Abbas, A. Land use/land cover classification and its change detection using multi-temporal MODIS NDVI data. J. Geogr. Sci. 2015, 25, 1479–1506. [Google Scholar] [CrossRef]
- Latocha, A. Land-use changes and longer-term human–environment interactions in a mountain region (Sudetes Mountains, Poland). Geomorphology 2009, 108, 48–57. [Google Scholar] [CrossRef]
- Wang, J.; Lin, Y.; Zhai, T.; He, T.; Qi, Y.; Jin, Z.; Cai, Y. The role of human activity in decreasing ecologically sound land use in China. Land Degrad. Dev. 2018, 29, 446–460. [Google Scholar] [CrossRef]
- Tariq, A.; Mumtaz, F.; Zeng, X.; Baloch, M.Y.J.; Ul Moazzam, M.F. Environment. Spatio-temporal variation of seasonal heat islands mapping of Pakistan during 2000–2019, using day-time and night-time land surface temperatures MODIS and meteorological stations data. Remote Sens. Appl. Soc. Environ. 2022, 27, 100779. [Google Scholar]
- Liaqut, A.; Younes, I.; Sadaf, R.; Zafar, H. Impact of urbanization growth on land surface temperature using remote sensing and GIS: A case study of Gujranwala City, Punjab, Pakistan. Int. J. Econ. Environ. Geol. 2019, 9, 44–49. [Google Scholar]
- Maqsoom, A.; Aslam, B.; Alwetaishi, M.; Awais, M.; Hassan, U.; Maqsoom, S.; Alaloul, W.S.; Musarat, M.A.; Zerouali, B.; Hussein, E.E. A GIS-Based Groundwater Contamination Assessment Using Modified DRASTIC Geospatial Technique. Water 2021, 13, 2868. [Google Scholar] [CrossRef]
- Derdour, A.; Jodar-Abellan, A.; Pardo, M.Á.; Ghoneim, S.S.; Hussein, E.E. Designing Efficient and Sustainable Predictions of Water Quality Indexes at the Regional Scale Using Machine Learning Algorithms. Water 2022, 14, 2801. [Google Scholar] [CrossRef]
- Kharazmi, R.; Tavili, A.; Rahdari, M.R.; Chaban, L.; Panidi, E.; Rodrigo-Comino, J. Monitoring and assessment of seasonal land cover changes using remote sensing: A 30-year (1987–2016) case study of Hamoun Wetland, Iran. Environ. Monit. Assess. 2018, 190, 1–23. [Google Scholar] [CrossRef]
- Helsel, D.R.; Ragone, S.E. Evaluation of Regional Ground-Water Quality in Relation to Land Use: US Geological Survey Toxic Waste-Ground-Water Contamination Program; US Geological Survey: Reston, VA, USA, 1984. [Google Scholar]
- Worrall, F.; Kolpin, D.W. Aquifer vulnerability to pesticide pollution—Combining soil, land-use and aquifer properties with molecular descriptors. J. Hydrol. 2004, 293, 191–204. [Google Scholar] [CrossRef]
- Johnson, T.D.; Belitz, K. Assigning land use to supply wells for the statistical characterization of regional groundwater quality: Correlating urban land use and VOC occurrence. J. Hydrol. 2009, 370, 100–108. [Google Scholar] [CrossRef]
- Hejazian, M.; Gurdak, J.J.; Swarzenski, P.; Odigie, K.O.; Storlazzi, C.D. Land-use change and managed aquifer recharge effects on the hydrogeochemistry of two contrasting atoll island aquifers, Roi-Namur Island, Republic of the Marshall Islands. Appl. Geochem. 2017, 80, 58–71. [Google Scholar] [CrossRef]
- Yan, B.; Xiao, C.; Liang, X.; Fang, Z. Impacts of urban land use on nitrate contamination in groundwater, Jilin City, Northeast China. Arab. J. Geosci. 2016, 9, 105. [Google Scholar] [CrossRef]
- Long, D.T.; Pearson, A.L.; Voice, T.C.; Polanco-Rodríguez, A.G.; Sanchez-Rodríguez, E.C.; Xagoraraki, I.; Concha-Valdez, F.G.; Puc-Franco, M.; Lopez-Cetz, R.; Rzotkiewicz, A.T. Influence of rainy season and land use on drinking water quality in a karst landscape, State of Yucatán, Mexico. Appl. Geochem. 2018, 98, 265–277. [Google Scholar] [CrossRef]
- Siddik, M.S.; Tulip, S.S.; Rahman, A.; Islam, M.N.; Haghighi, A.T.; Mustafa, S.M.T. The impact of land use and land cover change on groundwater recharge in northwestern Bangladesh. J. Environ. Manag. 2022, 315, 115130. [Google Scholar] [CrossRef] [PubMed]
- Elmahdy, S.; Mohamed, M.; Ali, T. Land use/land cover changes impact on groundwater level and quality in the northern part of the United Arab Emirates. Remote Sens. 2020, 12, 1715. [Google Scholar] [CrossRef]
- Panneerselvam, B.; Muniraj, K.; Duraisamy, K.; Pande, C.; Karuppannan, S.; Thomas, M. An integrated approach to explore the suitability of nitrate-contaminated groundwater for drinking purposes in a semiarid region of India. Environ. Geochem. Health 2022, 1–17. [Google Scholar] [CrossRef] [PubMed]
- Lerner, D.N.; Harris, B. The relationship between land use and groundwater resources and quality. Land Use Policy 2009, 26, S265–S273. [Google Scholar] [CrossRef]
- Yan, J.; Chen, J.; Zhang, W. Impact of land use and cover on shallow groundwater quality in Songyuan city, China: A multivariate statistical analysis. Environ. Pollut. 2022, 307, 119532. [Google Scholar] [CrossRef]
- Patra, S.; Sahoo, S.; Mishra, P.; Mahapatra, S.C. Impacts of urbanization on land use/cover changes and its probable implications on local climate and groundwater level. J. Urban Manag. 2018, 7, 70–84. [Google Scholar] [CrossRef]
- Maghrebi, M.; Noori, R.; Partani, S.; Araghi, A.; Barati, R.; Farnoush, H.; Haghighi, T. Iran’s groundwater hydrochemistry. Earth Space Sci. 2021, 8, e2021EA001793. [Google Scholar] [CrossRef]
- Yang, Y.; Meng, Z.; Jiao, W. Hydrological and pollution processes in mining area of Fenhe River Basin in China. Environ. Pollut. 2018, 234, 743–750. [Google Scholar] [CrossRef] [PubMed]
- Adnan, M. Pakistan’s Ability to Mitigate Water Shortage by Making Diamer-Bhasha Dam. J. Res. Soc. Pak. 2022, 59, 81. [Google Scholar]
- Iqbal, J.; Su, C.; Rashid, A.; Yang, N.; Baloch, M.Y.J.; Talpur, S.A.; Ullah, Z.; Rahman, G.; Rahman, N.U.; Sajjad, M.M. Hydrogeochemical assessment of groundwater and suitability analysis for domestic and agricultural utility in Southern Punjab, Pakistan. Water 2021, 13, 3589. [Google Scholar] [CrossRef]
- Saddiqa, A.; Batool, S.; Gill, S.A.; Khan, A. Water Governance and Management in the 21st Century: A Case Study of Pakistan. Pak. J. Humanit. Soc. Sci. 2022, 10, 29–42. [Google Scholar] [CrossRef]
- Ahmed, K.; Shahid, S.; Demirel, M.C.; Nawaz, N.; Khan, N. The changing characteristics of groundwater sustainability in Pakistan from 2002 to 2016. Hydrogeol. J. 2019, 27, 2485–2496. [Google Scholar] [CrossRef]
- Gao, J.; Li, Z.; Chen, Z.; Zhou, Y.; Liu, W.; Wang, L.; Zhou, J. Deterioration of groundwater quality along an increasing intensive land use pattern in a small catchment. Agric. Water Manag. 2021, 253, 106953. [Google Scholar] [CrossRef]
- Meneses, B.M.; Reis, R.; Vale, M.; Saraiva, R. Land use and land cover changes in Zêzere watershed (Portugal)—Water quality implications. Sci. Total Environ. 2015, 527, 439–447. [Google Scholar] [CrossRef]
- Li, Y.; Bi, Y.; Mi, W.; Xie, S.; Ji, L. Land-use change caused by anthropogenic activities increase fluoride and arsenic pollution in groundwater and human health risk. J. Hazard. Mater. 2021, 406, 124337. [Google Scholar] [CrossRef]
- Wang, W.; Chen, Y.; Wang, W.; Jiang, J.; Cai, M.; Xu, Y. Evolution characteristics of groundwater and its response to climate and land-cover changes in the oasis of dried-up river in Tarim Basin. J. Hydrol. 2021, 594, 125644. [Google Scholar] [CrossRef]
- Ahmad, S.; Imran, M.; Murtaza, B.; Arshad, M.; Nawaz, R.; Waheed, A.; Hammad, H.M.; Naeem, M.A.; Shahid, M.; Niazi, N.K.; et al. Hydrogeochemical and health risk investigation of potentially toxic elements in groundwater along River Sutlej floodplain in Punjab, Pakistan. Environ. Geochem. Health 2021, 43, 5195–5209. [Google Scholar] [CrossRef]
- Shakoor, M.B.; Niazi, N.K.; Bibi, I.; Rahman, M.M.; Naidu, R.; Dong, Z.; Shahid, M.; Arshad, M. Unraveling health risk and speciation of arsenic from groundwater in rural areas of Punjab, Pakistan. Int. J. Environ. Res. Public Health 2015, 12, 12371–12390. [Google Scholar] [CrossRef] [PubMed]
- Mazhar, I.; Hamid, A.; Afzal, S. Groundwater quality assessment and human health risks in Gujranwala District, Pakistan. Environ. Earth Sci. 2019, 78, 634. [Google Scholar] [CrossRef]
- Jiang, Y.; Zhang, C.; Yuan, D.; Zhang, G.; He, R. Impact of land use change on groundwater quality in a typical karst watershed of southwest China: A case study of the Xiaojiang watershed, Yunnan Province. Hydrogeol. J. 2008, 16, 727–735. [Google Scholar] [CrossRef]
- Jia, Z.; Bian, J.; Wang, Y. Impacts of urban land use on the spatial distribution of groundwater pollution, Harbin City, Northeast China. J. Contam. Hydrol. 2018, 215, 29–38. [Google Scholar] [CrossRef] [PubMed]
- Chiloane, C.N. Multispectral Remote Sensing of Vegetation Responses to Groundwater Variability in the Greater Floristic Region of the Western Cape, South Africa. Master’s Thesis, University of the Western Cape, Cape Town, South Africa, 2021. [Google Scholar]
- Ahmad, F. Detection of change in vegetation cover using multi-spectral and multi-temporal information for District Sargodha, Pakistan. Soc. Nat. 2012, 24, 557–571. [Google Scholar] [CrossRef]
- Mobeen, M.; Ahmed, H.; Ullah, F.; Riaz, M.O.; Mustafa, I.; Khan, M.R.; Hanif, M.U. Management. Impact of climate change on the precipitation pattern of district Sargodha, Pakistan. Int. J. Clim. Change Strateg. Manag. 2017, 9, 21–35. [Google Scholar] [CrossRef]
- Ashraf, A.; Ahmad, Z.; Akhter, G. Monitoring groundwater flow dynamics and vulnerability to climate change in Chaj Doab, Indus Basin, through modeling approach. In Groundwater of South Asia; Springer: Berlin/Heidelberg, Germany, 2018; pp. 593–611. [Google Scholar]
- Greenman, D.W.; Bennett, G.D.; Swarzenski, W.V. Ground-Water Hydrology of the Punjab, West Pakistan, with Emphasis on Problems Caused by Canal Irrigation; US Government Printing Office: Washington, DC, USA, 1967; Volume 1. [Google Scholar]
- W.E. Federation; American Public Health Association. Standard Methods for the Examination of Water and Wastewater; APHA: Washington, DC, USA, 2005; Volume 21. [Google Scholar]
- Piper, A.M. A graphic procedure in the geochemical interpretation of water-analyses. Eos Trans. Am. Geophys. Union 1944, 25, 914–928. [Google Scholar] [CrossRef]
- Noori, R.; Berndtsson, R.; Hosseinzadeh, M.; Adamowski, J.F.; Abyaneh, M.R. A critical review on the application of the National Sanitation Foundation Water Quality Index. Environ. Pollut. 2019, 244, 575–587. [Google Scholar] [CrossRef]
- Richards, L. Diagnosis and Improvement of Saline and Alkali Soils; US Government Printing Office: Washington, DC, USA, 1954; Volume 60. [Google Scholar]
- Wilcox, L. Classification and Use of Irrigation Waters; US Department of Agriculture: Washington, DC, USA, 1955. [Google Scholar]
- Siddique, S.; Al Shoumik, B.A.; Kibria, K.Q. Spatial distribution and the assessment of pond water suitability for aquaculture in the Sonadanga and Kotwali Thanas of khulna city corporation. Khulna Univ. Stud. 2022, 19, 55–65. [Google Scholar] [CrossRef]
- Tucker, C.J.; Sellers, P.J. Satellite remote sensing of primary production. Int. J. Remote Sens. 1986, 7, 1395–1416. [Google Scholar] [CrossRef]
- Xu, H. Extraction of urban built-up land features from Landsat imagery using a thematicoriented index combination technique. Photogramm. Eng. Remote Sens. 2007, 73, 1381–1391. [Google Scholar] [CrossRef]
- Noori, R.; Farahani, F.; Jun, C.; Aradpour, S.; Bateni, S.M.; Ghazban, F.; Hosseinzadeh, M.; Maghrebi, M.; Naseh, M.R.V.; Abolfathi, S. A non-threshold model to estimate carcinogenic risk of nitrate-nitrite in drinking water. J. Clean. Prod. 2022, 363, 132432. [Google Scholar] [CrossRef]
- Narsimha, A.; Rajitha, S. Spatial distribution and seasonal variation in fluoride enrichment in groundwater and its associated human health risk assessment in Telangana State, South India. Hum. Ecol. Risk Assess. Int. J. 2018, 24, 2119–2132. [Google Scholar] [CrossRef]
- Ahada, C.P.; Suthar, S. Assessment of human health risk associated with high groundwater fluoride intake in southern districts of Punjab, India. Expo. Health 2019, 11, 267–275. [Google Scholar] [CrossRef]
- Means, B. Risk-Assessment Guidance for Superfund—Volume 1—Human Health Evaluation Manual—Part A; Interim report (Final); U.S. Environmental Protection Agency: Washington, DC, USA, 1989; Volume 1. [Google Scholar]
- Usepa, I.R.I.S. Integrated Risk Information System; Environmental Protection Agency Region I: Washington, DC, USA, 2011; p. 20460. [Google Scholar]
- Adimalla, N.; Qian, H.; Tiwari, D.M. Groundwater chemistry, distribution and potential health risk appraisal of nitrate enriched groundwater: A case study from the semi-urban region of South India. Ecotoxicol. Environ. Saf. 2021, 207, 111277. [Google Scholar] [CrossRef] [PubMed]
- Khan, N.; Bano, A.; Zandi, P. Effects of exogenously applied plant growth regulators in combination with PGPR on the physiology and root growth of chickpea (Cicer arietinum) and their role in drought tolerance. J. Plant Interact. 2018, 13, 239–247. [Google Scholar] [CrossRef]
- Janardhana Raju, N.; Shukla, U.; Ram, P. Hydrogeochemistry for the assessment of groundwater quality in Varanasi: A fast-urbanizing center in Uttar Pradesh, India. Environ. Monit. Assess. 2011, 173, 279–300. [Google Scholar] [CrossRef]
- Panneerselvam, B.; Karuppannan, S.; Muniraj, K. Evaluation of drinking and irrigation suitability of groundwater with special emphasizing the health risk posed by nitrate contamination using nitrate pollution index (NPI) and human health risk assessment (HHRA). Hum. Ecol. Risk Assess. Int. J. 2020, 27, 1324–1348. [Google Scholar] [CrossRef]
- Gibbs, R.J. Mechanisms controlling world water chemistry. Science 1970, 170, 1088–1090. [Google Scholar] [CrossRef]
- Srinivasamoorthy, K.; Chidambaram, S.; Prasanna, M.; Vasanthavihar, M.; Peter, J.; Anandhan, P. Identification of major sources controlling groundwater chemistry from a hard rock terrain—A case study from Mettur taluk, Salem district, Tamil Nadu, India. J. Earth Syst. Sci. 2008, 117, 49. [Google Scholar] [CrossRef]
- Rahman, S.H.; Khanam, D.; Adyel, T.M.; Islam, M.S.; Ahsan, M.A.; Akbor, M.A. Assessment of heavy metal contamination of agricultural soil around Dhaka Export Processing Zone (DEPZ), Bangladesh: Implication of seasonal variation and indices. Appl. Sci. 2012, 2, 584–601. [Google Scholar] [CrossRef]
- Talib, M.A.; Tang, Z.; Shahab, A.; Siddique, J.; Faheem, M.; Fatima, M. Hydrogeochemical characterization and suitability assessment of groundwater: A case study in Central Sindh, Pakistan. Int. J. Environ. Res. Public Health 2019, 16, 886. [Google Scholar] [CrossRef]
- Islam, S.; Majumder, R.K.; Uddin, M.J.; Khalil, M.; Ferdous Alam, M. Hydrochemical characteristics and quality assessment of groundwater in Patuakhali district, southern coastal region of Bangladesh. Expo. Health 2017, 9, 43–60. [Google Scholar] [CrossRef]
- Khalid, S. An assessment of groundwater quality for irrigation and drinking purposes around brick kilns in three districts of Balochistan province, Pakistan, through water quality index and multivariate statistical approaches. J. Geochem. Explor. 2019, 197, 14–26. [Google Scholar]
- Ashraf, H.; Mobeen, M.; Miandad, M.; Khan, M.A.; Rahman, G.; Munawar, S. Assessment of Urban Sprawl in Sargodha City using Remotely Sense Data. Ecol. Quest. 2022, 33, 1–16. [Google Scholar] [CrossRef]
- Alam, H.-m.E.; Alam, M.; Hoque, M.; Sarkar, M.S.I.; Arafat, M.; Ahmed, K.T.; Uddin, M. The impact of coastal development on land surface temperature in the mangrove ecosystem of the Chattogram coast in Bangladesh. J. Coast. Conserv. 2022, 26, 23. [Google Scholar] [CrossRef]
- Wu, J.; Li, P.; Wang, D.; Ren, X.; Wei, M. Statistical and multivariate statistical techniques to trace the sources and affecting factors of groundwater pollution in a rapidly growing city on the Chinese Loess Plateau. Hum. Ecol. Risk Assess. Int. J. 2019, 26, 1603–1621. [Google Scholar] [CrossRef]
- Wu, J.; Zhang, Y.; Zhou, H. Groundwater chemistry and groundwater quality index incorporating health risk weighting in Dingbian County, Ordos basin of northwest China. Geochemistry 2020, 80, 125607. [Google Scholar] [CrossRef]
Publisher’s Note: MDPI stays neutral with regard to jurisdictional claims in published maps and institutional affiliations. |
© 2022 by the authors. Licensee MDPI, Basel, Switzerland. This article is an open access article distributed under the terms and conditions of the Creative Commons Attribution (CC BY) license (https://creativecommons.org/licenses/by/4.0/).