1. Introduction
The improvement of harvesting methodologies plays an important role in the optimization of wood production in a context of sustainable forest management [
1]. Different harvesting methods are applied according to forest site-specific conditions and degree of mechanization. The main different harvesting systems can be classified as fully mechanized, semi-mechanized or motor-manual harvesting system, according to the degree of mechanization used to carry out the different tasks involved in forest harvesting operations [
2]. The most predominant systems nowadays are the fully and semi-mechanized systems. The fully mechanized systems are those based on the use of machines, such as harvesters and forwarders among others, that minimize manual labor. By increasing the level of mechanization for the development of the activities instead of manual labor, not only higher productivity but also greater operator safety is achieved [
3]. Another side effect of the implementation of these systems is the possibility to fully record the wood extraction supply chain from the forest to the landing point, thanks to the on-board computers of the machines used. With the use of manual work, an automated monitoring of the chain flow is not always possible, and it is more costly to have such information available, as it implies the use of additional personnel. It also implies a higher probability of errors in the acquired data due to the human factor.
However, Cut to Length (CTL) systems with modern harvesters and forwarders constitute a fully mechanized harvesting system that offers the possibility to record a large range of the working and stand parameters. For example, instantaneous fuel consumption information, performance class of the engine, stem and individual log volumes and tree species can be recorded. Also, it can provide quantitative work features information, such as shift time consumption per processing of a production unit and constant records of geospatial coordinates of the machine, thus enabling the positioning of the recorded data [
4].
The fully mechanized CTL system is based on the production of standardized assortments with previously specified lengths. These operations are usually carried by two machines, a harvester and a forwarder. It requires all the operations to be done at the stump site before the log transportation takes place from there to the forest road. CTL involves felling, delimbing (removing branches), topping (cutting the top of the stem at a specified diameter) and processing of the delimbed stems into log assortments by a harvester while a forwarder carries out the transportation of the assortments and their classification according to their purpose. When performed, through the use of harvesters and forwarders, this fully mechanized harvesting system (CTL system) requires less labor, less access road construction and fewer landing areas than other fully mechanized ground-based systems, such as whole-tree harvesting with feller-bunchers and skidders, and also leads to more efficient wood recovery [
5]. Before harvesters, chainsaws represented the most important work tools for the initial processing of the logs and timber production. Despite the increasing use of harvesters nowadays, chainsaws will still be used in the future, particularly for cutting trees of greater dimensions and in hardwood harvesting [
6,
7].
Operating forest machines is not only expensive, but the accurate monitoring of economic variables can be very difficult. Detailed machine data capture of economic variables within a forest enterprise can be used to support decision processes, especially accurate costing for new investments [
8]. Time consumption and fuel consumption for forestry machines have been well-studied with the traditional aim of investigating the main factors affecting production and energy efficiency. Nowadays the reasons to conduct time studies have been broadened to include the developing and building of accurate models that can be utilized in different kinds of simulations that aim to find new, more efficient work methods, to optimize complete operations or to develop more efficient machines [
9].
The increasing performance of the data acquisition, data processing and transmission due to the new technological advances (Industry 4.0) and the implementation of the principle of Precision Forestry (PF) make possible the monitoring and evaluation of forest resources, providing a tool for forest management to ensure the traceability of forest products [
10,
11] and a tool to validate theoretical models regarding forest harvesting systems and efficiency [
12]. This technology allows decision-makers to have a detailed quali-quantitative characterization of wood resources, in both its geographical features and forest parameters. Such data platforms or the use of new harvesting machines, equipped with this technology, give the possibility to upload all data gathered continuously during the normal work condition and to request it as it is necessary. Therefore, when a fully mechanized harvesting system with modern machines is applied, it is typically possible to automatically record all the information related to the machine parameters and also characteristics of the harvested timber, such as metrics, species or position, from the stand to the roadside. Using the platform provided by the manufacturer, it is possible to visualize this information online (fuel consumption, productivity and position).
The most advanced forest machines, such as most heavy-duty construction, agricultural or transport vehicles, can be monitored through the use of specific Electronic Control Units (ECUs). The ECUs communicate the status and the parameters of the machines to the on-board computer (OBC) through the Controller Area Network (CAN-bus) and generally according to specific standard (e.g., SAE J1939). With the advance of automated data collection on the CTL system machines [
13], sensors and processors can communicate with the OBC, which represents the interface with the operators. In nearly all modern forest harvesters and processors, not only the machine engine and vehicle status are recorded but also the parameters of the harvesting and felling operations through the use of the Standard for Forest Machine Data and Communication (StanForD) [
14]. As a consequence, the automation layer of the CTL machine passes through a CAN-bus system that connects all the related units, such as actuators, sensors and controllers, forming a distributed control system. The control system constantly produces and processes hundreds of signals related to the vehicle engine, transmission and harvester head performance and control, as well as the production parameters. The control system and the human operator interact through the on-board control system of the forest machine, which also produces standard production and performance data based on the measurements during the work.
Moreover, using the CAN-bus system in combination with Geographic Information Systems (GIS), forest contractors can track all vehicles from a central location through the fleet management system (FMS) [
15,
16]. This system allows technological efficiency to be maximized, productivity to be increased and safety for an organization’s vehicles and drivers to be improved. Usually, this is achieved using a combination of vehicle tracking (GNSS position), reporting on fuel consumption, monitoring of driver behavior and management of vehicle maintenance. In addition, the FMS can be used to investigate, and in a more accurate way, different aspects of forest operations, such as those related to the environmental performance (fuel consumption and CO
2 emissions, among others), which gain, day by day, more relevance both for the contractors as well as for the forest managers [
17]. Despite the data availability, there have been few studies that focused on both technological and environmental efficiency.
Therefore, the objectives of this study are to analyze the technological and environmental efficiency of the CTL harvesting system based on the fleet management system. More specifically, the aims are to estimate the fuel consumption, CO2 emissions and productivity, considering also the technological performance aspects, such as time consumption, and taking into consideration each machine type and each work element performed by them. In particular, technological and environmental efficiency will be analyzed in the contest of Scots pine forests in gentle terrain located in Poland.
2. Materials and Methods
2.1. Study Area and Machine Description
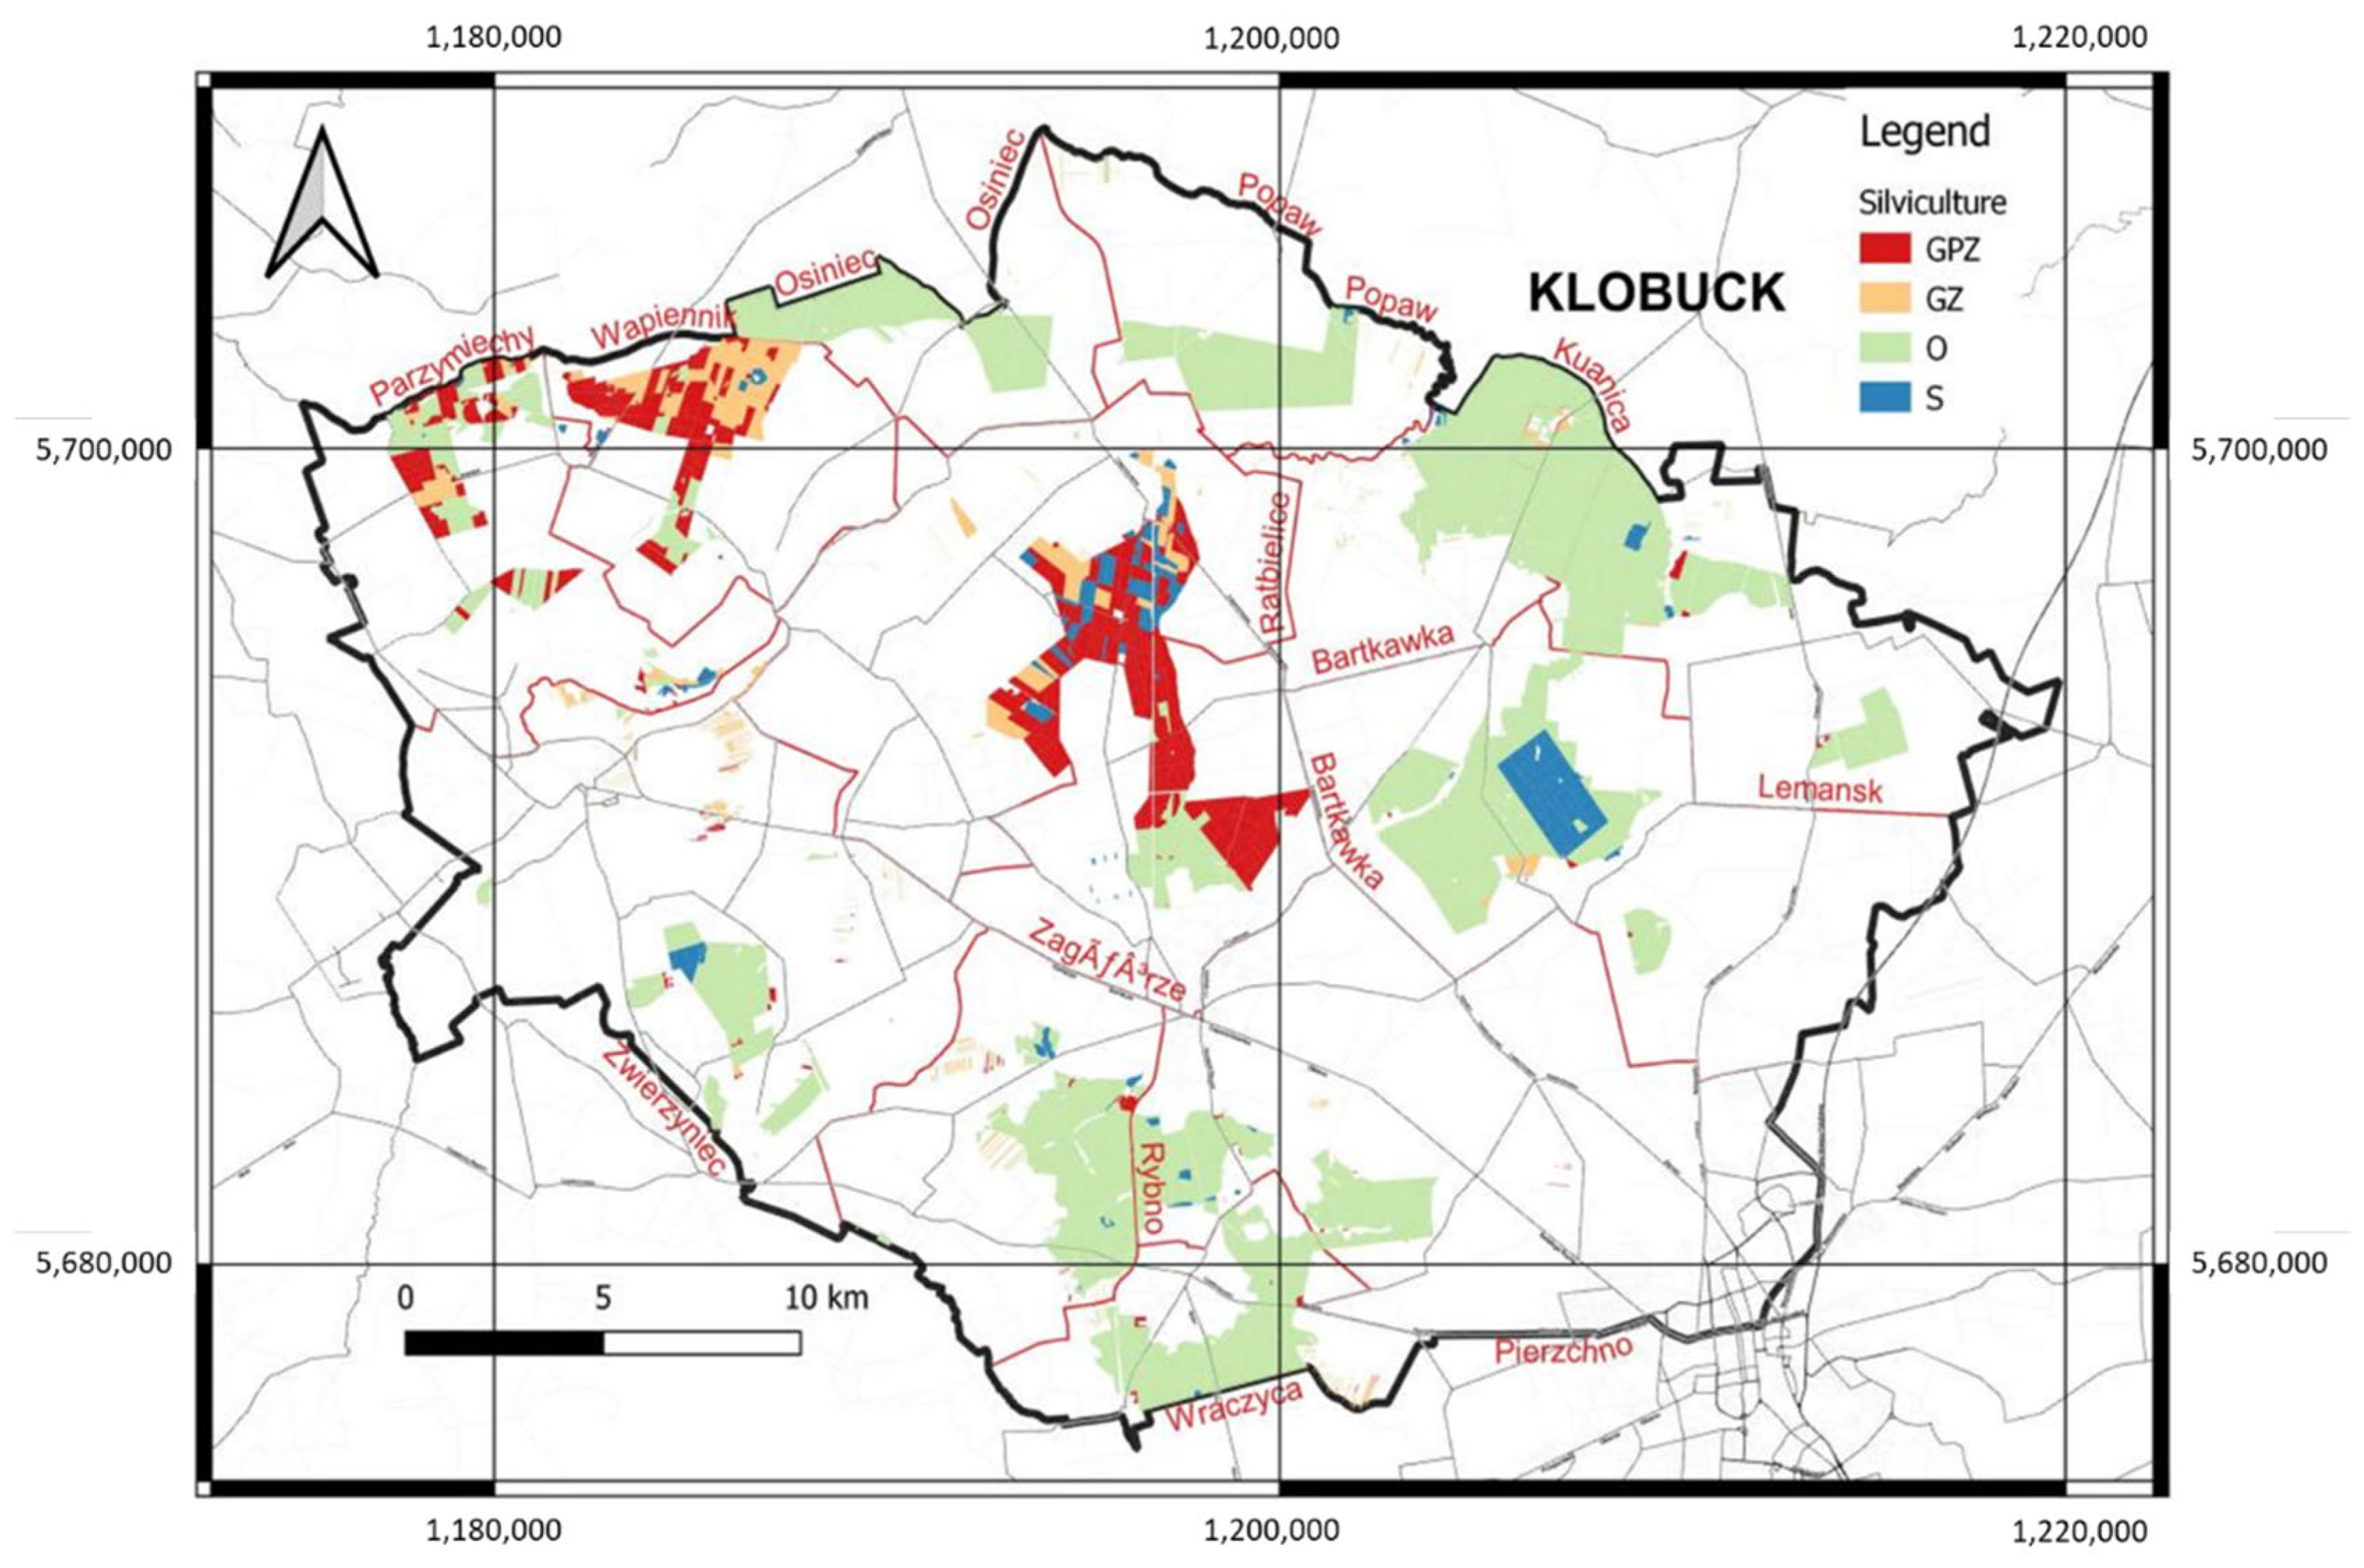
The working area is located in the State Forest District of KŁOBUCK (Poland). This is one of the districts situated in the northern part of the State Forest Regional Directorate (RDSF) of Katowice; however, it spreads between Silesian and a little area in Opole Voivodeships (
Figure 1). The forests stand geographically between 50°48′35″ and 51°05′57″ Latitude and from 18°38′30″ to 19°15′31″ Longitude. Geologically, the Forest District is an upland sculpted to varying degrees, in the altitude range from 180 m.a.s.l. (Wąsosz Górny, Popów commune—Warta river level) up to 304 m.a.s.l. (Truskolasy, Węczyca commune). The terrain falls slightly from south to north, latitudinally crossed by the Warta valley, and then rises slightly from the northern borders reaching a height of 257 m.a.s.l. in Parzymiechy.
The administrative area of the Kłobuck Forest District is 89,100 ha. This includes a forested area of about 21,800 ha, of which over 16,400 ha is managed by the Kłobuck Forest District. The forests’ function, in addition to the production function, fulfils many non-productive tasks. The most important of them undoubtedly includes protective functions, among others, water supply and water balance control for the surrounding cities.
Scots pine (Pinus sylvestris; L.) is the dominant species on almost 85% of the area, pedunculate oak (Quercus robur; L.) and sessile oak (Quercus petraea Matt.) at just over 5% and, of the other species, none exceeds 5%. The same percentages can be assumed for volume as well. In the stands of the Kłobuck Forest District, foreign species are visible, but they achieve no significant shares: black pine (P. thunbergii; Parl.), Weymouth pine (Pinus strobus; L.) and red oak (Quercus rubra; L.); as dominant species, they occupy only 0.5% of the forested area in total. Single species and double species stands cover more than one-half (58%) of the forested area. This is likely to happen since the dominant species is the Scots pine, which naturally tends to create one-leveled, single-story stands.
Two harvesters and two forwarders were used during CTL logging operations. The harvesters were two 200 kW John Deere 8-wheeled 1270G models with rotating and self-leveling cabin: One (H1) was equipped with the H414 harvesting head, and the other (H2) was equipped with the H480C Harvesting Head (
Table 1). The forwarders were a 136 kW John Deere 8-wheeled 1210E (F1) and a 164 kW John Deere 8-wheeled 1510G model (F2) with rotating and self-leveling cabin (
Table 2). The harvesters and the forwarders were provided with Windows-based TimberMatic™ (John Deere, Moline, IL, USA) as a control system. Both harvesters were equipped with EU Stage IV approved engines; as for the forwarders, the forwarder F1 was equipped with EU Stage IIIB complying requirements engine, and the forwarder F2 engine was certificated as EU Stage V.
These stages were set by the European Union since 1997 in order to regulate diesel engines’ emissions in off-road machines. EU Stage IV was established in 2005, and apart from amending the previous stages, it also introduces restrictions regarding particle number (PN) emission limit that has to be under 0.025 g/kWh. This policy was designed to force the use of diesel particulate filters. EU Stage IV also includes a limit for ammonia emissions, which must not exceed a mean of 25 ppm over the test cycle.
EU Stage IV differs from EU Stage IIIB for covering different types of engines, but it applies the same emissions standard as EU Stage IIIB. EU Stage V introduces a new mass-based limit for PN emissions that aims to ensure the use of a highly efficient particle technology on the certificated engines. All these stages’ emissions limits are listed in
Appendix A.1. These standards only cover the exhaust emissions of the engine prior to its passage through the exhaust filters, thus the CO
2 emission (the most relevant of the Greenhouse Gases—GHGs) at this phase can only be found as CO and not CO
2. Therefore, the comparison between emitted CO
2 and emitted CO is not possible in a reliable way.
The operators have more than 10 years of experience, except in the case of one forwarder operator, who had 2 years of experience, and they work organized in double shifts. Typically, the harvesters and the forwarders work in pairs, and each forwarder extracts the timber stacked in the forest by the harvester. In this study, forwarder F1 worked paired with harvester H1, and forwarder F2 worked paired with harvester H2.
The first team composed by H1 and F1 was performing thinning operations; meanwhile, the second team, composed of H2 and F2, was performing the final felling. Moreover, harvester H1 and forwarder F2 were equipped with John Deere (John Deere, Moline, IL, USA) Intelligent Boom Control (IBC), which automatize the movements and trajectory of the boom in order to allow the operator to focus on the grapple instead of the movements of the crane’s joints.
2.2. Data Collection
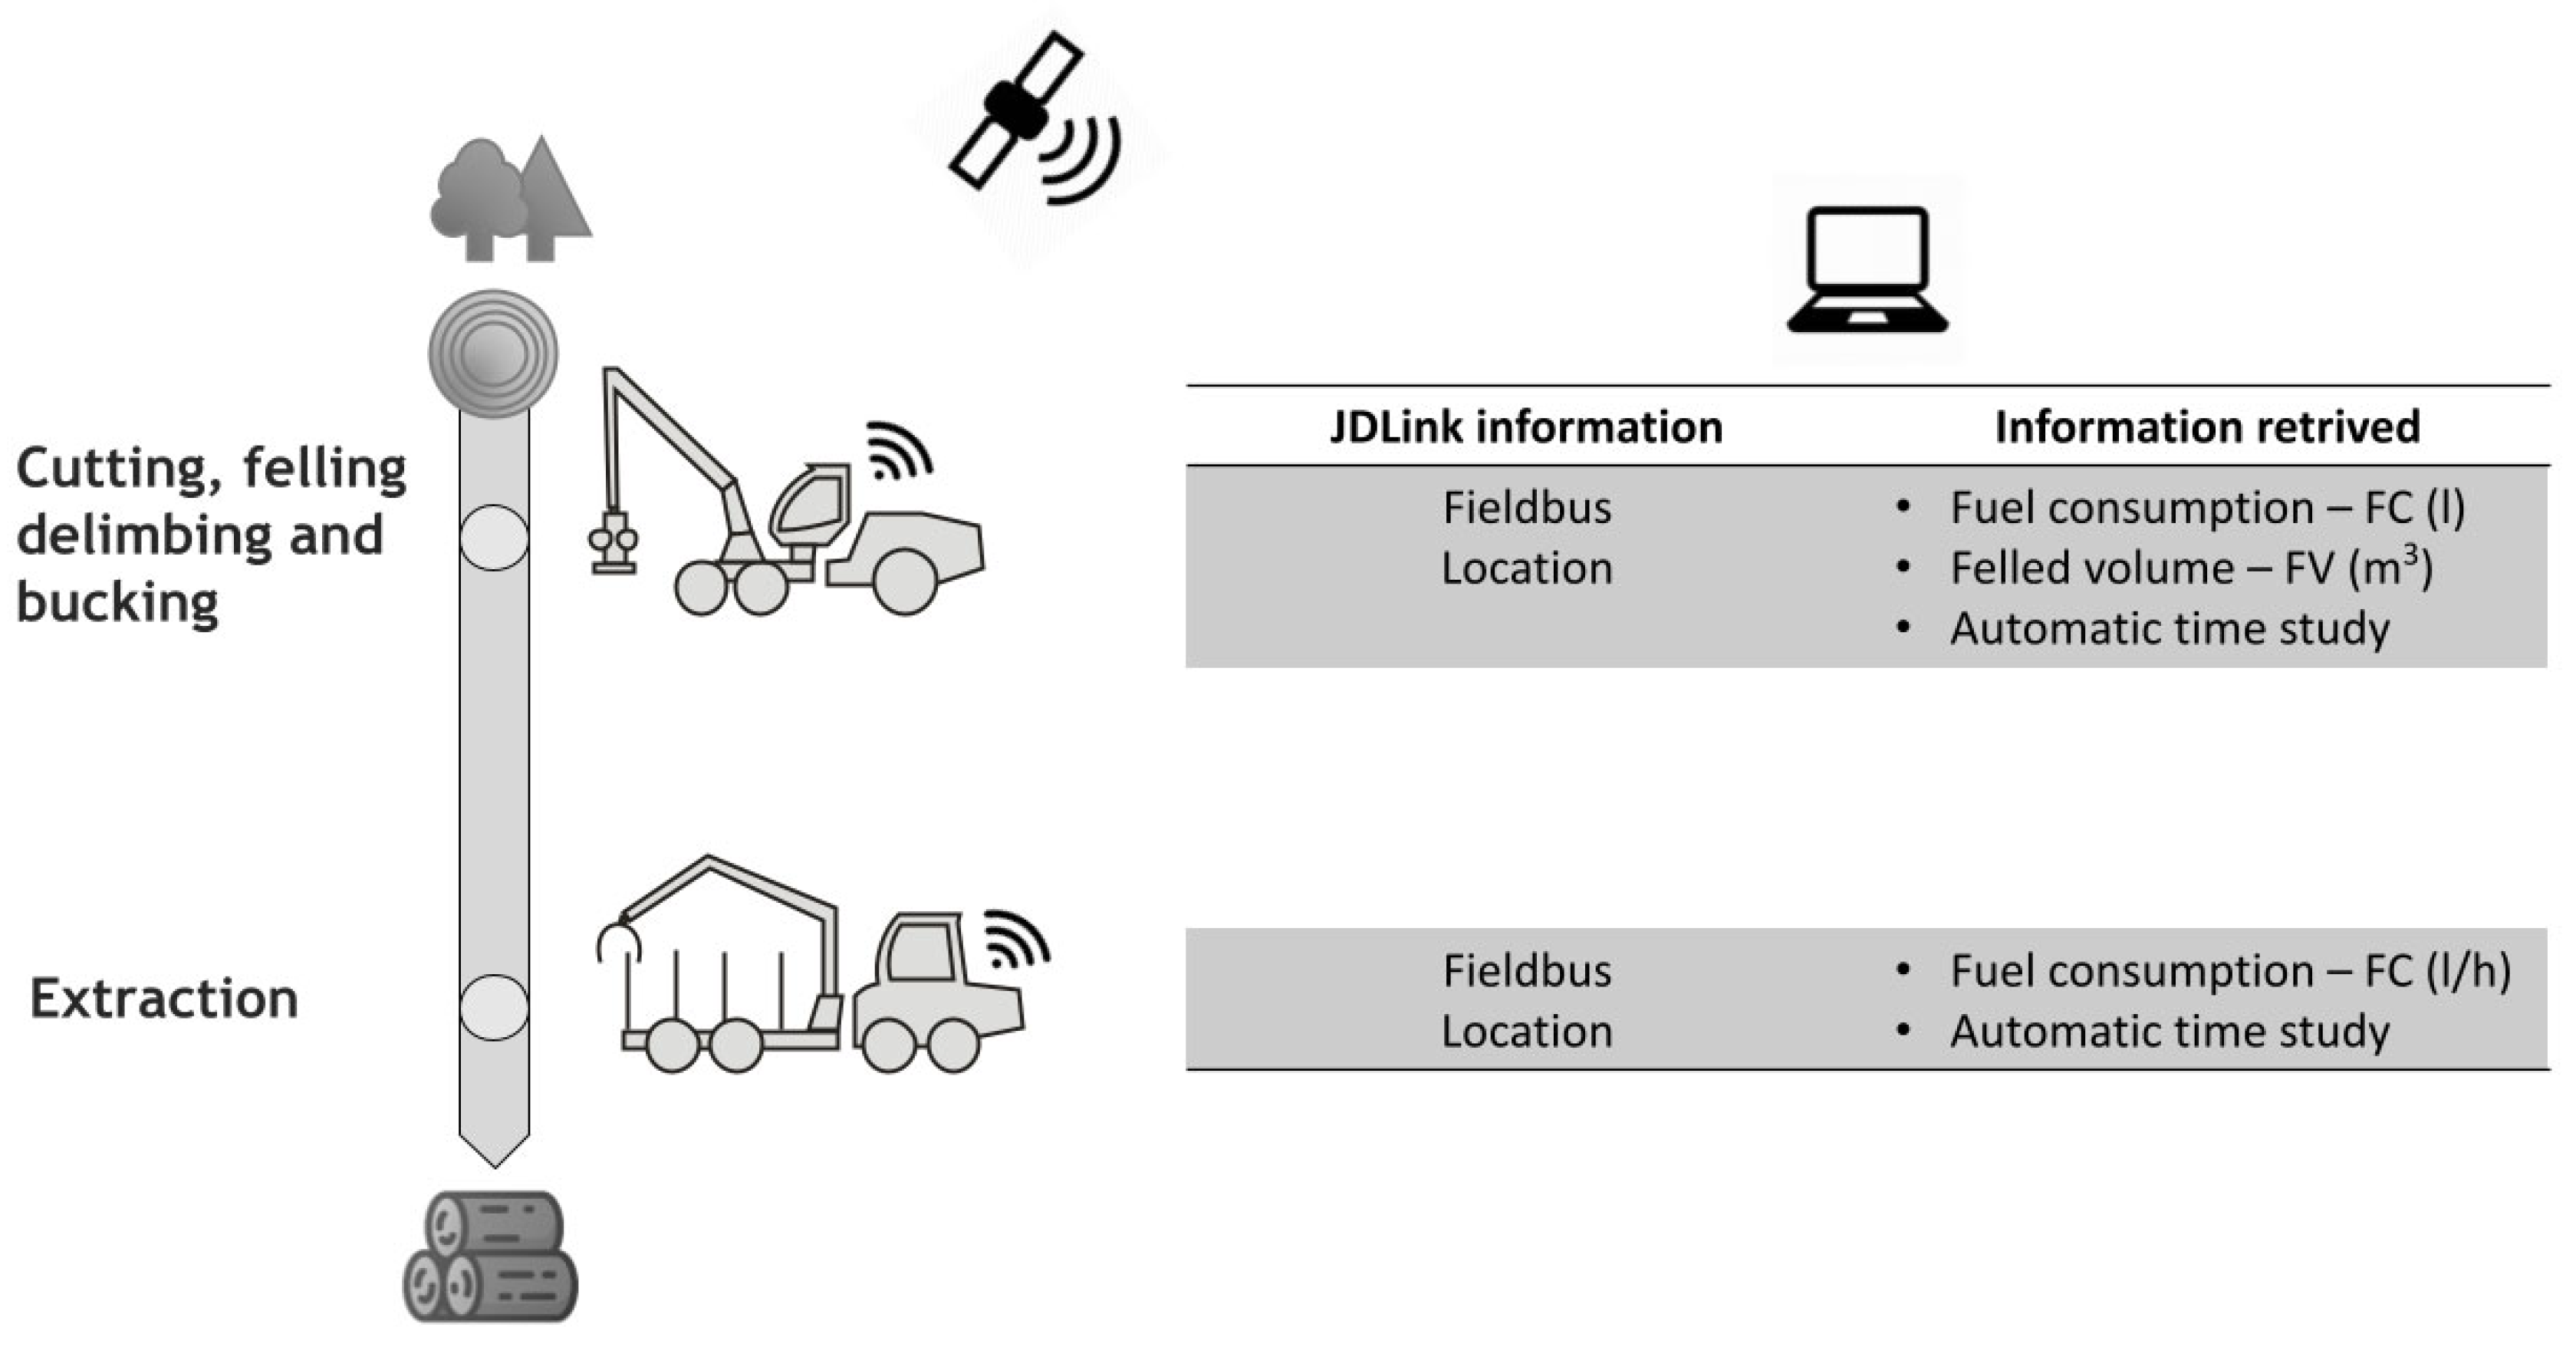
The work measurements were conducted through a follow-up study, where data were automatically recorded by the forest machines OBCs during working activity. To better analyze and understand the performance of the machines in terms of efficiency, work activity was divided into different work elements (
Table 3).
Since the involved machines are from the same manufacturer, to achieve the aim of the study, the official system of the company, called JDlink
TM (John Deere, Moline, IL, USA) was fully exploited. JDLink
TM is John Deere’s telematics system that connects all make/model machines produced by this company working in the field with the office and mobile devices. This is a wood procurement systems product, used for production, preparation and planning or feedback analysis of the data collected during production or for direct communication with the production so intended for desktop designated for this task (
Figure 2).
From JDLink
TM, geospatial and fieldbus data was available from September 2018 to January 2020 with hourly-shift level, which was the higher data frequency available. Stand information was downloaded from Polish Forest Data Bank (Bank Danych o Lasach) [
18]. Geospatial information, latitude and longitude, were recorded by the Global Navigation Satellite System (GNSS) receiver. The fieldbus data related to the vehicle engine parameters, transmission and harvester head performance (Can-BUS and StanForD data) were collected by the Timberlink
® software, which controls the OBC. This information, stored in the OBC of each machine, was automatically uploaded to the JDLink
TM portal. The most important parameters considered in this study, therefore, were as shown in
Appendix A.2.
Several steps occurred before having the complete dataset ready for further analysis. Since all the data of interest were stored in separate files, there was the need to process the GNSS file obtained by download from JDLink with hourly resolution, containing stand information and the file in a unique complete dataset. Merging in R needs a common key variable, which was resolved with the “setkey()” function, using as condition the nearest time between the two datasets for every day, since the aim was to pair columns of both datasets by the same moment of recording. In this way, it is possible to know exactly where a machine has worked with an hourly precision.
2.3. Data Analysis
2.3.1. Time Consumption and Productivity Analysis
To obtain the management planning, forest administrative borders and stand parameters, the daily harvester positions were filtered in order to remove the non-working location by the field bus data using QGIS 3.10 A Coruña version and R core
TM 2021 software [
19,
20]. The obtained dataset contains all the information related to the harvester position sampled once per hour, and the timber felled, delimbed and bucked in the forest summed each hour. In fact, the analyzed work system represents a CTL system where the two harvesters deal with felling, delimbing and bucking in the forest. Consequently, the two forwarders had the task of extracting the timber from the forest to the roadside. Since the forwarder location was saved once per hour, as the harvesters, but considering that the forwarders cross different stands during the timber extraction, it was not possible to merge the field bus with the correct stand (where the forwarder loads the timber) due to the low frequency of the data acquisition. Thanks to the fact that harvesters and forwarders work in pairs and the only task of the forwarder was to extract timber, we assumed that the extracted volume is equal to volume stacked in the forest by the harvester (58,160.20 m
3). Due to the exact geospatial information of the harvester, the related fieldbus information (time study, fuel consumption, processed volume, etc.) was also analyzed. As a result, a database that could be characterized as big data was obtained.
To analyze the obtained dataset and the interaction between the different working factors recorded by the fieldbus system, inferential statistics were used, assuming the hourly observation as the observational unit. Due to the wide range of variation of the data and in order to reduce that variation, the considered observational unit was decided to be the workday. In the case of the forwarders, the range of variation was even higher, thus the workday in this case was defined as those days on which more than 6 h of productive machine work were recorded.
However, after data processing, the data proved not to be normally distributed, therefore an inferential statistical analysis would not be the most appropriate or accurate approach to the analysis of the data set. Instead, the non-parametrical, two-sample Mann–Whitney U Test was performed at 95% confidence interval for the median. The test was carried out both intergroup and intragroup (including time and fuel consumption); this means that the test was conducted to analyze the differences between the various activities performed by each machine as well as the differences between the same activities performed by the two different machine models in each case (harvester H1 in contrast to harvester H2 and forwarder F1 in contrast to forwarder F2).
2.3.2. Efficiency Analysis
Fuel consumption is defined as the amount of fuel in liters consumed by a machine during one working hour, and its measurement unit typically is expressed as L/h. In emission analysis, fuel consumption is indeed an important value when CO
2 emissions are computed indirectly [
21]. Carbon dioxide equivalent emissions (kg CO
2 eq) were calculated applying an emission factor of 2.61 to each liter of fuel consumed [
22].
Forwarders’ and harvesters’ fuel consumption is traditionally measured using a mass flow meter, or the consumed fuel is determined by measuring the fuel input during the refilling activity. However, in this study, the CAN bus acquiring data system was used in order to achieve a higher accuracy of the measurement of fuel consumption [
23] and to differentiate the fuel consumption variation among the different activities performed.
3. Results
During the data acquisition and after the data analysis, the result dataset contains in the case of the harvesters a total of 2249.38 time-related observations (parameters hourly recorded), which converted to the observational units means 433 observations. Regarding the result dataset related to the analysis of the forwarders’ performance, the total amount of time-related observations was 3764.67. This number of observations translates to 245 observational units. Analyzing the fuel consumption, during the 678 days of working time considered in this study, a total of 46,114.58 l of fuel was consumed by the four machines (two harvesters and two forwarders). This fuel consumption leads to a total of 120,359.06 kg of CO2 eq emissions. Furthermore, considering the total amount of processed wood recorded by each harvester (30,168.27 m3 by H1 and 25,155.81 m3 by H2), the average volume of fuel consumed by the first team composed of harvester H1 paired with forwarder F1, per product unit was 0.74 L/m3, and the CO2 eq produced per product unit was 1.92 kg CO2 eq/m3. Regarding the second team composed of harvester H2 and forwarder F2, a total of 0.95 L/m3 were consumed, producing a total of 2.48 kg CO2 eq. In addition, from the dataset, it was also possible to extract the average productivity of the harvesters, which in the case of H1 was of 26.63 m3/h and in the case of H2 was of 22.17 m3/h. The productivity of the forwarders was not possible to calculate since there was no possibility to measure their loads.
3.1. Harvesters’ Analysis
The descriptive statistics of the work element of the harvesters are shown in
Table 4 and
Table 5. Over 39% of the time spent was related to time process operation while 35% to 40% of the remaining time was preparation time. The work element related to non-productive time ranged from 21% to over 24% of the total time.
The fuel consumption rates according to the two different models of machines studied and their working elements are shown in
Table 5. The total amount of fuel consumed during the 2249.38 h of observations was 35,527.23 L for both machines. 17,304.72.64 L were consumed by the harvester H1, with an average fuel consumption rate of 15.43 L/h, and 18,222.51 L was consumed by the harvester H2, with an average fuel consumption rate of 16.16 L/h. The most fuel-demanding activities correspond to the preparation and processing parts of the work cycle with approximately 93% of fuel consumption. The remaining 7% corresponds to other times such as operators’ breaks, machines’ repair and set up, logistics, etc.
Considering an average volume of trees for each stand in which the harvesters worked, the average fuel consumption per cubic meter can be calculated. In the case of harvester H1, the fuel consumption per cubic meter of logs processed was 0.571 L/m3 and in the case of harvester H2 the fuel consumption per cubic meter was 0.72 L/m3. In terms of CO2 eq emissions, a total of 92,726.07 kg was produced by the harvesters. Harvester H1 produced a total of 45,165.32 kg of CO2 eq, and harvester H2 produced a total of 47,560.75 kg of CO2 eq.
Regarding the non-parametrical statistical analysis of the time and fuel consumption differences between harvester H1 and H2 (intergroup), and the time and fuel consumption differences between the work elements of each of them (intragroup), there were found significant differences in all the compared pairs of data, except for the interaction intergroup between the time consumption of the processing work element among the H1 and H2, and the interaction intragroup between the time consumed by H2 performing preparation and processing work elements. The
p-values at 95% confidence interval for the median of all the comparisons performed can be found in
Table 6 and
Table 7.
3.2. Forwarders’ Analysis
The descriptive statistic regarding the time consumption of the work element of the forwarders is shown in
Table 8. Based on the descriptive statistics, the percentage of time spent driving loaded (14% of the working time for each forwarder) was lower than the time spent driving unloaded (18 and 20% of the working time for each forwarder); however, analyzing the non-parametric tests performed (
Table 9 and
Table 10), it can be observed that the differences regarding the time consumption for both forwarders (F1 and F2) performing the mentioned work elements (drive unloaded and drive loaded) is not significant at 95% confidence interval for the median (
p-values of 0.1 and 0.8, respectively). Furthermore, in the case of the forwarder F1, in both work elements (drive loaded and drive unloaded) are not significant differences at 95% confidence interval for the median (
p-value of 0.07). The time spent loading varies between 45% and 42% of the total working time whereas the time spent unloading was 23% of the total working time. Also, a complementary analysis was performed in order to have a broader idea about the working productivity and efficiency during the time that the data was recorded. A theoretical cycle was simulated assuming an extraction distance of 350 m (700 m driven per simulated working cycle) and the resulting number of simulated cycles per observational unit (work days with at least 6 h of activity) considering the total distance driven by the forwarders included 17 cycles for the F1 forwarder and 15 cycles for the F2 forwarder (standard deviation of 7 and 6, respectively).
The distribution of fuel consumption between the different work activities of the forwarders is shown in
Table 11. The total fuel consumption of both forwarders was 10,587.35 L. Forwarder model 1210E consumed a total of 4948.00 L, with an average fuel consumption of 9.27 L/h. The forwarder model 1510G consumed a total of 5639.35 L, with an average fuel consumption of 11.75 L/h. The most demanding fuel activities for both machines were driving loaded, with approximately 31% of the fuel consumption. The average value of fuel consumption per product unit was 0.19 L/m
3, more precisely forwarder F1 consumed an average of 0.16 L/m
3, and forwarder F2 had an average fuel consumption per product unit of 0.22 L/m
3. Regarding the CO
2 eq emissions of both forwarders, a total of 27,632.98 kg of CO
2 eq was produced. Forwarder type 1210E produced a total of 12,914.28 kg of CO
2 eq, and forwarder type 1510G produced 14,718.70 kg of CO
2 eq.
Performing the non-parametrical statistical Mann–Whitney U test of the fuel consumption differences (
Table 9 and
Table 10) between the different work elements performed by forwarders F1 and F2 (intragroup) and the time and fuel differences between the same work elements performed by each of them (intergroup), significant differences were found in all comparisons.
4. Discussion
In order to meet EU targets for energy savings and GHG emissions reduction, and to improve the CO2 sink role of forest ecosystems, it is necessary to understand and quantify the different factors influencing forest management. In this study, relatively new technological methods were used to quantify key aspects of forest operations management, such as productivity, time efficiency, fuel consumption and GHG emissions.
Regarding the productivity of the system analyzed in the case of the harvesters, the total productive time (preparation and process) represented almost 80% of the total time. This value is approximatively the same as other values (approx. 79%) reported in similar studies for final felling and thinning operations [
23]. It is interesting to note that, in a different study where the productivity of the CTL system was analyzed in aged oak coppice stands [
24], the processing time accounted for 39.7% of the total working time (including also delays and other non-productive times), which is close to the ones reported in this study (approx. 40% for both harvesters). Analyzing the time share between the different work elements of H1 compared to H2, there are significant differences between them, except for the processing work element, in which case no significant differences were found. Since both harvesters (H1 and H2) were the same machine model, and significant differences were found between the fuel consumption during the performance of all work elements, it can be deducted that the harvesting operation method carried out in that environmental condition (thinning operation versus final felling) have a significant influence in the fuel consumption but not in the time distribution regarding the processing work element. In addition, with regard to H2 time distribution of the processing and preparation work elements performed during the final felling, no significant difference was found, although the productivity of H2 (22.17 m
3/h) was lower than the productivity of H1 (26.63 m
3/h) and the fuel consumption, per product unit, was higher in the case of the H2 (0.72 L/m
3) than in the case of H1 (0.57 L/m
3). This leads to the inference that a higher time share of the preparation work element incurs in a lower productivity as well as in a higher fuel consumption.
Compared to other studies [
25,
26], all the values reported in this study regarding the time share of the forwarders’ work elements are under the range of the values reported in their results. In the comparing studies, the percentage of time that the forwarder spends on driving loaded range between 8% and 20% (approx. 14% in this study). As for the share of time that the forwarder spends driving unloaded, the percentages reported by the studies ranges between 12% and 17% (18% per F1 and 20% per F2 in this study). Regarding the time loading, the values reported by other studies ranges between 30% and 55% of the productive time, while in this investigation the values reported for this work element were 45% for F1 and 42% for F2. Also, the share of the time spent unloading in those cases varies between 20% and 30% of the total productive time, and in this study, a time share of 23% was reported.
Moreover, the fact that, in this research, both forwarders recorded were different and were working on different stands (thinning and final felling,) but with the same species composition, and yet, there was no significant difference between the time share driving loaded or driving unloaded work element between F1 and F2 (despite the different operator’s experiences). Between driving loaded or unloaded work element in the case of forwarder F1, it means that the time efficiency of a forwarder depends on the ratio machine power, stand parameters such as the DBH and working conditions (e.g, extraction distance, slope). In terms of efficiency, the fuel consumption rates in most cases base their estimates on previous calculations or life cycle assessments; however, over the last few years, more and more empirical methods have been used considering real data, as is the case in this study.
Considering the case of the harvesters, the average fuel consumption values reported in this study per working hour and per product unit (15.43 L/h and 0.57 L/m
3 by H1 and 16.16 L/h and 0.72 L/m
3 by H2) are under the range reflected in other articles [
27,
28,
29]. Similar studies report an average fuel consumption per product unit ranging from 0.6 L/m
3 in thinning operations until 1.8 L/m
3 in final fellings. Nevertheless, the number of studies in which the fuel consumption of harvesters is reflected using direct measurement methods is limited. If, furthermore, it is desired to study the relationship between each activity of the work cycle performed by the harvester with its specific fuel consumption, the related publications are even more reduced.
The related CO2 emissions recorded were of 40.27 kg CO2 eq./h in the case of H1 and 42.17 kg CO2 eq./h in the case of H2, and 1.49 kg CO2 eq./m3 were produced by H1 and 1.88 kg CO2 eq/m3 by H2. Since the calculation of the CO2 emissions is performed in an indirect manner (using 2.61 as converting coefficient) from the fuel consumption, it is assumed that the emissions values are also in the same ranges of variation as those ones recorded in similar studies mentioned above, nevertheless different conversion methods and coefficients are used to estimate the machine emissions, thus the final values maybe not completely similar.
Regarding the forwarders’ fuel consumption and CO
2 eq emissions, the values reported per product volume are under the ranges of values reported by similar studies [
19,
20]. In the comparing studies the fuel consumed per product unit and the fuel consumed per hour of productive time are higher than in this research, achieving, in those cases values of 1.18 L/m
3 and 17.36 L/h in one case and 0.45 L/m
3 and 18 L/h. However, the higher fuel consumption values are justified due to the different characteristics of the harvesting operation (extraction distance higher than 2 km) or due to the different harvesting machines’ characteristics used in those cases (more than 200 kWh in comparison with approx. 150 kWh of the forwarders studied in this case).
Regarding the CO2 emission, in the case of the forwarders, 24.2 kg CO2 eq./h and 30.67 kg CO2 eq./h were estimated per productive working hour. As for the emissions related to the production unit, 0.49 kg CO2 eq./m3 and 0.42 kg CO2 eq./m3 were estimated in the case of the forwarders (F1 and F2, respectively).
In this case, the number of studies related to forwarder performance parameters and their interaction with stand characteristics was higher than for harvesters. Also, in the case of the forwarders, the working cycles and their different parts have been studied in more depth in similar studies, and their results, to a large extent, coincide with those of this study.
5. Conclusions
The fleet management system integrated with GIS analysis and the use of coding software like R coreTM 2021, in this case, has proven to be an exceptionally useful tool able to improve the decision-making process, both for forest managers and forest contractors. In fact, both data collection and analysis process showed is an easy-to-use tool to evaluate the forest machines. In addition, the implementation of this approach allows for the detection of not only the possible weaknesses when a CTL system is performed, and its consequent decrease in productivity and efficiency terms, but it also allows to quantify those decreases and to detect in which part of the system they may occur.
Moreover, this approach is fundamental to achieve a higher sustainability and lower environmental impacts in forest operations through the possibility to design beforehand the best operational plan of the harvesting process and reduce in this way the emissions and the environmental impact (soil degradation, GHG emissions and vegetation damage among others).
In this study, it has been possible to detect, for example, that comparing to other similar studies, the fuel consumption rates according to the harvesting operation (thinning or final felling) was higher when final felling harvesting operations were performed. Moreover, this variation is a consequence of higher fuel rates while performing those operations compared with performing thinning operations. Also, the time share of the most fuel consuming work elements increases in the case of final felling.
However, there is still a knowledge gap related to the way in which the different aspects involved in forest operations management interact with each other. Factors such as those related to the forest stand, environmental and terrain conditions, or the characteristics of the various machines used, play a fundamental role in improving forest management and therefore forest ecosystems. Even though these factors have been studied over the years from various points of view, it is essential to also analyze the interaction that takes place between these factors and how these interactions and the variations in the values of the different parameters affect the development of forestry operations. The availability of geospatial information related to forest plan can substantially give historical information of the forest structure. This information merged with timber harvesting operations can lead to a quantification of the impact of forest operations.
In addition, data from fully mechanized harvesting systems proves to give the possibility to completely and easily collect the log data and related forest machine emission from the forest to the landing point. Although, in order to increase the accuracy of the data, the data acquiring process has to be performed at a higher frequency (shorter time between sampling) and/or the samples have to contain more information regarding the working parameters. In order to achieve this, a time study using video records and analysis, is usually performed; however, this method is not feasible in the case of studies that consider a wilder variation on the parameters that influence harvesting operation, due to the broad period of time covered by them. Further study needs to show the implication of the use of this data in order to better understand the environmental impact, in term carbon balance, of the wood extracted. Furthermore, sensorization of a non-fully mechanized system can substantially improve both data acquisition and the elaboration process to easily quantify the environmental impact of timber harvesting operations using different harvesting systems.


 ,
, 


