
Renewable and Non-Renewable Energy Consumption on Economic Growth: Evidence from Asymmetric Analysis across Countries Connected to Eastern Africa Power Pool


Abstract
1. Introduction
2. Relative Studies in the Countries Connected at EAPP and EAPT
2.1. Review on the Total, Renewable, and Nonrenewable Energy-Growth Nexus
2.2. Review on Existing Estimation Approaches
3. Materials and Methods
3.1. Methodology
3.1.1. Mathematical Model
3.1.2. Cross-Sectional Dependence Test
3.1.3. Panel Pesaran CIPS Unit Root Test
3.1.4. Unit Root Tests
3.1.5. Panel Cointegration Test
3.1.6. Panel Common Correlated Effects Mean Group Estimator
3.1.7. The NARDL Estimator
3.1.8. Causality Test
3.2. Data
4. Results and Discussion
4.1. Cross-Sectional Dependence and Panel Unit Root Test Results
4.2. Unit Root Test Results
4.3. NARDL and CCEMG Estimates
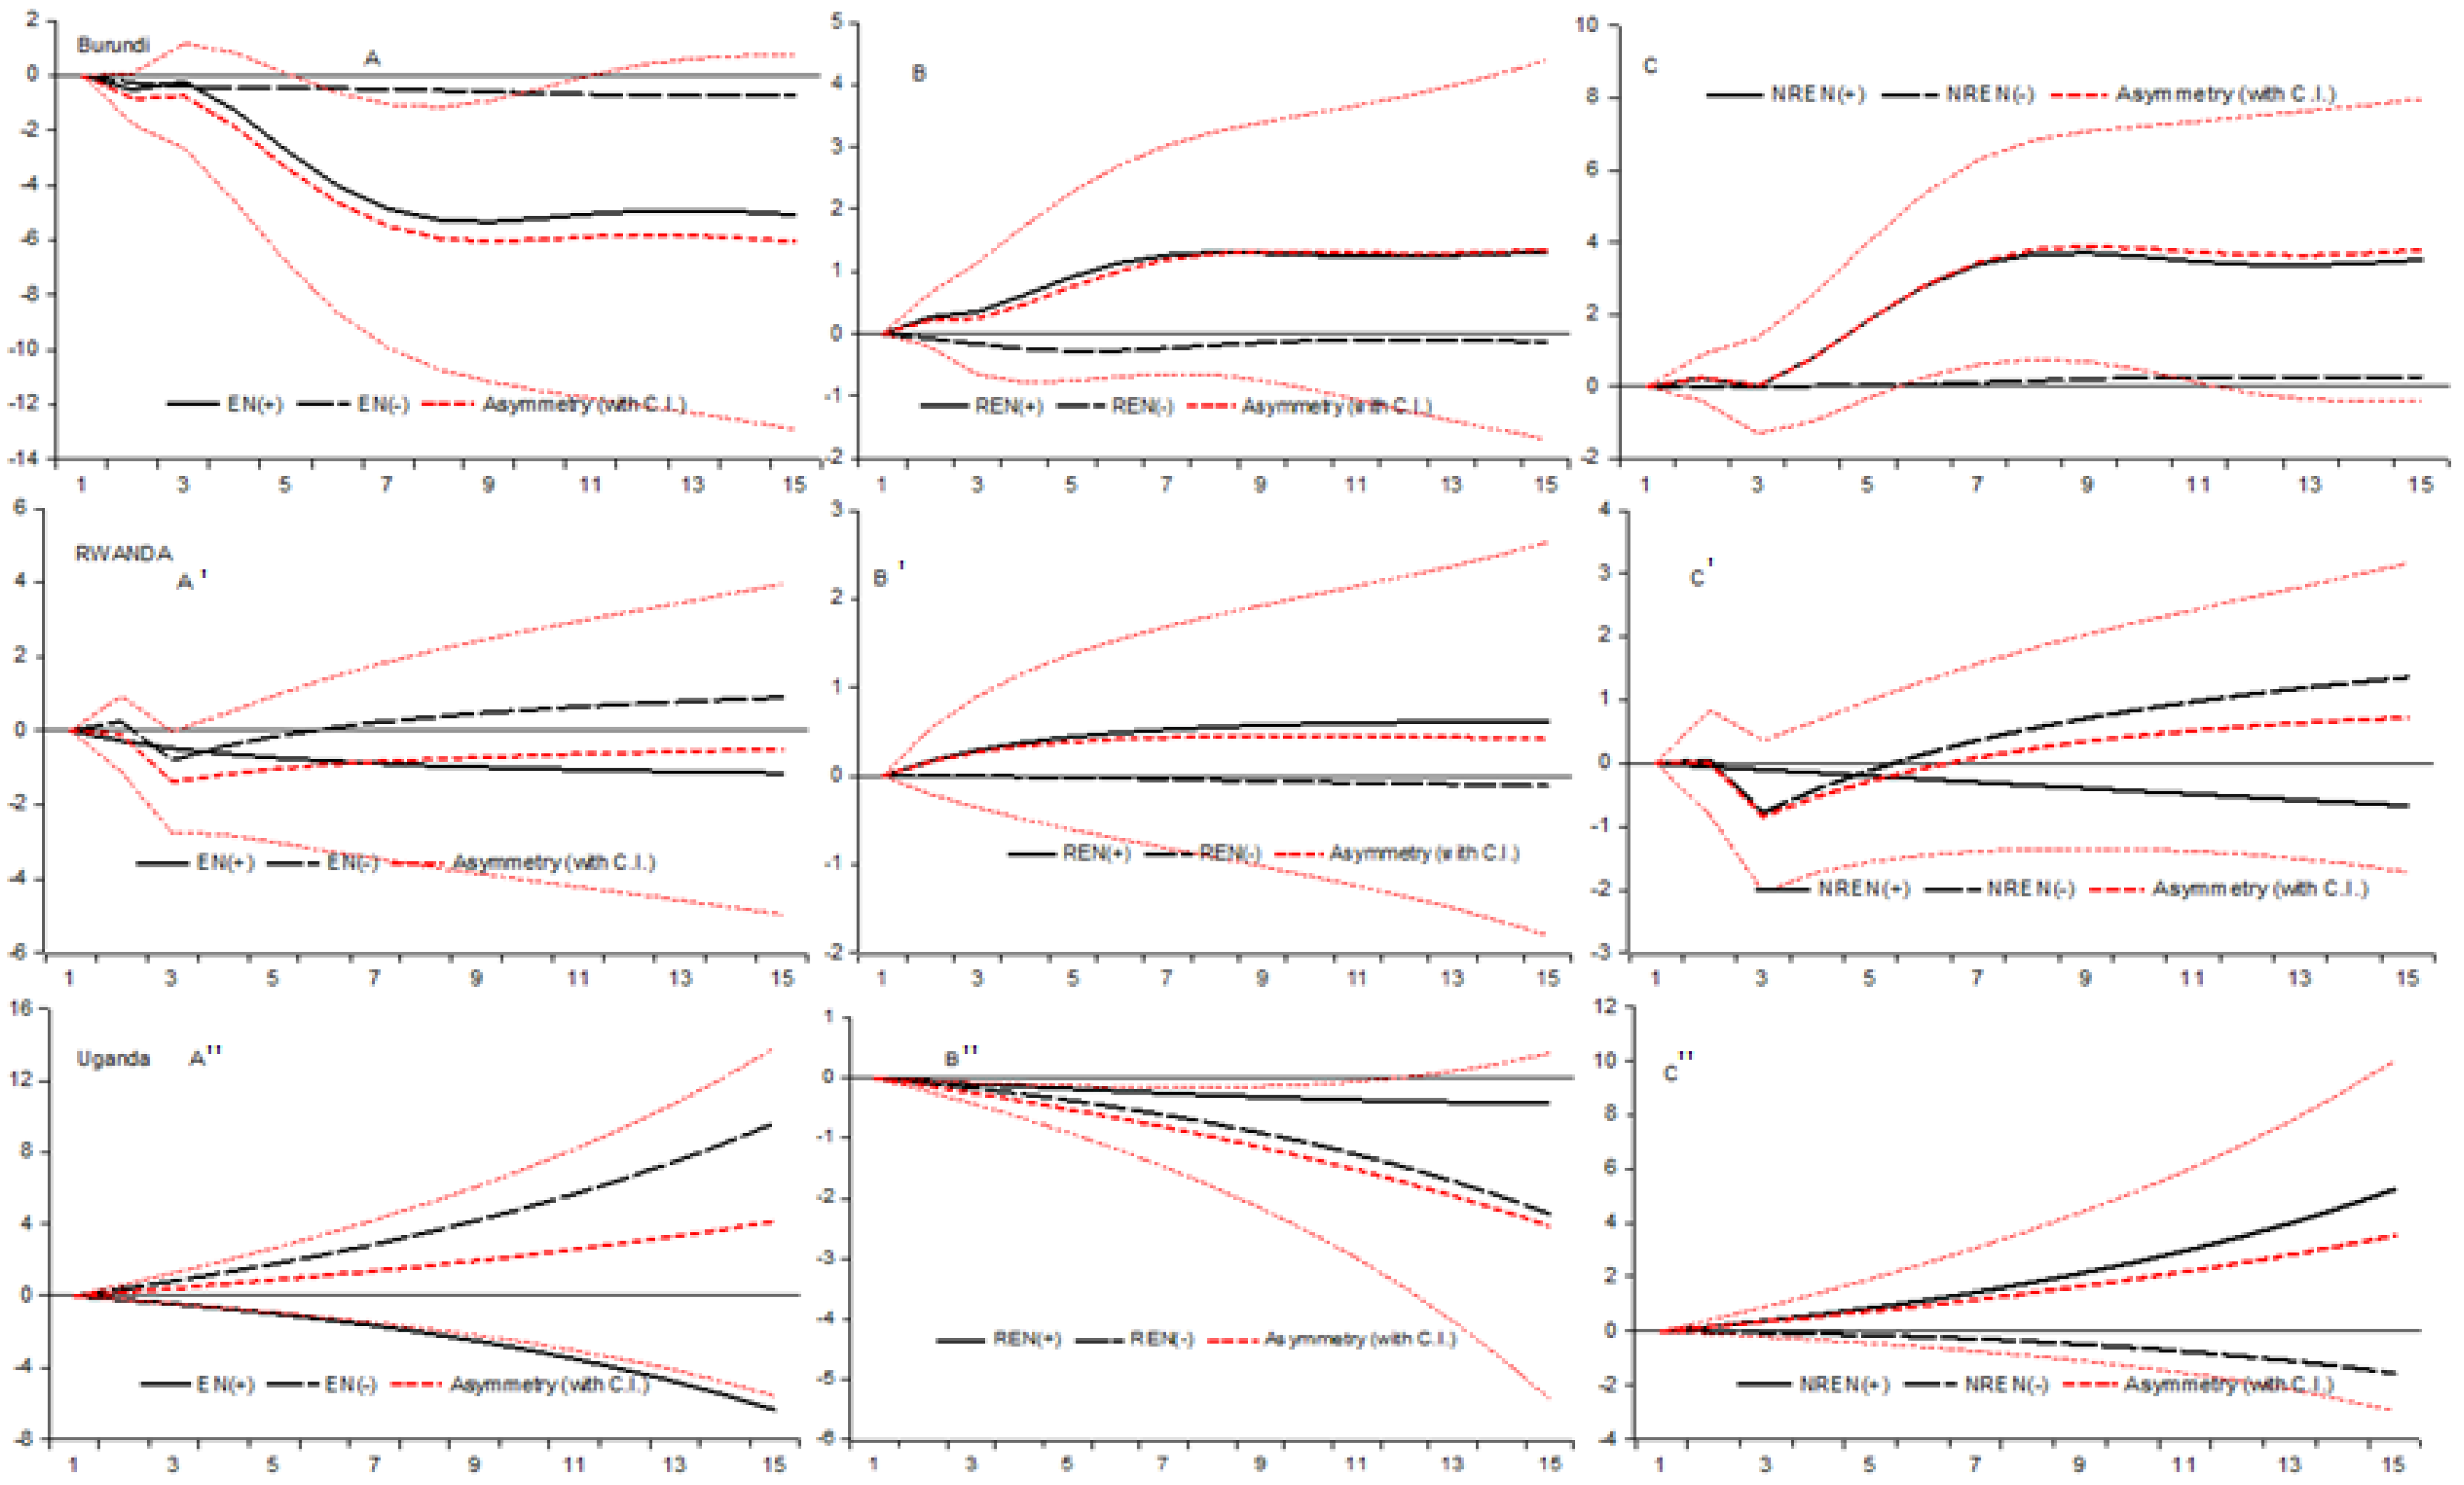
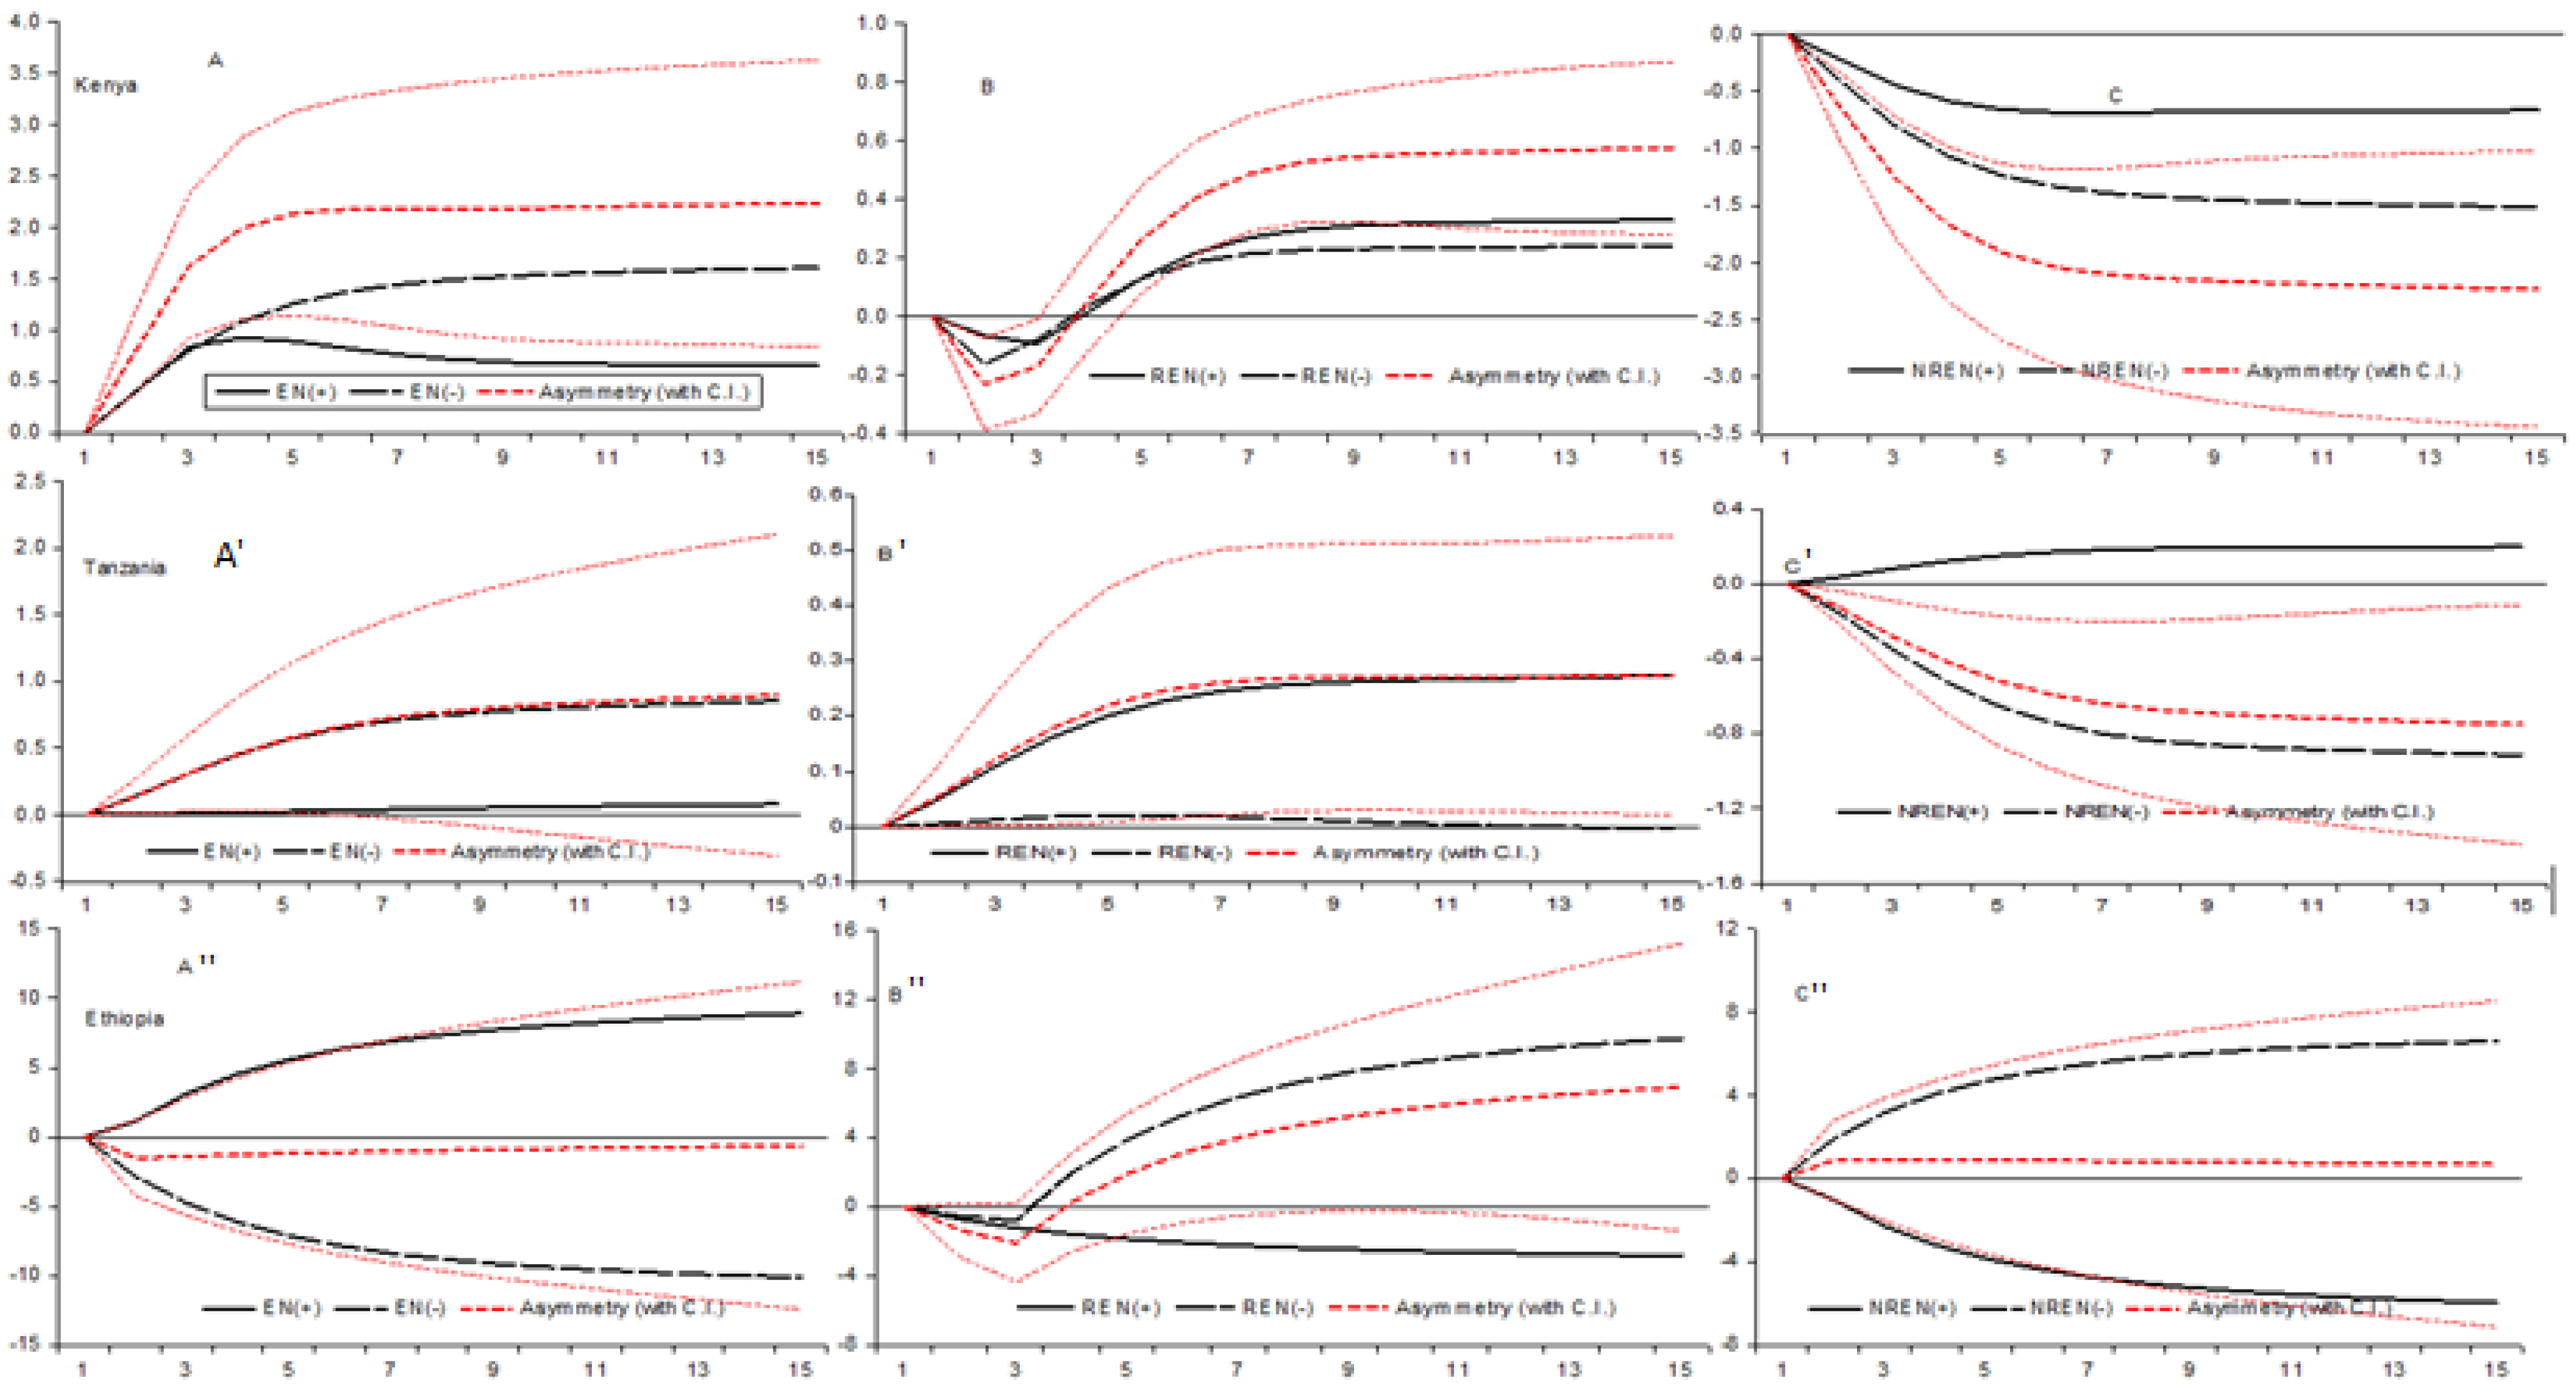
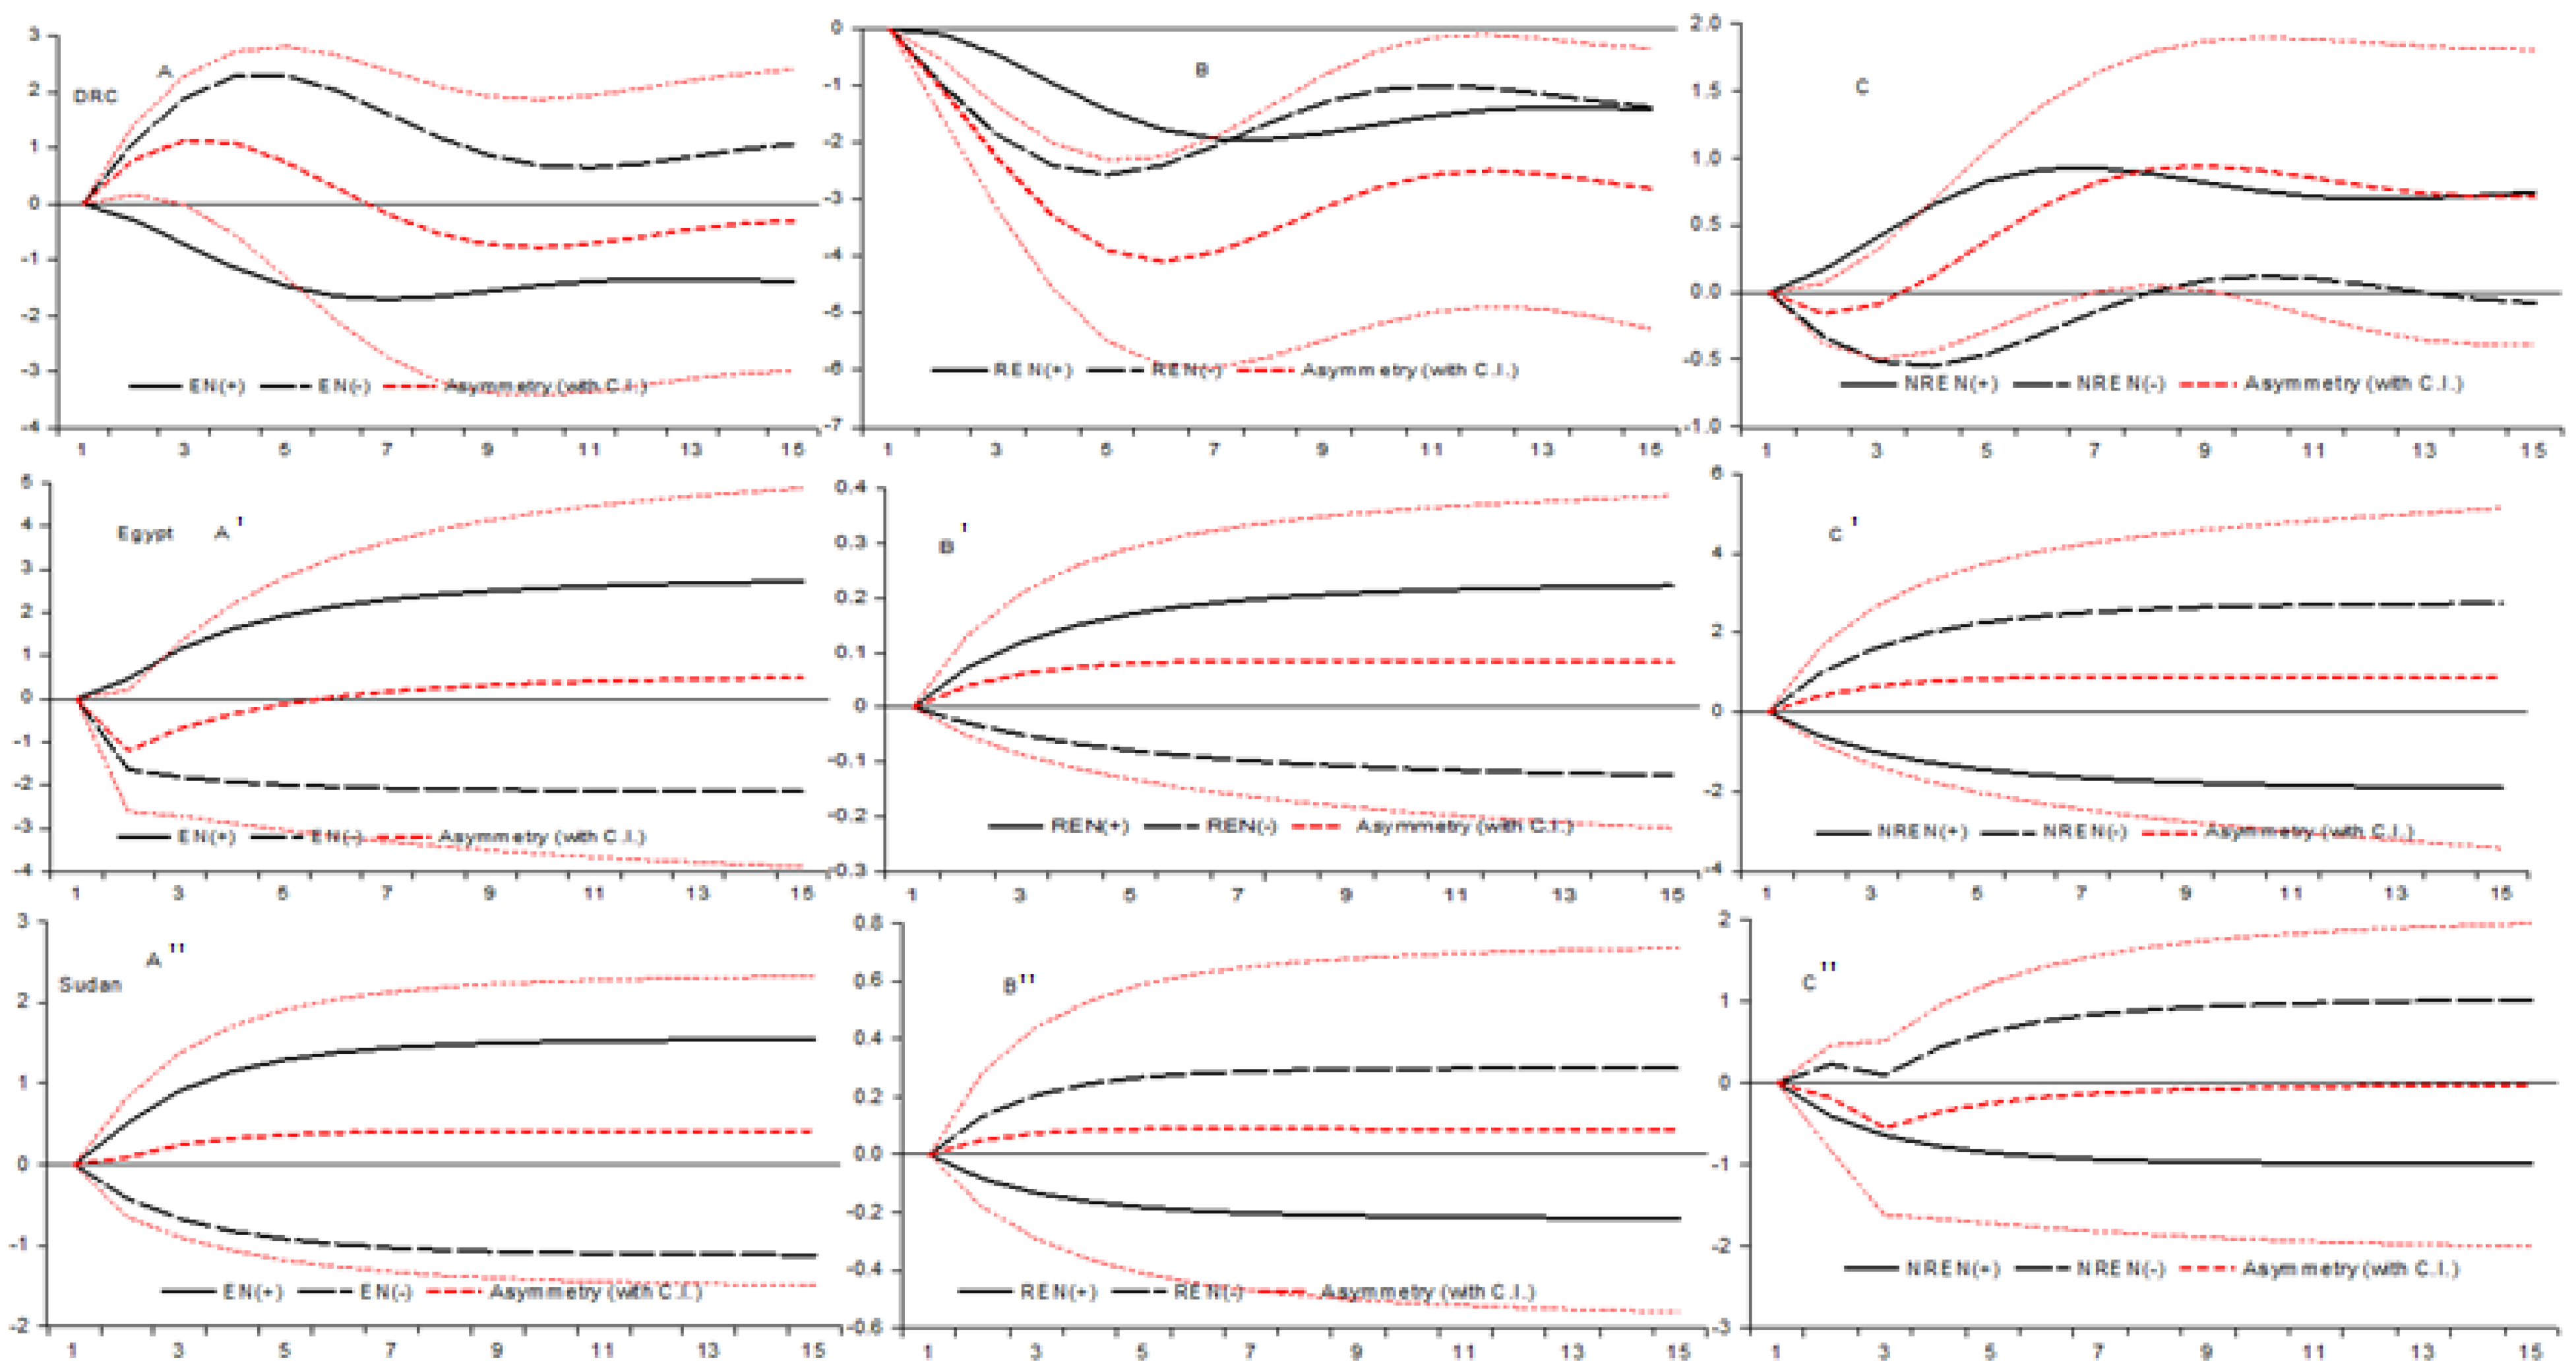
4.4. Long-Run and Short-Run Asymmetry and Symmetry Restrictions
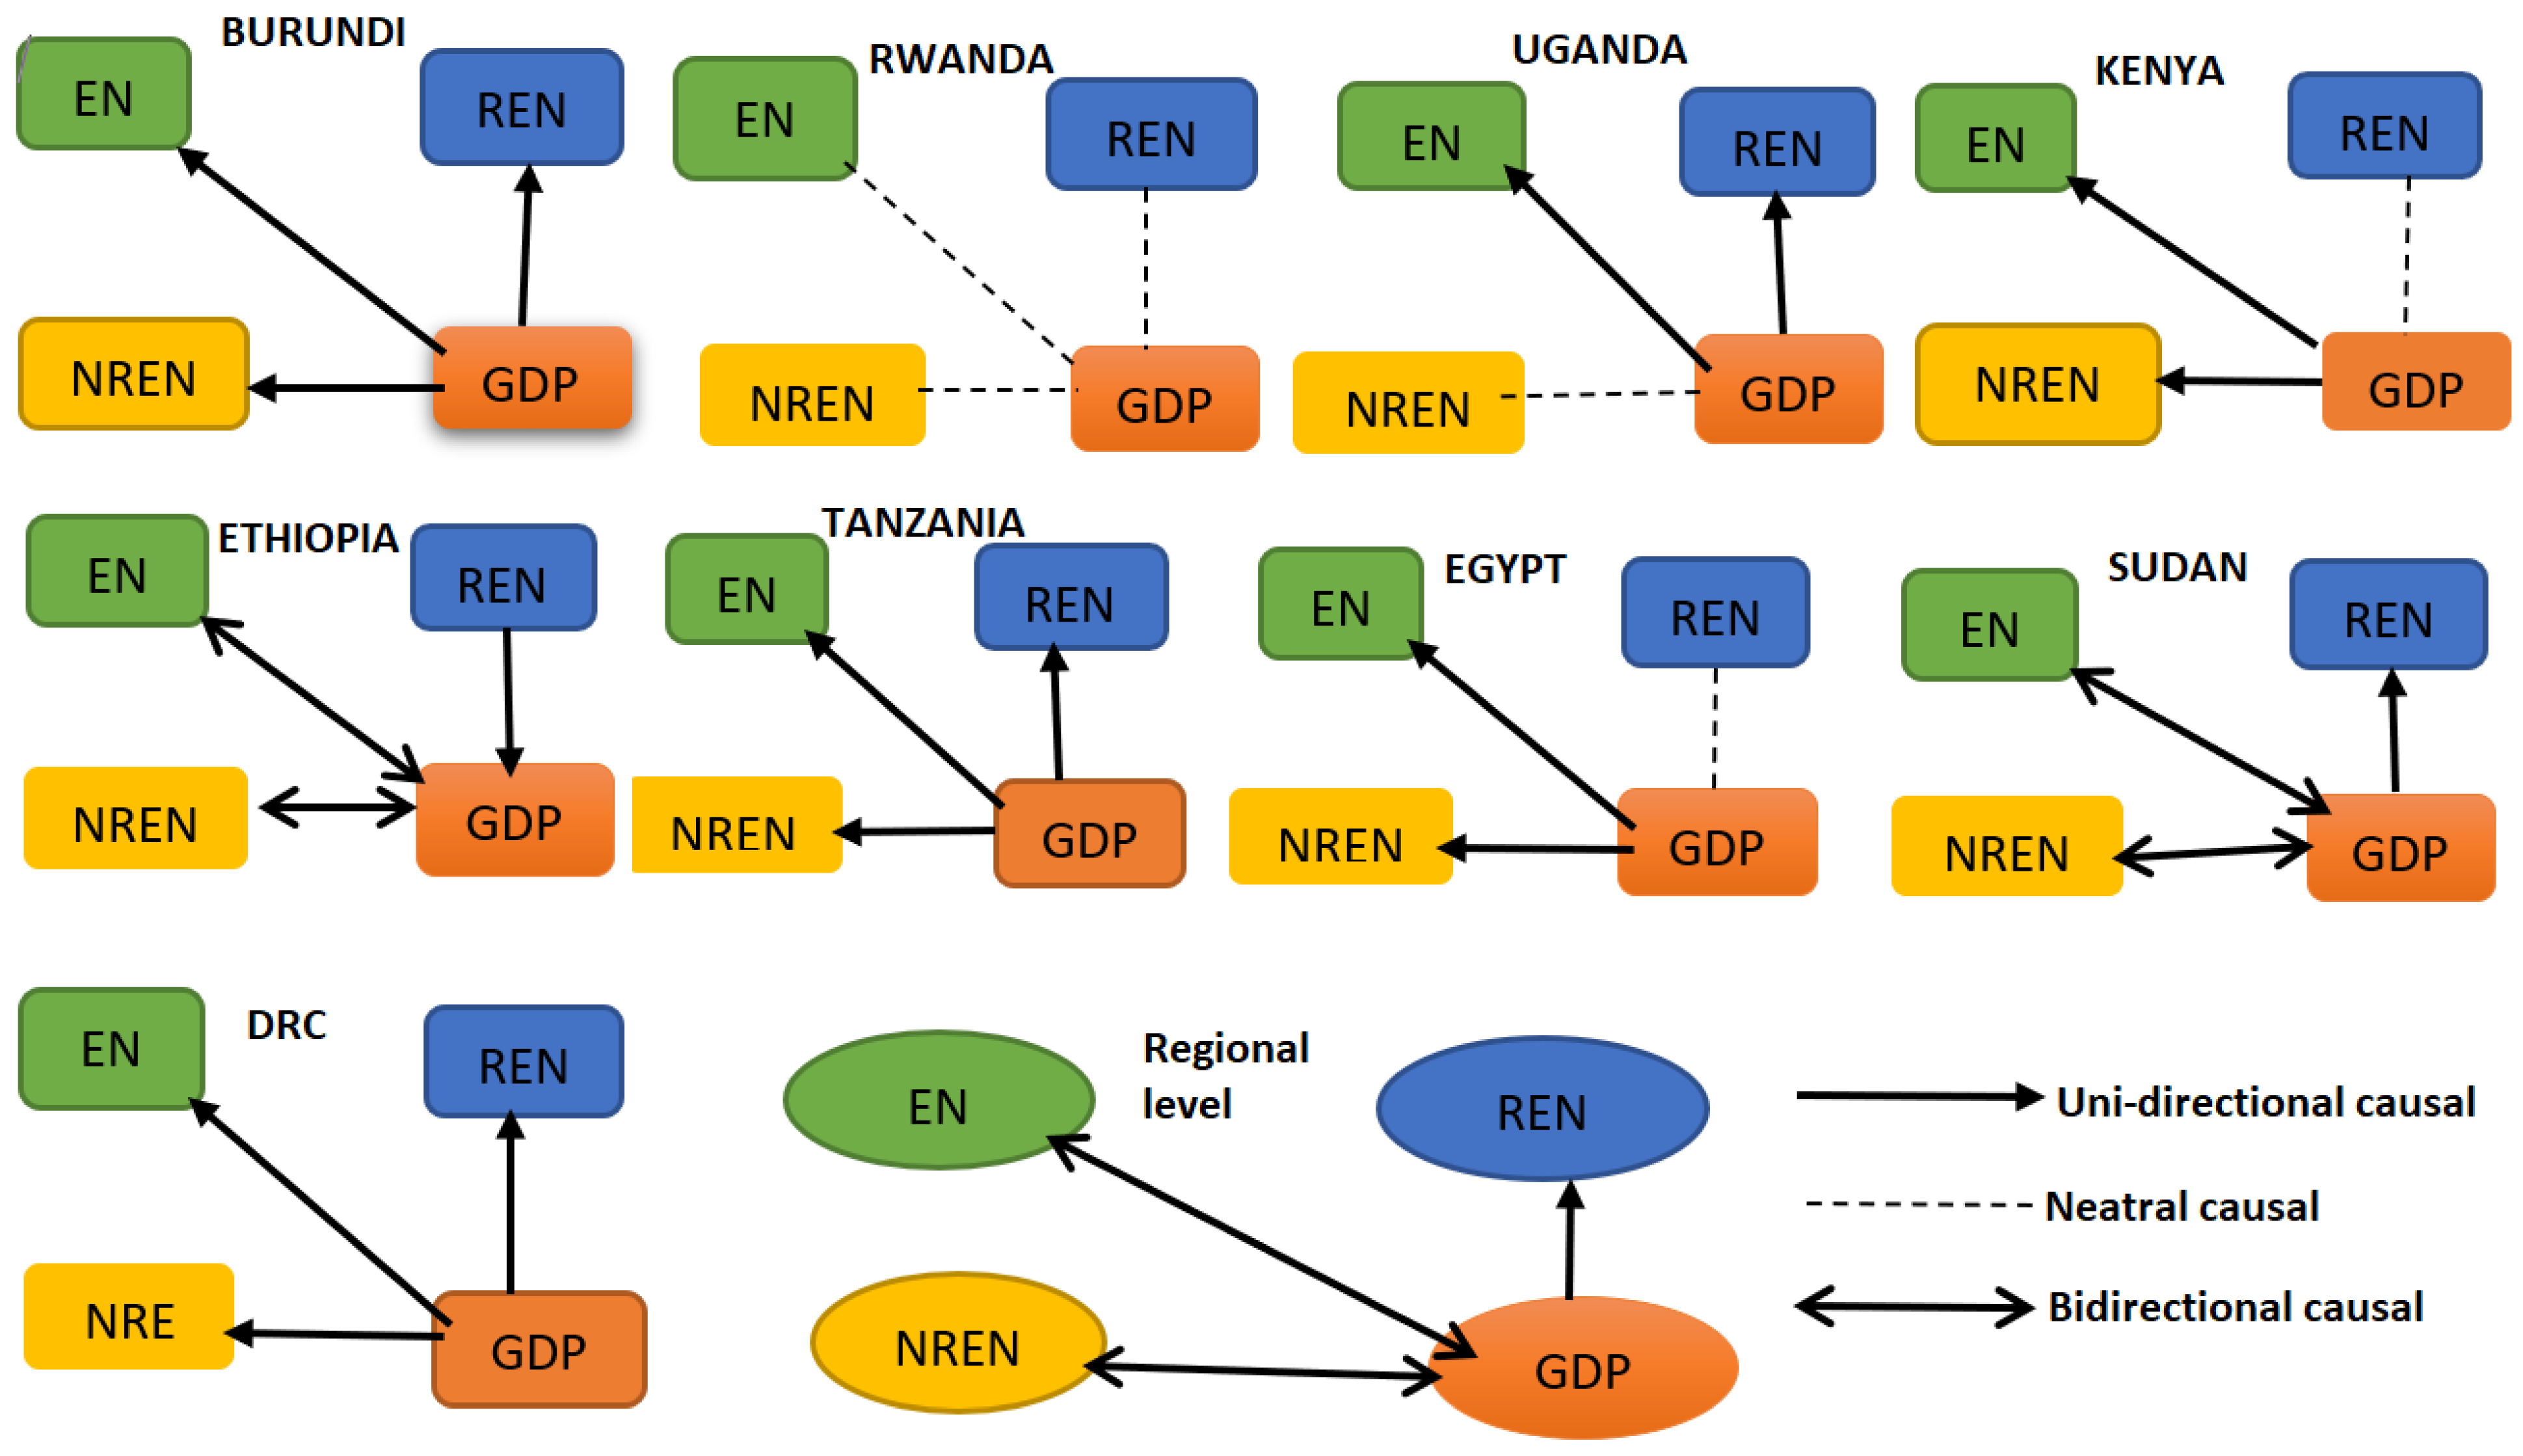
4.5. Causality
5. Conclusions and Policy Implications
Author Contributions
Funding
Institutional Review Board Statement
Informed Consent Statement
Data Availability Statement
Conflicts of Interest
Appendix A

| Country | GDP | Total Energy | Renewable Energy | Nonrenewable Energy | Labor | Capital |
|---|---|---|---|---|---|---|
| Burundi | NA | |||||
| Rwanda | ||||||
| Uganda | ||||||
| Kenya | ||||||
| Tanzania | NA | |||||
| Ethiopia | NA | |||||
| Egypt | ||||||
| Sudan | ||||||
| DRC | NA | |||||
| South Sudan | NA | NA | NA | NA | NA | NA |
| Somalia | NA | NA | NA | |||
| Eritrea | NA | NA | NA | NA | NA | |
| Time period | 1980–2017 | 1980–2017 | 1980–2017 | 1980–2017 | 1990–2017 | 1980–2017 |
| Database | World Bank | EIA | EIA | EIA | World Bank | World Bank |
References
- Kalitsi, E.A.K. Problems and prospects for hydropower development in Africa. In Proceedings of the Workshop for African Energy Experts on Operationalizing the NGPAD Energy Initiative, Dakar, Senegal, 2–4 June 2003; pp. 2–4. [Google Scholar]
- World Bank. Power Trade in Africa; World Bank: Washington, DC, USA, 2018. [Google Scholar]
- Al-Mulali, U.; Sab, C.N.B.C. The impact of energy consumption and CO2 emission on the economic growth and financial development in the Sub Saharan African countries. Energy 2012, 39, 180–186. [Google Scholar] [CrossRef]
- Azam, M. Does environmental degradation shackle economic growth? A panel data investigation on 11 Asian countries. Renew. Sustain. Energy Rev. 2016, 65, 175–182. [Google Scholar] [CrossRef]
- Azam, M.; Abdullah, H. Dynamic links among tourism, energy consumption, and economic growth: Empirical evidences from top tourist destination countries in Asia. J. Public Aff. 2021, 22, e2629. [Google Scholar] [CrossRef]
- Azam, M. Governance and economic growth: Evidence from 14 Latin America and Caribbean countries. J. Knowl. Econ. 2022, 13, 1470–1495. [Google Scholar] [CrossRef]
- Ghali, K.H.; El-Sakka, M.I.T. Energy use and output growth in Canada: A multivariate cointegration analysis. Energy Econ. 2004, 26, 225–228. [Google Scholar] [CrossRef]
- Squalli, J. Electricity consumption and economic growth: Bounds and causality analyses of OPEC members. Energy Econ. 2007, 29, 1192–1205. [Google Scholar] [CrossRef]
- Wolde-Rufael, Y. Energy demand and economic growth: The African experience. J. Policy Model 2005, 27, 891–903. [Google Scholar] [CrossRef]
- Khan, I.; Hou, F.; Zakari, A.; Tawiah, V.K. The dynamic links among energy transitions, energy consumption, and sustainable economic growth: A novel framework for IEA countries. Energy 2021, 222, 119935. [Google Scholar] [CrossRef]
- Ivanovski, K.; Hailemariam, A.; Smyth, R. The effect of renewable and non-renewable energy consumption on economic growth: Non-parametric evidence. J. Clean. Prod. 2021, 286, 124956. [Google Scholar] [CrossRef]
- Mahalik, M.K.; Mallick, H.; Padhan, H. Do educational levels influence the environmental quality? The role of renewable and non-renewable energy demand in selected BRICS countries with a new policy perspective. Renew. Energy 2021, 164, 419–432. [Google Scholar] [CrossRef]
- Hashemizadeh, A.; Bui, Q.; Zaidi, S.A.H. A blend of renewable and nonrenewable energy consumption in G-7 countries: The role of disaggregate energy in human development. Energy 2022, 241, 122520. [Google Scholar] [CrossRef]
- Tugcu, C.T.; Ozturk, I.; Aslan, A. Renewable and non-renewable energy consumption and economic growth relationship revisited: Evidence from G7 countries. Energy Econ. 2012, 34, 1942–1950. [Google Scholar] [CrossRef]
- Ullah, A.; Ahmed, M.; Raza, S.A.; Ali, S. A threshold approach to sustainable development: Nonlinear relationship between renewable energy consumption, natural resource rent, and ecological footprint. J. Environ. Manag. 2021, 295, 113073. [Google Scholar] [CrossRef]
- Karimi, M.S.; Ahmad, S.; Karamelikli, H.; Dinç, D.T.; Khan, Y.A.; Sabzehei, M.T.; Abbas, S.Z. Dynamic linkages between renewable energy, carbon emissions and economic growth through nonlinear ARDL approach: Evidence from Iran. PLoS ONE 2021, 16, e0253464. [Google Scholar]
- Xie, F.; Zhang, B.; Wang, N. Non-linear relationship between energy consumption transition and green total factor productivity: A perspective on different technology paths. Sustain. Prod. Consum. 2021, 28, 91–104. [Google Scholar] [CrossRef]
- Akadiri, S.S.; Adebayo, T.S. Asymmetric nexus among financial globalization, non-renewable energy, renewable energy use, economic growth, and carbon emissions: Impact on environmental sustainability targets in India. Environ. Sci. Pollut. Res. 2021, 29, 1–13. [Google Scholar] [CrossRef]
- Akram, R.; Umar, M.; Xiaoli, G.; Chen, F. Dynamic linkages between energy efficiency, renewable energy along with economic growth and carbon emission. A case of MINT countries an asymmetric analysis. Energy Rep. 2022, 8, 2119–2130. [Google Scholar] [CrossRef]
- Bibi, A.; Li, X.M. The asymmetric dilemma of renewable energy, financial development, and economic growth: Fresh evidence from Pakistan. Environ. Sci. Pollut. Res. 2022, 29, 31797–31806. [Google Scholar] [CrossRef]
- Remy, T.; Chattopadhyay, D. Promoting better economics, renewables and CO2 reduction through trade: A case study for the Eastern Africa Power Pool. Energy Sustain. Dev. 2020, 57, 81–97. [Google Scholar] [CrossRef]
- Eastern Africa Power Pool. EAPP Regional Power System Master Plan-Volume I: Main Report. 2014. Available online: https://www.ea-energianalyse.dk/wp-content/uploads/2020/02/1332_eapp_master_plan_2014_volume_1_main_report.pdf (accessed on 7 December 2022).
- Odhiambo, N.M. Energy consumption, prices and economic growth in three SSA countries: A comparative study. Energy Policy 2010, 38, 2463–2469. [Google Scholar] [CrossRef]
- Ozturk, I.; Bilgili, F. Economic growth and biomass consumption nexus: Dynamic panel analysis for Sub-Sahara African countries. Appl. Energy 2015, 137, 110–116. [Google Scholar] [CrossRef]
- Safari, B. A review of energy in Rwanda. Renew. Sustain. Energy Rev. 2010, 14, 524–529. [Google Scholar] [CrossRef]
- Safari, B. Modeling wind speed and wind power distributions in Rwanda. Renew. Sustain. Energy Rev. 2011, 15, 925–935. [Google Scholar] [CrossRef]
- Guta, D.D. Assessment of biomass fuel resource potential and utilization in Ethiopia: Sourcing strategies for renewable energies. Int. J. Renew. Energy Res. 2012, 2, 131–139. [Google Scholar]
- Sheya, M.S.; Mushi, S.J.S. The state of renewable energy harnessing in Tanzania. Appl. Energy 2000, 65, 257–271. [Google Scholar] [CrossRef]
- Aliyu, A.K.; Modu, B.; Tan, C.W. A review of renewable energy development in Africa: A focus in South Africa, Egypt and Nigeria. Renew. Sustain. Energy Rev. 2018, 81, 2502–2518. [Google Scholar] [CrossRef]
- Adams, S.; Klobodu, E.K.M.; Apio, A. Renewable and non-renewable energy, regime type and economic growth. Renew. Energy 2018, 125, 755–767. [Google Scholar] [CrossRef]
- Onuonga, S.M. The relationship between commercial energy consumption and gross domestic income in Kenya. J. Dev. Areas 2012, 46, 305–314. [Google Scholar] [CrossRef]
- Kebede, S. Modeling energy consumption, CO2 emissions and economic growth nexus in Ethiopia: Evidence from ARDL approach to cointegration and causality analysis. Munich Pers. RePEc Arch. 2017, 1–26. [Google Scholar]
- Sekantsi, L.P.; Okot, N. Electricity consumption–economic growth nexus in Uganda. Energy Sources Part B Econ. Plan. Policy 2016, 11, 1144–1149. [Google Scholar] [CrossRef]
- Musau, M.P.; Odero, N.A.; Wekesa, C.W. Asynchronous interconnection of the proposed East Africa power pool (EAPP). In 2017 IEEE PES Power Africa; IEEE: Piscataway, NJ, USA, 2017; pp. 7–11. [Google Scholar]
- Kammen, D.M.; Jacome, V.; Avila, N. A Clean Energy Vision for East Africa. 2015. Available online: https://rael.berkeley.edu/wp-content/uploads/2015/03/Kammen-et-al-A-Clean-Energy-Vision-for-the-EAPP.pdf (accessed on 7 December 2022).
- U.S. Energy Information Administration (EIA); U.S. Energy Information Administration (EIA): Washington, DC, USA, 2016.
- Atinafu, W. Energy Consumption and Economic Growth in Ethiopia: Evidence from ARDL Bound Test Approach. Dyn. Econom. Model 2019, 19, 57–85. [Google Scholar] [CrossRef]
- Elfaki, K.E.; Poernomo, A.; Anwar, N.; Ahmad, A.A. Energy consumption and economic growth: Empirical evidence for Sudan. Int. J. Energy Econ. Policy 2018, 8, 35. [Google Scholar]
- Hajko, V. The failure of Energy-Economy Nexus: A meta-analysis of 104 studies. Energy 2017, 125, 771–787. [Google Scholar] [CrossRef]
- Shin, Y.; Yu, B.; Greenwood-Nimmo, M. Modelling asymmetric cointegration and dynamic multipliers in an ARDL framework. Int. Conf. Appl. Econ. Time Ser. Econom. 2009, 1–35. [Google Scholar]
- Hatemi-j, A. Asymmetric causality tests with an application. Empir. Econ. 2012, 43, 447–456. [Google Scholar] [CrossRef]
- Pesaran, M.H. Estimation and inference in large heterogeneous panels with a multifactor error structure. Econometrica 2006, 74, 967–1012. [Google Scholar] [CrossRef]
- Chudik, A.; Pesaran, M.H. Common correlated effects estimation of heterogeneous dynamic panel data models with weakly exogenous regressors. J. Econom. 2015, 188, 393–420. [Google Scholar] [CrossRef]
- Bildirici, M.; Ersin, Ö. An investigation of the relationship between the biomass energy consumption, economic growth and oil prices. Procedia-Soc. Behav. Sci. 2015, 210, 203–212. [Google Scholar] [CrossRef]
- Ersin, Ö.Ö. The nonlinear relationship of environmental degradation and income for the 1870–2011 period in selected developed countries: The dynamic panel-STAR approach. Procedia Econ. Financ. 2016, 38, 318–339. [Google Scholar] [CrossRef]
- Bildirici, M.; Ersin, Ö.Ö. Economic growth and CO2 emissions: An investigation with smooth transition autoregressive distributed lag models for the 1800–2014 period in the USA. Environ. Sci. Pollut. Res. 2018, 25, 200–219. [Google Scholar] [CrossRef]
- Bildirici, M.; Ersin, Ö. Markov-switching vector autoregressive neural networks and sensitivity analysis of environment, economic growth and petrol prices. Environ. Sci. Pollut. Res. 2018, 25, 31630–31655. [Google Scholar] [CrossRef] [PubMed]
- Ersin, Ö.; Bildirici, M. Asymmetry in the environmental pollution, economic development and petrol price relationship: MRS-VAR and nonlinear causality analyses. Rom. J. Econ. Forecast. 2019, 3, 25–50. [Google Scholar]
- Tugcu, C.T.; Topcu, M. Total, renewable and non-renewable energy consumption and economic growth: Revisiting the issue with an asymmetric point of view. Energy 2018, 152, 64–74. [Google Scholar] [CrossRef]
- Ndoricimpa, A. Analysis of asymmetries in the nexus among energy use, pollution emissions and real output in South Africa. Energy 2015, 125, 543–551. [Google Scholar] [CrossRef]
- Shahbaz, M.; Van Hoang, T.H.; Mahalik, M.K.; Roubaud, D. Energy consumption, financial development and economic growth in India: New evidence from a nonlinear and asymmetric analysis. Energy Econ. 2017, 67, 199–212. [Google Scholar] [CrossRef]
- Bildirici, M.; Ozaksoy, F. The relationship between woody biomass consumption and economic growth: Nonlinear ARDL and causality. J. For. Econ. 2017, 27, 60–69. [Google Scholar] [CrossRef]
- Odhiambo, N.M. Energy consumption and economic growth nexus in Tanzania: An ARDL bounds testing approach. Energy Policy 2009, 37, 617–622. [Google Scholar] [CrossRef]
- Aïssa, M.S.B.; Jebli, M.B.; Youssef, S.B. Output, renewable energy consumption and trade in Africa. Energy Policy 2014, 66, 11–18. [Google Scholar] [CrossRef]
- Breitung, J. A parametric approach to the estimation of cointegration vectors in panel data. Econom. Rev. 2005, 24, 151–173. [Google Scholar] [CrossRef]
- Mustapha, A.M.; Fagge, A.M. Energy consumption and economic growth in Nigeria: A causality analysis. J. Econ. Sustain. Dev. 2015, 6, 13. [Google Scholar]
- Goldin, K.D. Economic Growth and the Individual. J. Financ. 1996, 21, 550. [Google Scholar] [CrossRef]
- Nyasha, S.; Gwenhure, Y.; Odhiambo, N.M. Energy consumption and economic growth in Ethiopia: A dynamic causal linkage. Energy Environ. 2018, 29, 1393–1412. [Google Scholar] [CrossRef]
- Pesaran, H.M. General diagnostic tests for cross-sectional dependence in panels. Empir. Econ. 2021, 60, 13–50. [Google Scholar] [CrossRef]
- Breusch, T.S.; Pagan, A.R. The Lagrange multiplier test and its applications to model specification in econometrics. Rev. Econ. Stud. 1980, 47, 239–253. [Google Scholar] [CrossRef]
- Pesaran, M.H. A simple panel unit root test in the presence of cross-section dependence. J. Appl. Econom. 2007, 22, 265–312. [Google Scholar] [CrossRef]
- Dickey, D.A.; Fuller, W.A. Distribution of the estimators for autoregressive time series with a unit root. J. Am. Stat. Assoc. Vpl. 1979, 74, 427–431. [Google Scholar]
- Phillips, P.C.B.; Perron, P. Testing for a unit root in time series regression. Biometrika 1988, 75, 335–346. [Google Scholar] [CrossRef]
- Kwiatkowski, D.; Phillips, P.C.B.; Schmidt, P.; Shin, Y. Testing the null hypothesis of stationarity against the alternative of a unit root. J. Econom. 1992, 54, 159–178. [Google Scholar] [CrossRef]
- Westerlund, J. New simple tests for panel cointegration. Econom. Rev. 2005, 24, 297–316. [Google Scholar] [CrossRef]
- Kapetanios, G.; Pesaran, M.H.; Yamagata, T. Panels with non-stationary multifactor error structures. J. Econom. 2011, 160, 326–348. [Google Scholar] [CrossRef]
- Shin, Y.; Yu, B.; Greenwood-Nimmo, M. Modelling Asymmetric Cointegration and Dynamic Multipliers in a Nonlinear ARDL Framework. SSRN Electron. J. 2012, 1–61. [Google Scholar] [CrossRef]
- Toda, H.Y.; Yamamoto, T. Statistical inference in vector autoregressions with possibly integrated processes. J. Econom. 1995, 66, 225–250. [Google Scholar] [CrossRef]
- Hasan, M.A.; Nahiduzzaman, K.M.; Aldosary, A.S.; Hewage, K.; Sadiq, R. Nexus of economic growth, energy consumption, FDI and emissions: A tale of Bangladesh. Environ. Dev. Sustain. 2022, 24, 6327–6348. [Google Scholar] [CrossRef]
- Wang, Q.; Dong, Z.; Li, R.; Wang, L. Renewable energy and economic growth: New insight from country risks. Energy 2022, 238, 122018. [Google Scholar] [CrossRef]
- Kirikkaleli, D.; Güngör, H.; Adebayo, T.S. Consumption-based carbon emissions, renewable energy consumption, financial development and economic growth in Chile. Bus. Strategy Environ. 2022, 31, 1123–1137. [Google Scholar] [CrossRef]


| Authors | Country | Variables | Period | Methods | Findings |
|---|---|---|---|---|---|
| Odhiambo [23] | Kenya, DRC, and South Africa | EC, Price, and Y | 1972–2006 | ARDL | in SA and Kenya in DRC |
| Adams et al. [30] | 30 African countries | REC, NREC, and Y | 1980–2012 | Panel co-integration and panel error correlation test | and |
| Onuonga [31] | Kenya | EC and Y | 1970–2005 | Granger causality error correlation model | |
| Kebede [32] | Ethiopia | EC, and Y | 1970–2014 | ARDL co-integration | |
| Sekantsi and Okot [33] | Uganda | Electricity consumption and Y | 1981–2013 | ARDL and Granger causality | |
| Atinafu [37] | EC and Y | 1970–2017 | ARDL and Granger causality | ||
| Elfaki et al. [38] | Sudan | EC and Y | 1984–2014 | ARDL | |
| Bildirici and Ozaksoy [52] | Kenya, Uganda, Djibouti, and others | Wood biomass EC and Y | 1980–2012 | ARDL, NARDL, Error correlation model | in Kenya, Uganda, and Djibouti |
| Odhiambo [54] | Tanzania | EC and Y | 1971–2006 | ARDL bound test | |
| Aïssa et al. [55] | Kenya, Sudan, Egypt, and 9 other countries | REC, Trade, and Y | 1980–2008 | Error correlation model | Link from REC, Trade to Y |
| Nyasha et al. [56] | EC and Y | 1971–2013 | ARDL bound test | ||
| Mustapha and Fagge [57] | EC, and Y with trade and Urbanization | 1981–2011 | Johansen Co-integration |
| Country | Variables | Mean | Median | Maximum | Minimum | Observations |
|---|---|---|---|---|---|---|
| Burundi | lnGDP | 2.414911 | 2.3799 | 2.527089 | 2.330696 | 38 |
| lnEN | 1.242604 | 1.203814 | 1.453165 | 0.959908 | 38 | |
| lnREN | 0.602462 | 0.661007 | 0.752427 | −0.07195 | 38 | |
| lnREN | 1.120452 | 1.048054 | 1.356696 | 0.856756 | 38 | |
| lnL | −0.25723 | −0.24889 | −0.20959 | −0.31042 | 38 | |
| Rwanda | lnGDP | 0.427906 | 0.409156 | 0.72953 | 0.025087 | 38 |
| lnEN | −0.70058 | −0.6724 | −0.55515 | −0.99402 | 38 | |
| lnREN | −1.52286 | −1.4769 | −1.23288 | −2.00983 | 38 | |
| lnNREN | −0.7754 | −0.7462 | −0.62926 | −1.19035 | 38 | |
| lnK | −0.58278 | −0.54923 | −0.2334 | −1.33501 | 38 | |
| lnL | −2.46679 | −2.46359 | −2.41668 | −2.53735 | 38 | |
| Uganda | lnGDP | 2.743079 | 2.728778 | 2.95917 | 2.555669 | 38 |
| lnEN | 1.558126 | 1.513388 | 1.824908 | 1.346607 | 38 | |
| lnREN | 1.123968 | 1.103224 | 1.367156 | 0.934682 | 38 | |
| lnNREN | 1.352566 | 1.296169 | 1.643233 | 1.110025 | 38 | |
| lnK | 2.003425 | 2.038926 | 2.296768 | 1.758725 | 38 | |
| lnL | −0.30522 | −0.30427 | −0.28533 | −0.31931 | 38 | |
| Kenya | lnGDP | 2.953017 | 2.941103 | 3.063118 | 2.908464 | 38 |
| lnEN | 2.114068 | 2.108665 | 2.214393 | 2.044065 | 38 | |
| lnREN | 1.478224 | 1.485208 | 1.620047 | 1.23363 | 38 | |
| lnNREN | 1.997074 | 1.992483 | 2.125412 | 1.89411 | 38 | |
| lnK | 2.010442 | 2.003707 | 2.19729 | 1.835265 | 38 | |
| lnL | −0.27611 | −0.27188 | −0.23751 | −0.31809 | 38 | |
| Tanzania | lnGDP | 2.767678 | 2.742504 | 2.958976 | 2.665763 | 38 |
| lnEN | 1.760297 | 1.728407 | 1.991711 | 1.588567 | 38 | |
| lnREN | 1.1398 | 1.14451 | 1.295736 | 0.940289 | 38 | |
| lnNREN | 1.628477 | 1.579389 | 1.943476 | 1.428206 | 38 | |
| lnL | −0.19567 | −0.1979 | −0.1834 | −0.20835 | 38 | |
| Ethiopia | lnGDP | 2.393282 | 2.34166 | 2.739113 | 2.215734 | 38 |
| lnEN | 1.487247 | 1.445094 | 1.884188 | 1.221362 | 38 | |
| lnREN | 0.912055 | 0.816717 | 1.475397 | 0.547298 | 38 | |
| lnNREN | 1.344155 | 1.338781 | 1.669426 | 1.003063 | 38 | |
| lnL | −0.22748 | −0.22881 | −0.20947 | −0.24426 | 38 | |
| Egypt | lnGDP | 3.2709 | 3.269952 | 3.449836 | 3.042303 | 38 |
| lnEN | 2.880352 | 2.859502 | 3.042183 | 2.618884 | 38 | |
| lnREN | 1.641184 | 1.622005 | 1.775799 | 1.571949 | 38 | |
| lnNREN | 2.852591 | 2.82866 | 3.026105 | 2.553172 | 38 | |
| lnL | −0.4292 | −0.436 | −0.39349 | −0.46237 | 38 | |
| lnK | 2.507552 | 2.489465 | 2.757632 | 2.259573 | 38 | |
| Sudan | lnGDP | 3.108232 | 3.068222 | 3.278775 | 2.959064 | 38 |
| lnEN | 2.068141 | 1.993109 | 2.371552 | 1.819885 | 38 | |
| lnREN | 1.21556 | 1.098499 | 1.752485 | 0.953638 | 38 | |
| lnNREN | 1.996725 | 1.934184 | 2.27393 | 1.746952 | 38 | |
| lnL | −0.42659 | −0.4293 | −0.39503 | −0.44962 | 38 | |
| lnK | 2.305357 | 2.321774 | 2.711999 | 1.851259 | 38 | |
| DRC | lnGDP | 2.655823 | 2.601255 | 2.926601 | 2.440997 | 38 |
| lnEN | 1.742462 | 1.720585 | 1.93306 | 1.566422 | 38 | |
| lnREN | 1.526374 | 1.492315 | 1.673456 | 1.415994 | 38 | |
| lnNREN | 1.312114 | 1.385171 | 1.635607 | 0.878733 | 38 | |
| lnL | −0.29376 | −0.29087 | −0.26645 | −0.32292 | 38 | |
| Regional level | lnGDP | 2.526092 | 2.71466 | 3.449836 | 0.025087 | 342 |
| lnEN | 1.572524 | 1.704322 | 3.042183 | −0.99402 | 342 | |
| lnREN | 0.901863 | 1.132654 | 1.775799 | −2.00983 | 342 | |
| lnNREN | 1.425418 | 1.52303 | 3.026105 | −1.19035 | 342 | |
| lnL | −0.54201 | −0.29678 | −0.1834 | −2.53735 | 342 | |
| lnK | 1.740628 | 2.063848 | 4.009741 | −1.33501 | 190 |
| Breusch-LM | Pesaran LM | Pesaran CD | |
|---|---|---|---|
| lnGDP | 726.492 * | 81.375 * | 11.405 * |
| lnEN | 455.679 * | 49.459 * | 49.338 * |
| lnREN | 265.370 * | 27.031 * | −1.130 |
| lnNREN | 421.190 * | 45.395 * | 4.296 * |
| lnL | 369.283 * | 39.062 * | 3.631 * |
| lnK | 239.021 * | 26.736 * | 2.329 |
| Levels | 1st Difference | Order | |||
|---|---|---|---|---|---|
| Variable | C | C-T | C | C-T | |
| lnGDP | −0.525 | −2.195 | −4.949 * | −4.86 3 * | I(1) |
| lnEN | −1.431 | −2.878 ** | −9.391 * | −8.874 * | I(0) |
| lnREN | −1.687 | −2.207 | −9.913 * | −9.071 * | I(1) |
| lnNREN | −1.482 | −2.841 ** | −8.759 * | −7.634 * | I(0) |
| lnL | −1.428 | −2.182 | −5.724 * | −5.487 * | I(1) |
| lnK | −2.172 | −3.834 ** | −7.478 * | −6.831 * | I(0) |
| Dependent | Test | Gt | Gα | Pt | Pα |
|---|---|---|---|---|---|
| lnGDP | Statistic | −1.694 | −4.575 | −8.761 * | −11.215 * |
| z-value | 0.044 | 1.554 | −3.670 | −3.299 | |
| Variance ratio | −2.182 ** |
| Country | Test | lnGDP | lnEN | lnREN | lnNREN | lnLab | lnK | ||||||
|---|---|---|---|---|---|---|---|---|---|---|---|---|---|
| C | C-T | C | C-T | C | C-T | C | C-T | C | C-T | C | C-T | ||
| Ethiopia | PP | I(1) | I(1) | I(1) | I(1) | I(1) | I(1) | I(1) | I(0) | I(1) | I(1) | NA | NA |
| ADF | I(1) | I(1) | I(1) | I(0) | I(1) | I(1) | I(1) | I(0) | I(0) | I(1) | NA | NA | |
| KPSS | I(0) | I(0) | I(0) | I(0) | I(0) | I(1) | I(0) | I(1) | I(1) | I(0) | NA | NA | |
| Tanzania | PP | I(1) | I(0) | I(0) | I(1) | I(1) | I(1) | I(1) | I(1) | I(1) | I(0) | NA | NA |
| ADF | I(1) | I(0) | I(0) | I(0) | I(1) | I(0) | I(1) | I(0) | I(1) | I(0) | NA | NA | |
| KPSS | I(0) | I(0) | I(0) | I(1) | I(1) | I(1) | I(0) | I(0) | I(1) | I(1) | NA | NA | |
| Sudan | PP | I(1) | I(1) | I(0) | I(0) | I(1) | I(1) | I(1) | I(1) | I(1) | I(0) | I(1) | I(1) |
| ADF | I(1) | I(1) | I(0) | I(0) | I(1) | I(1) | I(1) | I(1) | I(0) | I(1) | I(1) | I(1) | |
| KPSS | I(0) | I(1) | I(0) | I(0) | I(0) | I(0) | I(0) | I(0) | I(0) | I(1) | I(0) | I(0) | |
| Egypt | PP | I(1) | I(1) | I(1) | I(1) | I(0) | I(1) | I(1) | I(1) | I(0) | I(0) | I(0) | I(1) |
| ADF | I(1) | I(0) | I(1) | I(1) | I(0) | I(1) | I(1) | I(1) | I(1) | I(0) | I(0) | I(1) | |
| KPSS | I(1) | I(0) | I(0) | I(1) | I(1) | I(1) | I(1) | I(1) | I(1) | I(1) | I(1) | I(1) | |
| DRC | PP | I(0) | I(0) | I(0) | I(1) | I(1) | I(1) | I(1) | I(1) | I(1) | I(0) | NA | NA |
| ADF | I(0) | I(1) | I(1) | I(1) | I(1) | I(1) | I(1) | I(1) | I(1) | I(1) | NA | NA | |
| KPSS | I(0) | I(0) | I(0) | I(1) | I(1) | I(1) | I(1) | I(1) | I(1) | I(1) | NA | NA | |
| Kenya | PP | I(1) | I(1) | I(1) | I(1) | I(1) | I(1) | I(1) | I(1) | I(1) | I(0) | I(1) | I(1) |
| ADF | I(1) | I(1) | I(1) | I(1) | I(1) | I(1) | I(1) | I(1) | I(0) | I(1) | I(1) | I(1) | |
| KPSS | I(0) | I(0) | I(1) | I(1) | I(1) | I(1) | I(0) | I(1) | I(1) | I(1) | I(1) | I(0) | |
| Burundi | PP | I(0) | I(0) | I(0) | I(1) | I(1) | I(1) | I(1) | I(1) | I(0) | I(0) | NA | NA |
| ADF | I(0) | I(1) | I(1) | I(1) | I(1) | I(1) | I(1) | I(1) | I(1) | I(1) | NA | NA | |
| KPSS | I(0) | I(0) | I(0) | I(1) | I(1) | I(1) | I(1) | I(1) | I(1) | I(1) | NA | NA | |
| Rwanda | PP | I(1) | I(1) | I(1) | I(1) | I(1) | I(1) | I(1) | I(1) | I(1) | I(1) | I(1) | I(1) |
| ADF | I(1) | I(1) | I(1) | I(1) | I(1) | I(1) | I(1) | I(1) | I(1) | I(1) | I(1) | I(1) | |
| KPSS | I(0) | I(0) | I(1) | I(1) | I(1) | I(1) | I(0) | I(1) | I(1) | I(1) | I(1) | I(0) | |
| Uganda | PP | I(1) | I(1) | I(1) | I(1) | I(1) | I(1) | I(1) | I(1) | I(1) | I(1) | I(1) | I(1) |
| ADF | I(1) | I(1) | I(1) | I(1) | I(1) | I(1) | I(1) | I(1) | I(1) | I(1) | I(1) | I(1) | |
| KPSS | I(0) | I(0) | I(1) | I(1) | I(1) | I(1) | I(0) | I(1) | I(1) | I(1) | I(1) | I(0) | |
| Dependent: lnGDP | |||||||
|---|---|---|---|---|---|---|---|
| Variables | LnEN | LnREN | LnNREN | LnGDP.avg | lnEN.avg | lnREN.avg | LnNREN.avg |
| Estimates | 2.154 ** | 0.115 | −1.576 ** | 0.727 ** | −0.549 | 0.042 | 0.381 |
| p-value | 0.031 | 0.138 | 0.044 | 0.041 | 0.674 | 0.906 | 0.686 |
| Wald test | 8.11 ** | ||||||
| Dependent: lnGDP | ||||||||||
|---|---|---|---|---|---|---|---|---|---|---|
| Burundi | Rwanda | Uganda | Kenya | Tanzania | Ethiopia | DRC | Egypt | Sudan | ||
| lnEN | C | 0.586 ** | 0.187 | −0.167 | 0.893 * | 0.492 ** | 0.662 ** | 0.708 * | 1.058 * | 1.233 * |
| −0.255 ** | −0.247 ** | 0.036 | −0.302 * | −0.181 ** | −0.277 ** | −0.237 * | −0.338 * | −0.411 * | ||
| −1.252 ** | −0.297 | −0.195 | 0.239 ** | 0.004 ** | 2.326 | −0.282 | 0.839 | 0.635 | ||
| 0.076 | −0.135 ** | −0.399 | −0.416 | −0.132 | 2.740 | −0.228 ** | 0.788 | 0.440 | ||
| −1.709 * | - | - | −0.066 * | - | 1.148 | - | 0.451 | 0.515 | ||
| 0.243 | 1.152 ** | - | - | - | - | −1.071 ** | 1.649 | - | ||
| lnREN | 0.327 | 0.168 | −0.041 ** | 0.094 | 0.050 ** | −0.699 | −0.309 ** | 0.071 | −0.083 | |
| 0.071 | −0.002 | 0.080 | −0.076 | −0.005 | 2.519 ** | 0.351 | 0.030 | −0.130 | ||
| −0.295 ** | - | - | −0.123 * | - | - | −0.087 | - | - | ||
| - | - | - | - | - | 0.599 | 1.006 * | - | - | ||
| lnNREN | 0.878 | −0.049 | 0.177 *** | −0.234 ** | 0.037 | −1.525 | 0.172 | −0.571 | −0.413 | |
| −0.001 | −0.241 ** | 0.007 | 0.407 ** | 0.163 *** | −1.836 | 0.019 | −0.952 | −0.346 | ||
| −1.169 ** | - | - | - | - | −0.957 | - | - | - | ||
| - | 1.039 ** | - | - | - | - | 0.327 ** | - | 0.402 | ||
| lnL | −1.607 * | 2.305 * | 2.695 ** | 0.068 | 0.932 | 1.487 | −0.059 | 0.713 ** | 1.057 | |
| −0.676 * | 13.480 ** | −1.126 ** | −0.046 | −0.370 | −1.410 | 0.934 | −0.189 | −1.036 * | ||
| −3.842 * | 6.292 * | 10.055 * | 0.810 * | - | −21.114 ** | - | - | - | ||
| - | 9.218 * | 7.061 *** | - | - | 25.761 | 4.664 ** | −0.882 ** | −13.694 ** | ||
| lnK | NA | 0.139 ** | 0.138 * | 0.039 ** | NA | NA | NA | 0.034 | 0.052 * | |
| NA | 0.124 ** | 0.009 | 0.048 ** | NA | NA | NA | 0.014 | 0.004 | ||
| NA | 0.057 | −0.011 | 0.094 *** | NA | NA | NA | 0.220 * | - | ||
| NA | 0.443 * | −0.136 | - | NA | NA | NA | −0.076 * | 0.234 * | ||
| R-square | 0.739 | 0.647 | 0.754 | 0.842 | 0.856 | 0.743 | 0.876 | 0.730 | 0.761 | |
| Dependent: lnGDP | |||||||
|---|---|---|---|---|---|---|---|
| Country | Long-and Short-Run | lnEN | lnREN | lnNREN | |||
| Burundi | LR | 2.441 | S | 1.024 | S | 2.472 | S |
| SR | 4.526 ** | A | 4.718 ** | A | 4.061 ** | A | |
| Rwanda | LR | 0.6331 | S | 0.283 | S | 0.701 | S |
| SR | 4.685 ** | A | - | - | - | - | |
| Uganda | LR | 0.356 | S | 3.710 ** | A | 0.748 | S |
| SR | - | - | - | - | - | - | |
| Ethiopia | LR | 1.799 | S | 3.155 ** | A | 1.622 | S |
| SR | 0.826 | S | 0.589 | S | 3.987 ** | A | |
| Tanzania | LR | 1.524 | S | 1.597 | S | 2.898 *** | A |
| SR | - | - | - | - | - | - | |
| Kenya | LR | 4.535 ** | A | 8.410 * | A | 6.373 * | A |
| SR | 0.768 | S | 3.291 ** | A | 10.443 * | A | |
| Egypt | LR | 0.689 | S | 0.997 | S | 0.457 | S |
| SR | 1.185 | S | - | - | - | - | |
| DRC | LR | 0.252 | S | 3.753 ** | A | 2.469 | S |
| SR | 5.665 ** | A | 7.343 * | A | 2.174 ** | A | |
| Sudan | LR | 0.572 | S | 0.565 | S | 0.312 | S |
| SR | 0.816 | S | - | - | 4.144 ** | A | |
| Variables | Burundi | Rwanda | Uganda | Ethiopia | Tanzania | Kenya | Egypt | Sudan | DRC | |
|---|---|---|---|---|---|---|---|---|---|---|
| lnEN | 0.320 | 5.595 * | 1.268 | 2.001 *** | 1.308 | 0.016 | 3.643 ** | 0.821 | 0.321 | |
| 2.530 *** | 0.555 | 2.446 | 7.500 * | 5.397 * | 2.446 | 2.595 *** | 8.537 * | 0.213 | ||
| 1.805 | 0.877 | 1.458 | 2.231 *** | 0.462 | 0.327 | 4.985 ** | 0.647 | 1.160 | ||
| 0.295 | 5.433 * | 2.356 | 2.810 *** | 6.739 * | 1.424 | 1.446 | 11.444 * | 0.028 | ||
| lnREN | 3.441 ** | 0.782 | 2.497 *** | 0.133 | 2.409 | 0.507 | 4.814 ** | 0.023 | 0.965 | |
| 0.901 | 3.290 ** | 0.059 | 6.875 * | 4.751 ** | 2.992 *** | 9.331 | 10.293 * | 0.624 | ||
| 4.178 ** | 0.313 | 6.447 * | 0.544 | 0.976 | 0.167 | 2.279 | 7.103 * | 1.909 | ||
| 1.513 | 2.326 | 0.585 | 3.495 ** | 4.568 ** | 2.755 *** | 0.675 | 0.024 | 0.210 | ||
| lnNREN | 0.426 | 5.179* | 0.532 | 6.248 * | 2.786 *** | 0.321 | 5.207 ** | 0.661 | 0.440 | |
| 2.058 | 0.380 | 2.044 | 1.249 | 2.950 *** | 2.953 *** | 2.107 | 9.733 * | 0.035 | ||
| 1.558 | 0.544 | 0.372 | 2.175 | 0.457 | 0.067 | 5.074 ** | 0.596 | 0.285 | ||
| 0.296 | 4.303 ** | 2.135 | 2.730 *** | 4.710 ** | 1.701 | 0.873 | 11.208 * | 0.085 |
Publisher’s Note: MDPI stays neutral with regard to jurisdictional claims in published maps and institutional affiliations. |
© 2022 by the authors. Licensee MDPI, Basel, Switzerland. This article is an open access article distributed under the terms and conditions of the Creative Commons Attribution (CC BY) license (https://creativecommons.org/licenses/by/4.0/).
Share and Cite
Yang, C.; Namahoro, J.P.; Wu, Q.; Su, H. Renewable and Non-Renewable Energy Consumption on Economic Growth: Evidence from Asymmetric Analysis across Countries Connected to Eastern Africa Power Pool. Sustainability 2022, 14, 16735. https://doi.org/10.3390/su142416735
Yang C, Namahoro JP, Wu Q, Su H. Renewable and Non-Renewable Energy Consumption on Economic Growth: Evidence from Asymmetric Analysis across Countries Connected to Eastern Africa Power Pool. Sustainability. 2022; 14(24):16735. https://doi.org/10.3390/su142416735
Chicago/Turabian StyleYang, Cheng, Jean Pierre Namahoro, Qiaosheng Wu, and Hui Su. 2022. "Renewable and Non-Renewable Energy Consumption on Economic Growth: Evidence from Asymmetric Analysis across Countries Connected to Eastern Africa Power Pool" Sustainability 14, no. 24: 16735. https://doi.org/10.3390/su142416735
APA StyleYang, C., Namahoro, J. P., Wu, Q., & Su, H. (2022). Renewable and Non-Renewable Energy Consumption on Economic Growth: Evidence from Asymmetric Analysis across Countries Connected to Eastern Africa Power Pool. Sustainability, 14(24), 16735. https://doi.org/10.3390/su142416735