Article

The Impact of Stakeholders’ Management Measures on Citizens’ Participation Level in Implementing Smart Sustainable Cities

by
Abood Khaled Alamoudi
1,2,*,
Rotimi Boluwatife Abidoye
1 and
Terence Y. M. Lam
1
1
School of Built Environment, University of New South Wales, Sydney, NSW 2052, Australia
2
Department of Architecture, College of Architecture and Planning, Imam Abdulrahman bin Faisal University, Dammam 31451, Saudi Arabia
*
Author to whom correspondence should be addressed.
Sustainability 2022, 14(24), 16617; https://doi.org/10.3390/su142416617
Submission received: 9 September 2022 / Revised: 9 November 2022 / Accepted: 28 November 2022 / Published: 12 December 2022
(This article belongs to the Special Issue Sustainable Smart Cities and Society Development)

Abstract

:
Smart sustainable cities (SSC) tend to utilise technology to promote themselves by involving their citizens in urban development. Several cities around the world have adopted the “smart city” label in recognition of these advantages. In fact, citizen engagement in public urban development and decision making has been acknowledged globally in many countries; yet, evaluations of the outcomes that allow the contribution of empowerment to be measured and compared with other influences are lacking. This study examines the correlation between stakeholder management measures (SMM) and citizen participation level (CPL) in the process of achieving an SSC. Four SMM factors were extracted from a literature review and sent out to be examined by experts in the field of built environments. Mean score (MS) ranking was used to confirm the importance of these variables in terms of predicting correlations with CPL. The results were generalised by multiple regression analysis techniques. This study shows a positive significant correlation between SMM and CPL in terms of Regulation, Collaboration, Legitimates, and Control. These four predictors make a significant contribution to escalating the levels of engagement and empowerment of citizen participation (CP). This paper contributes to knowledge in the field by identifying pillars that can increase CPL. Our findings could support the stakeholders of SSC projects to raise CPL, not only by hearing their voices but also by delegating power.

1. Introduction

Globally, there has been a huge debate on citizen participation (CP) in urban development and decision making [1]. There is a growing body of literature on how to evaluate the role and importance of empowering citizens to participate in public decisions [2]. Empowerment was highlighted by the international organisation for reducing poverty [3]. The role of CP has been discussed widely; yet, the outcomes that allow the contribution of empowerment to be measured and compared against other influences have not been concisely presented [4,5,6]. Empowerment is defined by Narayan [7] as “the expansion of assets and capabilities of poor people to participate in, negotiate with, influence, control and hold accountable institutions that affect their lives”. For instance, it has been found in the literature that countries that emphasise CP significantly outperform other countries in terms of developing urban projects [8,9,10]. Understanding the relationship between CP and stakeholder management measures (SMM) is important to achieve smart sustainable cities (SSC). Narayan [7] argues that SMMs increase the level of CP, which will improve SSC outcomes.
The concept of smart sustainable cities was introduced by academics; however, empirical work in this area is still in its preliminary stages [11]. The term “smart sustainable city” is used to describe a city that has massively applied advanced information and communication technologies (ICT) in connection with various urban systems. Achieving sustainability goals in collaboration with ICT has been an arduous task for urban governments [12]. There is a lack of policies and strategies for sustainable urban development as it relates to ICT technology and the participation of the community. A comprehensive framework built on the smart sustainability concept will enable technology-driven urban development initiatives with positive environmental and social outcomes [13]. Smart cities are considered open to accepting new technologies to achieve desired urban outcomes, with sustainability being one of the key outcomes. However, there is a lack of evidence regarding how sustainability outcomes are achieved within smart city initiatives [14]. ICT approaches can be used for the collection and analysis of datasets for the development of urban intelligence functions. Based on urban simulation models, decision-making strategies can be formulated to achieve SSC [15].
Recent advancements in ICTs have been implemented to address the social–technical issues the cities are facing [16]. The application of complex IT solutions to solve complex problems contributes to the development of smart cities and governments. Smart cities use IT to provide innovative services, achieve sustainability, and enhance infrastructure institutional capabilities and resilience [17]. Some technologies are utilised in the development of smart city initiatives. These technologies aim to solve environmental, social and financial challenges and are considered an integral part of vibrant city life. They are also thought to enhance socioeconomic stability and improve the quality of city life [18].
According to Andone, Holotescu and Grosseck [19], the SSC demonstrates how technology supports urban challenges and planning strategies. However, because of the complicity and interdisciplinary nature of the urban fabric, the role of human and social capital is unclear [20]. Therefore, cities are not genuinely benefiting from ICT to adopt CP [21]. The attention given to CP in smart cities has been explicitly criticised because the role of citizens is very limited [22]. Enabling CP in public urban development and decision making at all levels of policy and governance has been attempted in some countries [23]. Many scholars have addressed the concern of ignoring citizen participation in resource allocation decisions. Yet, in practice, cities are not seriously enabling CP [24,25,26]. For example, many smart cities, such as London and Dublin, have expressed the intention to put their citizens’ needs first [27]. Yet, their citizens have no direct engagement with the development of these cities and instead remain passive beneficiaries [22,28]. Scholars have argued that smart cities are not about technology, but rather, that the term describes the extent to which a city facilitates, interacts, and collaborates with its citizens [29,30,31]. Living labs are based on an experimental approach that provides research opportunities and examines multiple disciplines [24]. It provides an ICT platform for stakeholders and involves people-public-private partnerships to improve the existing system. It allows the transfer of knowledge and economic value among stakeholders, making it possible to examine sustainable development approaches and advance sustainable practices [32,33]. An organisation focusing on developing sustainable products and monitoring their carbon footprints provides economic value. Material flow is circulated through municipalities for waste processing, recycling, and resource recovery. Engaging and participating with the local community will transfer knowledge and teach citizens to contribute to environmentally sustainable and smart cities [34,35].
Additionally, the implementation of e-governance in this technology-driven age is obligatory for governments [6]. Researchers of urban management systems have indicated that policies and governance shape and transform urban and regional development agenda [36]. Even though many policies and governments neglect citizen participation in social, environmental and economic development, the European Charter for the Safeguarding of the Human Rights in the City and the Global Charter-Agenda for Human Rights in the City were acknowledged by the UN-Habitat to support urban sustainability [29]. For example, the government of Saudi Arabia has successfully leveraged ICT in national security and commerce, while urban sustainability (environment, economic and social) is still in an early stage and needs a huge effort to leverage ICT, promote CP and support urban development. The previous discussion highlights the role of community engagement in leveraging ICT to support SSC implementation. Cities could be smart when investing in human/social capital and ICT to promote sustainable growth and enhance quality of life [14].
This study fills the gap by identifying SMM and CPL and investigates the relationships and the correlation between SMM and CPL. More specifically, we raise the research question: to what extent do SMMs correlate with CPL within the context of Saudi Arabia? Therefore, this study aims to identify SMMs and investigate the relationships with CPLs in Saudi Arabia. This study contributes significantly to the literature on stakeholder management theory (SMT) by examining the correlation between SMMs and CPL. It empirically supports the decision-makers with the most suitable level of CP and applies them to different cities. In other words, it aims to improve the practice of stakeholders’ management by presenting how formality, participation, and communication with citizens in urban development projects. We examined the CPL in smart city projects as per the Arnstein ladder (eight levels) and to what extent (level) decision-makers are willing to consider CP. Thus, the study focuses on understanding the point of view of professionals who are deeply involved in the FSCP on their acceptance of ordinary people participating in urban development initiatives. In fact, they have conducted public consultations to identify the community needs in developing SSC.
This paper consists of five sections. The first section introduces the current research problem in determining the CPL to implement SSC in Saudi Arabia. The second section discusses the literature review on SMM about CPL and presents an overview of the current theories on SMM and CP. The third section illustrates the adopted methodology to address the research aim concerning the relationships between SMM and CPL, while the result and discussions are presented in the fourth section. The last section concludes the paper by presenting the study findings, implications, limitations, and areas of further study.

2. Literature Review

2.1. Identifying Citizen Participation Level

It is essential to understand how SMM can positively affect CPL. Regulation, Collaboration, Legitimates, and Control are pillars that prompt CPL [37]. Arnstein [38] argues that CP is a pillar that contributes to policies and governance to develop a real sustainable city. In implementing the SSC, it is crucial to gain insightful information by supporting citizen participation which could be carried out fast and save cost. Yang and Pandey [39] define citizen participation as decision-making and management processes, i.e., a bottom-up approach to decision making. The rationale from CP is to design and build services tailored to their actual needs. Bouzguenda, Alalouch and Nadia [40] sees the hierarchy of citizen participation in three nodes: (1) digital citizen participation, (2) community Engagement, and (3) social sustainability. Other scholars such as Arnstein [38] proposed a typology for CP, which consists of eight levels called the ladder of CP (see Figure 1). The steps of the ladder from the bottom to top are as follows: 1—Manipulation, 2—Therapy, 3—Information, 4—Consultation, 5—Placation, 6—Partnership, 7—Delegated Power, and 8—Citizen Control. Burke [41] believes that CP depends on certain conditions and assumptions; thus, not all strategies are effective for all organisations.
Bourne [42] elaborated the eight levels ladder proposed by Arnstein [38] as follows: 1—Manipulation level which involves citizens and participants responding to surveys, or sending their feedback, but not considering their responses. It aims to educate citizens in planning, not for genuine participation. 2—The therapy level involves participants in extensive activities related to a project. it still reduces their ability to make changes, where citizens may be heard with no power to the citizens. 3—Informing level is distributing information about the stakeholders and informing them about their rights and responsibilities and what is expected from them to be achieved which is the first step towards influential stakeholders’ participation. It aims to engage citizens when engaging them in urban development. 4—The consultation level invites stakeholders’ opinions which legitimate step toward full participation. 5—Placation level is when the stakeholders have some power to influence other groups. 6—Partnership is the level at which stakeholders work together to achieve an outcome that is beneficial to all parties. 7—Delegated power is delegating management authority to key stakeholder groups, particularly associated with implementation, significantly improving outcomes. The last is 8—stakeholder control is when stakeholders control projects and program steering committees that fulfill elite roles. The difference between CPL and SMM is the extent of empowerment being given to be part of the decision making. Scholars argue that governments must benefit from citizen-focused feedback and transform from agency-centric to citizen-centric [6,22]. In addition, it must consider two dimensions: first, citizen expectations of “citizen-related dimensions,” and second, facilitating conditions of “related governmental dimensions” [6]. The governments are still challenged by understanding the needs and expectations of their citizens. This study adopts these eight levels to operationalise the CP, which were then regressed against the SMM (performance predictors).

2.2. Citizen Participation in Smart Sustainable Cities

Citizen participation in smart cities has been investigated by many researchers [43,44]. Smart cities consist of governance, technology, a sustainable environment, economic stability, and the decision of smart and educated citizens. The European Commission has characterised smart cities as citizen-centric open innovation environments [45]. Smart city governance depends on the citizen engagement and its critical to include them. Citizen participation has been neglected in the past. Social infrastructure based on intellectual capital is an essential asset. Education, social innovation and creativity are key drivers for the establishment of smart cities. If imparting knowledge and creativity to the community through innovative technology is one of the objectives of smart cities, this will create a resource for the smart city. A society actively using technology and adopting smart services will enable opportunities for further growth and development [46].

2.3. Sustainability for Maintaining Smart Cities

Rapid urbanisation and growth bring more challenges to the cities, highlighting the importance of maintaining sustainability. There needs to be a clear working definition of sustainability on the urban scale, although certain characteristics of urban sustainability are commonly used [47]. These characteristics integrate the three dimensions of sustainability, i.e., social, environmental, and economical. The environmental dimension considers ecological aspects and the conservation of natural resources, flora, and fauna [44]. The social dimension addresses the basic needs of the human, well-being, community, and equity. In contrast, economic dimensions include the financial well-being of the society. A holistic approach of all the dimensions of sustainability taken into consideration will present SSC [44]. Smart city goals aim to reduce environmental impacts, utilise resources sustainably, enhance the city’s liveability, and boost economic development by implementing technology. The social dimension of sustainability has often been overlooked and it is unclear how ICT technologies will improve the general quality of life and reduce community disruption and social inequity [48].

2.4. Stakeholder Management Theory and Measures

The growing interest in SMT has gained more attention from companies and governments wanting to implement the same concept into their city’s development. Recently, SMT has been considered an approach involving humans in the development and management of a city and avoids centralised policies and decision making [49,50]. More recent developments have started to consider how SMT relates to firm performance and investigate how understanding stakeholders’ claims could serve business objectives [51,52]. After the new public management wave, when governments worldwide decided to give the private sector room to help the public sector deliver public services, stakeholders became widely popular in the academic and practitioner vocabularies for helping map out arenas of power and relationships [53]. However, some countries still do not involve their citizens in development [40,54]. Therefore, the theoretical framework of this study is based on three critical articles on SMT: Freeman and Reed [55], Mitchell, Agle and Wood [56] and Gomes and Gomes [37].
Freeman and Reed [55] invented the SMT and believe that strategic management is an essential part of the development of a firm. Due to the evolving and globalisation of capital markets, Freeman, Harrison and Wicks [57] developed a two-tier stakeholder map that classified stakeholders into primary and secondary (see Figure 2). Scholars such as Wembe [58] and Ranängen [59] elaborate that the two-tier stakeholder map combines the optimisation of processes of human emotion and behaviours.
The existing literature review considers SMT as the continuous and systematic process through which a firm establishes positive and constructive relationships with its stakeholders [60,61]. The theory of SMT suggests that seeking the company’s profit maximisation is not the premium objective of the business activity; however, equilibrium among stakeholders’ expectations is necessary for the long term [62,63]. Berman, Wicks, Kotha and Jones [64] argue that stakeholders and their satisfaction compete for objectives to develop a spontaneous managerial approach. Nevertheless, ICT, including the internet, social networking and big data, has put more pressure on creating new techniques in the stakeholders’ management space which is increasingly embedded in corporate activities [65].
A large part of the popularity of stakeholders can be attributed to the fact that it can use it for many purposes. Mitchell, Agle and Wood [56] defined stakeholders into a more sophisticated model that helps separate stakeholders from non-stakeholders and explains who should pay attention. As a result, a model for decision-makers is based on three dimensions: (1) the stakeholder’s power to influence the firm, (2) the legitimacy of the stakeholder’s relationship with the firm, and (3) the urgency of the stakeholder’s claim on the firm (see Figure 3). According to Mitchell, Agle and Wood [56], the definition of power is the influence of others within recognized relationships; Legitimacy refers to social systems built by societies, including norms, values, beliefs, definitions, and how they perceive the world; and Urgency is the action that needs immediate attention from the stakeholders. The bases of the three dimensions are demonstrated as follows.
Parmar, Wicks and Freeman [66] identify three governance challenges that affect how managers interact with existing stakeholders and start new relationships. First, investing in competitive companies can put firms under pressure to coordinate. Second, there is a vested interest in prioritizing short-term results for shareholders who are not ultimately responsible for carrying residual risks. Third, shareholders’ interests are diverse. Habisch, Patelli, Pedrini and Schwartz [60] proposed a view of a firm as the convergence of interests and expectations that is needed to be considered and integrated into the firm’s strategy. Since then, there has been an increase in interest in stakeholders’ management and how firms may build and organise relationships with stakeholders to satisfy their needs better.
Gomes and Gomes [37] proposed a model that influences the stakeholder in their decision making regulation, collaboration, legitimation, and control (see Table 1). Each domain is considered for measuring SMM. First, regulation will help ensure the rules are in the public interest, including citizens, businesses, civil society, and other community members [67]. Second, internal, and external agents were identified in the collaboration domain to deliver public services, which will conduct through a collaboration between the public and private sectors. Third, legitimation is very close to the regulatory domain. Third, legitimation is very close in nature to the regulatory domain, but it is more derived from its institutional environment in which local politicians gain power and legitimacy for steering the local government for a while. Last, the controller domain is a mechanism that helps the public sector to be accountable to society and to ensure the availability of funds that will provide efficiency, effectiveness, and equity to the community.

3. Methodology

This study hypothesised that SMM has a positive correlation with CPL which was supported by SMT. This study follows the method informed by Osei-Kyei and Chan [70] that combines a comprehensive literature review and a structured online questionnaire to examine the correlation between SMM and CPL. The performance predictor and performance outcomes were retrieved from the literature by utilising search engines such as Scopus, Google Scholar, Elsevier, and the University of New South Wales Library database. The regression analysis has proven to be a statistical tool that examines the relationship between two or more variables [71]. Green and Silverman [72] argue that this method can achieve authenticity and generalisation. Triangulation was adopted for this research to test the correlation between SMM and CPL. Using two or more methods to investigate the same thing can avoid potential bias [73]. The performance outcomes and performance predictors were confirmed by MS ranking by distributing an online questionnaire to experts in the built environment field to determine whether they agree with the relationship extracted from the literature review. The outcome was then tested by quantitative hierarchical regression analysis to generalise the results [74].

3.1. Data Collection

An online questionnaire survey was conducted to establish a robust point of view of the stakeholders [75]. It also helps to identify the stakeholders’ management measures and investigate the relationships with citizen participation levels [54]. A mixture of participants, professionals and academics, eliminates any misunderstanding and reduces the lack of knowledge, and observational evidence [76]. Therefore, this study was conducted by using an online questionnaire to collect the opinions of stakeholders of the Future Saudi Cities Program (FSCP), and from professionals (urban planners, architectural designers, and real estate developers), government representatives (FSCP officers from the Ministry of Municipal and Rural Affairs (MOMRA) UN-habitat, and policymakers), and academics. The survey focused on investigating the correlation between SMM and the level of citizen participation. We utilised a five-point Likert scale to assess the importance of the selected performance predictors and the performance outcome [77].
The questionnaire was divided into five sections as follows: The first section was designed to obtain the background information of the expert participants (Supplementary Materials). The second section was designed to present the important variables for stakeholder management measures. Additionally, section two utilised the five-point Likert scale for the ranking of the importance of each variable [77]. The participants were asked to choose from one of the five options which represent “Least Important (1)”, “Fairly Important”, “Important”, “Very Important”, and “Extremely Important (5)”, respectively [78]. The third, fourth, and sixth sections were designed to examine the predictor and output performance the following scale was used: “Least adopted (1)”, “Fairly adopted”, “Neutral”, “-Well adopted”, “Fully adopted (5)”, respectively [78].
Expert sampling was adopted to determine the population size [79,80]. However, Yager, Kunkle, Fochtmann, Reid, Plovnick, Nininger, Silverman and Vergare [81] pointed out that the word “Expert” does not always mean skilled in the field; as a result, it can be interpreted in many ways. The targeted participants must meet the selection criteria. First, the nominated participants must have at least 10 years of cognitive experience in urban development and at least three years of experience in smart cities. Second, those who represent FSCP, must be involved directly in FSCP in the implementation process and occupy a senior position or above. Third, the participants from academia must have a PhD in urban planning or any related discipline. Fourth, the participants from the industry must be involved in urban planning or smart city implementation. To determine the sample size, the number of predicted variables must be determined first [82]. For social science studies, it is recommended by Stevens [83] that for each variable, about 15 participants are needed. Coakes and Steed [84] suggested that 15 participants per predictor variable are valid. There were 15 predictor variables involved, so a minimum of 225 sets of data were needed. Based on the selection criteria mentioned earlier, a total of 265 responses were collected; however, 245 valid responses were received and analysed. The duration of data collection was three months, and three reminders were sent to the participant to complete the survey. The participants were reached via the Saudi Council of Engineers (SCE), their employers’ webpage and LinkedIn, which contains their position, experiences, and their involvements.
Table 2 shows the frequency and percentage distribution of demographic variables contained in the survey. Most of the participants were male (n = 201, 82.0%), 43 (17.6%) of them were female, and 0.4 people indicated another gender. Ninety-six (39.2%) of the participants were between the ages of 40 and 49, 75 (30.6%) were between 30 and 39 years, 63 (25.7%) were of an age 50 years and above, while 11 (4.3%) were of an age between 18 and 29 years. Close to half of the participants had a bachelor’s degree (n = 117, 47.18%), 108 (44.1%) were postgraduate holders, 14 (5.7%) had other levels of education, and 6 (2.4%) had a diploma. Hence, 67 held PhD degrees and 41 master’s degrees. Thus, the participants were well-educated which helped to achieve the aim of this study. It is crucial to capture the point of view of experts who have more experience than young people. About 108 (44.1%) of the participants stated urban planning as their field of profession, 42 (17.1%) indicated management as their field of profession, and 39 (15.9%) indicated IT and architecture, respectively, as their field of profession. Eleven (4.3%) participants indicated other fields of profession, while eleven (4.5%) indicated civil engineering as their field of profession. The variety of disciplines of the participants will enrich the output of this study. About 138 (56.3%) of the participants work in the public sector including 41 (30%) that are involved in the FSCP, 78 (31.8%) work in the private sector, 26 (10.6%) work in the academic sector, while 3 (1.2%) are freelancers. It is worth mentioning that all participants from the academic sector hold a PhD degree. When it comes to regulation and collaboration, it is important to obtain the higher voice of the public sector. In terms of work experience, 118 (48.2%) have relevant experience in architecture, urban planning, management, engineering, or ICT for a period of between 15 and 20 years; 55 (22.4%) have 20 and above years of experience; 48 (19.6%) have 10 to 15 years of experience; 15 (6.1%) have between 5 and 10 years of experience; while 9 (3.5%) have between 0 and 5 years of experience. In this sense, participants with more experience are more likely to be considered for their efficiency, uniqueness, and legitimacy.

3.2. Data Analysis Techniques

To determine whether there is a relationship between the categorical variables, mean score (MS) ranking and regression analysis were adopted to analyse the collected data. However, the content focused on the investigation of the correlation between SMM and the level of CP. The Statistical Package for the Social Sciences version 26.0 software (SPSS) was utilised to examine any relationships in terms of ranking or grouping that arise from the collected data.
The MS technique was used to evaluate the importance of the set of independent and dependent variables [85]. The collected data were analysed to examine the relationship between SMM and CPL. MS is extensively used in built-environment studies to evaluate the importance of a set of variables [86,87,88]. Equation (1) was utilised to calculate MS ranking [87]. SPSS software was used to analyse any cross-tabulations, relationships or grouping that exist in the collected data.
M = s n
where M represents the mean score, S is the participants’ score based on a Likert scale, and n is the total number of participants.
Regression analysis is a powerful statistical approach to examine the relationship between two or more variables (dependent and independent) of interest [71]. It is one of the techniques commonly used in the academic field which builds upon outcomes variables by predicting values [78]. If the variables are single, that is simple regression analysis, but if more variables are involved, that is referred to as multiple regression analysis. Cheung and Chan [87] provided Equation (2) for multiple regression analysis.
Y p = α + β 1 X 1 + β 2 X 2 + + β k   X k + ϵ i
where α is the intercept; β1, β2, …, βk are the regression coefficients; K1, K2, …, Kk are units; and ϵi represent the predictive error or residual.
Some basic assumptions must be met to ascertain the adequacy and fitness of the predictive model. The technique was used to regress each performance outcome of CPL against influencing factors (Regulation, Collaboration, Legitimates, Control). The regression analysis aimed to validate the overall relationship between the performance outcomes of CPL and predictors of SMM, and the individual relationships between CPL and SMM. In this study, the normality test and heteroscedasticity test were conducted, where the former test is an important test to measure the distribution among variables, and the latter test reveals the error of any normality test. It appears that the points follow the line, so it can be concluded that the collected data are normally distributed.

3.3. Data Reliability

To establish the consistency and reliability of the collected data, the Cronbach alpha test was conducted. Cronbach’s alpha measures the degree of internal consistency among the survey participants. The Cronbach’s alpha value ranges between 0 and 1.0. When Cronbach’s alpha is greater than 0.7, the participants’ opinions about the influence of criteria on each other are said to be highly consistent [89]. Thus, Table 3 contains the Cronbach alpha values for each variable used to determine if the SMM is consistently measured and, hence, reliable. A scale with a Cronbach alpha coefficient greater than 0.5 is considered to be reliable [90]. Regulation, Collaboration and Legitimates have a higher reliability value, but Control shows a lower value, yet it is above 0.5, therefore, reliable. It also indicates that the human factor is an important factor in the smart cities project.
In addition, the result of Cronbach’s alpha for performance outcomes indicates the consistency and reliability of the data. As shown in Table 3, Information, Consultation, Delegated Power, and Citizen Control indicate a coefficient and reliable data; Placation and Partnership are highly consistent and reliable data.

4. Result and Discussions

The proposed performance outcomes and influencing management factors were confirmed but refined as follows: Regulation, Collaboration, Legitimate, and Control. First of all, Table 4 shows six variables of the performance Predictor: Regulation, while Collaboration, Legitimate, and Control have four, two, and three variables, respectively. As suggested by Koopmans, Bernaards, Hildebrandt, de Vet and van der Beek [91], the cut-off value for the mean score is 2.4 to determine the acceptance measures. The highest MS ranking for SMM has positively affected the level of citizen participation, with an MS of 3.86. While adopting the concept of CP, increasing participation, managing external stockholders, and having a vision have MS ranging between 3.76 and 2.48, which is considered an acceptable measure. Moreover, considering a fund for civic engagement in smart cities that is allocated by the government has a mean score of 2.44 and it is ranked as the sixth most important factor among the regulation predictors.
In addition, Table 4 shows that the Collaboration variable tapping citizens’ knowledge and experience is ranked as the second highest variable that affects the performance predictor of Collaboration with an MS of 3.42. In addition, exploring the product and services that are provided for citizens and involving citizens in urban development are ranked second and third, respectively. The adoption of citizens to become more credible data producers is ranked fourth with a mean score of 2.61. Moreover, stakeholders adopt local government initiatives to meet citizens’ needs and recruit and retain citizens to participate which explains why the performance predictor Legitimate has an MS of 2.7 and 2.5, respectively. Finally, the performing predictor Control has the variables of Saudi cities adopting ICT to increase citizen participation, stakeholders learning about citizens’ preferences, and the availability of sensory data in Saudi cities is enough to have an MS of 3.7, 2.4 and 2.1, respectively. The last variable was removed due to an unsatisfactory meeting of the minimum MS value.
Additionally, Table 5 confirms and ranks the eight performance outcomes to be sufficient for measuring the CPL within the context of Saudi Arabia, based on the mean score and standard deviation where Partnership is ranked first and placation second. However, Manipulation shows a very low mean score, thus ranked the last.
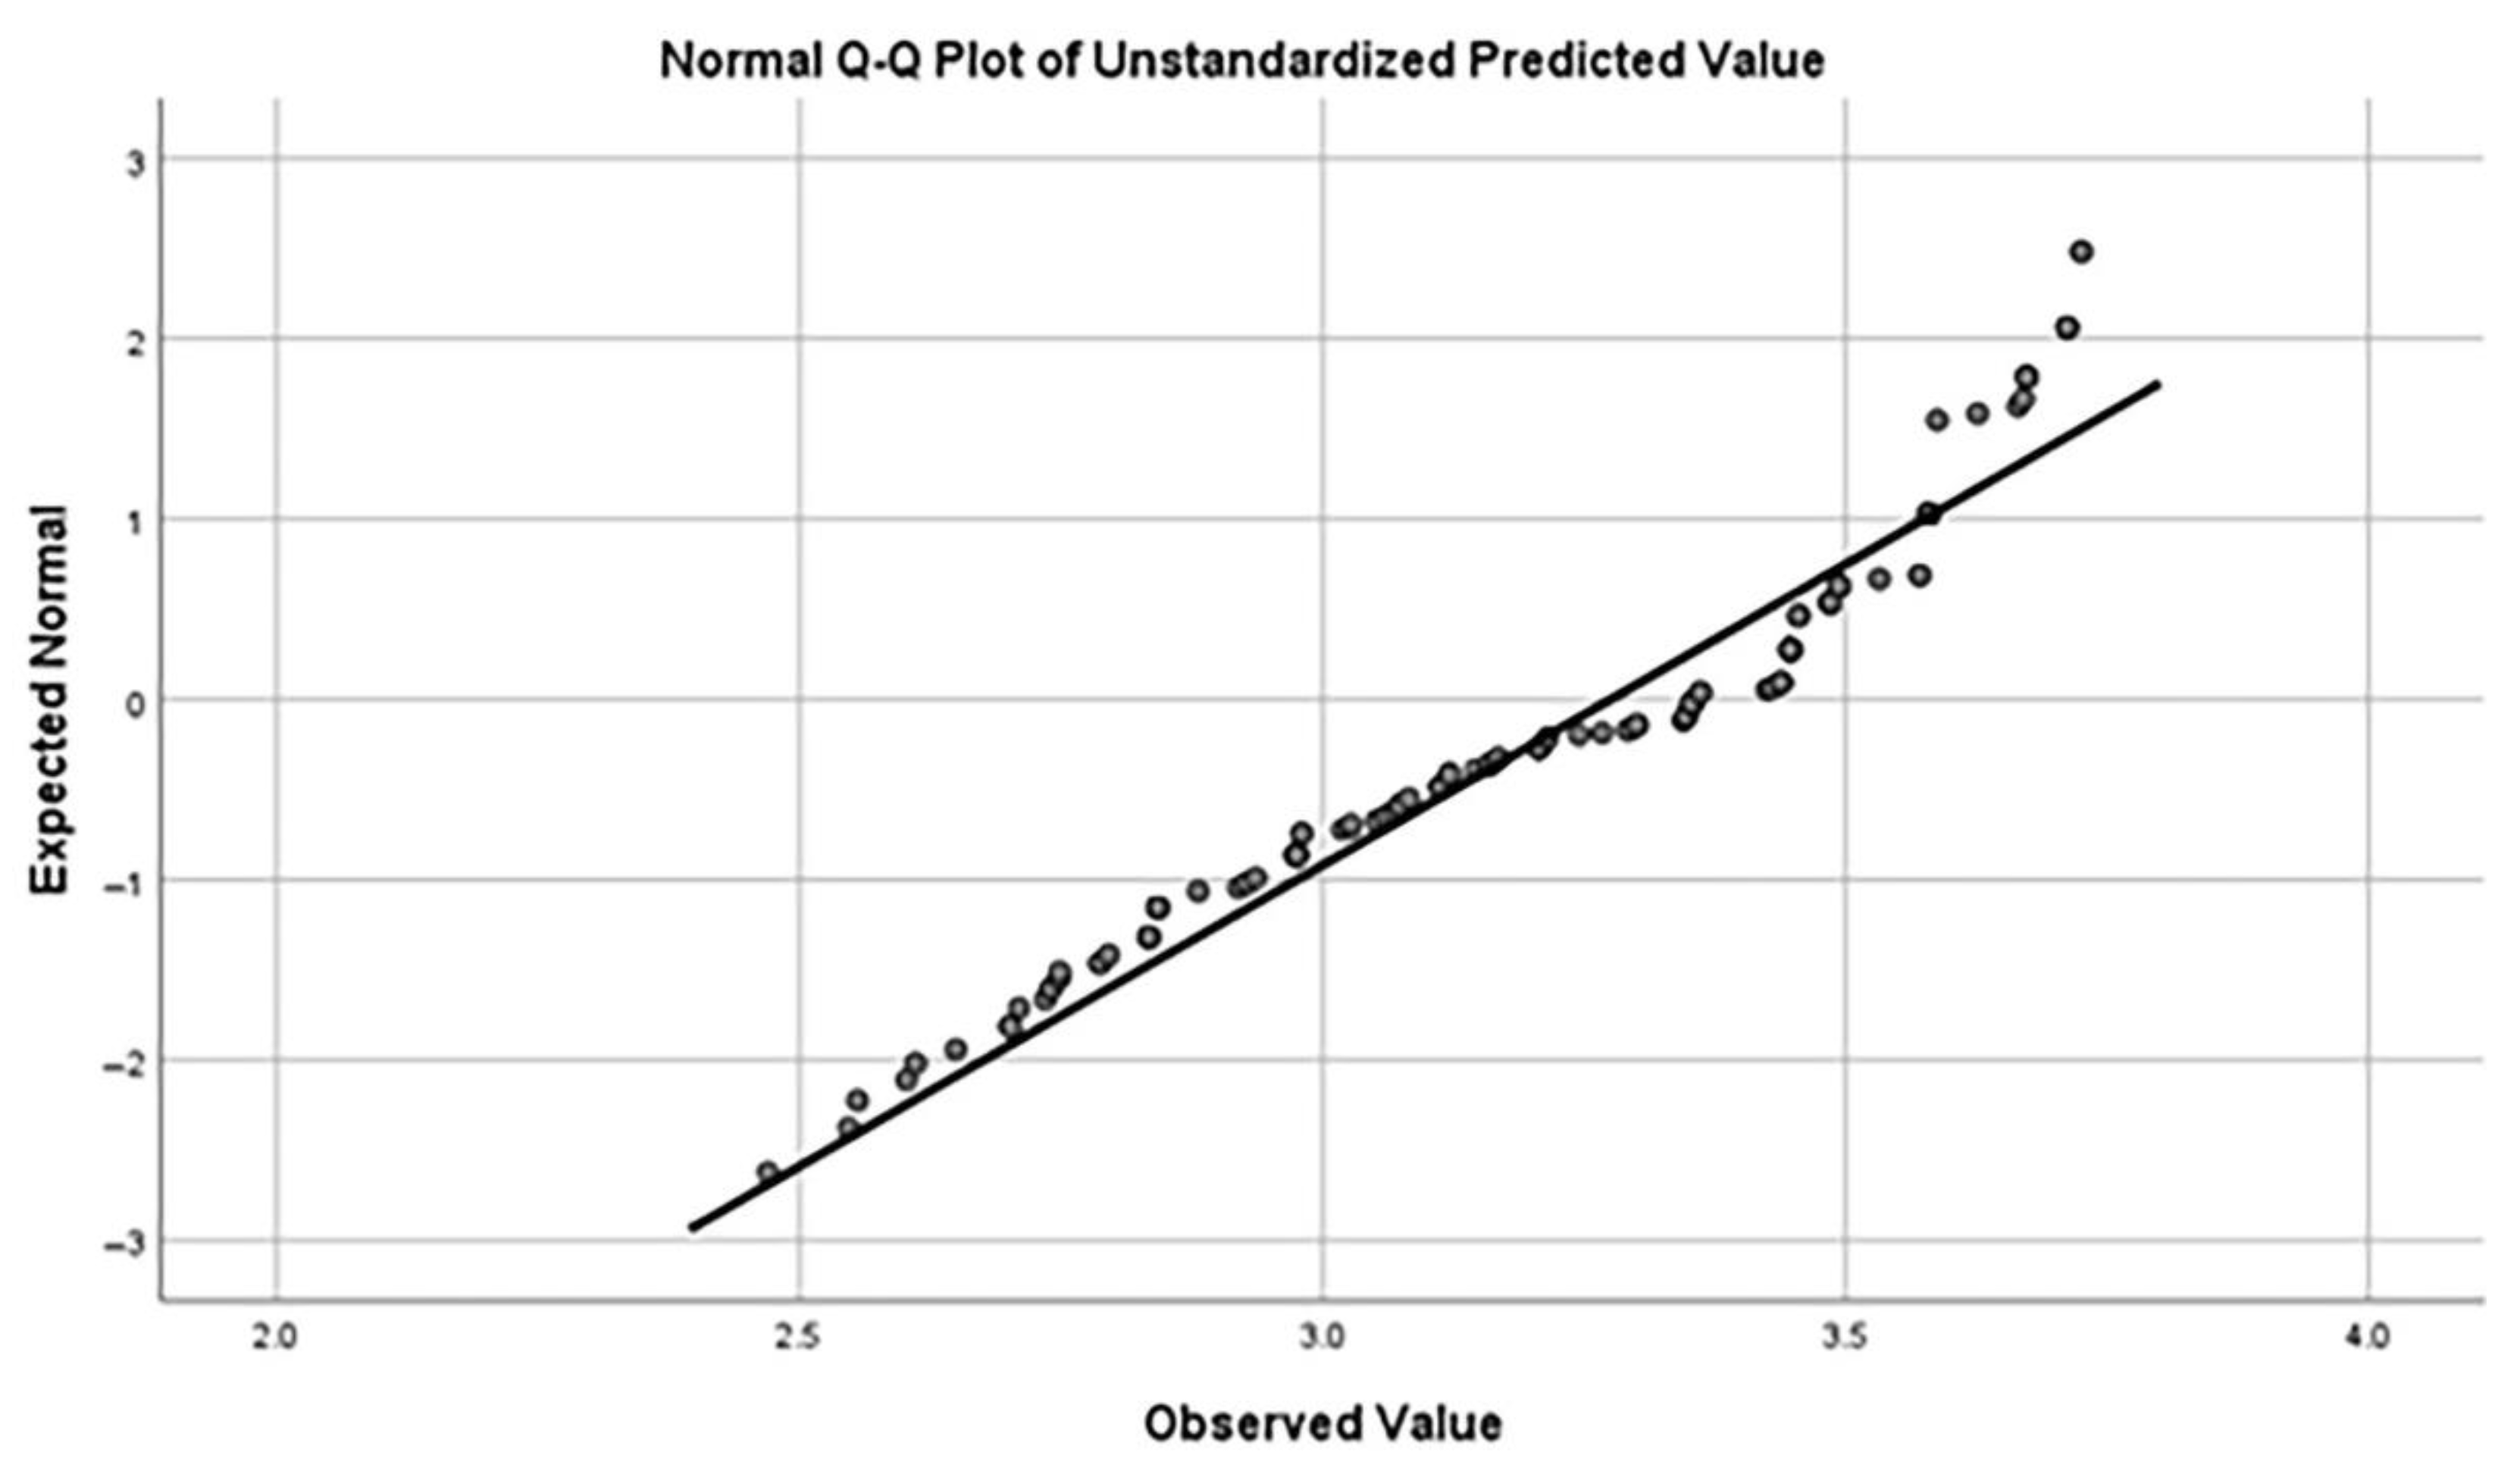
Before conducting the regression analysis, it is important to conduct the residual analysis to examine the normality and heteroscedasticity. Multiple regression assumes there is a linear relationship between dependent and predictor variables. Figure 4 shows the scatter plots that explain the normal probability of statistical residual and these points that fall in this line represent more or less the normal distribution and linear relationship of the variables. Some deviations can be seen above the centre, but generally, the points do seem to follow the line, so it is concluded that the collected data are normally distributed. As suggested by Steger, Mair, Kofler, Pittore, Zebisch and Schneiderbauer [92], the observed unstandardised residuals are normally distributed and accepted where minor deviation from normality is not a cause or effect.
To test the research hypothesis, which is that an SMM has a positive correlation with CPL, we followed the same method as Alshamrani, Alshibani and Mohammed [93] where correlation analysis was performed before the regression analysis to elaborate on the relationship between the performance outcomes. Akoglu [94] suggested that any relationship between two variables that have a value lower than ±0.4 is considered a weak relationship. For each performance outcome, in addition, another correlation coefficient was conducted to examine the relationship with the performance predictors. The results in Table 6 show the bivariate correlation value between all levels of citizen participation. The result explained that there exists a strong significant positive correlation between CP level and regulation (r = 0.86), collaboration (r = 0.77), legitimate (r = 0.66) and a significant moderate positive correlation between CP level control (r = 0.54). It is worth mentioning that there is a variation in the relationship between variables with each other; however, this relationship does not mean there is causation or effect between any two valuables [92].
In addition, the correlation between the variables was computed by utilising the factor loading in the structure matrix presented in Table 6. In essence, any loading of over 0.10 is going to influence the factor’s group and this is because of satisfactory variance explanations. For example, 12 variables that show significant loading above 0.10 were grouped under factor 1 as key predictors. Nine variables were grouped under factor 2 as key predictors. Eight variables were grouped under factor 3 as key predictors. Nine variables were grouped under factor 4 as key predictors. The above four factors, which combined the 38 variables, respectively, are defined as the most critical success factor group as shown in Table 6.
The eight performance outcomes as confirmed earlier in Table 5 were regressed against performance predictors. Table 7, Table 8, Table 9, Table 10, Table 11, Table 12, Table 13 and Table 14 show the results of the multiple hierarchical regression analysis conducted to predict CPL from SMM. Eight regression equations are listed below for regression analysis. The four predictors of SMM including Regulation, Collaboration, Legitimacy, and Control indicate a significant correlation with the CPL. However, the result presented in Table 7, Table 8, Table 9, Table 10, Table 11, Table 12, Table 13 and Table 14 shows that the predictors are not correlated with all eight levels of performance outcome. For instance, the predictor Regulation escalates CPL from the Manipulation level to Partnership level. Collaboration and Legitimacy raise the CPL from Manipulation level to Delegated power level. Control boosts the CPL from the Information level to the Partnership level. In most levels, the multiple regression models showed there was a significant overall correlation between the CPL and SMM (Adj. R2 > 0.5; as suggested by Ahadzie, Proverbs and Olomolaiye [95] and Lam [96]), except in Delegated Power and Citizen Control. The results are summarised as follows:
  • Table 7, Table 8, Table 9, Table 10, Table 11 and Table 12 show 74 to 88.2% of the variances in six out of eight of the performance outcomes (dependent variables) could be explained by the predictor variables.
  • Table 7 shows that Manipulation could be significantly predicted by all four SMMs including Regulation, Collaboration, Legitimates and Control, all of which were found to be significant predictors as shown by the p-value of <0.05 (Draper and Smith [71] (F = 305.49, p < 0.001, R2 = 0.756, Adj. R2 = 0.733)).
  • Table 8 shows that Therapy could be significantly predicted by all four SMMs, (F = 355.49, p < 0.001, R2 = 0.856, Adj. R2 = 0.853).
  • Table 9 shows Information could be significantly predicted by all four SMMs (F = 20,424, p < 0.001, R2 = 0.804, Adj. R2 = 0.765).
  • Table 10 shows that Consultation could be significantly predicted by all four SMMs (F = 20,424, p < 0.001, R2 = 0.897, Adj. R2 = 0.882).
  • Table 11 shows that Placation could be significantly predicted by all four SMMs (F = 355.49, p < 0.001, R2 = 0.856, Adj. R2 = 0.853).
  • Table 12 shows that Partnership could be significantly predicted by all four SMMs (F = 23.954, p < 0.001, R2 = 0.758, Adj. R2 = 0.740).
  • Table 13 shows that Delegated Power could not be significantly predicted by all the SMMs as the Adj. R2 was only 0.273 (F = 23.954, p < 0.001, R2 = 0.285, Adj. R2 = 0.273).
  • Finally, Table 14 also shows that Citizen Control could not be significantly predicted by the SMM as the Adj. R2 was only 0.300 (F = 27.190, p < 0.001, R2 = 0.312, Adj. R2 = 0.300).

4.1. Regulation and the CPL

This study shows that the predictor Regulation which is one of the SMMs has a significant relationship with CPL. To frame this study in the context of the existing literature and to test for the sensitivity of our results to performance measures, we also ran analyses to determine to what level regulation contributes to the CPL. The regulation was found to be a significant positive predictor for most of the performance outcomes as shown in Table 7, Table 8, Table 9, Table 10, Table 11 and Table 12. The analysis shows a significant positive correlation with a p-value of <0.01 against most of the CPL. However, Table 13 and Table 14 emphasise that Regulation is not a significant predictor of the performance outcome: Delegated Power and Citizen Power. This is consistent with the argument of Ventriss, Barber, Boyte, Crenson, Gran, Susskind and Elliott [97] that it is not recommended to increase the level of citizen participation to the highest level of participation and power which leads to distraction and fractionalisation. Madsen and Ulhøi [98] argue that stakeholder theory has gained substantial attention as an explanation of firm behaviour. Additionally, they believe that the influence of stakeholders, including citizens on regulation, has a positive influence on stakeholders’ commitment; hence, it also influences their decision making. In other words, regulation can either support the increase in involvement of citizen participation or it also can decrease empowerment. Coglianese [99] claims that involving CP in the regulatory process is a fundamental transformation and revolutionary, and when adopting technology can make a true revolution effort. Based on the results (p-value < 0.001, t-value = +2.508), predictor Regulation could significantly increase the CPL from Manipulation to Partnership. In other words, regulation can play an important role in the SSC development starting from manipulation where it educates participants in partnership, where citizens can negotiate with their stakeholders and decision-makers. According to Table 7, Table 8, Table 9, Table 10, Table 11 and Table 12, it is not recommended for the decision-maker to delegate power to CP. This is the first step toward smart sustainable cities.

4.2. Collaboration and CPL

Collaboration means the level of engagement between stakeholders and CP and to what extent it has been conceived in a particular way. The performance predictor Collaboration was tested, and it was found to be the most significant positive predictor as shown in Table 7, Table 8, Table 9, Table 10, Table 11, Table 12 and Table 13. The analysis shows a significant positive correlation with a p-value of <0.008 and t-value = +8.177. In other words, the predictor Collaboration supports CPL from the level of Manipulation to Delegated power. In addition, the predictor of Collaboration can be significantly effective from the level of Information to Partnership. On the other hand, Citizen Control is not supportive and not significant to the predicter Collaboration as shown in Table 14, where the p-value of >0.474 and the t-value = 0.204. According to Dean [100], Collaboration is characterised by trust, reciprocity, and non-domination. Additionally, it helps in solving urban issues at any scale of a neighbourhood, district, or city level [101]. Collaboration leads to working together as partners but still acquiescing to each other power [100]. This study shows a significant relationship between Collaboration and CPL. Collaboration was found to be the most significant positive predictor for the performance outcome of CPL and could significantly increase the CPL from Manipulation to Delegated Power. To put it another way, Collaboration can play a significant role in the SSC development starting from Manipulation where it initially engages participants to delegate power where citizens can not only negotiate with their stakeholders and decision-maker but also possess real decision making toward smart sustainable cities. Smart governance develops collaborative ecosystems with citizens and other entities to engage in smart city initiatives and solve public challenges [102].

4.3. Legitimate and CPL

Legitimacy arises from a close relationship between citizens and local authorities. The Legitimate predictor is tested to determine the significant correlation with the performance outcome CPL. As shown in Table 7, Table 8, Table 9, Table 10, Table 11, Table 12 and Table 13 the predictor Legitimate has a significant positive correlation with a p-value of <0.000 and t-value = +2.269, yet it has no significant correlation at the level of Citizen Control where p-value of <0.410 and t-value = +0.003 as shown in Table 14. In other words, Legitimate can positively increase the CPL from Manipulation to Delegated Power. As suggested by Häikiö [103], administrative logic plays a vital role in structuring the legitimacy of CP. It is not just represented by traditional democracy, but a genuine movement to deliberate the CP positively and effectively [103,104,105]. The power of predictor Legitimate is that social discourse and cultural understanding, which CP raises, determine how rules, justification, and authority are legitimised [106]. Häikiö [103] argues that shared beliefs, values, and expectations justify the legitimacy of power relations between stakeholders and CP. Based on the results in Table 7, Table 8, Table 9, Table 10, Table 11, Table 12, Table 13 and Table 14, the predictor Legitimate could significantly increase the CPL from Manipulation to Delegated power. To elaborate more, Legitimacy can play a significant role in SSC development starting from Manipulation where it initially builds relationships and includes participants to delegate power where citizens can become trustworthy and contribute to the decision-making process toward smart sustainable cities. The citizens can provide their experience, assist in data collection, impart democratic values, and represent the community’s need through active participation [107].

4.4. Control and CPL

Control means accountability to society. This predictor was significant for most of the performance outcomes as shown in Table 9, Table 10, Table 11 and Table 12. Table 7 and Table 8 indicated a p-value of >0.05 and a t-value = 0.000. Therefore, the performance outcome Manipulation and Theory are not significantly correlated to the predictor Control. Additionally, as shown in Table 14, Citizen Control has a p-value of >0.05 and t-value = 0.003, which indicated no significant correlation with the predictor Control. On the other hand, the performance outcomes of Information, Consultation, Placation, Partnership and Delegated Power have a significant correlation with a p-value of <0.01 and t-value > +2.269. Rosen and Painter [108] argue that the predictor Control should only extend partial community authority; it does not fundamentally alter the power imbalances between stakeholders that limit community influence over local decisions. It is also consistent with the arrangement of Rosen and Painter [108] that absolute Citizen Power could lead to dissipation in public services and resources. Therefore, it is recommended not to consider Citizen Control for the highest level of CP. Based on the results elaborated in Table 7, Table 8, Table 9, Table 10, Table 11, Table 12, Table 13 and Table 14, the predictor Control could significantly increase the performance outcome of CPL from Information to Delegated power. In other words, Control can range from hearing citizens’ voices (Information) to negotiating and possessing accurate decision making (Partnership) toward smart sustainable cities.

5. Conclusions

This study sought to establish the relationship between SMM and CPL to implement an SSC, enabling us to discover the predictors from different perspectives. An online questionnaire was utilised to collect data from practitioners (urban planners, architectural designers, and real estate developers), government representatives (FSCP officers from MOMRA UN-habitat and policymakers), and academics in the built environment. The participants agreed that SMM influenced the performance outcome of CPL with diverse stakeholders. The study found that the predictors of regulation, collaboration, legitimate, and control, as derived from SMT, are significant predictors of the CPL within Saudi Arabia. This study recommends stakeholders’ participation in smart city authorities to raise the level of CP by providing them with an opportunity to be part of the regulations, engaging them in the process, and as a basis for enhancing stakeholders’ involvement in all critical phases of strategic management in developing SSCs.
This study contributes to knowledge by examining the relationship between SMM that elevates CPL. This study shows a significant positive correlation between SMM and CPL regarding regulation, collaboration, legitimates, and control. These four predictors significantly contribute to escalating the engagement and empowerment of citizen participation (CP) to a higher level. However, the predictors are not correlated with all eight levels of performance outcomes. For instance, the predictor regulation escalates CPL from the manipulation level to the partnership level, while collaboration and legitimacy raise the CPL from the manipulation level to the delegated power level. The implication to practice is to raise citizen participation in urban development to achieve SSC. Fundamentally, the four predictors of SMM influence the stakeholders including the government policy, decision-makers and urban planning practitioners which constitute the level of citizen participation that can be considered and promote more inclusive participation in the community which supports the implementation of an SSC. Few empirical studies have examined these predictors in citizen participation in implementing an SSC. Consequently, this study provides a better understanding of factors that influence CPL, which, in turn, will contribute to the development and implementation of SSC.
Some inherited limitations affect the findings of this study. The response rate is low, although 245 responses are generally adequate compared to other studies. The FSCP is currently implemented in 17 pilot cities, so further research should be conducted nationwide when this program is fully rolled out to improve the overall generalisation. Hence, the findings from this study should be generalised with caution. Moreover, the data collection was limited to participants in Saudi Arabia only, with a need for more diversity in the survey respondents. Although most urban professionals in Saudi Arabia are male, efforts were made to include female respondents. Additionally, we could have improved the inclusion of ordinary citizens with a solid connection to urban development. Therefore, the views of women professionals on citizen participation will be addressed in future studies when their representation in the industry improves. Finally, this study focuses on SMM and CPL through a survey instrument. Furthermore, future research could be an in-depth examination through a qualitative approach such as focus groups, the Delphi method or interviews. Considering these limitations gives in-depth insight and understanding of how SSCs could achieve success by increasing the CPL in developing countries.

Supplementary Materials

The following supporting information can be downloaded at: https://www.mdpi.com/article/10.3390/su142416617/s1, File S1: Questionnaire.

Author Contributions

Conceptualisation, A.K.A., R.B.A. and T.Y.M.L.; methodology, A.K.A., R.B.A. and T.Y.M.L.; software, A.K.A.; validation, A.K.A., R.B.A. and T.Y.M.L.; formal analysis, A.K.A.; investigation, R.B.A. and T.Y.M.L.; resources, A.K.A., R.B.A. and T.Y.M.L.; data curation, A.K.A.; writing—original draft preparation, A.K.A.; writing—review and editing, R.B.A. and T.Y.M.L.; visualisation, A.K.A., R.B.A. and T.Y.M.L.; supervision, R.B.A. and T.Y.M.L.; project administration, A.K.A., R.B.A. and T.Y.M.L. All authors have read and agreed to the published version of the manuscript.

Funding

This research received no external funding.

Institutional Review Board Statement

Not applicable.

Informed Consent Statement

Not applicable.

Data Availability Statement

Data can be made available upon request to the corresponding author.

Acknowledgments

This paper forms part of a larger research project which focuses on citizen participation to support the implementation of smart sustainable cities from which other papers will be produced with a different objective/scope but sharing the same background and methodology. The Saudi Arabia government, represented by Imam Abdulrahman Bin Faisal University (IAU), is appreciated for their internal financial sponsorship and other support for this PhD study.

Conflicts of Interest

The authors declare no conflict of interest.

References

  1. Shaw, D.; Sturzaker, J.; Brodie, K.; Sykes, O.; Dembski, S.; Sahar, A. Mell Urban Planning Reviews: Governance of Planning, Local Planning and Urban Management; University of Liverpool: Liverpool, UK, 2016. [Google Scholar]
  2. Petesch, P.; Smulovitz, C.; Walton, M. Evaluating empowerment: A framework with cases from Latin America. In Measuring Empowerment: Cross-Disciplinary Perspectives; World Bank Press: Cambridge, MA, USA, 2005; pp. 39–67. [Google Scholar]
  3. TIBfRa Development. World Development Report, Making Services Work for Poor People; Oxford University Press: Oxford, UK, 2004. [Google Scholar]
  4. Erete, S.; Burrell, J.O. Empowered Participation: How Citizens Use Technology in Local Governance. In Proceedings of the 2017 CHI Conference on Human Factors in Computing Systems, ACM, New York, NY, USA, 2 May 2017. [Google Scholar]
  5. Gaber, J. Building “A Ladder of Citizen Participation”: Sherry Arnstein, Citizen Participation, and Model Cities. J. Am. Plan. Assoc. 2019, 85, 188–201. [Google Scholar] [CrossRef]
  6. Sigwejo, A.; Pather, S. A citizen-centric framework for assessing e-government effectiveness. Electron. J. Inf. Syst. Dev. Ctries. 2016, 74, 1–27. [Google Scholar] [CrossRef] [Green Version]
  7. Narayan, D. Bonds and Bridges: Social Capital and Poverty. Social Capital Economic Development: Well-Being in Developing Countries; World Bank Group: Washington, DC, USA, 2002; pp. 58–81. [Google Scholar]
  8. Sartori, G. The Theory of Democracy Revisited; Chatham House Pub: London, UK, 1987; Volume 1. [Google Scholar]
  9. Dahl, R.A. Democracy and Its Critics; Yale University Press: London, UK, 2008. [Google Scholar]
  10. Schumpeter, J.A. Capitalism, socialism and democracy. J. Econ. Lit. 1976, 20, 1463. [Google Scholar]
  11. Martin, C.; Evans, J.; Karvonen, A.; Paskaleva, K.; Yang, D.; Linjordet, T. Smart-sustainability: A new urban fix? Sustain. Cities Soc. 2019, 45, 640–648. [Google Scholar] [CrossRef]
  12. Ahvenniemi, H.; Huovila, A.; Pinto-Seppä, I.; Airaksinen, M. What are the differences between sustainable and smart cities? Cities 2017, 60, 234–245. [Google Scholar] [CrossRef]
  13. Silva, B.N.; Khan, M.; Han, K. Towards sustainable smart cities: A review of trends, architectures, components, and open challenges in smart cities. Sustain. Cities Soc. 2018, 38, 697–713. [Google Scholar] [CrossRef]
  14. Yigitcanlar, T.; Kamruzzaman, M.; Foth, M.; Sabatini-Marques, J.; Da-Costa, E.; Ioppolo, G. Can cities become smart without being sustainable? A systematic review of the literature. Sustain. Cities Soc. 2019, 45, 348–365. [Google Scholar] [CrossRef]
  15. Bibri, S.E.; Krogstie, J. Smart sustainable cities of the future: An extensive interdisciplinary literature review. Sustain. Cities Soc. 2017, 31, 183–212. [Google Scholar] [CrossRef]
  16. Singh, T.; Solanki, A.; Sharma, S.K.; Nayyar, A.; Paul, A. A Decade Review on Smart Cities: Paradigms, Challenges and Opportunities. IEEE Access 2022, 10, 68319–68364. [Google Scholar] [CrossRef]
  17. Bhattacharya, S.; Somayaji, S.R.K.; Gadekallu, T.R.; Alazab, M.; Maddikunta, P.K.R. A review on deep learning for future smart cities. Internet Technol. Lett. 2022, 5, e187. [Google Scholar] [CrossRef]
  18. Blasi, S.; Ganzaroli, A.; de Noni, I. Smartening sustainable development in cities: Strengthening the theoretical linkage between smart cities and SDGs. Sustain. Cities Soc. 2022, 80, 103793. [Google Scholar] [CrossRef]
  19. Andone, D.; Holotescu, C.; Grosseck, G. Learning Communities in Smart Cities. Case Studies. In Proceedings of the 2014 International Conference on Web and Open Access to Learning (ICWOAL), IEEE, Dubai, United Arab Emirates, 25–27 November 2014. [Google Scholar]
  20. Caragliu, A.; del Bo, C.; Nijkamp, P. Smart cities in Europe. VU University Amsterdam, Faculty of Economics, Business Administration and Econometrics, Serie Research Memoranda. J. Urban Technol. 2009, 18, 65–82. [Google Scholar] [CrossRef]
  21. Stimmel, C. Building Smart Cities, 1st ed.; Auerbach Publications: New York, NY, USA, 2015. [Google Scholar]
  22. Lim, S.; Malek, J.A.; Hussain, M.Y.; Tahir, Z. Citizen participation in building citizen-centric smart cities. Malays. J. Soc. Space 2018, 14, 42–53. [Google Scholar] [CrossRef] [Green Version]
  23. Vázquez, A.N.; Vicente, M.R. Exploring the determinants of e-participation in smart cities. In E-Participation in Smart Cities: Technologies and Models of Governance for Citizen Engagement; Springer: Berlin/Heidelberg, Germany, 2019; pp. 157–178. [Google Scholar]
  24. Franklin, A.L.; Ebdon, C. Citizen participation: Looks good on paper but hard to do in practice. In Proceedings of the Annual Meeting of the ABFM Conference, Kansas City, MO, USA, 3–5 May 2002. [Google Scholar]
  25. Robbins, M.D.; Simonsen, B.; Feldman, B. Citizens and resource allocation: Improving decision making with interactive web-based citizen participation. Public Adm. Rev. 2008, 68, 564–575. [Google Scholar] [CrossRef]
  26. De Witte, K.; Geys, B. Citizen coproduction and efficient public good provision: Theory and evidence from local public libraries. Eur. J. Oper. Res. 2013, 224, 592–602. [Google Scholar] [CrossRef] [Green Version]
  27. EIP-SCC. European Innovation Partnership on Smart Cities and Communities. 2019. Available online: https://eu-smartcities.eu/ (accessed on 1 December 2022).
  28. Alamoudi, A.K.; Abidoye, R.B.; Lam, T.Y. Critical Review of Citizens’ Participation in Achieving Smart Sustainable Cities: The Case of Saudi Arabia, in International Summit Smart City 360°; Paiva, S., Ed.; Springer: Berlin/Heidelberg, Germany, 2022; pp. 434–454. [Google Scholar]
  29. Llacuna, M.; Lluïsa, M. City indicators on social sustainability as standardization technologies for smarter (Citizen-Centered) governance of cities. An International and Interdisciplinary. J. Qual. Life Meas. 2016, 128, 1193–1216. [Google Scholar]
  30. Verma, N.; Singh, S.; Misra, D.P. Citizen Participation in the Process of ICT Enabled Governance: A Case Study. In Proceedings of the 1st International Conference on Theory and Practice of Electronic Governance, ACM, New York, NY, USA, 10 December 2007. [Google Scholar]
  31. Vrabie, C.; Tirziu, A. E-Participation–A Key Factor in Developing Smart Cities; EIRP Proceedings; University Library of Munich: Munich, Germany, 2016. [Google Scholar]
  32. Greve, K.; Leminen, S.; De Vita, R.; Westerlund, M. Unveiling The Diversity Of Scholarly Debate On Living Labs: A Bibliometric Approach. Int. J. Innov. Manag. 2020, 24, 2040003. [Google Scholar] [CrossRef]
  33. Niitamo, V.-P.; Niitamo, V.P.; Kulkki, S.; Eriksson, M.; Hribernik, K.A. State-of-the-art and good practice in the field of living labs. In Proceedings of the 12th International Conference on Concurrent Enterprising: Innovative Products and Services Through Collaborative Networks, Milan, Italy, 26–28 June 2006. [Google Scholar]
  34. Schuurman, D. Bridging the Gap between Open and User Innovation?: Exploring the Value of Living Labs as a Means to Structure User Contribution and Manage Distributed Innovation; Vrije Universiteit Brussel, Faculty of Economic and Social Sciences, Ghent: Brussels, Belgium, 2015. [Google Scholar]
  35. European Network of Living Labs. What are Living Labs. Available online: https://enoll.org/about-us/ (accessed on 10 December 2022).
  36. Praharaja, S.; Hanb, J.H.; Hawkenc, S. Innovative civic engagement and digital urban infrastructure: Lessons from 100 smart cities mission in India. Procedia Eng. 2016, 180, 1423–1432. [Google Scholar] [CrossRef]
  37. Gomes, R.C.; Gomes, L.d.O.M. In search of a stakeholder management theory for third sector organizations. Revista Contabilidade. Gestão e Governança 2015, 1, 18. [Google Scholar]
  38. Arnstein, S.R. A ladder of citizen participation. J. Am. Inst. Plan. 1969, 35, 216–224. [Google Scholar] [CrossRef] [Green Version]
  39. Yang, K.; Pandey, S.K. Further dissecting the black box of citizen participation: When does citizen involvement lead to good outcomes? Public Adm. Rev. 2011, 71, 880–892. [Google Scholar] [CrossRef]
  40. Bouzguenda, I.; Alalouch, C.; Nadia, F. Towards smart sustainable cities: A review of the role digital citizen participation could play in advancing social sustainability. Sustain. Cities Soc. 2019, 50, 101627. [Google Scholar] [CrossRef]
  41. Burke, E.M. Citizen Participation Strategies. J. Am. Inst. Plan. 1968, 34, 287–294. [Google Scholar] [CrossRef]
  42. Bourne, L. Levels of Stakeholder Engagement. 2017. Available online: https://stakeholdermanagement.wordpress.com/2017/08/21/levels-of-stakeholder-engagement/ (accessed on 10 December 2022).
  43. Joint Research, C.E. Institute for, and Sustainability, Citizen science and smart cities: Report of summit Ispra, 5–7th February 2014; Publications Office: Luxembourg City, Luxembourg, 2014. [Google Scholar]
  44. Leal Filho, W.; Marisa Azul, A.; Brandli, L.; Gökçin Özuyar, P.; Wall, T. Sustainable Cities and Communities; Springer: Berlin/Heidelberg, Germany, 2020. [Google Scholar]
  45. Schaffers, H.; Komninos, N.; Pallot, M.; Trousse, B.; Nilsson, M.; Oliveira, A. Smart Cities and the Future Internet: Towards Cooperation Frameworks for Open Innovation. In The Future Internet; Springer: Berlin/Heidelberg, Germany, 2011. [Google Scholar]
  46. Albino, V.; Berardi, U.; Dangelico, R.M. Smart Cities: Definitions, Dimensions, Performance, and Initiatives. J. Urban Technol. 2015, 22, 3–21. [Google Scholar] [CrossRef]
  47. Allam, Z.; Newman, P. Redefining the Smart City: Culture, Metabolism and Governance. Smart Cities 2018, 1, 4–25. [Google Scholar] [CrossRef] [Green Version]
  48. McFarlane, C.; Söderström, O. On alternative smart cities. City 2017, 21, 312–328. [Google Scholar] [CrossRef] [Green Version]
  49. Garba, S.B. Managing urban growth and development in the Riyadh metropolitan area, Saudi Arabia. Habitat Int. 2004, 28, 593–608. [Google Scholar] [CrossRef]
  50. Wu, W.; Kang, X. The design and realization of digital urban management system. Appl. Mech. Mater. 2013, 256–259, 2354–2358. [Google Scholar] [CrossRef]
  51. Heikkurinen, P.; Bonnedahl, K.J. Corporate responsibility for sustainable development: A review and conceptual comparison of market-and stakeholder-oriented strategies. J. Clean. Prod. 2013, 43, 191–198. [Google Scholar] [CrossRef]
  52. Matos, S.; Silvestre, B.S. Managing stakeholder relations when developing sustainable business models: The case of the Brazilian energy sector. J. Clean. Prod. 2013, 45, 61–73. [Google Scholar] [CrossRef]
  53. Gomes, R.C.; Liddle, J.; Gomes, L.O.M. A five-sided model of stakeholder influence: A cross-national analysis of decision making in local government. Public Manag. Rev. 2010, 12, 701–724. [Google Scholar] [CrossRef]
  54. Granier, B.; Kudo, H. How are citizens involved in smart cities? analysing citizen participation in Japanese “Smart Communities”. Inf. Polity 2016, 21, 61–76. [Google Scholar] [CrossRef]
  55. Freeman, R.E.; Reed, D. Stockholders and stakeholders: A new perspective on corporate governance. Calif. Manag. Rev. 1983, 25, 88–106. [Google Scholar] [CrossRef]
  56. Mitchell, R.K.; Agle, R.; Wood, D.J. Toward a theory of stakeholder identification and salience: Defining the principle of who and what really counts. Acad. Manag. Rev. 1997, 22, 853–886. [Google Scholar] [CrossRef]
  57. Freeman, R.E.; Harrison, J.S.; Wicks, A.C. Managing for Stakeholders: Survival, Reputation, and Success; Yale University Press: London, UK, 2007. [Google Scholar]
  58. Wembe, P.T. Conceptual stakeholder theory In project management. In Proceedings of the International Structural Engineering and Construction, ISEC, Pune, India, 14–16 February 2019. [Google Scholar]
  59. Ranängen, H. Stakeholder management theory meets CSR practice in Swedish mining. Miner. Econ. 2017, 30, 15–29. [Google Scholar] [CrossRef] [Green Version]
  60. Habisch, A.; Patelli, L.; Pedrini, M.; Schwartz, C. Different Talks with Different Folks: A Comparative Survey of Stakeholder Dialog in Germany, Italy, and the U.S. J. Bus. Ethics 2011, 100, 381–404. [Google Scholar] [CrossRef]
  61. De Colle, F.; Raga, A. Interaction of Herbig—Haro objects with molecular cloud and generation of Alfvén waves. Mon. Not. R. Astron. Soc. 2005, 359, 164–170. [Google Scholar] [CrossRef] [Green Version]
  62. Donaldson, T.; Preston, L.E. The stakeholder theory of the corporation: Concepts, evidence, and implications. Acad. Manag. Rev. 1995, 20, 65–91. [Google Scholar] [CrossRef]
  63. Post, J.E.; Preston, L.E.; Sachs, S. Managing the extended enterprise: The new stakeholder view. Calif. Manag. Rev. 2002, 45, 6–28. [Google Scholar] [CrossRef]
  64. Berman, S.L.; Wicks, A.C.; Kotha, S.; Jones, T.M. Does stakeholder orientation matter? The relationship between stakeholder management models and firm financial performance. Acad. Manag. J. 1999, 42, 488–506. [Google Scholar] [CrossRef]
  65. Pedrini, M.; Ferri, L.M. Stakeholder management: A systematic literature review. Corp. Gov. Int. J. Bus. Soc. 2019, 19, 44–59. [Google Scholar] [CrossRef]
  66. Parmar, B.L.; Wicks, A.C.; Freeman, R.E. Stakeholder Management & The Value of Human-Centred Corporate Objectives. J. Manag. Stud. 2022, 59, 569–582. [Google Scholar]
  67. Amaeshi, K.M.; Crane, A. Stakeholder engagement: A mechanism for sustainable aviation. Corp. Soc. Responsib. Environ. Manag. 2006, 13, 245–260. [Google Scholar] [CrossRef]
  68. Pruzan, P. From Control to Values-Based Management and Accountability. J. Bus. Ethics 1998, 17, 1379–1394. [Google Scholar] [CrossRef]
  69. Matten, D.; Crane, A. What is stakeholder democracy? Perspectives and issues. Bus. Ethics A Eur. Rev. 2005, 14, 6–13. [Google Scholar] [CrossRef]
  70. Osei-Kyei, R.; Chan, A.P. Model for predicting the success of public–private partnership infrastructure projects in developing countries: A case of Ghana. Archit. Eng. Des. Manag. 2019, 15, 213–232. [Google Scholar] [CrossRef] [Green Version]
  71. Draper, N.R.; Smith, H. Applied Regression Analysis; John Wiley & Sons: Hoboken, NJ, USA, 1998; Volume 326. [Google Scholar]
  72. Green, P.J.; Silverman, B.W. Nonparametric Regression and Generalized Linear Models: A Roughness Penalty Approach; CRC Press: Boca Raton, FL, USA, 1993. [Google Scholar]
  73. Hastings, S.L. Encyclopedia of Research Design; SAGE Publications, Inc.: Thousand Oaks, CA, USA, 2010. [Google Scholar]
  74. Lam, T.Y. The impact of management measures on performance of outsourced professional housing maintenance services. Prop. Manag. 2008, 26, 112–124. [Google Scholar] [CrossRef]
  75. Pratama, A.; Imawan, S. A Scale for Measuring Perceived Bureaucratic Readiness for Smart Cities. Public Adm. Policy Asia-Pac. J. 2019, 22, 25–39. [Google Scholar] [CrossRef] [Green Version]
  76. Niezabitowska, E.D. Research Methods and Techniques in Architecture; Routledge: London, UK, 2018; pp. 138–260. [Google Scholar]
  77. Akins, R.; Tolson, H.; Cole, B. Stability of response characteristics of a Delphi panel: Application of bootstrap data expansion. BMC Med. Res. Methodol. 2005, 5, 37. [Google Scholar] [CrossRef] [Green Version]
  78. Osei-Kyei, R. A Best Practice Framework For Public Private Partnership Implementation For Infrastructure Development in Chana, in Department of Building and real Estate; The Hong Kong Polytechnic University: Hong Kong, China, 2018; p. 433. [Google Scholar]
  79. Patton, M.Q. Qualitative Research. Encyclopedia of Statistics in Behavioral Science; John Wiley & Sons, Inc.: Hoboken, NJ, USA, 2005. [Google Scholar]
  80. Etikan, I.; Musa, S.A.; Alkassim, R.S. Comparison of convenience sampling and purposive sampling. Am. J. Theor. Appl. Stat. 2016, 5, 1–4. [Google Scholar] [CrossRef] [Green Version]
  81. Yager, J.; Kunkle, R.; Fochtmann, L.J.; Reid, S.M.; Plovnick, R.; Nininger, J.E.; Silverman, J.J.; Vergare, M.J. Who’s your expert? use of an expert opinion survey to inform development of American psychiatric Association practice guidelines. Acad. Psychiatry 2014, 38, 376–382. [Google Scholar] [CrossRef] [PubMed]
  82. Pallant, J. A Step by Step Guide to Data Analysis Using SPSS Survival Manual, 6th ed.; McGraw-Hill Education: Berkshire, UK, 2016. [Google Scholar]
  83. Stevens, R. Understanding the Self; Sage: Newcastle Upon Tyne, UK, 1996; Volume 1. [Google Scholar]
  84. Coakes, S.J.; Steed, L.G. SPSS: Analysis without Anguish; Steed, L.G., Ed.; John Wiley & Sons: Hoboken, NJ, USA, 2003. [Google Scholar]
  85. Ke, F. A qualitative meta-analysis of computer games as learning tools. In Gaming and Simulations: Concepts, Methodologies, Tools and Applications; IGI Global: Hershey, PA, USA, 2011; pp. 1619–1665. [Google Scholar]
  86. Bangor, A.; Kortum, P.; Miller, J. Determining what individual SUS scores mean: Adding a subjective rating scale. J. Usability Stud. 2009, 4, 114–123. [Google Scholar]
  87. Cheung, E.; Chan, A.P. Risk factors of public-Private partnership projects in China: Comparison between the water, power, and transportation sectors. J. Urban Plan. Dev. 2011, 137, 409–415. [Google Scholar] [CrossRef] [Green Version]
  88. Gliem, J.A.; Gliem, R.R. Calculating, Interpreting, and Reporting Cronbach’s Alpha Reliability Coefficient for Likert-type Scales. In Proceedings of the Midwest Research-to-Practice Conference in Adult, Continuing, and Community; Ohio State University: Columbus, OH, USA, 2003. [Google Scholar]
  89. Zhu, W.; Yan, R.; Song, Y. Analysing the impact of smart city service quality on citizen engagement in a public emergency. Cities 2022, 120, 103439. [Google Scholar] [CrossRef] [PubMed]
  90. Hayu, R.; Surachman, S.; Rofiq, A.; Rahayu, M. The effect of website quality and government regulations on online impulse buying behavior. Manag. Sci. Lett. 2020, 10, 961–968. [Google Scholar] [CrossRef]
  91. Koopmans, L.; Bernaards, C.M.; Hildebrandt, V.H.; de Vet, H.C.W.; van der Beek, A.J. Construct Validity of the Individual Work Performance Questionnaire. J. Occup. Environ. Med. 2014, 56, 331–337. [Google Scholar] [CrossRef] [Green Version]
  92. Steger, S.; Mair, V.; Kofler, C.; Pittore, M.; Zebisch, M.; Schneiderbauer, S. Correlation does not imply geomorphic causation in data-driven landslide susceptibility modelling–Benefits of exploring landslide data collection effects. Sci. Total Environ. 2021, 776, 145935. [Google Scholar] [CrossRef]
  93. Alshamrani, O.; Alshibani, A.; Mohammed, A. Operational Energy and Carbon Cost Assessment Model for Family Houses in Saudi Arabia. Sustainability 2022, 14, 1278. [Google Scholar] [CrossRef]
  94. Akoglu, H. User’s guide to correlation coefficients. Turk. J. Emerg. Med. 2018, 18, 91–93. [Google Scholar] [CrossRef]
  95. Ahadzie, D.; Proverbs, D.; Olomolaiye, P. Critical success criteria for mass house building projects in developing countries. Int. J. Proj. Manag. 2008, 26, 675–687. [Google Scholar] [CrossRef]
  96. Lam, T.Y.M. A performance outcome framework for appraising construction consultants in the university sector. J. Facil. Manag. 2016, 14, 249–265. [Google Scholar] [CrossRef]
  97. Ventriss, C.; Barber, B.; Boyte, H.C.; Crenson, M.A.; Gran, G.; Susskind, L.; Elliott, M. Emerging Perspectives on Citizen Participation. Public Adm. Rev. 1985, 45, 433–440. [Google Scholar] [CrossRef]
  98. Madsen, H.; Ulhøi, J.P. Integrating environmental and stakeholder management. Bus. Strategy Environ. 2001, 10, 77–88. [Google Scholar] [CrossRef]
  99. Coglianese, C. Citizen participation in rulemaking: Past, present, and future. Duke LJ 2005, 55, 943. [Google Scholar]
  100. Dean, R.J. Counter-governance: Citizen participation beyond collaboration. Politics Gov. 2018, 6, 180–188. [Google Scholar] [CrossRef]
  101. Evans, A.M.; Campos, A. Open government initiatives: Challenges of citizen participation. J. Policy Anal. Manag. 2013, 32, 172–185. [Google Scholar] [CrossRef]
  102. Clement, J.; Manjon, M.; Crutzen, N. Factors for collaboration amongst smart city stakeholders: A local government perspective. Gov. Inf. Q. 2022, 39, 101746. [Google Scholar] [CrossRef]
  103. Häikiö, L. From Innovation to Convention: Legitimate Citizen Participation in Local Governance. Local Gov. Stud. 2012, 38, 415–435. [Google Scholar] [CrossRef]
  104. Connelly, B.L.; Certo, S.T.; Ireland, R.D.; Reutzel, C.R. Signaling theory: A review and assessment. J. Manag. Stud. 2011, 37, 39–67. [Google Scholar] [CrossRef]
  105. Papadopoulos, Y. Cooperative forms of governance: Problems of democratic accountability in complex environments. Eur. J. Political Res. 2003, 42, 473–501. [Google Scholar] [CrossRef]
  106. Sunshine, J.; Tyler, T.R.; Review, S. The role of procedural justice and legitimacy in shaping public support for policing. Law 2003, 37, 513–548. [Google Scholar] [CrossRef]
  107. Jang, S.-G.; Gim, T.-H.T. Considerations for Encouraging Citizen Participation by Information-Disadvantaged Groups in Smart Cities. Sustain. Cities Soc. 2022, 76, 103437. [Google Scholar] [CrossRef]
  108. Rosen, J.; Painter, G. From Citizen Control to Co-Production. J. Am. Plan. Assoc. 2019, 85, 335–347. [Google Scholar] [CrossRef]
Figure 1. The Ladder of Citizen Participation. Adapted from: Arnstein [38].
Sustainability 14 16617 g001
Figure 2. Two Tier Stakeholders. Adapted from: Freeman, Harrison and Wicks [57] and Ranängen [59].
Sustainability 14 16617 g002
Figure 3. The Relationship Between Stakeholders. Source: Mitchell, Agle and Wood [56].
Sustainability 14 16617 g003
Figure 4. Normal probability plot from residual analysis.
Sustainability 14 16617 g004
Table 1. Stakeholders Management Measures.
PredictorsComponentSource
RegulationThe level of empowermentGomes and Gomes [37]
CollaborationThe level of engagementGomes and Gomes [37,53]
LegitimatesComply with regulationGomes and Gomes [37,53];
ControlAccountability to societyPruzan [68]; Matten and Crane [69]
Table 2. Statistics for the demographic variables.
VariablesFrequency (n = 245)Percentage
GenderMale20182.0
Female4317.6
Others10.4
Age18–29114.5
30–397530.6
40–499639.2
50– and above6325.7
Level of EducationBachelor’s degree11747.8
Diploma62.4
Masters4116.8
PhD 6727.3
Others145.7
Field of ProfessionArchitecture3915.9
Urban Planning10844.1
Business Management4217.1
Civil Engineering62.5
IT3915.9
Others,114.5
Sector of PracticePublic Sector (FSCP %30)13856.3
Private Sector7831.8
Academia26 10.6
Freelance31.3
Years of Experience0–593.7
6–10156.1
11–154819.6
16–2011848.2
21–more5522.4
Table 3. Reliability of data.
FactorsNumber of ItemsCronbach’s Alpha
Performance predictors
Regulation60.735
Collaboration50.648
Legitimates20.754
Control30.549
Performance outcomes
Manipulation10.465
Therapy10.438
Information10.633
Consultation10.638
Placation10.763
Partnership10.784
Delegated_Power10.564
Citizen_Control10.562
Table 4. Ranking of Performance Predictors.
Mean ScoreSD *Rank
Regulation
Stakeholder management measures in Saudi cities have positively affected the level of citizen participation.3.86640.829271
Saudi cities adopt the concept of citizen participation.3.76270.905572
Saudi cities have stimulated regulations towards increased participation.2.74151.074333
Saudi cities adopt to manage external stakeholders in delivery smart cities.2.51931.067074
Smart cities provide a vision towards an ideal future city.2.48731.020985
The local government typically allocate a certain amount of funding for civic engagement in a smart city project.2.44920.97286
Collaboration
Tapping citizens’ knowledge and experience3.42491.072651
Saudi cities explore what products and services can be provided to citizens2.70391.083912
Stakeholders engage and involve citizens in urban development 2.66381.061923
Stakeholders adopt citizens so they become more credible data producers2.61141.060484
Legitimate
Stakeholders adopt local government initiatives to meet citizens’ needs2.77731.020931
Stakeholders recruit and retain citizens to participate2.56331.013792
Control
Saudi cities adopt information and communication technology to increase citizen participation3.76820.941121
Stakeholders learn about citizens’ preferences2.47161.002332
The availability of sensory data in Saudi cities is enough2.10301.073843
* Standard Deviation.
Table 5. Ranking of Performance outcomes.
Mean ScoreSD *Rank
Partnership7.16800.691151
Placation4.31600.670782
Consultation3.47600.897023
Information3.29201.921854
Delegated Power1.93601.522365
Citizen Control1.26801.430796
Therapy1.47600.897027
Manipulation0.58000.746888
* Standard Deviation.
Table 6. Correlation coefficients among the input performance predictors SMM.
CP LevelRegulationCollaborationLegitimatesControl
CP Level1
Regulation0.8601
Collaboration0.7750.728 **1
Legitimates0.6630.549 **0.726 **1
Control 0.542 **0.564 **0.576 **0.694 **1
** Correlation is significant at the 0.01 level (2-tailed).
Table 7. Multiple regression results for performance predictors against Manipulation a.
Model/PredictorUnstandardised CoefficientsStandardised Coefficientsp-ValueSig. F
BStd. ErrorBeta
1(Constant)−0.040.086
Regulation b0.3370.0310.3360.0150.722
Collaboration b0.2340.0290.2730.0180.743
Legitimates b0.2170.0210.3120.0090.695
Control b0.2520.0260.2840.0690.681
a. Dependent Variable: Manipulation. b. Predictors: Regulation, Collaboration, Legitimates, Control. F = 305.49, R2 = 0.756, Adj. R2 = 0.753.
Table 8. Multiple regression results for performance predictors against Therapy a.
Model/PredictorUnstandardised CoefficientsStandardised Coefficientsp-ValueSig. F
BStd. ErrorBeta
1(Constant)−0.080.172 0.642
Regulation b0.6740.0630.3360.0160
Collaboration b0.4690.0570.2730.0180
Legitimates b0.4350.0430.3120.0400
Control b0.5040.0520.2840.0340
a. Dependent Variable: Therapy. b. Predictors: Regulation, Collaboration, Legitimates, Control. F = 355.49, R2 = 0.856, Adj. R2 = 0.853.
Table 9. Multiple regression results for performance predictors against Information a.
Model/PredictorUnstandardised CoefficientsStandardised Coefficientsp-ValueSig. F
BStd. ErrorBeta
1(Constant)0.9660.056 0
Regulation b1.2410.0200.2710.0040
Collaboration b1.2750.0190.3250.0030
Legitimates b1.2540.0140.3940.0030
Control b1.2380.0170.3060.0070
a. Dependent Variable: Information. b. Predictors: Regulation, Collaboration, Legitimates, Control. F = 20,424, R2 = 0.804, Adj. R2 = 0.765.
Table 10. Multiple regression results for performance predictors against Consultation a.
Model/PredictorUnstandardised CoefficientsStandardised Coefficientsp-ValueSig. F
BStd. ErrorBeta
1(Constant)0.9590.067
Regulation b1.490.0240.2710.0010.724
Collaboration b1.530.0220.3250.0070.813
Legitimates b1.5040.0170.3940.0060.794
Control b1.4860.020.3060.0010.729
a. Dependent Variable: Consultation. b. Predictors: Regulation, Collaboration, Legitimates, Control. F = 20,424, R2 = 0.897, Adj. R2 = 0.882.
Table 11. Multiple regression results for performance predictors against Placation a.
Model/PredictorUnstandardised CoefficientsStandardised Coefficientsp-ValueSig. F
BStd. ErrorBeta
1(Constant)−0.3210.689 0.642
Regulation b2.6950.2510.3360.0020
Collaboration b1.8750.2290.2730.0090
Legitimates b1.7390.1710.3120.0080
Control b2.0140.2080.2840.0010
a. Dependent Variable: Placation. b. Predictors: Regulation, Collaboration, Legitimates, Control. F = 355.49, R2 = 0.856, Adj. R2 = 0.853.
Table 12. Multiple regression results for performance predictors against Partnership a.
Model/PredictorUnstandardised CoefficientsStandardised Coefficientsp-ValueSig. F
BStd. ErrorBeta
1(Constant)0.4010.085 0
Regulation b1.2590.0310.1330.0000
Collaboration b1.2590.0280.1550.0000
Legitimates b1.1880.0210.1810.0000
Control b6.2120.0260.7440.0000
a. Dependent Variable: Partnership. b. Predictors: Regulation, Collaboration, Legitimates, Control. F = 23.954, R2 = 0.758, Adj. R2 = 0.740.
Table 13. Multiple regression results for performance predictors against Delegated Power a.
Model/PredictorUnstandardised CoefficientsStandardised Coefficientsp-ValueSig. F
BStd. ErrorBeta
1(Constant)0.9320.665 0.162
Regulation b0.3640.2420.1050.1330.133
Collaboration b0.7570.2210.2540.0010.001
Legitimates b0.4230.1640.1750.0110.011
Control b0.4560.2010.1480.0240.024
a. Dependent Variable: Delegated Power. b. Predictors: Regulation, Collaboration, Legitimates, Control. F = 23.954, R2 = 0.285, Adj. R2 = 0.273.
Table 14. Multiple regression results for performing predictors against Citizen Control a.
Model/PredictorUnstandardised CoefficientsStandardised Coefficientsp-ValueSig. F
BStd. ErrorBeta
1(Constant)0.7250.415
Regulation b0.1920.1510.0870.3750.375
Collaboration b0.4650.1380.2460.4740.474
Legitimates b0.2970.1030.1930.4380.438
Control b0.3730.1260.190.4100.410
a. Dependent Variable: Citizen Control. b. Predictors: Regulation, Collaboration, Legitimates, Control. F = 27.190, R2 = 0.312, Adj. R2 = 0.300.
Publisher’s Note: MDPI stays neutral with regard to jurisdictional claims in published maps and institutional affiliations.

