Article

Assessing Provisions and Requirements for the Sustainable Production of Plastics: Towards Achieving SDG 12 from the Consumers’ Perspective

1
Research and Transfer Centre “Sustainable Development & Climate Change Management” (FTZ-NK), Faculty of Life Sciences, Hamburg University of Applied Sciences, Ulmenliet 20, 21033 Hamburg, Germany
2
Department of Natural Science, Manchester Metropolitan University, Chester Street, Manchester M1 5GD, UK
3
Faculty of Economics, Administrative and Social Sciences, Bahsesehir University, Istanbul 34349, Turkey
4
Management Convening Group, Anisfield School of Business, Ramapo College of New Jersey, Mahwah, NJ 07430, USA
5
GTDS Research Group, Universidad de Oviedo, C/Catedratico Valentin Alvarez s/n, 33006 Oviedo, Spain
6
Interdisciplinary Research on Society-Technology-Environment Interactions (InSyTE), Troyes University of Technology, 10300 Troyes, France
7
Department of Manufacturing Engineering and Materials, University of Campinas, São Paulo 13083-860, Brazil
8
Departamento de Ingeniería Industrial, Universidad Católica del Norte, Antofagasta 0610, Chile
9
Utrecht School of Economics, Utrecht University, Kriekenpitplein 21–22, 3584 EC Utrecht, The Netherlands
10
Industrial Engineering Department, University of Sonora, Blvd Luis Encinas y Rosales S/N, Hermosillo 83000, Mexico
11
Centre for Global Sustainability Studies, Universiti Sains Malaysia, Penang 11800, Malaysia
*
Author to whom correspondence should be addressed.
Sustainability 2022, 14(24), 16542; https://doi.org/10.3390/su142416542
Submission received: 8 November 2022 / Revised: 5 December 2022 / Accepted: 5 December 2022 / Published: 9 December 2022
(This article belongs to the Section Sustainable Management)

Abstract

:
Plastics are used widely, and modern civilization would have to behave differently without them. However, plastics pose a threat to sustainable life. This paper focuses on some of the provisions being made for sustainable production to date and focuses on one key sector-plastic manufacturing-where sustainable production patterns are urgently needed. The paper describes the latest trends related to plastic production, its environmental impacts, and how this sector is adjusting its processes in order to meet the current and forthcoming legal requirements and consumer demands. The methodological approach of the study has focused on both a literature review on the one hand and the consumers’ perspective obtained via a survey on the other. These two approaches were then crosschecked in order to assess current trends in plastic manufacturing and to understand how consumers see these trends as being consistent with the aims of the UN Sustainable Development Goal 12. The results obtained suggest that a greater engagement of consumers is needed in supporting the efforts to manage plastic more sustainably. Based on its findings, the paper provides useful insights linked to principles and tools for sustainable plastic production and design, and it demonstrates the usefulness and urgency of a sound materials management in order to tackle plastic pollution, one of today’s major environmental problems.

1. Introduction

The idea of sustainable production dates back 30 years when the United Nations Conference on Environment and Development (UNCD) recognized the “unsustainable patterns of consumption and production” as the main reason for the “continued deterioration of the global environment” [1]. Although the idea quickly became mainstream, over the years the definition of sustainable production was placed as a priority on the agendas of all relevant parties-government, academia and the private sector alike.
The definition of sustainable production can stem from that of sustainable consumption as defined at the above-mentioned 1994 Oslo Symposium, which confirmed “the broad international agreement that the matter of changing unsustainable patterns of production and consumption must be tackled on a priority basis” [2,3]. It would then refer to the design and supply of “services and related products which respond to basic needs and bring a better quality of life while minimizing the use of natural resources and toxic materials as well as the emissions of waste and pollutants over the life cycle of the service or product so as not to jeopardize the needs of future generations” [2,4]. Later, sustainable production was also defined as “the creation of goods and services using processes and systems that are: non-polluting; conserving of energy and natural resources; economically viable; safe and healthful for workers, communities, and consumers; and, socially and creatively rewarding for all working people” [5]. Of course, as a practical approach to achieving sustainable development, the definition of sustainable production processes may evolve together with the conception of sustainability and may mean different things to different people. Yet there is a gap in research on some overarching concepts. For instance, sustainable production is about continuous, systemic, and multi-level change in industrial systems and processes. Yet, studies on how to foster more eco-efficient production, less environmental degradation from cleaner technologies and further decoupling from ecological impacts in the creation of wealth are needed. Also, further measures are necessary for the implementation of lifecycle thinking and the control of rebound effects (i.e., where growing consumption compensates for technological and efficiency gains). It is against this background that this study has been undertaken. The next section provides an outline of the needs in assessing sustainable production processes. Section 2 presents an overview of the methods used, whereas Section 3 presents the results obtained. These are discussed in Section 4, whereas Section 5 provides some conclusions and describes some future prospects.

Need for Assessing Sustainable Production Processes

Regardless of how one defines sustainable production systems and processes, the public, businesses and governments, have recognized the need for them. In academia, Nash [6] discussed decoupling economic growth from resource use through mandatory quantifiable targets and deadlines across sectors. Haas et al. [7] stressed the importance of assessing the circularity of the global economy’s metabolism. Mont and Plepys [8] and Kalmykova et al. [9] showed that while many environmental strategies do not fully address environmental impacts induced by increased consumption, they rely on the improvement of resource productivity and eco-efficiency of processes and products.
Bengtsson et al. [10] re-asserted the seminal distinction from the 1995 “Oslo Roundtable” between two perspectives: one stressing the need to consider overall volumes of consumption and related social, distributional and institutional changes and the other focused on promoting more efficient production methods and products, which contain essential (yet probably not sufficient) elements of a transition. In the framework of the EU’s sustainable development policy, Pineiro-Villaverde and García-Álvarez [11] highlighted the role of resource productivity for waste prevention, recycling and an energy/resource-efficient circular economy. Previous studies have included various sectors, e.g., textile [12], energy [13], construction [14] and food [15].
With the introduction of the Sustainable Development Goals of the United Nations, sustainable production is identified as a standalone goal (Goal 12, which calls to “ensure sustainable consumption and production patterns”), and as a central component of many other goals and the accompanying 169 targets agreed in the agenda to help benchmark progress. Analyzing SDG 12, Bengtsson et al. [10] found that in its current conception, SDG 12 mainly relies on what they call the “efficiency” approach, which is centered on sustainable production processes.
As a result of the aforementioned drive for a good definition of sustainable production, relevant assessment methods have also been introduced. Although there is no globally accepted assessment method, tools developed for this purpose are summarized in Table 1.
Bioplastics play an important role when it comes to more sustainable plastic solutions (Figure 1).
Whereas the use of bioplastics has many advantages and they can be part of the circular economy, there are some risks associated with their use. These include the risk of using raw materials which are earmarked for food production, the amount of energy needed to produce and process bioplastic, the problems associated with the biodegrability of some feedstock, and, in the after-use side, the risks associated with micro-plastics deriving from bioplastics. All these elements need to be taken into account and guide current and future decisions on bioplastics use.
Finally, this study aims to assess current plastic manufacturing trends via a literature review and explore how those trends are seen by the consumers through the use of a questionnaire in order to recommend further actions.

2. Methodology

From a conceptual point of view, the methodological approach proposed in this study consists of determining provisions and requirements for the sustainable production of plastics as part of the statement in SDG 12: Ensure sustainable consumption and production patterns. However, from a practical perspective, the methodology consists of three steps described in Figure 2. In Step 1, trends in manufacturing were characterized through an in-depth literature review. In Step 2, the consumers’ perspective on the plastics production trends was assessed. For this purpose, a questionnaire was developed and distributed worldwide to gather insights from consumers to be later compared to those of academia (literature review data). In Step 3, an assessment of the findings is performed, with the results described in Section 3 and discussed in Section 4.
Step 1. Trends in plastics production–an overview.
Some keywords such as “plastics sector”, “sustainable production”, “negative models of plastics production”, “sustainable plastics production processes” and “challenges for creating sustainable plastics” were used to explore contributions related to the plastic industry. Environmental impacts, reduction, re-use, and recycling of plastics were the topics examined in the literature, which served to structure this overview, debate their relevance to the reader’s understanding of the theme, and formalize the text.
Step 2. Trends in plastics production–consumers´ perspective.
The SDG 12 marks the road to sustainable development by advocating responsible consumption and production. Hence, both consumers and producers play a major role, which is highlighted by the SDG targets 12.6 and 12.8. While the former promotes the adoption of sustainable practices and the strengthening of corporate sustainability reporting, the latter focuses on providing people with public-relevant information and awareness about sustainable development. Therefore, a questionnaire was designed to appraise insights of individuals associated with conventional plastics and bioplastics in two aspects: (1) knowledge and awareness and (2) usage and attitudes towards them. The questionnaire was introduced to LIME, the survey platform owned by Hamburg University of Applied Sciences, and was previously checked with the university data protection officer. Prior to its distribution, the questionnaire was pretested by 10 experts in the field and the feedback were collected and analysed by the authors, and if relevant, implemented. After undertaking a pre-test, an electronic survey in English was circulated to the international general public involving diverse backgrounds via social and professional networks. In this sense, the sampling can be characterized as non-probabilistic by judgment. Although the findings obtained cannot be generalized, the overview provided can be helpful for exploratory studies [33]. Data were collected from 19 January to 11 May 2021. The survey was structured in three parts: i. Demographic data; ii. Knowledge and awareness about conventional plastics and bioplastics; iii. Usage and attitudes towards conventional plastics and bioplastics. A set of questions was elaborated for each of these three parts. As a result, the questionnaire was constituted of 26 questions (four questions on demography, eight questions on knowledge and awareness, and 14 questions on usage and attitudes). Table 2 summarizes the main content of the questions within these three parts, and all 26 questions are available in Appendix A.

Statistical Treatment of Data

A descriptive statistical analysis of data was collected, including the Pearson chi-squared test, to identify relationships among critical questions.
Step 3. Discussion-Literature review vs. consumers’ perception.
The final part of the methodology encompassed a discussion of the findings. The authors contrasted outcomes from the literature review on consumers’ perceptions and behaviors towards bio-based products with the findings from the statistical analysis. As the number of articles that analyse consumers’ perceptions and behaviour towards bioplastics was not high, a broader literature search based on bio-based products was also considered. The discussion took those articles into account to be compared with the statistical analysis performed. The central findings from this literature relate to the price and attributes of bio-based products and the level of development of the economies. As such, the discussion was focused on these two key aspects.

3. Results

3.1. Trends in Plastics Production—An Overview

Although plastic seems to be the ideal raw material for industrial processes at first glance, its disadvantages regarding sustainability have become evident [34,35,36]). Pollution stemming from existing models of plastic production poses a global threat to humans and the environment, since most plastics originate from non-renewable petrochemical-based feedstock, including natural gas, crude oil, and natural gas derivatives [37].
Focus on more sustainable plastic production is trending now, and new business models are developing in this direction. A business model for sustainable plastic management requires an industry-wide blueprint that pursues various strategies to prevent, eliminate, or reduce the increasing pollution and health hazards generated by traditional plastics production. Such a holistic response is necessary to manage the constraints and embrace the challenges in meeting the UN’s 2030 Agenda [38]. Furthermore, as the “business as usual” approach is no longer possible, plastics producers have adopted principles of a circular economy to emphasize the value of keeping plastic in circulation once it is manufactured, but not without facing process, quality, and societal constraints of manufacturing new material [39,40]. Liu et al. [41] note that the implementation of circular economy practices offers the possibility to reduce emissions generated by the plastic production chain. If coupled with the adoption of Industry4.0 strategies-which include a variety of communication technologies geared toward helping overcome potential manufacturing constraints such as those involving quality, cost, and delivery issues-circular economy principles can assist manufacturers in achieving important sustainable development goals [42,43] and can drive sustainable progress in the plastic industry [44] (Benitez, et al., 2021).
The World Economic Forum [36] argues that new plastics technologies are urgently needed to solve the problem of the resulting plastics waste. As a result, new bioplastics are emerging, but whose benefits vary greatly depending on use. The term “sustainable plastics” encompasses plastics manufactured from different source materials that range from bio-based to biodegradable feedstock. Such plastics are manufactured by recycling and reprocessing used plastic to produce industrial or natural biodegradable polymers. Sustainable plastics have a myriad of applications. For instance, commercially valuable products can be manufactured through a process of chemically recycling plastic from post-consumer apparel [45]. Sustainable plastic also includes biodegradable polymers, which offer the possibility to substitute polypropylene, polyethylene, and polystyrene while reducing greenhouse gas emissions and waste [46]. Nevertheless, polypropylene, polyethylene, and polystyrene are all potentially toxic materials, depending on how they are produced.
The incorporation of bioplastics in the automotive industry promises to decarbonize the sector by allowing the assembly of more fuel-efficient vehicles [47]. Bioplastics can also help reduce occupational risks in the automotive repair and refinishing industry where volatile organic compounds (VOCs) are a serious problem [48,49]. Bioplastics produced industrially are an attractive alternative for plastics producers, because they are comparable in functional performance, but without the associated stigma of being unsustainable [50]. Nevertheless, the higher price of bioplastics is still the main issue when it comes to the transition from fossil fuel-based to bio-based plastics. Additionally, bioplastics have sustainable characteristics usually lacking in conventional plastics, such as less toxicity [51], significantly fewer greenhouse gas emissions [52], and faster biodegradability [53]. According to Green dot Bioplastics [54], the trend is that the market for bioplastics will continue to expand to reach a mature stage by 2030, moving from 2% of bioplastics in the market in 2012 to 40% in 2030.
Efforts related to a more sustainable plastics value chain are currently focused primarily on the recycling of plastic waste [55]. For example, in Europe, single-use plastics (SUP) in particular have been banned in a variety of end-user products, and other measures encouraging the reduction, separation, and recycling of other SUPs are considered by the Directive on the Reduction of the Impact of Certain Plastic Products on the Environment [56]. However, as governments worldwide continue introducing legislation that demands a less polluting plastics chain, including industries that produce raw materials and those that use plastics as input, the trend towards sustainable manufacturing of plastics will grow.
One must remember that the path towards new plastics technologies is ambitious and achievable; however, it is not free of pitfalls. For example, scholars have warned that biodegradable plastics could still harm the environment and human health due to incomplete degradation [57]. Moreover, the shift to intensive agriculture to produce bio-plastics might compromise natural habitats [58]. Therefore, the evolution towards a more sustainable plastic market has to be marginally done, considering that studies have shown that plastic waste may be effectively recycled, improving its environmental performance [59,60]. In addition, the reduction, recyclability, and reuse of plastic along the plastic value chain has the highest potential in reducing greenhouse gas emissions [61].

3.2. Trends in Plastics Manufacturing–Consumers´ Perception

As previously mentioned, in order to assess the current plastic manufacturing trends, an analysis of the literature and a survey of consumers were performed. After presenting the findings from the literature in the previous section, this section is dedicated to describing the main findings obtained from the survey. Firstly, an analysis of the respondents’ profiles is presented. After this, their responses are presented and debated in consideration of the literature on the subject.

3.2.1. Demographical Distribution of Survey Participants

Regarding the respondents’ characteristics, it should be noted that the survey included 302 respondents. The sample of this study was diversified and was composed of 64.90% male and 35.10% female respondents worldwide. The countries with the highest percentage were Malaysia (29.47%), the United States (15.89%), the Netherlands (10.93%), Brazil (10.60%), Portugal (7.95%), and Germany (6.95%). Respondents from 23 other countries also participated in this survey, bringing the total to 29 countries. Figure 3 presents all the countries for which at least one respondent participated in the survey, illustrating that the survey comprised individuals from all continents. We used the World Bank income classification to classify countries into the four income groups of “High income”, “Upper middle income”, “Lower middle income” and “Low income”.
Table 3 provides the distribution of age and education from the 302 respondents. Regarding the respondents’ age, 42.38% of the respondents were between 18 and 25 years, 10.26% between 26 and 35 years, 23.51% between 36 and 45 years, 16.23% between 46 and 59 years, and 7.62% were 60 years of age or more. For education, 45.70% of the respondents have a Bachelor’s degree, 19.54% have a Master’s degree, 19.54% have a Ph.D. or higher degree, 12.91% completed high school or less, and 2.32% finished trade school. None of the countries in our sample are Low-income countries, and only 2% of the respondents are from Lower Middle-income countries (Côte d’Ivoire, India, and Kenya), while 42.7% are from Upper Middle-income countries and 55.3% are from High-income countries.
After presenting the details about the sample, their responses regarding knowledge and awareness about plastics are presented and debated in consideration of the literature.

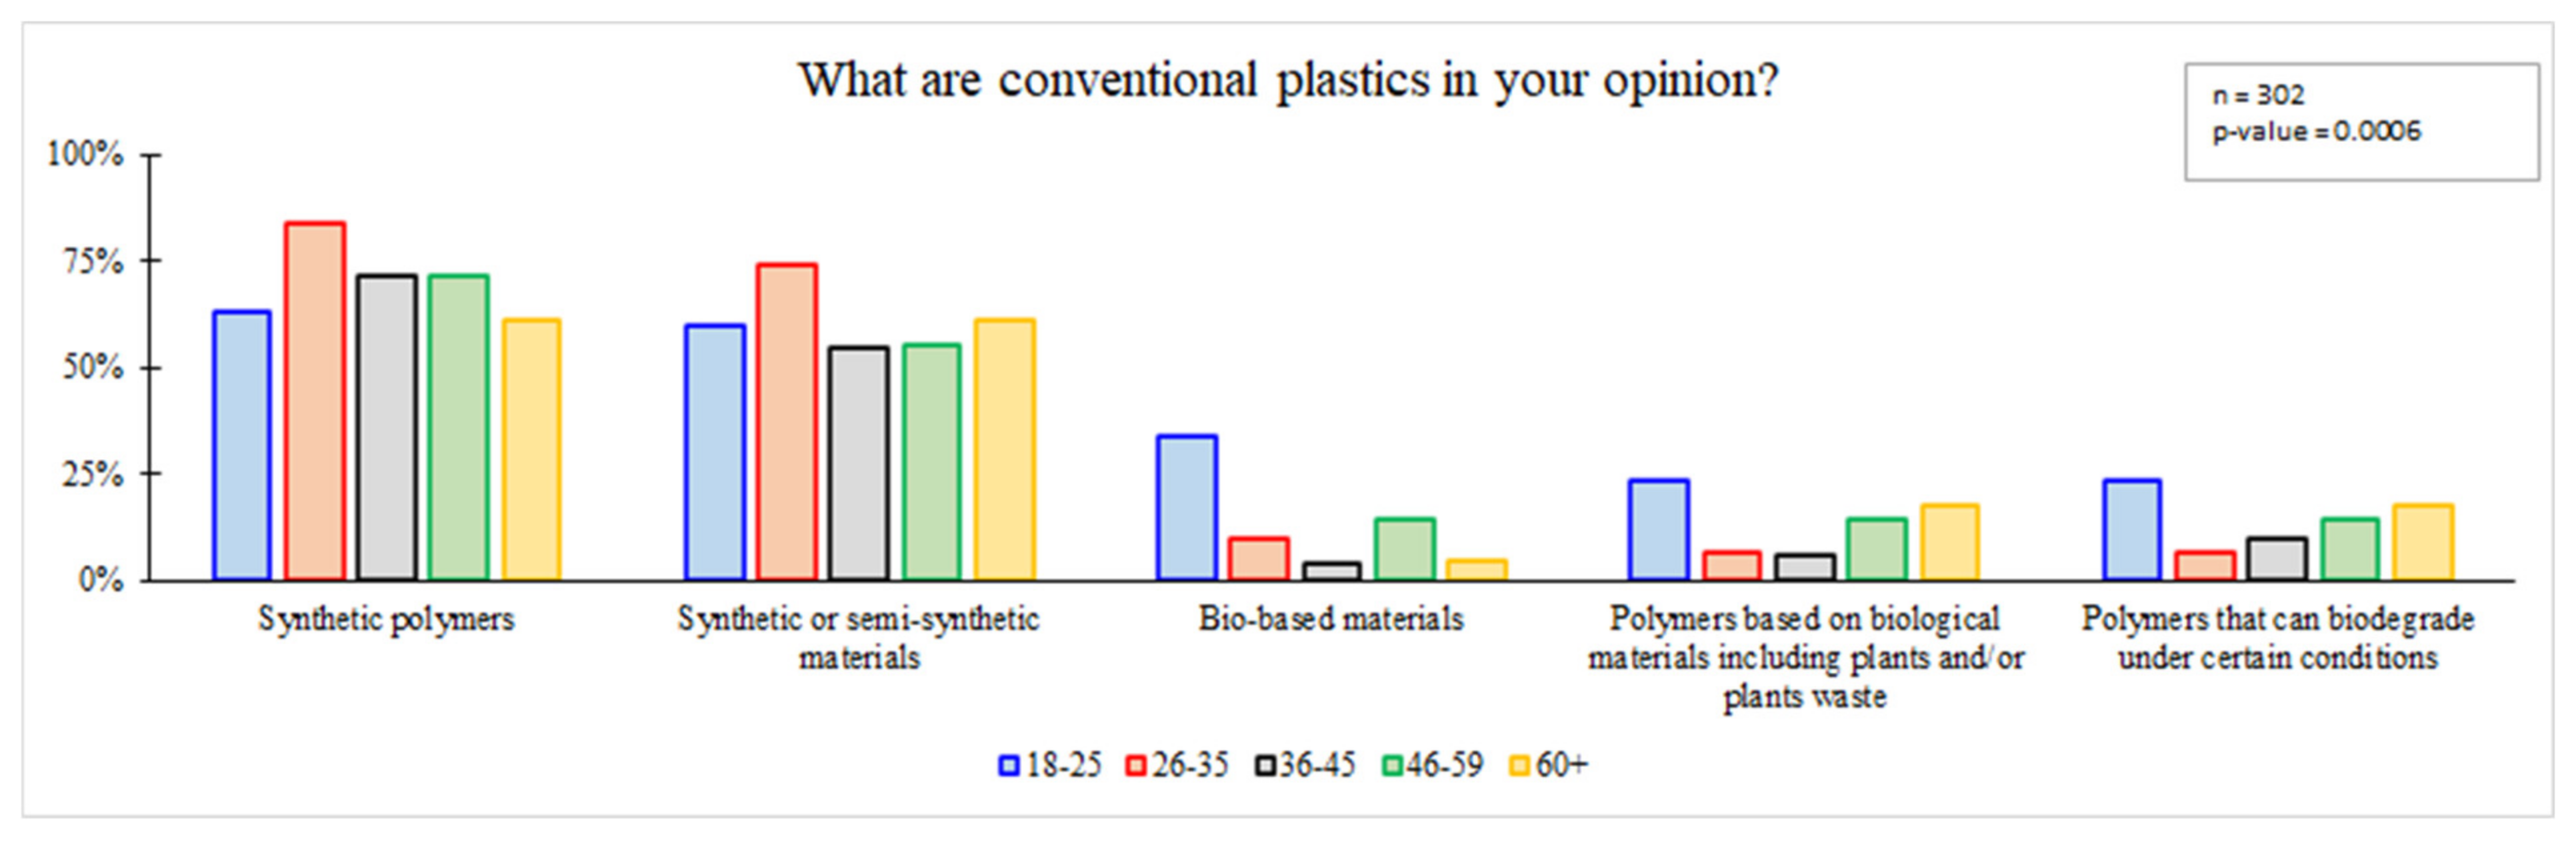
3.2.2. Knowledge and Awareness about Conventional Plastics

Figure 4 shows the respondents’ knowledge about conventional plastics by age. Based on the results shown in Figure 4, most of the respondents are aware that conventional plastics can also be referred to as synthetic polymers (68.54%) and synthetic or semi-synthetic materials (59.60%). Only a small percentage of respondents believe that conventional plastics include bio-based materials (18.87%), polymers based on biological materials including plants and/or plants waste (15.56%), and polymers that can biodegrade under certain conditions (16.56%). This means that conventional plastics are commonly known by the correspondents as synthetic polymers and synthetic/semi-synthetic materials, as compared to the other three categories.
The finding indicates that most of them realize that conventional plastics are made from non-renewable and non-biodegradable resources. Therefore, the majority of the respondents chose categories that are related to synthetic or semi-synthetic resources. In contrast, smaller percentages of respondents chose the latter three categories that are related to non-renewable and non-biodegradable resources. The finding also indicates that the respondent’s knowledge level is highly related to the common terms used to describe conventional plastics. Furthermore, the result shows that gender is an indicator of the knowledge level of the correspondents about the five plastics categories. The results indicate that female respondents tend to disagree more often than male respondents with conventional plastic being a synthetic polymer (35.2% against 24.5%) and with conventional plastic being a synthetic or semi-synthetic material (42.3% against 36.8%).
Figure 5 shows the respondents’ knowledge about conventional plastics according to country development level. The results in Figure 5 show that the correspondents from the countries of high income and upper middle income have a higher frequency than the countries of lower middle income in the categories of synthetic polymers and synthetic or semi-synthetic materials. This means that the respondents from countries of high and upper-middle incomes have better knowledge about conventional plastics than the countries of lower-middle income. The finding is aligned with the support and commitments given by the countries of high-income and middle income to reducing carbon footprints.
Table 4 shows the frequency and percentage of respondents’ reasons for concern about conventional plastic according to educational level. Based on the results in Table 4, the percentages of respondents choosing Reason 2 are the highest across different levels of education, followed by Reason 4 as the second most highly chosen reason across different levels of education. The third highly chosen is Reason 1, which is based on the concerns of BPA on human reproduction. Reasons 2 and 4 refer to the concerns about the impact of toxic components and microplastics in conventional plastics on human health. Therefore, the results in Table 4 show that the effects of conventional plastics on human health are the main concern of the correspondents, regardless of their education levels. In other words, human health should become the driving force to increase public awareness of the danger of conventional plastics. The percentage of female correspondents having concern (42%) is higher than male respondents (28%). The total percentage of male correspondents having no concern (47%) and no idea (25%) is higher than female respondents (28% and 30% respectively). Additional results that were obtained regarding health and safety are included in Appendix B (Table A1, Table A2, Table A3 and Table A4).
Figure 6 shows the behavior of the respondents in reducing the use of conventional plastic. The results in the figures show that most of the respondents were ready to adopt more sustainable alternatives to replace conventional alternatives. Instead of eliminating the usage of conventional plastics, 75.5% of them would adopt more sustainable alternatives to replace the daily plastic product, and 43.3% of them would shift to bioplastic alternatives and reduce the usage of the superfluous product that contains or is made of plastics. Some respondents were willing to choose more drastic options, with 61.26% of them willing to buy products without plastic packaging and 59.27% of willing to refuse plastic bags. There was only a small percentage of the respondents who would be willing to wait for better options, accounting for 14.57%. The finding from Figure 6 is that the respondents were willing to change their behavior in the overall usage of conventional plastics. Additional information about bio-based plastics is available in Appendix B (Table A5 and Table A6).

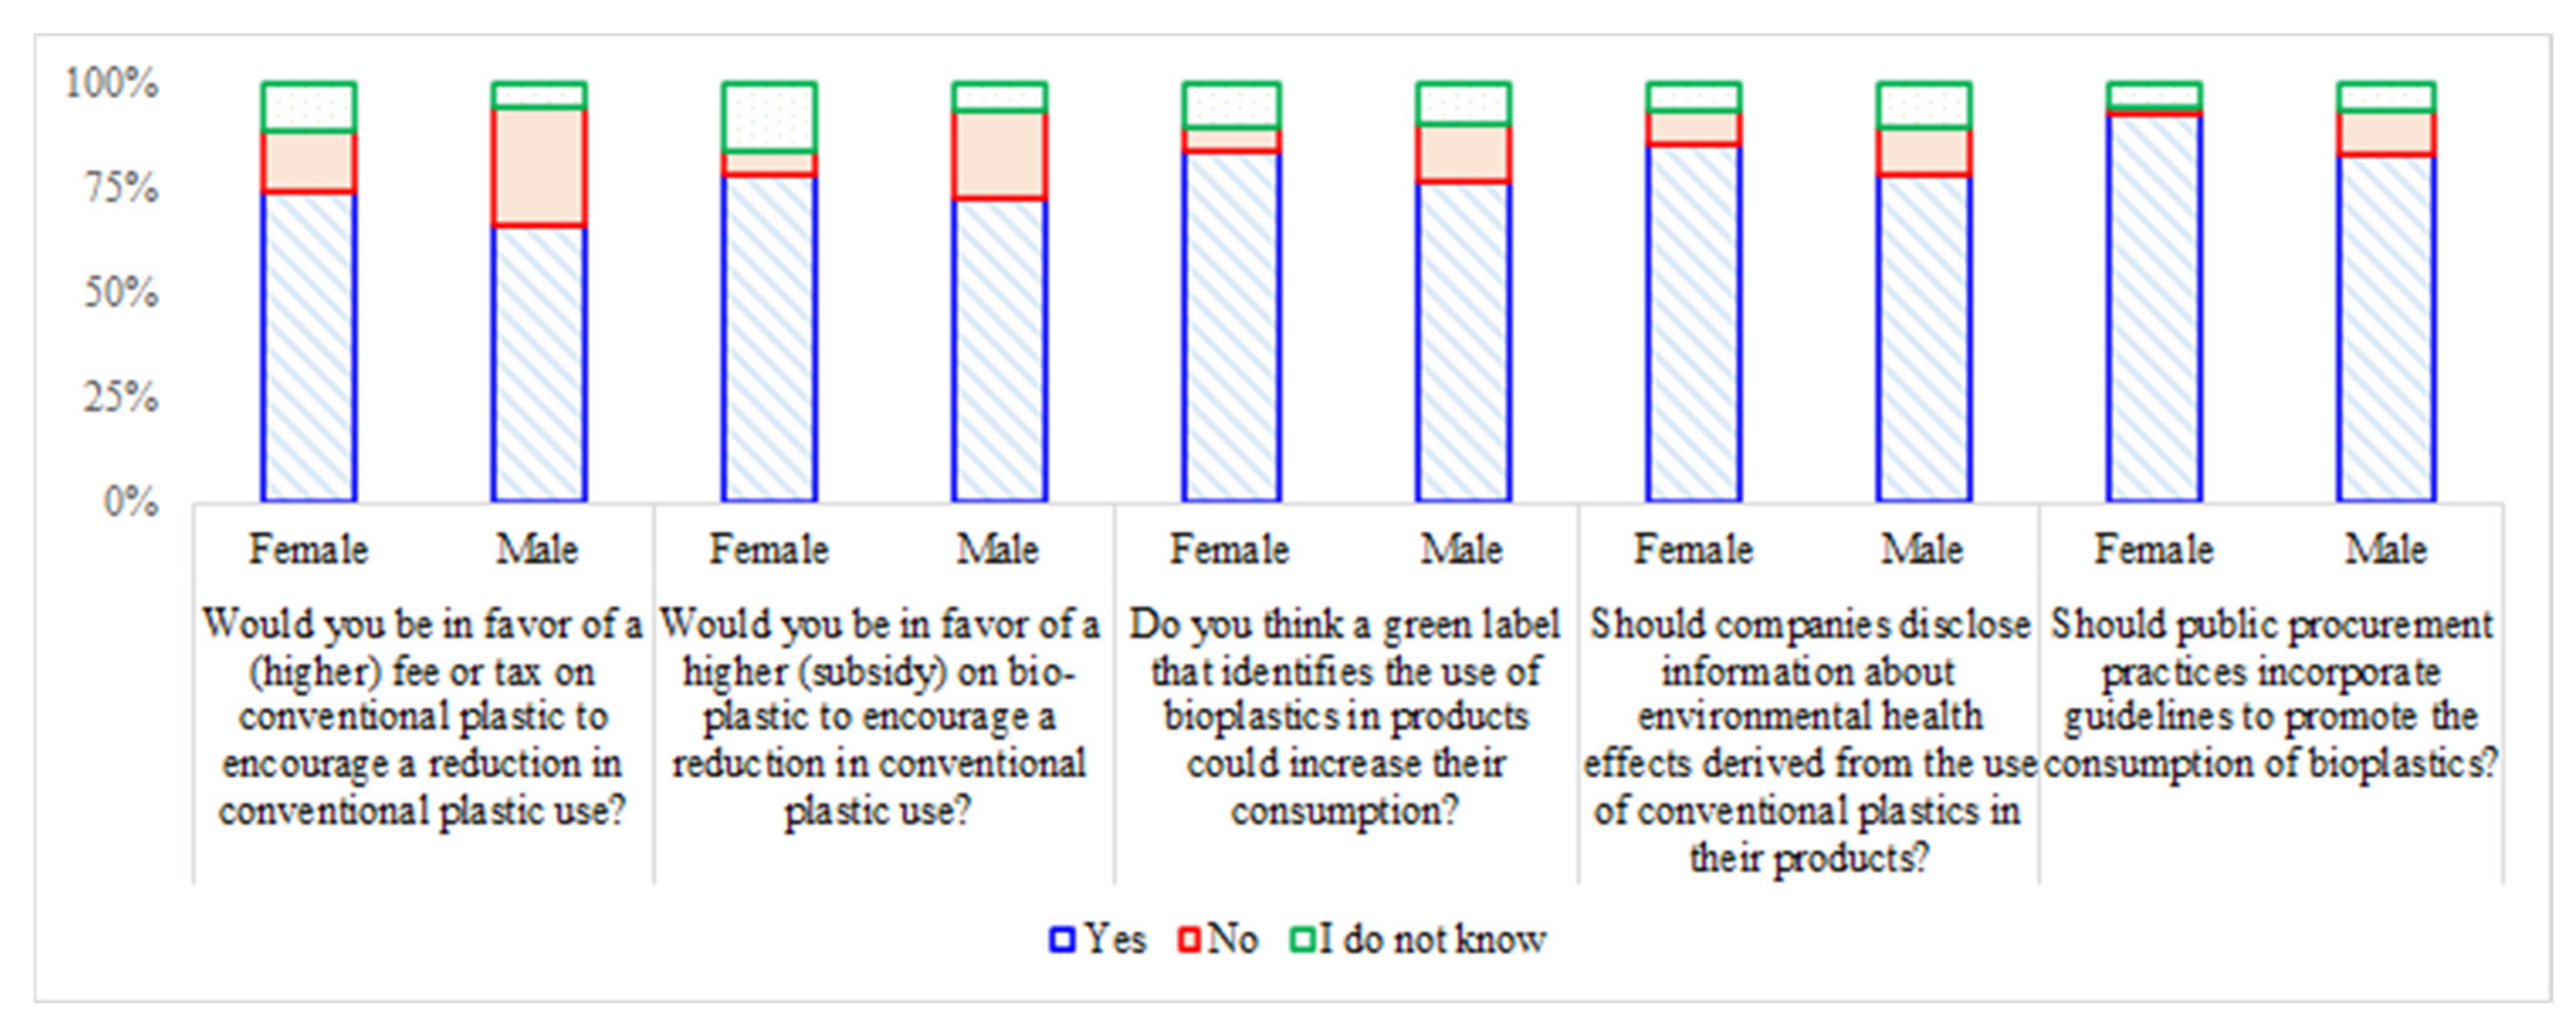
3.2.3. Policies to Discourage Conventional Plastic or Encourage Bioplastic

A final intention of the research was to explore the openness that respondents have to different policy measures, such as fees or taxes, subsidies and green labels. Concerning the establishment of a (higher) fee or tax on conventional plastic to encourage its reduction, 71.19% of the respondents considered this a positive measure, while 76.49% favored subsidies for bioplastics. Regarding the relevance of green labels, 81.46% of the respondents feel that they could increase bioplastic product consumption, and 83.11% of the respondents contend that companies should disclose information about the environmental health effects derived from the use of conventional plastics in their products. Regarding government actions, 89.40% of the respondents believe that public procurement practices should incorporate guidelines to promote the consumption of bioplastics.
Figure 7 shows the histogram for the questions related to policies according to gender. A χ2 (2) test was conducted for each question and gender. With the significance level, α = 0.05, we can reject the null hypotheses for all questions except Question 4. Therefore, we can conclude that there were statistically significant differences in gender in answering Questions 1, 2, 3 and 5.
For Question 1, χ2(2) = 9.33, p < 0.009: With the significance level, α = 0.05, we can reject the null hypothesis and conclude that there are statistically significant differences in gender in answering Question 1, with more females being more favorable of the implementation fee or tax to reduce the usage of conventional plastics. For Question 2, χ2(2) = 19.3923, p < 0.000: With the significance level, α = 0.05, we can reject the null hypothesis and conclude that there are statistically significant differences in gender in answering Question 2, with more females being more favorable of implementing a subsidy on bioplastics. For Question 3, χ2(2) = 7.4243, p < 0.024: With the significance level, α = 0.05, we can reject the null hypothesis and conclude that there are statistically significant differences in gender in answering Question 3, with more females being more favorable of the implementation of green labels identifying the use of bioplastics in the products. For Question 5, χ2(2) = 12.4728, p < 0.002: With the significance level, α = 0.05, we can reject the null hypothesis and conclude that there are statistically significant differences in gender in answering Question 5, with more females being more favorable of public procurement practices incorporating guidelines to promote the consumption of bioplastics. The findings from Questions 1, 2, 3 and 5 indicate that the female correspondents were more likely to be favorable of the implementation of initiatives and policies that encourage the consumption or reduction of conventional plastics and the incremental usage of bioplastics.
Besides the analysis between genders, the relationships between some key questions of the survey were performed to identify possible connections between them. Table 5 shows the joint relative frequencies between Question 19: “Would you be in favour of a higher subsidy on bioplastic to encourage a reduction in conventional plastic use?” and Question 20: “Do you think a green label that identifies the use of bioplastics in products could increase its production?” Nearly 7 in 10 respondents, 68%, were willing to pay a subsidy, or a higher subsidy, and believe that a green label that identifies the use of bioplastics in a product could increase its production. On the other hand, the joint relative frequencies for those who would not pay a subsidy on bioplastics and do not think that green labels that identify bioplastics in products could increase its production is lower, just 5%. Most of the other combinations of answers are negligible. This finding shows that most of those respondents that consider it important for consumers to have access to product information regarding bioplastic aspects are also favourable to subsidies to increase bioplastic product consumption.
Table 6 shows the joint relative frequencies between Question 12: “Do you consciously buy or use bioplastic products?” and Question 18: “Would you be in favor of a (higher) fee or tax on conventional plastic to encourage a reduction in conventional plastic use?”. Nearly 4 in 10 respondents, 37.7%, claim that they consciously buy or use bioplastic products and favor paying a (higher) fee or tax on conventional plastic to encourage a reduction in conventional plastic use. However, 22% of those consciously buying or using bioplastic products will not pay a higher fee or tax on conventional plastic. This analysis shows that it is not possible to establish a clear link between these two items.
Despite this inconclusive result, a link can be made with the study of Martinho et al. [62]. In their research, the authors conducted a survey to analyze the effect of the plastic bag tax implemented in Portugal in 2015. Their result shows that despite the positive effect of the tax to reduce the consumption of plastic bags, it did not increase the consumers’ perception of the negative environmental and health effects of plastic. Thus, it suggests that consumers react well to prices regardless of the objective of the tax. In the case of Portugal, the study also shows that respondents see the tax as a source of additional revenue for the State. Convery et al. [63] showed that the introduction of the plastic bags tax was extremely successful in Ireland, as it significantly decreased the consumption of plastic bags, and therefore also of littering, while having low administration costs.
Table 7 shows the joint relative frequencies between Question 2: “Do you have health/safety concerns regarding conventional plastics?” and Question 10, “In your opinion, is there a need to reduce your consumption of conventional plastics?” Around 65% that have health/safety concerns regarding conventional plastics think that there is a need to reduce their consumption of conventional plastics. In contrast, 15% of those claiming to have no health/safety concerns regarding conventional plastics believe that there is a need to reduce their consumption of conventional plastics, showing that health/safety concerns are important reasons for people to reduce their consumption of conventional plastics.
Table 8 shows the joint relative frequencies between Question 2: “Do you have health/safety concerns regarding conventional plastics?” and Question 16: “How much would you be willing to pay on top?”. More than 52% of the respondents that claim to have health/safety concerns regarding conventional plastics would accept to pay up to 25% more for bioplastic products, also corroborating the argument regarding the relevance of health/safety concerns on consumers’ purchasing decisions.

4. Discussion

Research on the consumers’ perceptions of and behaviors towards bio-based products and production processes is still scarce. This research follows a broader strand in the literature that studies consumer behavior towards environmental-friendly products, by exploring factors linked to the quality of the products, beliefs, pricing and emotional and moral dimensions. Kihlberg & Risvik [64] conducted a survey to analyze the consumption of organic bread in Sweden and found that despite the consumers’ belief that the consumption of organic bread should increase, and feeling that organic bread is more tasteful, they were unwilling to pay a higher price for organic food in general. This finding is in line with similar research in the literature focusing on consumer behavior towards organic and bio-food (see e.g., [65,66,67,68]). Aertsens et al. [66], Shafie & Rennie [67], Marian et al. [68], and Aschemann-Witzel & Zielke [65] found that higher prices associated with organic and bio-food are a barrier to consuming these products. Additionally, these studies also show that the consumers’ knowledge and awareness of the health and environmental benefits of organic food consumption is fundamental to increasing the purchase of these goods. Consumers make a combined consideration of different product attributes to decide on their purchases, where price is one of the most important attributes. Rizzo et al. [69], for example, find that health concerns are the major factor behind the individual’s purchase of organic olive oil. Similarly, Massey et al. [70] identify health concerns as the main reason for their willingness to pay a higher price for organic products. Other reasons are environmental concerns and quality/taste. The findings are in line with the literature, pointing out that health is a key concern with respect to conventional plastic [71].
For the specific case of consumer behavior towards bioplastics, a few researchers have analyzed the factors behind the consumers’ purchase of bioplastics [72,73,74]. Klein et al. [72] conducted a survey among German citizens, and based on their findings, they argue that communication and information are necessary to spur bioplastic consumption. Zwicker et al. [74] analyze the consumer attitudes to both conventional and bio-plastics and indicate that a higher willingness to pay for bioplastics could be the result of a negative attitude towards conventional plastic, instead of a positive attitude towards bioplastics. These researchers focus mainly on the attributes leading consumers to opt for bioplastics. We add to these studies by analyzing consumer knowledge and understanding of conventional plastics and bioplastics and their relationship to their purchasing decisions and policy views. Another contribution of the research is to analyze the individual’s acceptance of a higher price on conventional plastic to discourage their consumption of them and the increased demand for bioplastics as a response to lower the price. The findings indicate that respondents are willing to pay a fee or tax on conventional plastic. However, a larger fraction of respondents is in favor of a subsidy on bioplastics.
A tax or fee on conventional plastic or a subsidy on bioplastics are two potential policy responses to decrease the consumption of conventional plastic and/or increase the consumption of bioplastics. Another policy response we investigated is the relevance of green labels that differentiate bioplastics from conventional plastic. This would be particularly necessary when consumers feel that the lack of information refrains them from changing their consumption behavior towards more sustainable products. The literature is still scarce in this respect. A few exceptions are Martinho et al. [62] and Convery et al. [63]. We find that green labels are seen by respondents as a positive tool to increase bioplastic product consumption. Aligned with this, respondents also feel that companies should disclose information about the environmental health effects derived from the use of conventional plastics in their products. Additionally, the government should also play an important role in promoting less plastic. Respondents believe that public procurement practices should incorporate guidelines to promote the consumption of bioplastics.
Finally, the finding indicates that respondents from high and upper-middle-income countries have more knowledge about conventional plastic. This finding can be linked with the strong commitment of the governments of some of these countries, demonstrated through policies such as the implementation of Extended Producer Responsibility (EPR) by EU members [75,76] and the ban on single-use plastics (SUP) [56], which are crucial in ensuring the responsibilities are shared amongst brand owners, manufactures, producers and consumers. By having the appropriate policies in place from production to consumption, producers and consumers receive consistent information about the concerns of conventional plastics. Countries presenting strong commitments to reducing carbon footprints will implement initiatives and policies that educate their citizens to become knowledgeable consumers in plastic usage.
Focusing on low-middle-income countries, the low level of awareness about conventional practices should be a topic of debate. An illustrative example of this can be verified when China banned the import of plastic waste [77]. Instead of solving the problem, the waste started to be sent to low-middle-income countries, such as Vietnam and Laos [78,79]. In this sense, the problem persisted globally. Therefore, more efforts should be implemented to attract the participation of countries of low-middle incomes in reducing the production and consumption of conventional plastics as well as the import of plastic waste. In addition, as evidenced by Brodin et al. [50], these countries need to realize that bioplastics are viable alternatives to conventional plastics and can generate promising revenue, without the associated stigma of being unsustainable.

5. Conclusions

This paper assessed current trends in plastic production by emphasizing how consumers perceive and respond to these trends. From a theoretical perspective, researchers adopt various tools for assessing sustainable production. Plastics are often single-use, resulting in a large amount of waste and an inefficient use of resources. Although more limited to responses from Europe and America, the paper showed that there is an increasing political change towards less polluting plastics and measures to reduce plastic use, but also that within the industrial sector itself there have been important signs of a movement towards a more circular economy with less plastic waste. From a circular economy perspective, an important improvement has been the advancement of sustainable plastic, that is, bio-based and biodegradable feedstock-based plastic or simply bioplastics. Bioplastics have been shown to be less toxic and to result in fewer greenhouse gas emissions. Nevertheless, the literature also points out that similar to conventional plastic, bioplastics are still associated with unsustainable consumption. Therefore, the paper intended to investigate this further by conducting a qualitative analysis.
The analysis of consumers’ perspectives emphasized their knowledge and awareness and their usage and attitudes towards plastics. We analysed the relationship between these characteristics and the demographic data from the respondents. An international online survey was conducted from 19 January–11 May 2021. The findings indicate that the majority of the respondents understand what conventional plastics are. Despite female respondents disagreeing more often than male respondents with the survey alternative that conventional plastics are synthetic polymers and with the survey alternative that conventional plastics are semi-synthetic materials, the female respondents are more concerned about plastic use and are also more willing to accept policy measures to stimulate the consumption of bioplastics instead of conventional plastic (e.g., favouring an increase in the price of conventional plastic). These findings suggest that, from the consumers’ perspective, for change to take place it is essential that consumers become aware of the detrimental impact of plastic. It is less important to understand the composition and distinction in the material properties of plastic and/or bioplastics.
Similar to the gender differences, the results also show that respondents from wealthier countries are more aware of what conventional plastics and bioplastics are. No statistically significant differences were found concerning the educational level. Therefore, we argued that the differences between the development level of the countries could be a result of targeted information campaigns in developed countries, which are, in general, more engaged with sustainability practices than in developing nations.
This paper has some limitations. Firstly, the bibliographic research focused on the plastic industry and used terms associated with plastic production, without a specific focus on its environmental impacts. Secondly, the survey, which constituted of 26 questions, was aimed at an assessment of consumers´ levels of information and attitudes and not at the perspectives of producers. Finally, the study period did not allow for comparisons among years.
However, despite these limitations, the paper -and especially the survey with 302 respondents from 32 countries- provides a contribution to the literature by assessing the provisions and requirements for the sustainable production of plastics and by building a profile of the ways plastic consumption is perceived, and hence contributing to efforts to pursue SDG12 from the perspective of consumers.
Regarding future prospects, this paper indicates that there is significant willingness to accept policy measures to stimulate the consumption of bioplastics and decrease the consumption of conventional plastic, both in developed and developing countries. One of the main reasons identified is the respondents’ concern with the health and safety effects linked with conventional plastic. Thus, the research indicates that countries should move forward towards the implementation of further policy measures that may lead to a decrease in the use of conventional plastic and stimulate the use of bio-based alternatives. The use of green labels can be an important tool, since consumers usually feel that the lack of information keeps them away from adopting more sustainable consumption practices. Further research should be undertaken to analyse country-specific measures to reduce the use of conventional plastic, bearing in mind a country-specific context.

Author Contributions

Conceptualization, W.L.F.; Methodology, I.S.R., J.S., L.V., E.N., J.M.D.-S. and J.B.; Software, I.S.R.; Validation, W.L.F., J.B. and R.A.; Investigation, J.B., J.S., I.S.R., P.G.Ö. and B.G.; Resources, W.L.F. and J.B.; Data Curation, I.S.R. and T.F.N.; Writing—Original Draft Preparation, J.B., J.M.D.-S., R.A., E.N., L.V. and J.S.; Writing—Review & Editing, W.L.F., J.M.D.-S., I.S.R., E.N., L.V. and J.B.; Visualization, W.L.F.; Supervision, W.L.F. and J.B.; Project Administration, J.B.; Funding Acquisition, W.L.F. All authors have read and agreed to the published version of the manuscript.

Funding

This study has received funding from the European Union’s Horizon 2020-Research and Innovation Framework Programme through the research project BIO-PLASTICS EUROPE, under grant agreement No. 860407.

Institutional Review Board Statement

Not applicable.

Informed Consent Statement

Not applicable.

Data Availability Statement

Not applicable.

Acknowledgments

This paper is part of the “100 papers to accelerate the implementation of the UN Sustainable Development Goals” initiative.

Conflicts of Interest

The authors declare no conflict of interest.

Appendix A. Questions from the Questionnaire

Demographic Data
1.
Gender:
Male
Female
Othe
2.
Country of residence:
3.
Age group (years):
18–25
26–35
36–45
46–59
60+
4.
Highest degree or level of education:
High school or less
Trade school
Bachelor ’s degree
Master ’s degree
PhD or higher
Knowledge Level
5.
What are conventional plastics in your opinion?
Synthetic polymers
Synthetic or semi-synthetic materials
Bio-based materials
Polymers based on biological materials including plants and/or plants waste
Polymers that can biodegrade under certain conditions
Other:
6.
Do you have health/safety concerns regarding conventional plastics?
Yes
No
I do not know
7.
Which statement fits the best?
I am concerned about the toxic components in conventional plastic products that can
affect human health
I am concerned about the BPA, which mimics hormone oestrogen and can cause
Long term effects on the human body
I am concerned, because I do not know how to avoid plastics
I am concerned, because microplastics have negative effect on human health
Other:
8.
Do you have environmental related concerns regarding conventional plastics?
Yes
No
I do not know
9.
Which statement fits the best?
I am concerned about the toxic components in conventional plastic products which
end up in land and contaminate the soil
I am concerned about the toxic components in conventional plastic products which
end up in rivers, lakes and the ocean
I am concerned about plastic intoxicating animals and harming their health
I am concerned about our dependency on oil
Other:
10.
What are bioplastics in your opinion?
Polymers based on bio-waste
Bio-based materials
Materials which are bio-based and/or biodegradable
Polymers based on biological materials including plants and/or plants waste
Polymers that can biodegrade under certain conditions
Other:
11.
Do you have health/safety concerns regarding bioplastics?
Yes
No
I do not know
12.
Which statement fits the best?
I am concerned about the more toxic components compared to those in conventional plastic products
I am concerned because information about bioplastics for general public is scarce
I am concerned because long term studies are not available yet
I am concerned because the degradation of bio-based plastics result in tiny plastic
pieces that have similar characteristics and effects on health as regular micro plastic
Other:
Usage and Attitudes towards plastics and bioplastics
13.
How often do you use conventional plastics?
Daily-I use plastic products or plastic packaging everyday
Occasionally-I have been trying to avoid plastic products and packaging
Rarely-I do not use much plastic products or packaging
14.
In your opinion, is there a need to reduce your consumption of conventional plastics?
Yes
No
I do not know
15.
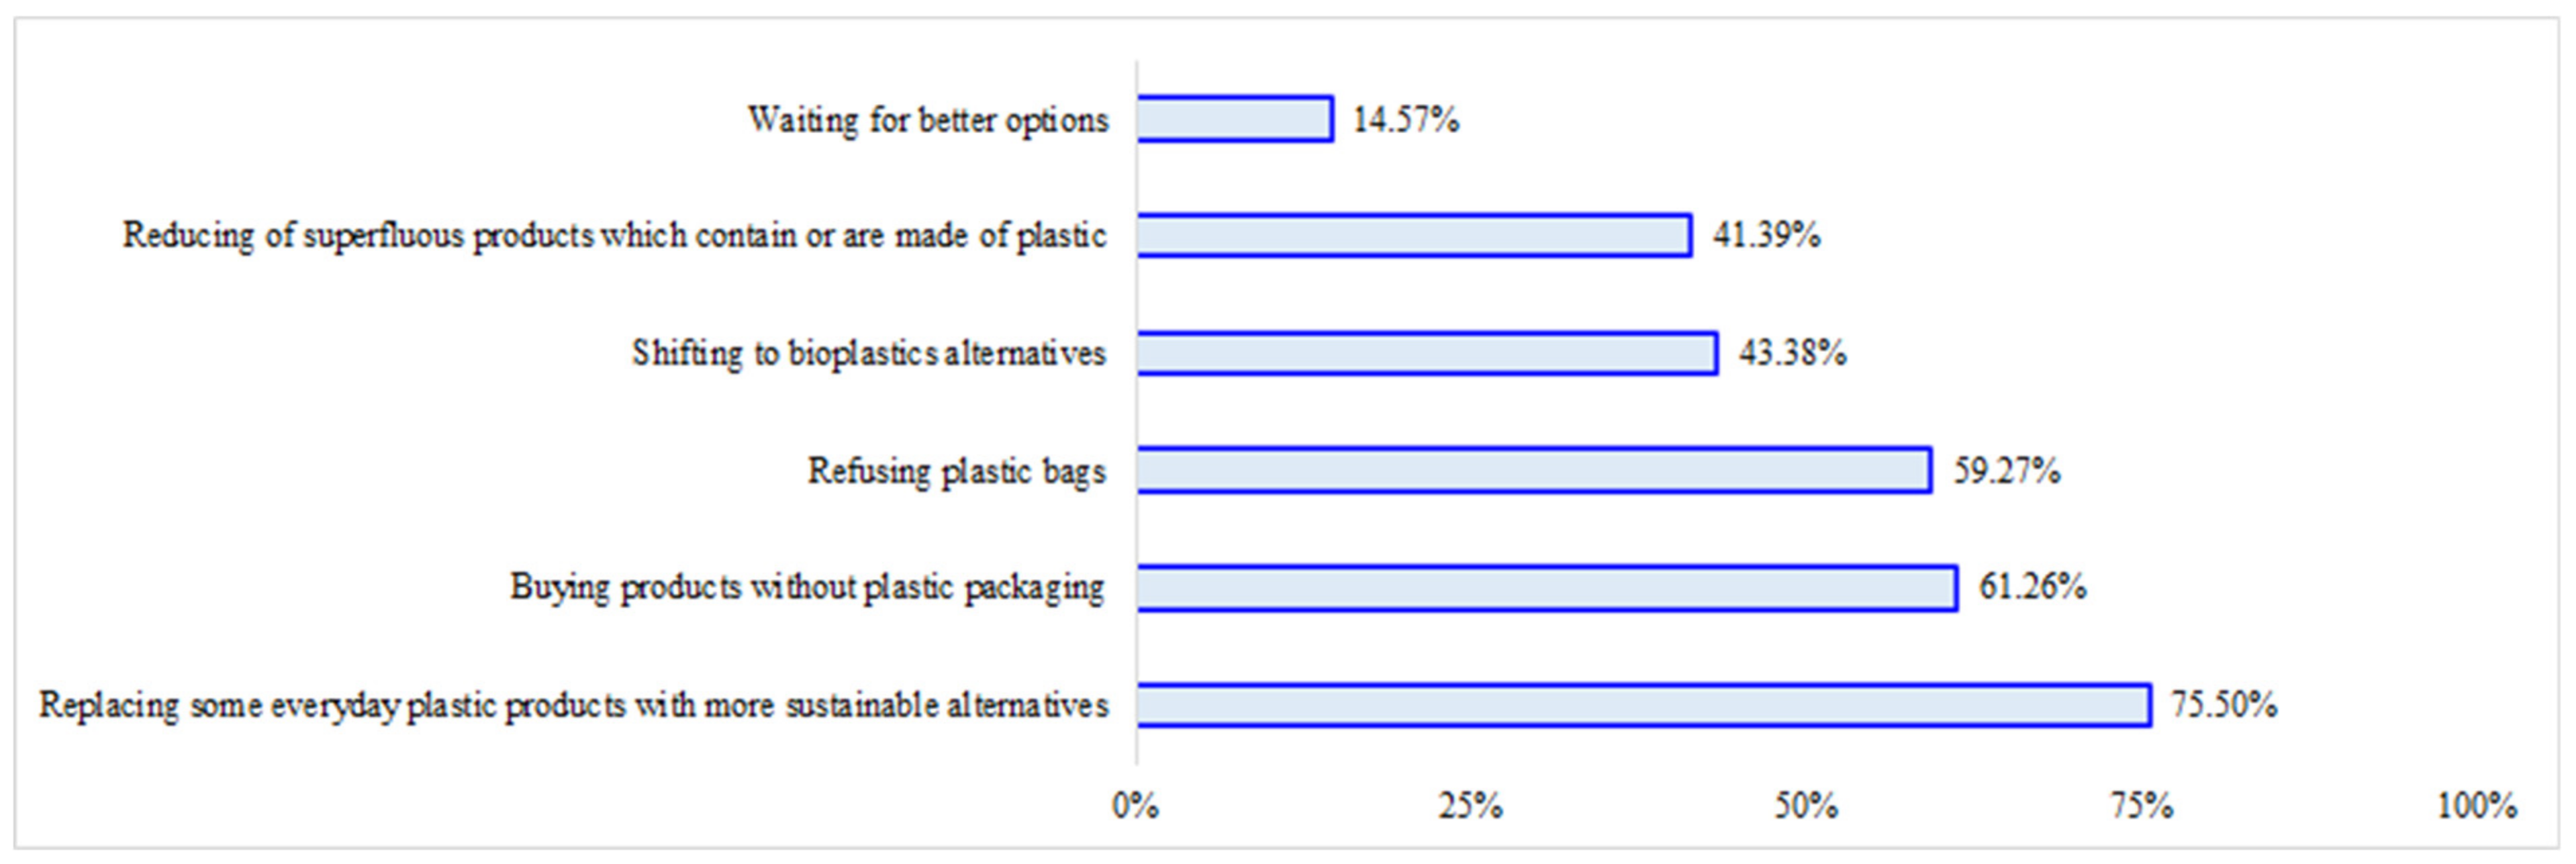
How could you reduce your consumption of conventional plastics?
Replace some everyday plastic products with more sustainable alternatives
Buy products without plastic packaging
Refuse plastic bags
Shift to bioplastics alternatives
Reduce my consumption of superfluous products which contain or are made of
plastic
I am waiting to have better options available
16.
Do you consciously buy or use bioplastics products?
Yes
No
I do not know
17.
If you do buy use bioplastic products, how often do you use them?
Daily-I use bioplastic products or bioplastic packing everyday
Occasionally-I do not always have access to bioplastics as a substitute for
conventional plastics
Rarely-I do not use much bioplastic products or packaging
18.
What is the main reason that keep you from buying and using bioplastic products more frequently?
High cost
Low quality
Design
Limited availability
Limited awareness
Lack of information about the products
Health concerns
Environmental concerns
I do not know
19.
Would you buy a bio-based and biodegradable product if it has good quality and design, is safer for humans and environment, but is more expensive than comparable products?
Yes
No
I do not know
20.
How much would you be willing to pay on top?
Up to 10%
Between 10% and 25%
Between 25% and 40%
More than 40%
Other:
21.
What would encourage you to use bioplastics more frequently?
More targeted information about the products
Lower price
Increased availability
Better quality
More products
22.
Would you be in favour of a (higher) fee or tax on conventional plastic to encourage a reduction in conventional plastic use?
Yes
No
I do not know
23.
Would you be in favour a higher (subsidy) on bioplastic to encourage a reduction in conventional plastic use?
Yes
No
I do not know
24.
Do you think a green label that identifies the use of bioplastics in products could increase their consumption?
Yes
No
I do not know
25.
Should companies disclose information about environmental health effects derived from the use of conventional plastics in their products?
Yes
No
I do not know
26.
Should public procurement practices incorporate guidelines to promote the consumption of bioplastics?
Yes
No
I do not know

Appendix B. Additional Results

Healthy and safety concerns regarding conventional plastics.
Table A1. Do you have health/safety concerns regarding conventional plastics? By gender. Frequency and percentage.
FemaleMaleTotal
I do not know301040
15.319.4313.25
No273259
13.7830.1919.54
Yes13964203
70.9260.3867.22
Total196106302
100100100
Pearson chi2(2) = 12.4144, p-value = 0.002.
Table A2. Do you have health/safety concerns regarding conventional plastics? By age group. Frequency and percentage.
18–2526–3536–4546–5960+Total
I do not know29234240
22.666.454.238.168.713.25
No247148659
18.7522.5819.7216.3326.0919.54
Yes7522543715203
58.5970.9776.0675.5165.2267.22
Total12831714923302
100100100100100100
Pearson chi2(2) = 19.089, p-value = 0.014.
Table A3. Do you have health/safety concerns regarding conventional plastics? By highest degree or level of education. Frequency and percentage.
BachelorHigh School or LessMaster’s DegreePhD or HigherTrade SchoolTotal
I do not know28722140
20.2917.953.393.3914.2913.25
No2551711159
18.1212.8228.8118.6414.2919.54
Yes852740465203
61.5969.2367.877.9771.4367.22
Total1383959597302
100100100100100100
Pearson chi2(8) = 19.9541, p-value = 0.011.
Table A4. Do you have health/safety concerns regarding bioplastics?
High IncomeUpper Middle IncomeLower Middle IncomeTotal
Yes47
28.14
61
47.29
4
66.67
112
37.09
No67
40.12
36
27.91
2
33.33
105
34.77
I do not know53
31.74
32
24.81
0
0
85
28.15
Total167
100
129
100
6
100
302
100
Pearson chi2(4) = 14.7268, p-value = 0.005.
Table A5. Would you buy bio-based and biodegradable product if it has good quality and design, is safer for humans and environment, but is more expensive than comparable products? By country development level.
High IncomeUpper Middle IncomeLower Middle IncomeTotal
Yes144
86.23
96
74.42
4
66.67
244
80.79
No10
5.99
16
12.40
0
0
26
8.61
I do not know13
7.78
17
13.18
2
33.33
32
10.60
Total167
100
129
100
6
100
302
100
Pearson chi2(4) = 10.3985, p-value = 0.034.
Table A6. Would you buy bio-based and biodegradable product if it has good quality and design, is safer for humans and environment, but is more expensive than comparable products? By gender.
FemaleMaleTotal
Yes166
84.69
78
73.58
244
80.79
No11
5.61
15
14.15
26
8.61
I do not know19
9.69
13
12.26
32
10.60
Total196
100
100302
100
Pearson chi2(2) = 7.3057, p-value = 0.026.

References

  1. United Nations. Agenda 21. In Programme of Action for Sustainable Development; United Nations: New York, NY, USA, 1992. [Google Scholar]
  2. Norwegian Ministry of the Environment. Report of the Symposium on Sustainable Consumption; Norwegian Ministry of the Environment: Oslo, Norway, 1994.
  3. United Nations. Meeting Report E/CN.17/1994/14-General Discussion on Progress in the Implementation of Agenda 21, Economic and Social Council, Appendix; United Nations: New York, NY, USA, 1994.
  4. OECD (Organization for Economic Co-Operation and Development). Final Report COM/ENV/CERI(99)64, Education and Learning for Sustainable Consumption, Economic and Social Council; OECD (Organization for Economic Co-Operation and Development): Paris, France, 1999.
  5. Veleva, V.; Ellenbecker, M. Indicators of sustainable production: Framework and methodology. J. Clean. Prod. 2001, 9, 519–549. [Google Scholar]
  6. Nash, H.A. The European Commission’s sustainable consumption and production and sustainable industrial policy action plan. J. Clean. Prod. 2009, 17, 496–498. [Google Scholar] [CrossRef]
  7. Haas, W.; Krausmann, F.; Wiedenhofer, D.; Heinz, M. How Circular is the Global Economy? An Assessment of Material Flows, Waste Production, and Recycling in the European Union and the World in 2005. J. Ind. Ecol. 2015, 19, 765–777. [Google Scholar] [CrossRef]
  8. Mont, O.; Plepys, A. Sustainable consumption progress: Should we be proud or alarmed? J. Clean. Prod. 2008, 16, 531–537. [Google Scholar] [CrossRef]
  9. Kalmykova, Y.; Rosado, L.; Patrício, J. Resource consumption drivers and pathways to reduction: Economy, policy and lifestyle impact on material flows at the national and urban scale. J. Clean. Prod. 2016, 132, 70–80. [Google Scholar] [CrossRef] [Green Version]
  10. Bengtsson, M.; Alfredsson, E.; Cohen, M.; Lorek, S.; Schroeder, P. Transforming systems of consumption and production for achieving the sustainable development goals: Moving beyond efficiency. Sustain. Sci. 2018, 13, 1533–1547. [Google Scholar]
  11. Pineiro-Villaverde, G.; García-Álvarez, M.T. Sustainable Consumption and Production: Exploring the Links with Resources Productivity in the EU-28. Sustainability 2020, 12, 8760. [Google Scholar] [CrossRef]
  12. Niinimäki, K.; Hassi, L. Emerging design strategies in sustainable production and consumption of textiles and clothing. J. Clean. Prod. 2011, 19, 1876–1883. [Google Scholar]
  13. Sáez-Martínez, F.J.; Lefebre, G.; Hernández, J.J.; Clark, J.H. Drivers of sustainable cleaner production and sustainable energy options. J. Clean. Prod. 2016, 138, 1–7. [Google Scholar] [CrossRef]
  14. Luo, Z.; Dubey, R.; Gunasekaran, A.; Childe, S.J.; Papadopoulos, T.; Hazen, B.; Roubaud, D. Sustainable production framework for cement manufacturing firms: A behavioural perspective. Renew. Sustain. Energy Rev. 2017, 78, 495–502. [Google Scholar] [CrossRef]
  15. Garcia-Herrero, L.; Hoehn, D.; Margallo, M.; Laso, J.; Bala, A.; Batlle-Bayer, L.; Fullana, P.; Vazquez-Rowe, I.; Gonzalez, M.J.; Durá, M.J.; et al. On the estimation on potential food waste reduction to support sustainable production and consumption policies. Food Policy 2018, 80, 24–38. [Google Scholar] [CrossRef]
  16. Norris, G.A. Integrating Economic Analysis into LCA. Environ. Qual. Manag. 2001, 10, 59–64. [Google Scholar] [CrossRef]
  17. Klüppel, H.-J. ISO 14041: Environmental Management—Life Cycle Assessment—Goal and Scope Definition—Inventory Analysis. Int. J. Life Cycle Assess. 1998, 3, 301. [Google Scholar] [CrossRef]
  18. Cournoyer, M.E.; Maestas, M.M.; Porterfield, D.R.; Spink, P. Chemical inventory management: The key to controlling hazardous materials. ACS Chem. Health Saf. 2005, 12, 15–20. [Google Scholar] [CrossRef]
  19. Sullivan, M.R.; Nance, P.M. Chemical Hazard Communication and Material Safety Data Sheets. In Encyclopaedia of Toxicology; Elsevier: Amsterdam, The Netherlands, 2005; pp. 505–515. [Google Scholar] [CrossRef]
  20. Lioy, P.J.; Pellizzari, E. Human Exposure Science. In International Encyclopedia of Public Health, 2nd ed.; Elsevier: Amsterdam, The Netherlands, 2017; pp. 77–83. [Google Scholar] [CrossRef]
  21. Barr, D.B. Human exposure science: A field of growing importance. J. Expo. Sci. Environ. Epidemiol. 2006, 16, 473. [Google Scholar] [CrossRef] [Green Version]
  22. Rebs, T.; Brandenburg, M.; Seuring, S.; Stohler, M. Stakeholder influences and risks in sustainable supply chain management: A comparison of qualitative and quantitative studies. Bus. Res. 2017, 11, 197–237. [Google Scholar] [CrossRef] [Green Version]
  23. Tickner, J.A.; Geiser, K. The precautionary principle stimulus for solutions-and alternatives-based environmental policy. Environ. Impact Assess. Rev. 2004, 24, 801–824. [Google Scholar] [CrossRef]
  24. Christopher, M.; Peck, H. Building the Resilient Supply Chain. Int. J. Logist. Manag. 2004, 15, 1–14. [Google Scholar] [CrossRef] [Green Version]
  25. Xu, M.; Cui, Y.; Hu, M.; Xu, X.; Zhang, Z.; Liang, S.; Qu, S. Supply chain sustainability risk and assessment. J. Clean. Prod. 2019, 225, 857–867. [Google Scholar] [CrossRef]
  26. Barbier, E.B.; Markandya, A.; Pearce, D.W. Environmental Sustainability and Cost-Benefit Analysis. Environ. Plan. A Econ. Space 1990, 22, 1259–1266. [Google Scholar] [CrossRef] [Green Version]
  27. Vörösmarty, C.J.; Lévêque, C.; Revenga, C. Chapter 7: Fresh Water. In Ecosystems and Human Well-Being: Synthesis; Millennium Ecosystem Assessment (Program); Island Press: Washington, DC, USA, 2005; pp. 297–373. [Google Scholar]
  28. Morgan, R.K. Environmental impact assessment: The state of the art. Impact Assess. Proj. Apprais. 2012, 30, 5–14. [Google Scholar]
  29. Čuček, L.; Klemeš, J.J.; Kravanja, Z. A Review of Footprint analysis tools for monitoring impacts on sustainability. J. Clean. Prod. 2012, 34, 9–20. [Google Scholar] [CrossRef]
  30. Fader, M.; Cranmer, C.; Lawford, R.; Engel-Cox, J. Toward an Understanding of Synergies and Trade-Offs Between Water, Energy, and Food SDG Targets. Front. Environ. Sci. 2018, 6, 112. [Google Scholar] [CrossRef]
  31. Steele, K.; Carmel, Y.; Cross, J.; Wilcox, C. Uses and Misuses of Multicriteria Decision Analysis (MCDA) in Environmental Decision Making. Risk Anal. 2009, 29, 26–33. [Google Scholar] [PubMed]
  32. Brunner, P.H.; Rechberger, H. Handbook of Material Flow Analysis: For Environmental, Resource, and Waste Engineers; CRC Press: Boca Raton, FL, USA, 2016. [Google Scholar]
  33. Malhotra, N.K. Marketing Research: An Applied Orientation (Pesquisa De Marketing: Uma Orientação Aplicada), 6th ed.; Bookman: Porto Alegre, Brazil, 2012. [Google Scholar]
  34. Elsheikhi, S.A.; Benyounis, K.Y. Plastics Recycling Processes and Public Attitudes. In Reference Module in Materials Science and Materials Engineering; Elsevier: Amsterdam, The Netherlands, 2020; ISBN 9780128035818. [Google Scholar] [CrossRef]
  35. Hsu, W.-T.; Domenech, T.; McDowall, W. How circular are plastics in the EU? MFA of plastics in the EU and pathways to circularity. Clean. Environ. Syst. 2020, 2, 100004. [Google Scholar]
  36. World Economic Forum; Ellen Macarthur Foundation; McKinsey Company. The New Plastics Economy Rethinking the Future of Plastics. 2016. Available online: https://ellenmacarthurfoundation.org/the-new-plastics-economy-rethinking-the-future-of-plastics (accessed on 19 January 2021).
  37. EIA (U.S. Energy Information Administration). How Much Oil Is Used to Make Plastic? 2021. Available online: https://www.eia.gov/tools/faqs/faq.php?id=34&t=6 (accessed on 18 August 2021).
  38. UN 2030. Transforming Our World: The 2030 Agenda for Sustainable Development. Available online: https://sdgs.un.org/2030agenda (accessed on 19 January 2021).
  39. Dijkstra, H.; van Beukering, P.; Brouwer, R. Business models and sustainable plastic management: A systematic review of the literature. J. Clean. Prod. 2020, 258, 120967. [Google Scholar] [CrossRef]
  40. Paletta, A.; Filho, W.L.; Balogun, A.-L.; Foschi, E.; Bonoli, A. Barriers and challenges to plastics valorisation in the context of a circular economy: Case studies from Italy. J. Clean. Prod. 2019, 241, 118149. [Google Scholar] [CrossRef]
  41. Liu, Z.; Adams, M.; Cote, R.P.; Chen, Q.; Wu, R.; Wen, Z.; Liu, W.; Dong, L. How does circular economy respond to greenhouse gas emissions reduction: An analysis of Chinese plastic recycling industries. Renew. Sustain. Energy Rev. 2018, 91, 1162–1169. [Google Scholar] [CrossRef]
  42. Bag, S.; Pretorius, J.H.C. Relationships between industry 4.0, sustainable manufacturing and circular economy: Proposal of a research framework. Int. J. Organ. Anal. 2020, 30, 864–898. [Google Scholar] [CrossRef]
  43. Tay, S.; Te, C.L.; Aziati, A.; Ahmad, A. An Overview of Industry 4.0: Definition, Components, and Government Initiatives. J. Adv. Res. Dyn. Control. Syst. 2018, 10, 14. [Google Scholar]
  44. Benitez Nara, E.O.; da Costa, M.B.; Baierle, I.C.; Schaefer, J.L.; Benitez, G.B.; do Santos, L.M.A.L.; Benitez, L.B. Expected impact of industry 4.0 technologies on sustainable development: A study in the context of Brazil’s plastic industry. Sustain. Prod. Consum. 2021, 25, 102–122. [Google Scholar] [CrossRef]
  45. Kumagai, K. Sustainable plastic clothing and brand luxury: A discussion of contradictory consumer behaviour. Asia Pac. J. Mark. Logist. 2020, 33, 994–1013. [Google Scholar] [CrossRef]
  46. Dietrich, K.; Dumont, M.-J.; Del Rio, L.F.; Orsat, V. Producing PHAs in the bioeconomy—Towards a sustainable bioplastic. Sustain. Prod. Consum. 2017, 9, 58–70. [Google Scholar]
  47. Bai, C.; Dallasega, P.; Orzes, G.; Sarkis, J. Industry 4.0 technologies assessment: A sustainability perspective. Int. J. Prod. Econ. 2020, 229, 107776. [Google Scholar] [CrossRef]
  48. Velazquez, L.; Bello, D.; Munguía, N.; Zavala, A.; Marin, A.; Moure-Eraso, R. A Survey of Environmental and Occupational Work Practices in the Automotive Refinishing Industry of a Developing Country: Sonora, Mexico. Int. J. Occup. Environ. Health 2008, 14, 104–111. [Google Scholar]
  49. Munguía, N.; Zavala, A.; Marin, A.; Moure-Eraso, R.; Velazquez, L. Identifying pollution prevention opportunities in the Mexican auto refinishing industry. Manag. Environ. Qual. Int. J. 2010, 21, 324–335. [Google Scholar] [CrossRef]
  50. Brodin, M.; Vallejos, M.; Opedal, M.T.; Area, M.C.; Chinga-Carrasco, G. Lignocellulosics as sustainable resources for production of bioplastics—A review. J. Clean. Prod. 2017, 162, 646–664. [Google Scholar]
  51. Emadian, S.M.; Onay, T.T.; Demirel, B. Biodegradation of bioplastics in natural environments. Waste Manag. 2017, 59, 526–536. [Google Scholar] [CrossRef]
  52. Thakur, S.; Chaudhary, J.; Sharma, B.; Verma, A.; Tamulevicius, S.; Thakur, V.K. Sustainability of bioplastics: Opportunities and challenges. Curr. Opin. Green Sustain. Chem. 2018, 13, 68–75. [Google Scholar]
  53. Kale, G.; Kijchavengkul, T.; Auras, R.; Rubino, M.; Selke, S.E.; Singh, S.P. Compostability of Bioplastic Packaging Materials: An Overview. Macromol. Biosci. 2007, 7, 255–277. [Google Scholar] [CrossRef]
  54. Green Dot Bio-Plastics. What Growth in Bioplastics Industry Means for Investors and the Economy. Emporia, KS. 2019. Available online: https://www.greendotbioplastics.com/growth-bioplastics-industry-means-investors-economy/ (accessed on 20 January 2021).
  55. Guarnieri, P.; Streit, J.A.C.; Batista, L.C. Reverse logistics and the sectoral agreement of packaging industry in Brazil towards a transition to circular economy. Resour. Conserv. Recycl. 2019, 153, 104541. [Google Scholar]
  56. Friant, M.C.; Vermeulen, W.J.; Salomone, R. Analysing European Union circular economy policies: Words versus actions. Sustain. Prod. Consum. 2021, 27, 337–353. [Google Scholar]
  57. Guliyev, V.; Tanunchai, B.; Noll, M.; Buscot, F.; Purahong, W.; Blagodatskaya, E. Links among Microbial Communities, Soil Properties and Functions: Are Fungi the Sole Players in Decomposition of Bio-Based and Biodegradable Plastic? Polymers 2022, 14, 2801. [Google Scholar] [CrossRef] [PubMed]
  58. Oberti, I.; Paciello, A. Bioplastic as a Substitute for Plastic in Construction Industry. Encyclopedia 2022, 2, 1408–1420. [Google Scholar] [CrossRef]
  59. Suksiripattanapong, C.; Phetprapai, T.; Singsang, W.; Phetchuay, C.; Thumrongvut, J.; Tabyang, W. Utilization of Recycled Plastic Waste in Fiber Reinforced Concrete for Eco-Friendly Footpath and Pavement Applications. Sustainability 2022, 14, 6839. [Google Scholar] [CrossRef]
  60. Alrshoudi, F.; Abdus Samad, U.; Alothman, O.Y. Evaluation of the Effect of Recycled Polypropylene as Fine Aggregate Replacement on the Strength Performance and Chloride Penetration of Mortars. Polymers 2022, 14, 2806. [Google Scholar] [CrossRef]
  61. Jankowska, E.; Gorman, M.R.; Frischmann, C.J. Transforming the Plastic Production System Presents Opportunities to Tackle theClimate Crisis. Sustainability 2022, 14, 6539. [Google Scholar] [CrossRef]
  62. Martinho, G.; Balaia, N.; Pires, A. The Portuguese plastic carrier bag tax: The effects on consumers’ behavior. Waste Manag. 2017, 61, 3–12. [Google Scholar] [CrossRef]
  63. Convery, F.; McDonnell, S.; Ferreira, S. The most popular tax in Europe? Lessons from the Irish plastic bags levy. Environ. Resour. Econ. 2007, 38, 1–11. [Google Scholar]
  64. Kihlberg, I.; Risvik, E. Consumers of Organic Foods-Value Segments and Liking of Bread. Food Qual. Prefer. 2007, 18, 471–481. [Google Scholar] [CrossRef]
  65. Aschemann-Witzel, J.; Zielke, S. Can’t Buy Me Green? A review of Consumer Perceptions of and Behaviour toward the Price of Organic Food. J. Consum. Aff. 2015, 51, 211–251. [Google Scholar] [CrossRef]
  66. Aertsens, J.; Verbeke, W.; Mondelaers, K.; Van Huylenbroeck, G. Personal determinants of organic food consumption: A review. Br. Food J. 2009, 111, 1140–1167. [Google Scholar] [CrossRef] [Green Version]
  67. Shafie, F.A.; Rennie, D. Consumer Perceptions Towards Organic Food. Procedia-Soc. Behav. Sci. 2012, 49, 360–367. [Google Scholar] [CrossRef] [Green Version]
  68. Marian, L.; Chrysochou, P.; Krystallis, A.; Thøgersen, J. The role of price as a product attribute in the organic food context: An exploration based on actual purchase data. Food Qual. Prefer. 2014, 37, 52–60. [Google Scholar] [CrossRef]
  69. Rizzo, G.; Borrello, M.; Dara Guccione, G.; Schifani, G.; Cembalo, L. Organic Food Consumption: The Relevance of the Health Attribute. Sustainability 2020, 12, 595. [Google Scholar] [CrossRef] [Green Version]
  70. Massey, M.; O’Cass, A.; Otahal, P. A meta-analytic study of the factors driving the purchase of organic food. Appetite 2018, 125, 418–427. [Google Scholar] [CrossRef]
  71. Barbir, J.; Filho, W.L.; Salvia, A.; Fendt, M.; Babaganov, R.; Albertini, M.; Bonoli, A.; Lackner, M.; de Quevedo, D.M. Assessing the Levels of Awareness among European Citizens about the Direct and Indirect Impacts of Plastics on Human Health. Int. J. Environ. Res. Public Health 2021, 18, 3116. [Google Scholar] [CrossRef]
  72. Klein, F.; Emberger-Klein, A.; Menrad, K.; Möhring, W.; Blesin, J.-M. Influencing factors for the purchase intention of consumers choosing bioplastic products in Germany. Sustain. Prod. Consum. 2019, 19, 33–43. [Google Scholar] [CrossRef]
  73. Klein, F.F.; Emberger-Klein, A.; Menrad, K. Indicators of Consumers’ Preferences for Bio-Based Apparel: A German Case Study with a Functional Rain Jacket Made of Bioplastic. Sustainability 2020, 12, 675. [Google Scholar] [CrossRef] [Green Version]
  74. Zwicker, M.; Brick, C.; Gruter, G.-J.; van Harreveld, F. (Not) Doing the Right Things for the Wrong Reasons: An Investigation of Consumer Attitudes, Perceptions, and Willingness to Pay for Bio-Based Plastics. Sustainability 2021, 13, 6819. [Google Scholar] [CrossRef]
  75. Filho, W.L.; Saari, U.; Fedoruk, M.; Iital, A.; Moora, H.; Klöga, M.; Voronova, V. An overview of the problems posed by plastic products and the role of extended producer responsibility in Europe. J. Clean. Prod. 2019, 214, 550–558. [Google Scholar] [CrossRef]
  76. Watkins, E.; Gionfra, S.; Schweitzer, J.-P.; Pantzar, M.; Janssens, C.; Ten Brink, P. EPR in the EU Plastics Strategy and the Circular Economy: A Focus on Plastic Packaging; Institute for European Environmental Policy (IEEP): Brussels, Belgium, 2017. [Google Scholar]
  77. Shi, J.; Zhang, C.; Chen, W.Q. The expansion and shrinkage of the international trade network of plastic wastes affected by China’s waste management policies. Sustain. Prod. Consum. 2021, 25, 187–197. [Google Scholar] [CrossRef]
  78. GRID-Arendal & Basel Convention Secretariat. Plastic Waste and the Basel Convention. GRID-Arendal. 2021. Available online: https://storymaps.arcgis.com/stories/63f88d8da65841f3a13ba4018d26361d (accessed on 15 August 2021).
  79. Tabuchi, H.; Corkery, M. Countries Tried to Curb Trade in Plastic Waste. The U.S. Is Shipping More. New York Times. Available online: https://www.nytimes.com/2021/03/12/climate/plastics-waste-export-ban.html (accessed on 12 March 2021).
Figure 1. Advantages of bioplastics.
Sustainability 14 16542 g001
Figure 2. Methodology used in the research (source: authors).
Sustainability 14 16542 g002
Figure 3. Countries of respondents that participated in the survey.
Sustainability 14 16542 g003
Figure 4. Respondents’ knowledge about conventional plastics, by age.
Sustainability 14 16542 g004
Figure 5. Respondents’ knowledge about conventional plastics, by country development level.
Sustainability 14 16542 g005
Figure 6. Behaviour to reduce the use of conventional plastics.
Sustainability 14 16542 g006
Figure 7. Questions related to policies to encourage consumption of bioplastic/discourage consumption of conventional plastic, by gender. From left to right, the Pearson Chi (2) test for the five survey questions indicated in the graph, and the respective p-values are: 9.33, p-value = 0.009; 19.3923, p-value = 0.000; 7.4243, p-value = 0.024; 2.8299, p-value = 0.243; 12.4728, p-value = 0.002.
Sustainability 14 16542 g007
Table 1. Tools for assessing sustainable production (Source: authors).
ToolsAssessment
Life cycle assessmentMethod of defining and quantifying the environmental impact of processes or products. It may be complemented by Life Cost Analysis, which is the assessment of the costs through the lifetime of a given process or product [16]. ISO14041: environmental management-life cycle assessment–lays out the goal and scope definition [17]
Chemical inventory and disclosureA continuously updated list of the types, sources and quantities of all hazardous and non-hazardous chemicals associated with a product or process [18].
Chemical hazard assessmentThose flammable, toxic, corrosive and reactive chemicals are documented and their potential hazards are analyzed. Also referred to as Material Safety Data Sheets in some countries [19]
Exposure assessmentThe determination of the effect of not only chemicals but also physical and biological agents on the receptive mediums, mainly the human body [20,21].
Stakeholder assessmentStakeholders, such as government and institutions as well as all companies along the supply chain for production, are selected and the opinions of the stakeholders are reviewed [22].
Alternative’s assessmentTo evaluate and identify environmentally and socially preferable alternatives encompassing production processes, chemicals, materials, products, economic systems (such as transportation systems), and functions, as well as eliminating the need for a current activity or the function of a product [23].
Risk assessmentTo assess the risk posed by both external and internal factors to the stability and efficiency of the supply chain [24,25]
Benefit-cost analysisTo assess all associated costs as well as benefits for production in terms of their monetary value equivalent [26]
Ecosystems-services valuationAssessment of all benefits to humans from nature expressed in four groups: provisioning, such as the production of food and water; regulating, such as the control of climate and disease; supporting, such as nutrient cycles and oxygen production; and cultural, such as spiritual and recreational benefits [27]
Impact assessmentsAssessment of the effects of a process or facility on the environment, including biophysical, social, strategic and cumulative assessment activities [28]. Social impact assessments can be part of environmental impact assessments (EIAs) or stand-alone documents.
Footprint analysisA quantitative measurement describing the appropriation of natural resources by humans, usually measured in units of area or product, and can involve environmental, social, and economic dimensions of the subject [29]
Trade-off and synergy assessmentsAssessment of interconnectedness between subjects presented as synergies (positive effects of a target achievement on ecosystem services that would, in turn, allow for obtaining other positive outcomes), or trade-offs (risks taken that may cause potential adverse effects to achieve a positive outcome in lieu of achieving a different positive return) [30]
Multicriteria decision analysis (MCDA)Determining a preference ordering by scoring among a few available options according to several objectives or criteria identified by relevant stakeholders, followed by employing multicriteria to combine the criteria scores obtained for each option into an overall preference ranking or choice of option [31]
Material/substance flow analysis (MFA)Systematic assessment of the state and changes of flows and stocks of materials within a system defined in space and time [32]
Table 2. Coverage of the survey questions (source: authors).
Demographic Data (i.)Knowledge and Awareness about Conventional Plastics and Bioplastics (ii.)
CountryUnderstanding of what plastics are
GenderConcerns about (bio)plastic products
Age
Education
Table 3. Frequency of respondents’ age groups, education level, and country’s development level.
Age%Education%Development Level%
18–2542.38High school or less12.91Low income0
26–3510.26Bachelor’s degree45.70Lower-middle income2.0
36–4523.51Trade school2.32Upper-middle income42.7
46–5916.23Master’s degree19.54High income55.3
60+7.62PhD or higher19.54
Table 4. Frequency and percentage of respondents’ reasons for concern about conventional plastic, by educational level. Pearson chi2(16) = 29.1904, p-value = 0.023.
No.ReasonBachelor’s DegreeHigh School or LessMaster´s DegreePhD or HigherTrade SchoolTotal
1I am concerned about BPA, which mimics the hormone oestrogen and can cause long-term effects on the human body16327028
%14.168.824.7614.58011.52
2I am concerned about the toxic components in conventional plastic products that can affect human health621229192124
%54.8735.2969.0539.5833.3351.03
3I am concerned, because I do not know how to avoid plastics12753229
%10.6220.5911.96.2533.3311.93
4I am concerned, because microplastics have a negative effect on human health2312517259
%20.3535.2911.935.4233.3324.28
5Other001203
%002.384.1701.23
Total1133442486243
Table 5. Joint Relative Frequencies between Question 19 and Question 20.
ITEMSQuestion 20
Yes
(A)
No
(B)
I Do Not Know
(C)
Question 19Yes (A)0.68210.02320.0596
No (B)0.04640.05630.0066
I do not know (C)0.08610.00330.0364
Table 6. Joint relative frequencies between Question 12 and Question 18.
ITEMSQuestion 18
Yes
(A)
No
(B)
I Do Not Know
(C)
Question 12Yes (A)0.37750.05960.0331
No (B)0.22520.10260.0331
I do not know (C)0.10930.03310.0265
Table 7. Joint relative frequencies between Question 2 and Question 10.
ITEMSQuestion 10
Yes
(A)
No
(B)
I Do Not Know
(C)
Question 2Yes (A)0.65230.00660.0132
No (B)0.15560.03310.0066
I do not know (C)0.12250.00330.0066
Table 8. Joint relative frequencies between Question 2 and Question 16.
ITEMS Question 16
Up to 10%
(A)
Between 10–25%
(B)
Between 25–40%
(C)
More than 40%
(D)
Other
(E)
Question 2Yes (A)0.28870.23370.07560.01030.0275
No (B)0.08250.05840.00690.00690.0137
I do not know (C)0.02410.05840.01720.00340.0034
Publisher’s Note: MDPI stays neutral with regard to jurisdictional claims in published maps and institutional affiliations.

