Article

The Impact of the Aggregate Used on the Possibility of Reducing the Carbon Footprint in Pavement Concrete

Faculty of Civil Engineering and Geodesy, Military University of Technology, 2 Kaliskiego St., 00-908 Warsaw, Poland
Sustainability 2022, 14(24), 16478; https://doi.org/10.3390/su142416478
Submission received: 3 October 2022 / Revised: 3 December 2022 / Accepted: 6 December 2022 / Published: 9 December 2022

Abstract

:
The aim of this work was to try to reduce the carbon footprint by means of various types of aggregates which are used for concrete intended for road construction. Four types of aggregates were used in the study: local gravel and dolomite, as well as commonly used granite and amphibolite. Aggregates differed not only in their basic properties, but also in the type of minerals, their origin, and, above all, the distance from the construction site. For the experimental tests, a constant amount of CEM III 42.5 HSR-NA cement, 0/2 mm natural sand, and chemical admixtures based on polycarboxylate and air entrainment were used. For each of the four series, the compressive, flexural, and tensile strength were determined. In order to verify the durability of concrete, the frost resistance in salt and the pore structure in hardened concrete were determined after 150 cycles of freezing and thawing. As a result of the research, it was found that the highest compressive strength was obtained for composition based on amphibolite aggregate. The flexural strength for all series exceeded 5.5 MPa, and the highest tensile strength results were obtained for a composition based on dolomite aggregate. An additional element of the work was the determination of the carbon footprint for each recipe and the comparative analysis. As a result of the analysis, it was possible to reduce the carbon footprint by 32% thanks to the use of CEM III cement instead of CEM I. Additionally, the use of local aggregates located 80 km from the construction site allowed the carbon footprint to be reduced by another 19.2%.

1. Introduction

One of the most commonly used building materials in the world is cement concrete. It is estimated that the annual consumption of concrete in the world is over thirty billion tons. The production of one of the main components of concrete, which is cement, amounts to approx. 4.6 billion tons per year (eighteen million tons per year in Poland in 2018), which is the source of 5% of the global production of CO2 [1]. This indicates that the production of cement and concrete is an essential element of continuous improvement in the context of a low-carbon economy [1]. Therefore, it is especially important to constantly reduce the carbon footprint, and its reduction lowers CO2 emissions into the atmosphere. The possibility of achieving sustainable concrete involves continuous material and technological optimization; therefore, this article analyzes the use of four different types of aggregates in terms of assessing the properties of concrete pavements in the context of the possibility of reducing CO2 emissions. In the case of concrete, the life cycle includes the extraction of raw materials, production, transport, incorporation, and recycling. Cement is responsible for the highest CO2 emissions in concrete, i.e., high-energy and chemical gas emission during clinker production, in the amount of 45% of total emissions [2]. An essential element of the life cycle is the process of concrete carbonation. Under the conditions of exposure to atmospheric action, CO2 reacts with calcium hydroxide Ca(OH)2. The authors of the works in [3,4,5] stated in their analyses that a much greater absorption of CO2 will occur during the full recycling of concrete, because, despite crushing, it still absorbs CO2. In addition, it can be rebuilt, as was the case with the construction of the A6 motorway in Szczecin. After the 80-year-old concrete had been crushed, it was built in as the foundation for the renovated motorway. The cement production process has already been optimized, but the technology process is still being worked on to reduce energy consumption by using a greater proportion of alternative fuels. Extraction of other components, transport, and production of mixtures have a much smaller impact on greenhouse gas emissions from concrete than cement [6]. In addition to cement, the factor that strongly affects the amount of CO2 emissions may be the transport of the aggregate, namely the distance from the mine to the construction site. According to Sjunnesson’s analysis, 5.36 kg of CO2 are produced in the production of 1 ton of aggregate, but this does not include transport to the concrete plant, which significantly increases emissions [7]. Louise K. Turner [6] considered the transport of the aggregates in the calculations and determined the emission as 13.9 kg CO2 for sand and 40.8 kg CO2 for coarse aggregate. The direction that gives the fastest effect of reducing the carbon footprint in cement concrete is reducing the amount of clinker used in the cement and replacing it with mineral materials with a much lower emission factor [8,9]. This can be achieved using mineral additives that partially replace clinker in cement, such as fly ash or granulated blast furnace slag (GGBS) [10]. According to studies [11,12], reducing CO2 emissions by 40% in a cubic meter of concrete is possible thanks to the use of CEM III cement, which contains 45% of clinker and 55% of blast furnace slag, also known as industrial waste. The obtained results of tests of cement concrete prepared based on CEM III confirmed that all the required parameters of the technical specification were met [12]. Numerous research works have been conducted on the modification of concrete composition thanks to the use of chemical admixtures, mineral additives, or fibers allowed for the use of industrial and stone waste [13,14,15,16,17,18,19]. However, it is actually the use of multi-component cements that is of the greatest importance for the reduction in CO2 emissions in cement concrete [20,21,22,23]. The second, equally essential element is the search for types of aggregates that are particularly available locally, in order to reduce transport costs. An additional argument for the use of more local aggregates, such as limestone and dolomite, in the infrastructure is a significant reduction in the possibility of an alkaline reaction in concrete. In the published literature, one can find works on the use of several types of aggregates in infrastructure construction [24,25,26]. It should always be remembered that when modifying the concrete composition, one should not forget about the use of air-entraining admixtures to improve durability, which should be verified during the tests of the aeration structure and resistance to frost and water [27,28,29,30]. Cement concrete, when properly aerated, meets today’s very high requirements [31,32,33,34,35]. This, combined with the process of optimizing the composition of the concrete mix in terms of the aggregates used and innovative solutions in the scope of chemical admixtures, allows us to obtain concrete surfaces with very high properties [36]. Chemical admixtures, apart from a significant increase in durability, allow us to increase the workability and plasticity of the mix, and this contributes to the extension of the technological process of transport and incorporation of the concrete mix from 30 min to up to 3 h, without losing the required parameters of the concrete mix during installation [37,38]. Research work performed in the field of aeration assessment and verification of frost resistance has confirmed that a professionally designed mixture and a cement-compatible air-entraining admixture can create the proper structure of air pore distribution, guaranteeing the durability required for concrete pavements [22,39,40,41,42]. Drilled samples and numerous tests of the concrete pavement of the A6 and A18 motorways in Poland, used for over 80 years, have confirmed that the tested concrete pavement is exceptionally durable, the obtained results of compressive strength exceed 60 MPa, and frost resistance after 150 cycles, as well as pore distribution analysis, meet the requirements for newly built highways [30]. Considering the concrete pavement’s full life cycle, it should be assumed that after exceeding its full-service life, cement concrete can be 100% recycled and rebuilt as whitetopping [43]. Very high requirements outlined in the provisions of technological recommendations for aggregates used in road surfaces in Poland mean that we can only use three types of aggregates, which are located at very large distances from construction sites. Therefore, the main purpose of the research was to verify the possibility of using local aggregates, such as gravel or dolomite, located only 100 km from the Warsaw-Radom expressway construction site, compared to granite and amphibolite, which are located 300 and 450 km, respectively. An important element of the work was also the analysis of the carbon footprint and the assessment of the possibility of reducing it during subsequent construction of concrete paved roads.
Research on the use of cements with mineral additives and local aggregates, such as gravel and dolomite, in Poland is an important element of the studies and analyses aimed at reducing carbon dioxide emissions into the atmosphere. An element of novelty is the performance of full tests with the use of three types of cements, which were published in Materials [12], and the assessment of the possibility of using gravel and dolomite as road surfaces for heavy traffic.

2. Materials and Methods

2.1. Materials

The basic assumption of the project was the use of CEM III 42.5 HSR-NA cement (cement characteristics are presented in Table 1) at a constant amount of 380 kg/m3. In terms of aggregates, 0/2 mm sand, meeting the requirements of the technical specification, and four types of aggregates were used: two local types of gravel and dolomite and two commonly used ones, granite and amphibolite, the mines of which are located 300 and 450 km away from the construction site, respectively. The aggregates used for the tests were 2/8- and 8/16-mm fractions. C35/45 class pavement concrete, with a water/cement ratio of a constant value of 0.40, was designed. In order to increase the durability of concrete, 2 chemical admixtures of a plasticizer based on lignosulfonate and naphthalene, as well as an air-entraining admixture, were used. The properties of the concrete mix were verified after 5 and 60 min of mixing the ingredients. Concrete tests were conducted after 7, 28, and 90 days.
The main component of CEM III cement is granulated blast furnace slag, the content of which exceeds 50%, while the clinker content is limited to a maximum of 45%. Blast furnace slag has pozzolanic properties, and is, therefore, a suitable material to replace clinker [44].

2.2. Determination of the Petrographic Composition of the Tested Aggregates in Accordance with EN 932-3:1999/A1: 2004

The petrographic tests and the description of the results obtained from the examination of the four types of aggregates used in the work are presented below. Photos of aggregate samples are shown in Figure 1.
Gravel is a natural aggregate formed from loose form crumbs of sedimentary rock composed of various rocks and minerals. The aggregate contains quartz grains with a medium-crystalline structure and a non-directional, compact, massive texture. The main ingredients are quartz, dolomite, limestone, and feldspar. Dolomite is a natural aggregate, crushed from creamy to yellow sedimentary rocks, with a gray cut off. The aggregate is dominated by carbonate micrite, calcite, spite, dolomite, and chalcedonite grains. Granite is a natural aggregate, crushed with an igneous rock, of an autumn gray color with a yellow tinge. The grains have a medium-crystalline structure and a non-directional, dense, massive texture. The main ingredients are quartz, feldspar, orthoclase, plagioclase, albite, amphibole, biotite, and muscovite. Approximately 20% of the grains have a yellow-orange discoloration, which proves the presence of iron oxides and hydroxides. Amphibolite is a natural aggregate, crushed from a dark gray metamorphic rock (amphibolite) with a greenish tinge. The aggregate is dominated by amphibolite grains with a fine-crystalline structure and a non-directional, compact, and massive texture. The main ingredients are amphibole, plagioclase, quartz, epidote, granite, and biotite.

2.3. Methods

As part of the assessment of the properties of the concrete mix, the concrete density of the mixture was determined according to PN-EN 12350-6 [45], the air content according to PN-EN 12350-7 [46], and the consistency by the Vebe method, according to PN-EN 12350-2 [47]. The tests were carried out 5 and 60 min after the completion of mixing the components, simulating the time necessary for the transport and incorporation of the mixture.
In the second part of the tests, the frost resistance was determined according to PN-B-06265 [48], the characteristics of air pores in concrete according to PN-EN 480-11 [49], and resistance to de-icing agents according to PKN-CEN/TS EN 12390-9 [50]. The frost resistance test was performed on 12 samples for each designed recipe.
Additionally, compressive strength tests according to PN-EN 12390-3 [51] after 7, 28, and 90 days, concrete tensile strength according to PN-EN 12390-5 [52], and bending strength according to PN-EN 12390-5 were performed [53] after 7 or 28 days of puberty. Then, 3 tests were performed for each determination, and 6 samples for each recipe for compressive strength. The components and their proportions in the concrete mix have been designed in accordance with the requirements for pavement concrete, according to D-05.03.04 cement concrete pavement [34] and the catalog of typical rigid pavement structures [35] presented in Table 2 below.
The test was carried out for 4 recipes, which were characterized by a constant amount of cement (380 kg/m3) and a constant w/c ratio of 0.40. The only difference was the type of aggregate: gravel with a density of 2.63, dolomite with a density of 2.74, granite with a density of 2.65, and amphibolite with a density of 2.95 (g/cm3). All aggregates were 2/8- and 8/16-mm fractions, and sand had a density of 2.64 (g/cm3) of the 0/2 mm fraction. Aggregate fractions are presented in Table 3.
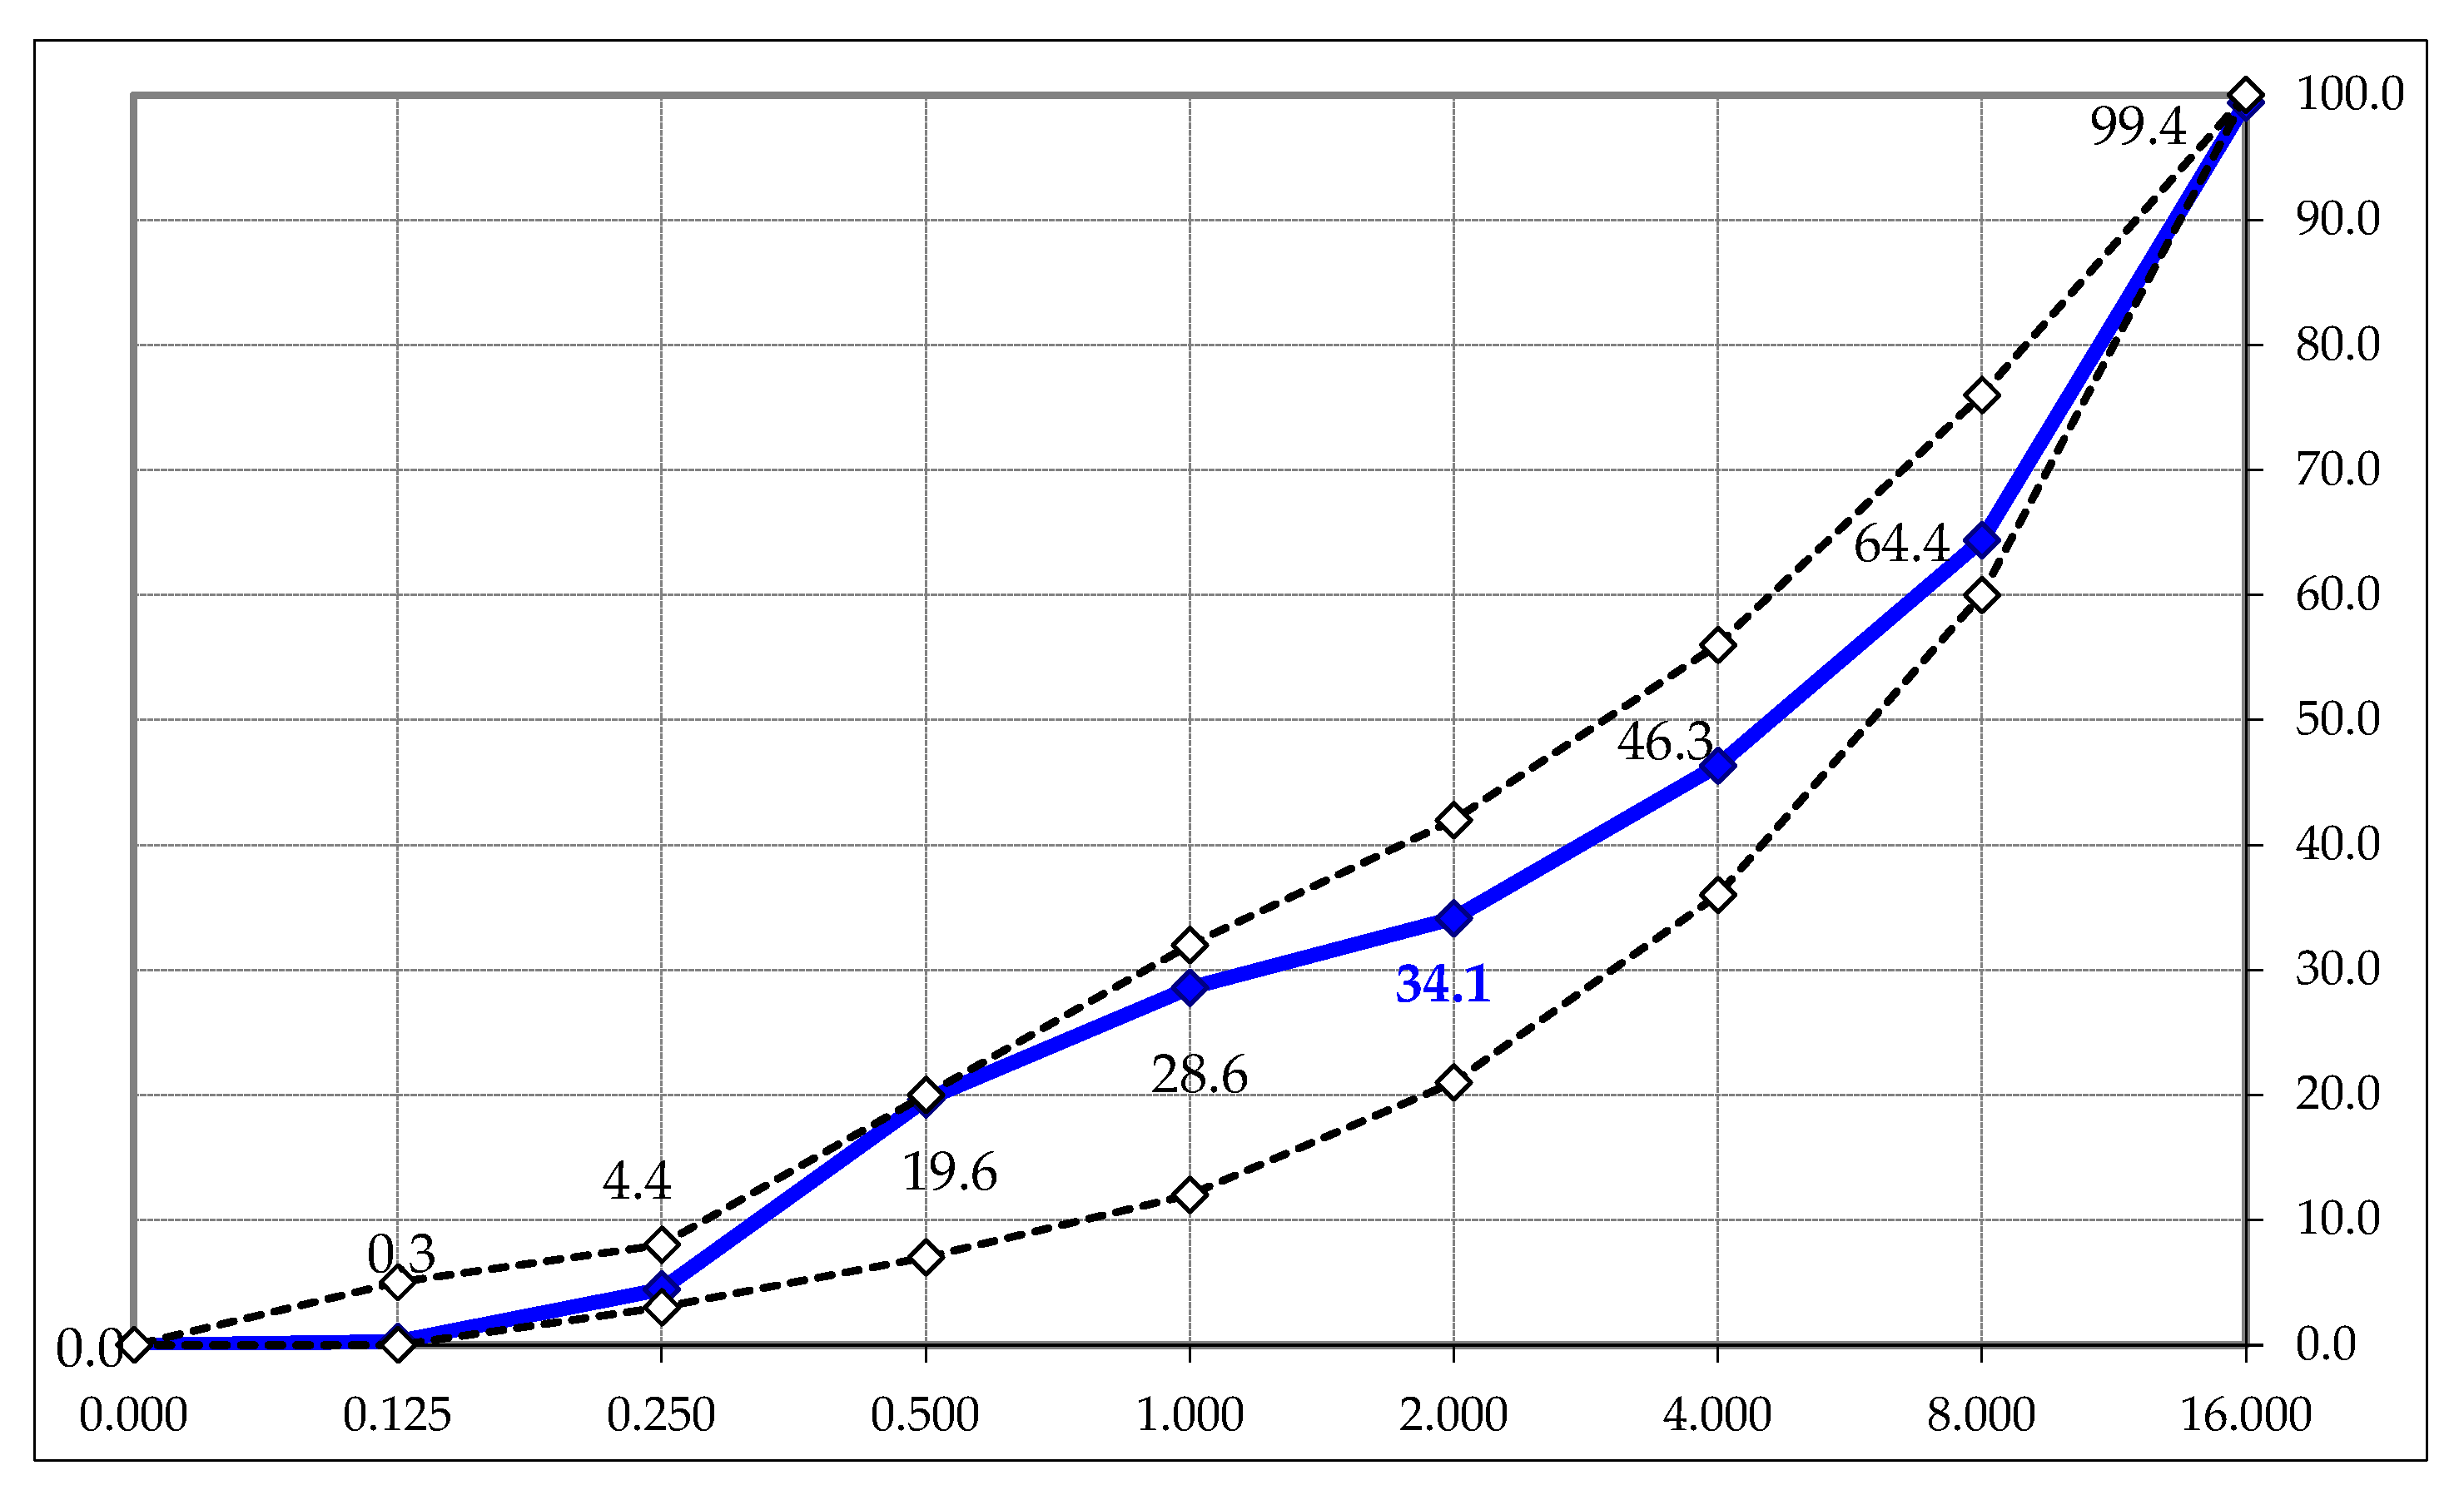
The gradation of the mineral mix, along with the recommended graining curves resulting from the requirements of the technical specification, are shown in Figure 2 below:
The detailed composition of the designed recipes is presented in Table 4.
As part of the experiment, over 160 samples were prepared and tested. They were then formed and stored during curing in accordance with the requirements of EN 12390-2. The detailed scope of concrete mix and concrete tests is described in Section 2.2 of the methods. Designations for individual recipes, which will be used in the further part of the work, mean the following: A_I concrete from gravel aggregate, A_II from dolomites, A_III from granite, and A_IV from amphibolite aggregate.

3. Results

3.1. Assessment of Concrete Mix Properties

The properties of the concrete mix were determined after 5 min of mixing the components and after 60 min, in order to simulate workability during transport and incorporation of the mix. The study determined the consistency in accordance with PN-EN 12350-3, the air content in the concrete mix in accordance with PN-EN 12350-7, and the density of the mix in accordance with PN-EN 12350-6. The obtained results are presented in Table 5.
By analyzing the obtained results of the consistency determination after 5 and 60 min, it can be seen that the highest parameters were obtained for the A_II concrete mix made of dolomite aggregate. The tested concrete mix for A_II after 60 min retained the assumed consistency, and the air content decreased by 0.3%. For the A_I mix based on gravel, the consistency ranged from 9–14 s after 60 min, and the air content from 6.3–5.5% after 60 min. All results were within the parameters required by the specification for the concrete pavement.

3.2. Compressive Strength

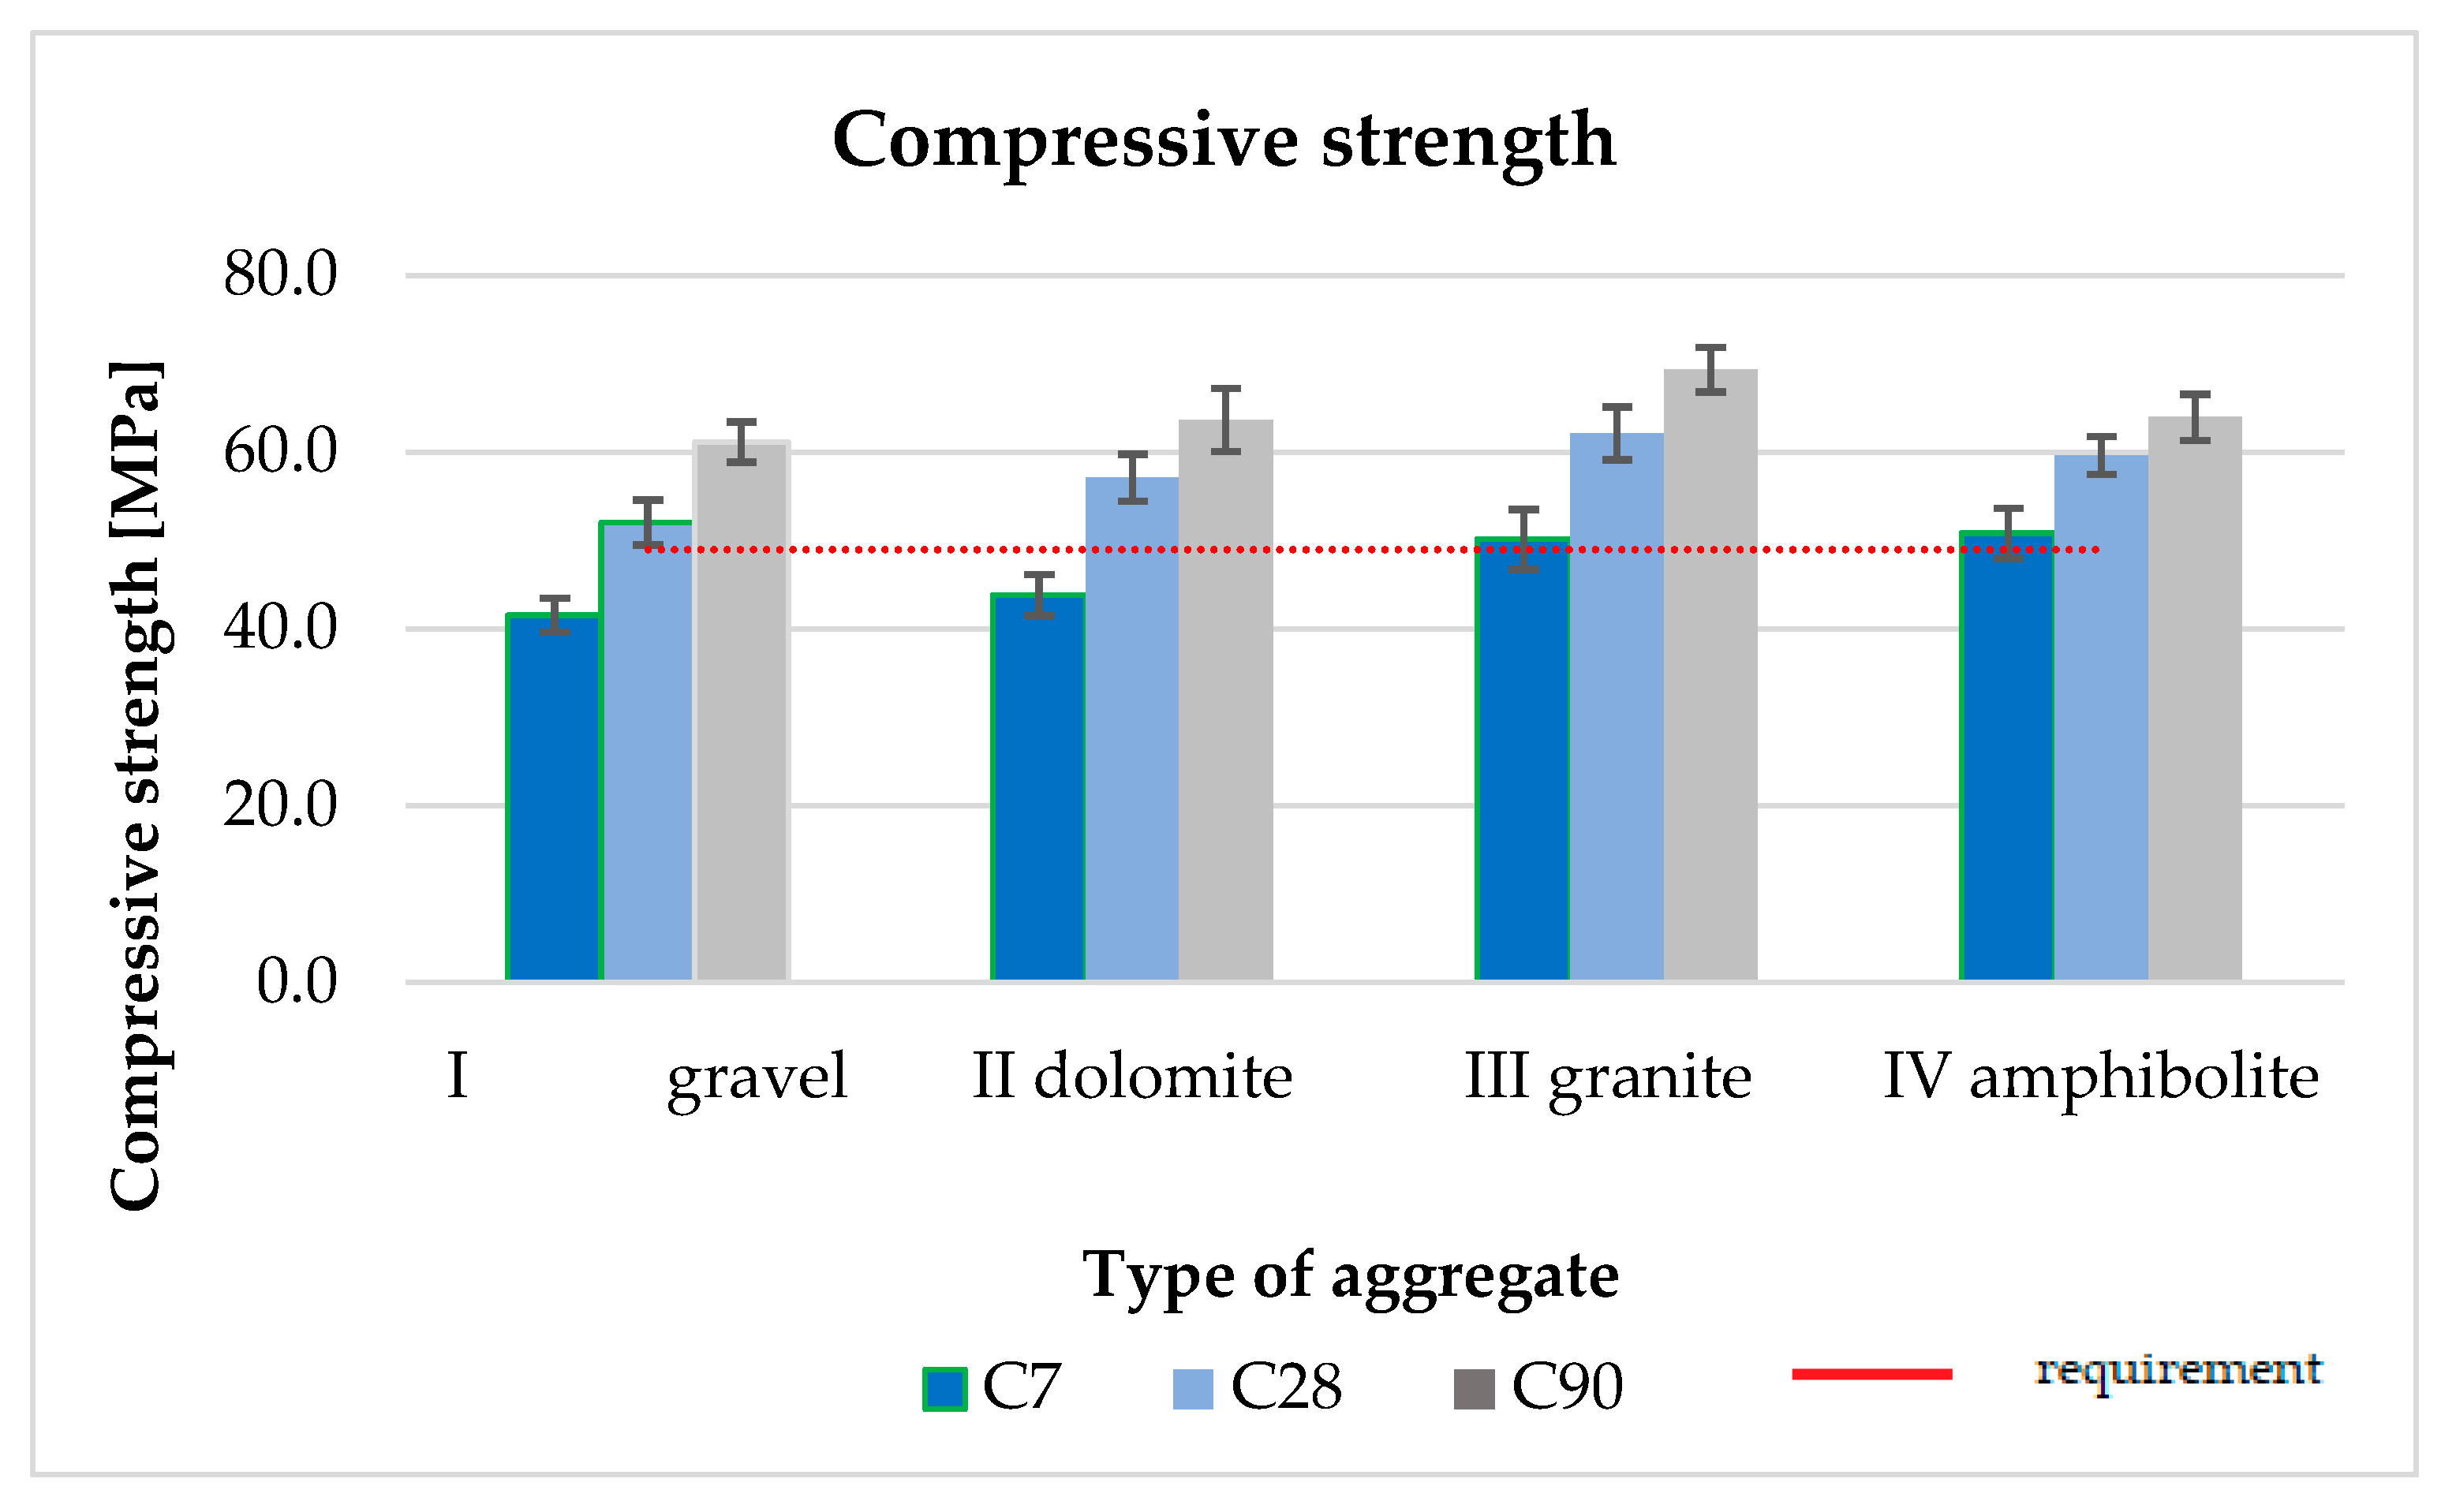
Compressive strength was determined according to PN-EN 12390-3 after 7, 28, and 90 days of curing. As part of the tests, 36 samples were prepared in accordance with the requirements of EN 12390-2. The test results are summarized in Table 6 and Figure 3.
When analyzing the obtained results of the compressive strength test of cement concrete, it should be noted that the highest values were obtained for A_III concrete based on CEM III after 28 and 90 days of maturation. Concrete A_I obtained the lowest strength after 7, 28, and 90 days, because it is made of gravel aggregate with the lowest strength. Regardless of the type of aggregate, after 28 days, all concretes achieved the minimum requirements of 49 MPa, and after 90 days, their parameters increased from 5 to 9 MPa. Concrete based on CEM III cement reached 50.2, 62.2, and 69.4 MPa, respectively, after 7, 28, and 90 days of hardening. After 90 days of maturation, the results of the concrete compressive strength ranged from 61.2 MPa with the use of gravel to 69.4 MPa for the granite aggregate.

3.3. Flexural Strength

The flexural strength was determined in accordance with PN-EN 12390-5 after 28 and 90 days of curing. A total of 16 samples were prepared for the test, in accordance with the requirements of EN 12390-2. The test results are presented in Table 7.
The formulas subjected to the flexural strength test with the use of four different types of aggregates met the requirements for concrete pavements, because they reached a minimum of 5.5 MPa. Analyzing the obtained results, we can see that the highest bending strength was obtained for concrete with A_II after both 28 and 90 days of curing. For the concrete mix A_II, 6.4 and 7.2 MPa were reached after 28 and 90 days of curing, respectively, and for the concrete mix A_I gravel, the obtained results were lower by 10% and 11% compared to A_II. The increase in bending strength for concrete from dolomite aggregate from the 28th day to the 90th day was 10.9%.

3.4. Tensile Strength

The indirect tensile strength was determined after 28 and 90 days of curing, in accordance with PN-EN 12390-6 [53]. As part of the tests, 24 samples, with dimensions of 150 × 150 × 150 mm, were made in accordance with the requirements of EN 12390-2. The results are presented in Table 8.
All of the designed C35/45 concrete formulas reached the minimum 3.5 MPa required by the specification [34,35]. The highest tensile strengths were achieved for formulas A_II and A_IV.

3.5. Frost Resistance after 150 Cycles

Determination of frost resistance was performed according to PN-B-06250: 1988. This test consists of performing 150 cycles of freezing and thawing from −20 °C to +20 °C [48]. As part of the study, 48 samples, with dimensions of 100 × 100 × 100 mm, were made. After 28 days of maturation, six samples were weighed and subjected to 150 freeze–thaw cycles. The remaining six samples were immersed in water as reference samples. In accordance with the requirements of the PN-B-06250: 1988 standard, the weight loss could not exceed 5%, and the decrease in compressive strength could not exceed 20%. After the end of the 150-cycle test, the samples could not have any cracks or losses. A summary of the average results of frost resistance is presented in Table 9.
The obtained results of frost resistance after 150 cycles indicate that the requirements of the standard were met for all types of aggregates. Detailed analysis shows that the smallest decrease in compressive strength was obtained for concrete made of A_IV amphibolite aggregate, whereas the decrease in compressive strength was only 1.7%. On the other hand, the greatest drops in compressive strength, amounting to 17.4%, were obtained for gravel concrete marked as A_I.

3.6. Air Void Analysis

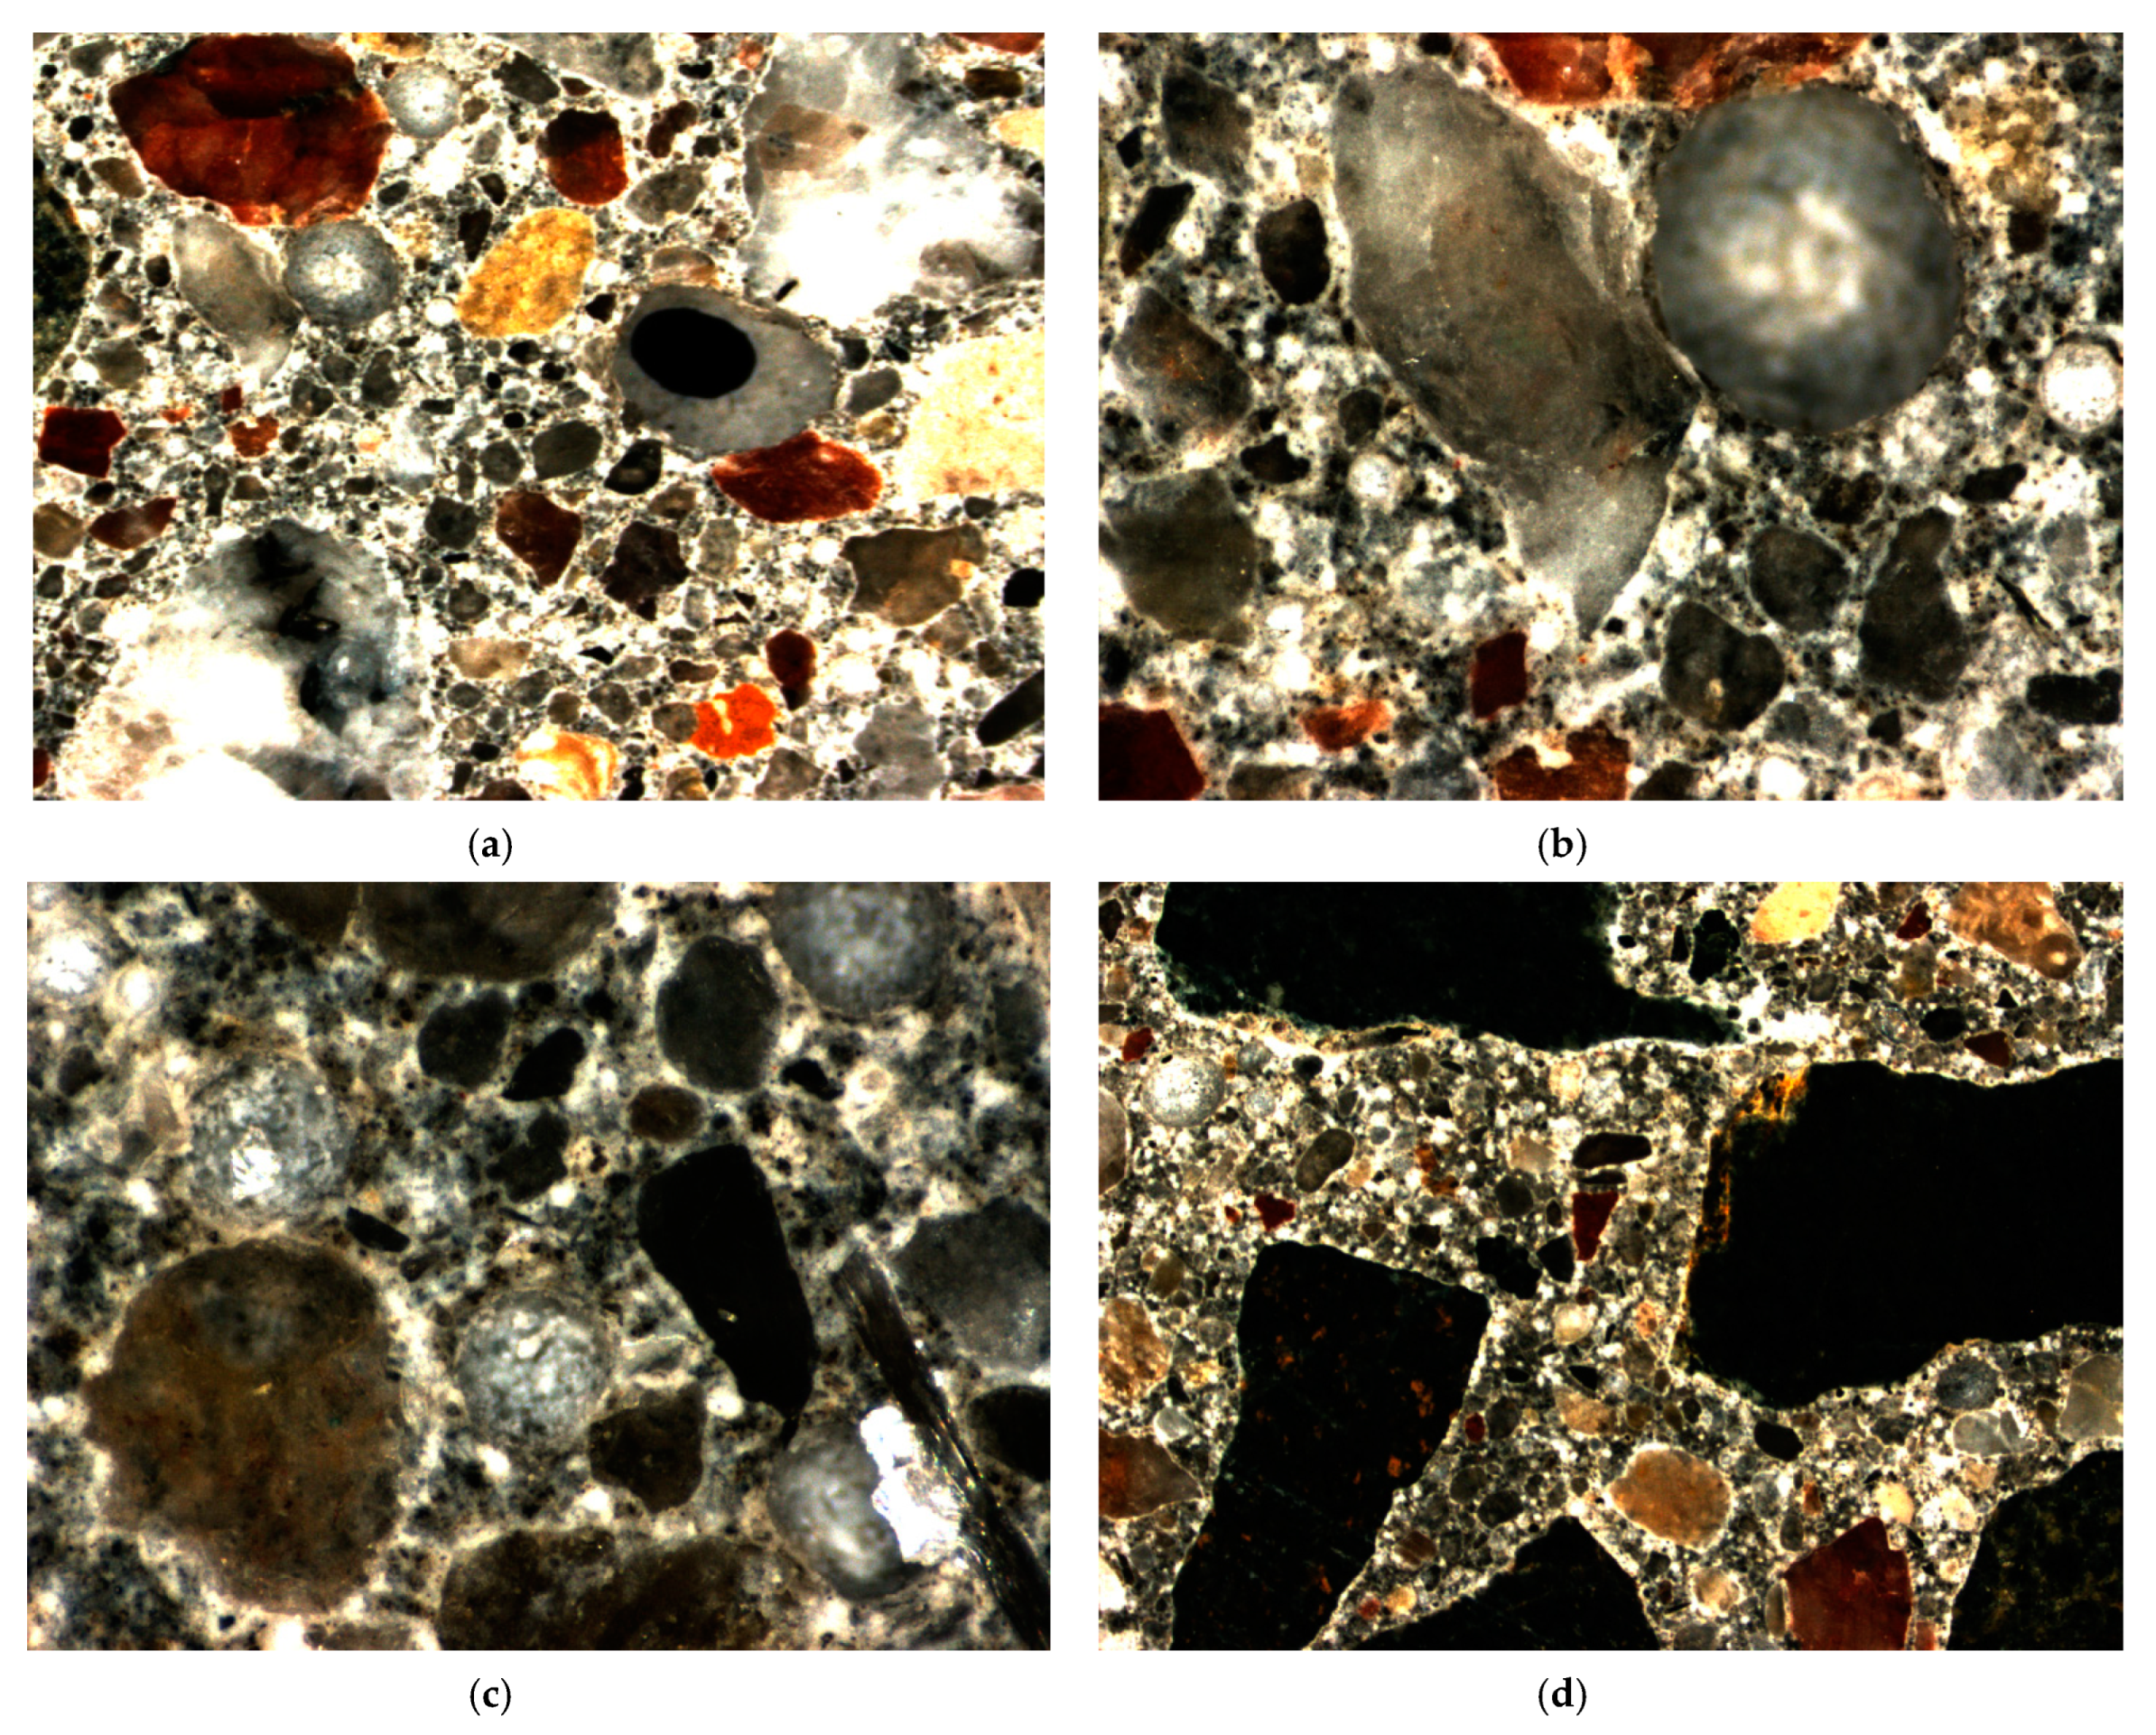
As part of the durability assessment of cement concrete, two additional samples, with dimensions of 150 × 100 × 20 mm, were made from each recipe of the tested concrete in order to determine the aeration structure. The study was carried out using a microscope and a computerized image analysis system, Nikon SMZ1270 Navitar. The analysis was based on the EN 480-11:2008 standard. Images of the prepared samples are shown in Figure 4.
The study consisted of determining the total amount of air, the size of individual air voids, and the distance between them. By determining the air content (quantity, pore diameter, and distance between air bubbles) in stiffened concrete, the durability of cement concrete can quickly be assessed. The basic values of the characteristics of void spaces are presented in Table 10.
The result presented in Table 10 is the average of four analyzed concrete samples. After analyzing the results for the pavement concrete used under XF conditions, it should be concluded that these samples meet the requirements of the specification. A very important conclusion is that the measured total air content is comparable to the aeration parameters in the concrete mix, given in point 3.1 by the pressure method (from 5.0–5.9%). The analysis of the air entrainment for four different recipes shows that for concrete with dolomite aggregate, the lowest air distribution value, L = 0.08 mm, and the highest micro volume content, A300 = 3.45%, were obtained.

3.7. Determination of Resistance to Freezing and Thawing in the Presence of De-Icing Salts

Resistance to freezing and thawing in the presence of de-icing salts was performed according to the procedure described in EN 12,390 PKN-CEN/TS 12390-9 [50]. Three samples were prepared for each of the recipes. The sealed and protected specimens were subjected to cycles of freezing and thawing in 3% NaCl, according to the procedure. The weight of the husked material was determined after 28 and 56 cycles. The mean result of the three samples is presented in Table 11.
During the evaluation, it should be indicated that for each of the samples, the weight loss from a single sample was less than 1.5 kg/m2, and the average weight loss determined after 28 and 56 test cycles was less than 1.0 kg/m2. The ratio of weight loss after 56 days to weight loss after 28 days was less than the required result of 2. The obtained values of resistance to freezing–thawing in the presence of de-icing salts meet the requirements of category FT2 for freezing–thawing specified in the standard EN 13877-2:2013-08, except for the results of the gravel aggregate recipe, for which the requirements have not been met.

3.8. Carbon Footprint

The carbon footprint analysis was performed for concrete with the use of three cements differing in the content of mineral additives and the amount of cement clinker. The carbon footprints of CEM III, CEM II, and CEM I cements, determined by the LCA method, and the carbon footprint of ISO 14,067 of Products Requirements and Guidelines for Quantification and Commun/caf/on, are: CEM I—0.875 kg CO2/kg of product; CEM II—0.715 kg CO2/kg of product; CEM III—0.578 kg CO2/kg of product [11]. Assuming that the transport distance for cement is 100 km, and for granite aggregate, 250 km, the following carbon footprint for the analyzed pavement concretes can be obtained from Table 12.
The first stage of the research project, which was published in Materials [12], concerned the carbon footprint analysis, which was carried out for pavement concrete with the use of three cements, differing in the content of mineral additives and the amount of cement clinker (CEMI, CEM II, and CEM III). Assuming that the cement transport distance is 100 km, the carbon footprints for the analyzed types of pavement concrete are presented in Table 12.
In this paper, which was the next step in the analysis of the possibility of reducing the carbon footprint, it was assumed that the mixtures were made on CEM III (for which the best values of cement concrete were obtained), and further analyses were conducted for concrete using four types of aggregates, such as gravel, dolomite, granite, and amphibolite, with different properties and transport distances from the construction site located in the vicinity of Warsaw. The carbon footprint of concrete was calculated, assuming that the aggregate transport distance was 150 km for gravel, 80 km for dolomite, 300 km for granite, and 450 km for amphibolite. The final carbon footprint for the analyzed types of paving concrete is presented in Table 13.
The obtained results indicate that the lowest carbon footprint was obtained for recipe A_II, with cement containing 55% of blast furnace slag and dolomite aggregate. The highest carbon footprint was obtained for the A_IV recipe, from amphibolite aggregate. Table 12 shows that we can easily reduce CO2 emissions by up to 32% by using CEM III cement instead of CEM I [12]. In addition, using a local aggregate located 80 km away from the construction site reduces the carbon footprint by 19.2% compared to A_IV.

4. Discussion

The pavement concrete used for road construction, made of CEM III 42.5 HSR-NA cement, meets the requirements in terms of strength, and is characterized by high durability over time. The paper analyzes the possibility of using local aggregates, namely gravel and dolomite, as well as commonly used aggregates, such as granite and amphibolite, which are located far from the construction site. The obtained test results confirmed the fulfillment of high strength and durability requirements. Additionally, as part of the analysis of the possibility of reducing the carbon footprint in the study [11], it was shown that it is possible to reduce CO2 emissions by up to 35% thanks to the use of CEM III 42.5 HSR-NA cement. Based on preliminary assumptions, the possibility of further reduction in the carbon footprint by using four different aggregates was verified. The calculations performed in Table 13 demonstrated that the concrete with the lowest carbon footprint was A_II, based on dolomite aggregate. After comparing the properties of the concrete mix in terms of workability and stability of parameters over time, it turned out that the most stable mix was A_II, made of dolomite aggregate. The strength parameters also confirmed this, because concrete with CEM III made on dolomite aggregate had the highest compressive and bending strength. Despite the common opinion that dolomite and limestone aggregates are not considered hard and durable rocks, the results of durability tests of concrete during the determination of frost resistance, as well as a detailed analysis of the aeration structure, confirmed the possibility of using a local aggregate, i.e., dolomite, for concrete pavement. An additional conclusion from the research is the possibility of a significant reduction in the carbon footprint by using both dolomite aggregate and CEM III cement with a large amount of blast furnace slag. The obtained results indicate that the lowest carbon footprint was obtained for recipe C_II, with cement containing 55% of blast furnace slag and dolomite aggregate. The highest carbon footprint was obtained for the C_IV recipe from amphibolite aggregate. Table 12 shows that we can easily reduce CO2 emissions by up to 32% by using CEM III cement instead of CEM I. In addition, using a local aggregate located 80 km away from the construction site reduces the carbon footprint by 19.2% compared to C_IV.

5. Conclusions

Analyzing the results of tests of cement concrete C35/45, differing in the type of aggregate at the constant cement volume of CEM III 380 kg/m3 and w/c = 0.4, the following conclusions can be drawn:
  • Four types of aggregate were used in the work (gravel, dolomite, granite, and amphibolite). The results of the compressive, bending, and splitting strength tests meet the requirements for the road surface made of cement concrete.
  • In terms of durability tests, i.e., resistance to frost, analysis of the aeration structure and resistance to de-icing salts, only gravel failed to pass the salt test. The remaining concrete mixes achieved the required parameters.
  • The highest compressive strength results were obtained for granite aggregate, at 69.4 MPa, and the highest bending parameters were obtained for concrete with dolomite aggregate, at 7.2 MPa.
  • By analyzing the individual properties of the concrete mix, it can be concluded that the dolomite aggregate concrete mix has the best rheological properties, both 5 and 60 min after mixing the components.
  • The use of CEM III cement instead of CEM I reduces the carbon footprint by 32%, and if we use locally available dolomite aggregate, we can reduce the carbon footprint by another 19%, thus including pavement concrete among environmentally friendly materials.
  • The obtained values of resistance to freeze–thaw in the presence of de-icing salts meet the requirements of category FT2 for freeze–thaw, which is specified in the standards. One condition was not met for concrete with gravel aggregate.

Funding

This research received no external funding.

Institutional Review Board Statement

Not applicable.

Informed Consent Statement

Not applicable.

Data Availability Statement

Not applicable.

Conflicts of Interest

The authors declare no conflict of interest.

References

  1. Latawiec, R.; Woyciechowski, P.; Kowalski, K.J. Sustainable Concrete Performance—CO2-Emission. Environments 2018, 5, 27. [Google Scholar] [CrossRef] [Green Version]
  2. European Ready Mixed Concrete Organization (ERMCO). ERMCO Statistics 2015. Available online: www.ermco.eu/document/ermco-statistics-2015-final-pdf/ (accessed on 1 December 2017).
  3. Czarnecki, L.; Woyciechowski, P. Model of concrete carbonation as limited process—Experimental investigations of fluidal ash concrete. In Brittle Matrix Composites; Brandt, A.M., Olek, J., Glinicki, M.A., Leung, C.K.Y., Eds.; Woodhead Publishing Ltd.: Cambridge, UK, 2009; Volume 9, pp. 183–194. [Google Scholar]
  4. Kim, T.; Chae, C. Evaluation analysis of the CO2 emission and absorption life cycle for precast concrete in Korea. Sustainability 2016, 8, 663. [Google Scholar] [CrossRef] [Green Version]
  5. Kashef-Haghighi, S.; Shao, Y.; Ghoshal, S. Mathematical modeling of CO2 uptake by concrete during accelerated carbonation curing. Cem. Concr. Res. 2015, 67, 1–10. [Google Scholar] [CrossRef]
  6. Turner, L.K.; Collins, F.G. Carbon dioxide equivalent (CO2-e) emissions: A comparison between geopolymer and OPC cement concrete. Constr. Build. Mater. 2013, 43, 125–130. [Google Scholar] [CrossRef]
  7. Sjunnesson, J. Life Cycle Assessment of Concrete; Lund University: Lund, Sweden, 2005. [Google Scholar]
  8. Mohammadi, J.; South, W. Life cycle assessment (LCA) of benchmark concrete products in Australia. Int. J. Life Cycle Assess. 2017, 22, 1588–1608. [Google Scholar] [CrossRef]
  9. Załegowski, K.; Jackiewicz-Rek, W.; Garbacz, A.; Courard, L. Carbon footprint of concrete. Mater. Bud. 2013, 12, 34–36. (In Polish) [Google Scholar]
  10. Woyciechowski, P. Influence of mineral additives on concrete carbonation. In Brittle Matrix Composites 10; Brandt, A.M., Olek, J., Glinicki, M.A., Leung, C.K.Y., Eds.; Woodhead Publishing Ltd.: Cambridge, UK, 2012; pp. 115–124. [Google Scholar]
  11. Institute of Building Technique, Department of Heat Physics, Sanitary Installations and Environment Laboratory of Environmental Protection. Performing a Life Cycle Analysis (LCA) to Determine the Carbon Footprint for Medium Cements from the CEM I, CEM II and CEM III Groups Produced in Poland, in Accordance with PN-EN 15804: 2012 Work Number: 01929/12/ZOONF; Institute of Building Technique: Warsaw, Poland, 2012. [Google Scholar]
  12. Rudnicki, T. The Influence of the Type of Cement on the Properties of Surface Cement Concrete. Materials 2022, 15, 4998. [Google Scholar] [CrossRef]
  13. Glinicki, M.A. Inżynieria Betonowych Nawierzchni Drogowych; Wydawnictwo Naukowe PWN: Warszawa, Poland, 2019. [Google Scholar]
  14. Glinicki, M.A. Właściwości betonu nawierzchniowego z kruszywem odkrytym—Wpływ rodzaju cementu i pielęgnacji. Drogownictwo 2019, 4, 99–104. [Google Scholar]
  15. Hu, J.; Siddiqui, M.S.; Fowler, D.W.; Whitney, D. Two-Lift Concrete Paving—Case Studies and Reviews from Sustainability, Cost Effectiveness and Construction Perspectives. In Proceedings of the TRB 2014 Annual Meeting, Washington, DC, USA, 12 January 2014; IEEE: Piscataway, NJ, USA. [Google Scholar]
  16. Pranav, S.; Aggarwal, S.; Yang, E.H.; Sarkar, A.K.; Singh, A.P.; Lahoti, M. Alternative materials for wearing course of concrete pavements: A critical review. Constr. Build. Mater. 2020, 236, 11760. [Google Scholar] [CrossRef]
  17. Rudnicki, T. The method of aggregate skeleton in self compacting concrete designing with segment regression. CWB 2016, 1, 10–19. [Google Scholar] [CrossRef]
  18. Mackiewicz, P.; Szydło, A.; Krawczyk, B. Influence of the construction technology on the texture and roughness of concrete pavements. Roads Bridges 2018, 17, 111–126. [Google Scholar] [CrossRef]
  19. Glinicki, M.A.; Dąbrowski, M.; Skrzypczyński, M. Influence of curing on the properties of air-entrained concrete in the upper layer of exposed aggregate pavement-modelling study. Cem. Wapno Beton 2017, 22/84, 271–281. [Google Scholar]
  20. Kaszuba, S. Kształtowanie Składu Trwałego Betonu Z Udziałem Cementów Wieloskładnikowych (CEM II, CEM III) Do Zastosowania W Budownictwie Drogowo-Mostowym. Ph.D. Thesis, Politechnika Śląska, Gliwice, Poland, 2019. [Google Scholar]
  21. Van Dam, T.; Taylor, P.; Fick, G.; Gress, D.; van Geem, M.; Lorenz, E. Sustainable Concrete Pavements: A Manual of Practice; National Concrete Pavement Technology Center, Iowa State University: Ames, IA, USA, 2011. [Google Scholar]
  22. Giergiczny, Z.; Glinicki, M.A.; Sokołowski, M.; Zieliński, M. Air void system and frost salt scaling of concrete containing slag blended cement. Constr. Build. Mater. 2009, 23, 2451–2456. [Google Scholar] [CrossRef]
  23. Shubbar, A.A.; Jafer, H.; Dulaimi, A.; Hashim, K.; Atherton, W.; Sadique, M. The development of a low carbon binder produced from the ternary blending of cement, ground granulated blast furnace slag and high calcium fly ash: An experimental and statistical approach. Constr. Build. Mater. 2018, 187, 1051–1060. [Google Scholar] [CrossRef]
  24. Babu, K.G.; Kumar, V.S.R. Efficiency of GGBS in concrete. Cem. Concr. Res. 2000, 30, 1031–1036. [Google Scholar] [CrossRef]
  25. Rudnicki, T. Functional Method of Designing Self-Compacting Concrete. Materials 2021, 14, 267. [Google Scholar] [CrossRef] [PubMed]
  26. Rudnicki, T.; Jurczak, R. The impact of the addition of diabase dusts on the properties of cement pavement concrete. Arch. Civ. Eng. 2022, 68, 395–411. [Google Scholar] [CrossRef]
  27. Tunstall, L.E.; Ley, M.T.; Scherer, G.W. Air entraining admixtures: Mechanisms, evaluations, and interactions. Cem. Concr. Res. 2021, 150, 106557. [Google Scholar] [CrossRef]
  28. Dziedzic, K.; Dąbrowski, M.; Antolik, A.; Glinicki, M.A. Characteristics of concrete mix air-entrainment applying the sequential pressure method. Roads Bridges 2020, 19, 107–118. [Google Scholar] [CrossRef]
  29. Wong, H.S.; Pappas, A.M.; Zimmerman, R.W.; Buenfeld, N.R. Effect of entrained air voids on the microstructure and mass transport properties of concrete. Cem. Concr. Res. 2011, 41, 1067–1077. [Google Scholar] [CrossRef] [Green Version]
  30. Rudnicki, T.; Jurczak, R. Recycling of a Concrete Pavement after over 80 Years in Service. Materials 2020, 13, 2262. [Google Scholar] [CrossRef]
  31. Szydło, A.; Mackiewicz, P.; Wardęga, R.; Krawczyk, B. Katalog Typowych Konstrukcji Nawierzchni Sztywnych; Załącznik do zarządzenia Nr 30 Generalnego Dyrektora Dróg Krajowych i Autostrad: Warszawa, Poland, 2014. [Google Scholar]
  32. Glinicki, M.A.; Jaskulski, R.; Dąbrowski, M. Design principles and testing of internal frost resistance of concrete for road structures-critical review. Roads Bridges 2016, 15, 21–43. [Google Scholar] [CrossRef]
  33. Liu, Z. Frost Deterioration in Concrete Due to Deicing Salt Exposure: Mechanism, Mitigation and Conceptual Surface Scaling Model. Ph.D. Thesis, University of Michigan, Ann Arbor, MI, USA, 2014. [Google Scholar]
  34. GDDKiA. Warunki Wykonania I Odbioru Robot Budowlanych D-05.03.04 V2; Nawierzchnia Z Betonu Cementowego: Warszawa, Poland, 2019.
  35. Catalogue of Typical Structures of Rigid Pavements. GDDKiA, Warszawa, Poland. 2014. Available online: https://www.gddkia.gov.pl/frontend/web/userfiles/articles/d/dokumenty-techniczne_8162/Dokumenty%20techniczne/KTKNS.pdf (accessed on 30 September 2020).
  36. Jasiczak, J.; Wdowska, A.; Rudnicki, T. Ultra-High Performance Concretes. Properties, Technology, Applications; Association of Cement Producers: Kraków, Poland, 2008. (In Polish) [Google Scholar]
  37. Gołaszewski, J. Domieszki Do Betonu. Efekt Działania, Ocena I Badania Efektywności, Stosowanie; Wydawnictwo Politechniki Śląskiej: Gliwice, Poland, 2016. [Google Scholar]
  38. Pasławski, J.; Rudnicki, T. Agile/Flexible and Lean Management in Ready-Mix concrete delivery. Arch. Civ. Eng. 2021, 67, 689–709. [Google Scholar] [CrossRef]
  39. Breitenbücher, R.; Youn, B.-Y. Qualitätssicherung von Waschbetonoberflächen; Berichte der Bundesanstalt für Straßenwesen. Straßenbau, Heft S 66; OPUS: Berlin, Germany, 2010. [Google Scholar]
  40. Giergiczny, Z.; Baran, T.; Dziuk, D.; Ostrowsk, M. The increase of concrete frost resistance by using cement with air-entraining agent. Cem. Wapno Beton 2016, 21/83, 96–105. [Google Scholar]
  41. Glinicki, M.A. Methods of qualitative and quantitative assessment of concrete air entrainment. Cem. Wapno Beton 2014, 19/81, 359–369. [Google Scholar]
  42. Rogojsz, G.; Skupski, D.; Januszewski, B. The effect of the aggregate type on the properties of pavement concrete. Bull. Mil. Univ. Technol. 2018, 67, 83–94. [Google Scholar] [CrossRef]
  43. Rudnicki, T.; Wołoszka, P. The use of technology whitetopping in the aspect of implementation of repairs of flexible pavements. Bull. Mil. Univ. Technol. 2016, 65, 111–135. [Google Scholar] [CrossRef]
  44. PN-EN 197-1:2012; Cement—Część 1: Skład, Wymagania I Kryteria Zgodności Dotyczące Cementów Powszechnego Użytku. PKN: Warsaw, Poland, 2012.
  45. EN 12350-6:2019; Testing Fresh Concrete. Density. Comite Europeen de Normalisation: Brussels, Belgium, 2019.
  46. EN 12350-7:2019; Testing Fresh Concrete. Air Content. Pressure Methods. Comite Europeen de Normalization: Brussels, Belgium, 2019.
  47. EN 12350-2:2019; Testing Fresh Concrete—Part 2: Vebe Consistency Testing. Comite Europeen de Normalisation: Brussels, Belgium, 2019.
  48. PN-B-06250:1988; Polish Standard Normal Concrete. PKN: Warsaw, Poland, 1988. (In Polish)
  49. EN 480-11:2008; Admixtures for Concrete, Mortar and Grout-Test Methods—Part 11: Determination of Air Void Characteristics in Hardened Concrete. Comite Europeen de Normalisation: Brussels, Belgium, 2008.
  50. EN 12390 PKN-CEN/TS 12390-9; Testing Hardened Concrete—Part 9: Freeze-Thaw Resistance. Comite Europeen de Normalisation: Brussels, Belgium, 2016.
  51. EN 12390-3:2019; Testing Hardened Concrete—Part 3: Compressive Strength of Test Specimens. Comite Europeen de Normalisation: Brussels, Belgium, 2019.
  52. EN 12390-5:2019; Testing Hardened Concrete—Part 5: Tensile Strength When Splitting Test Specimens. Comite Europeen de Normalisation: Brussels, Belgium, 2019.
  53. EN 12390-6:2019; Testing Hardened Concrete—Part 6: Bending Strength of Test Specimens. Comite Europeen de Normalisation: Brussels, Belgium, 2019.
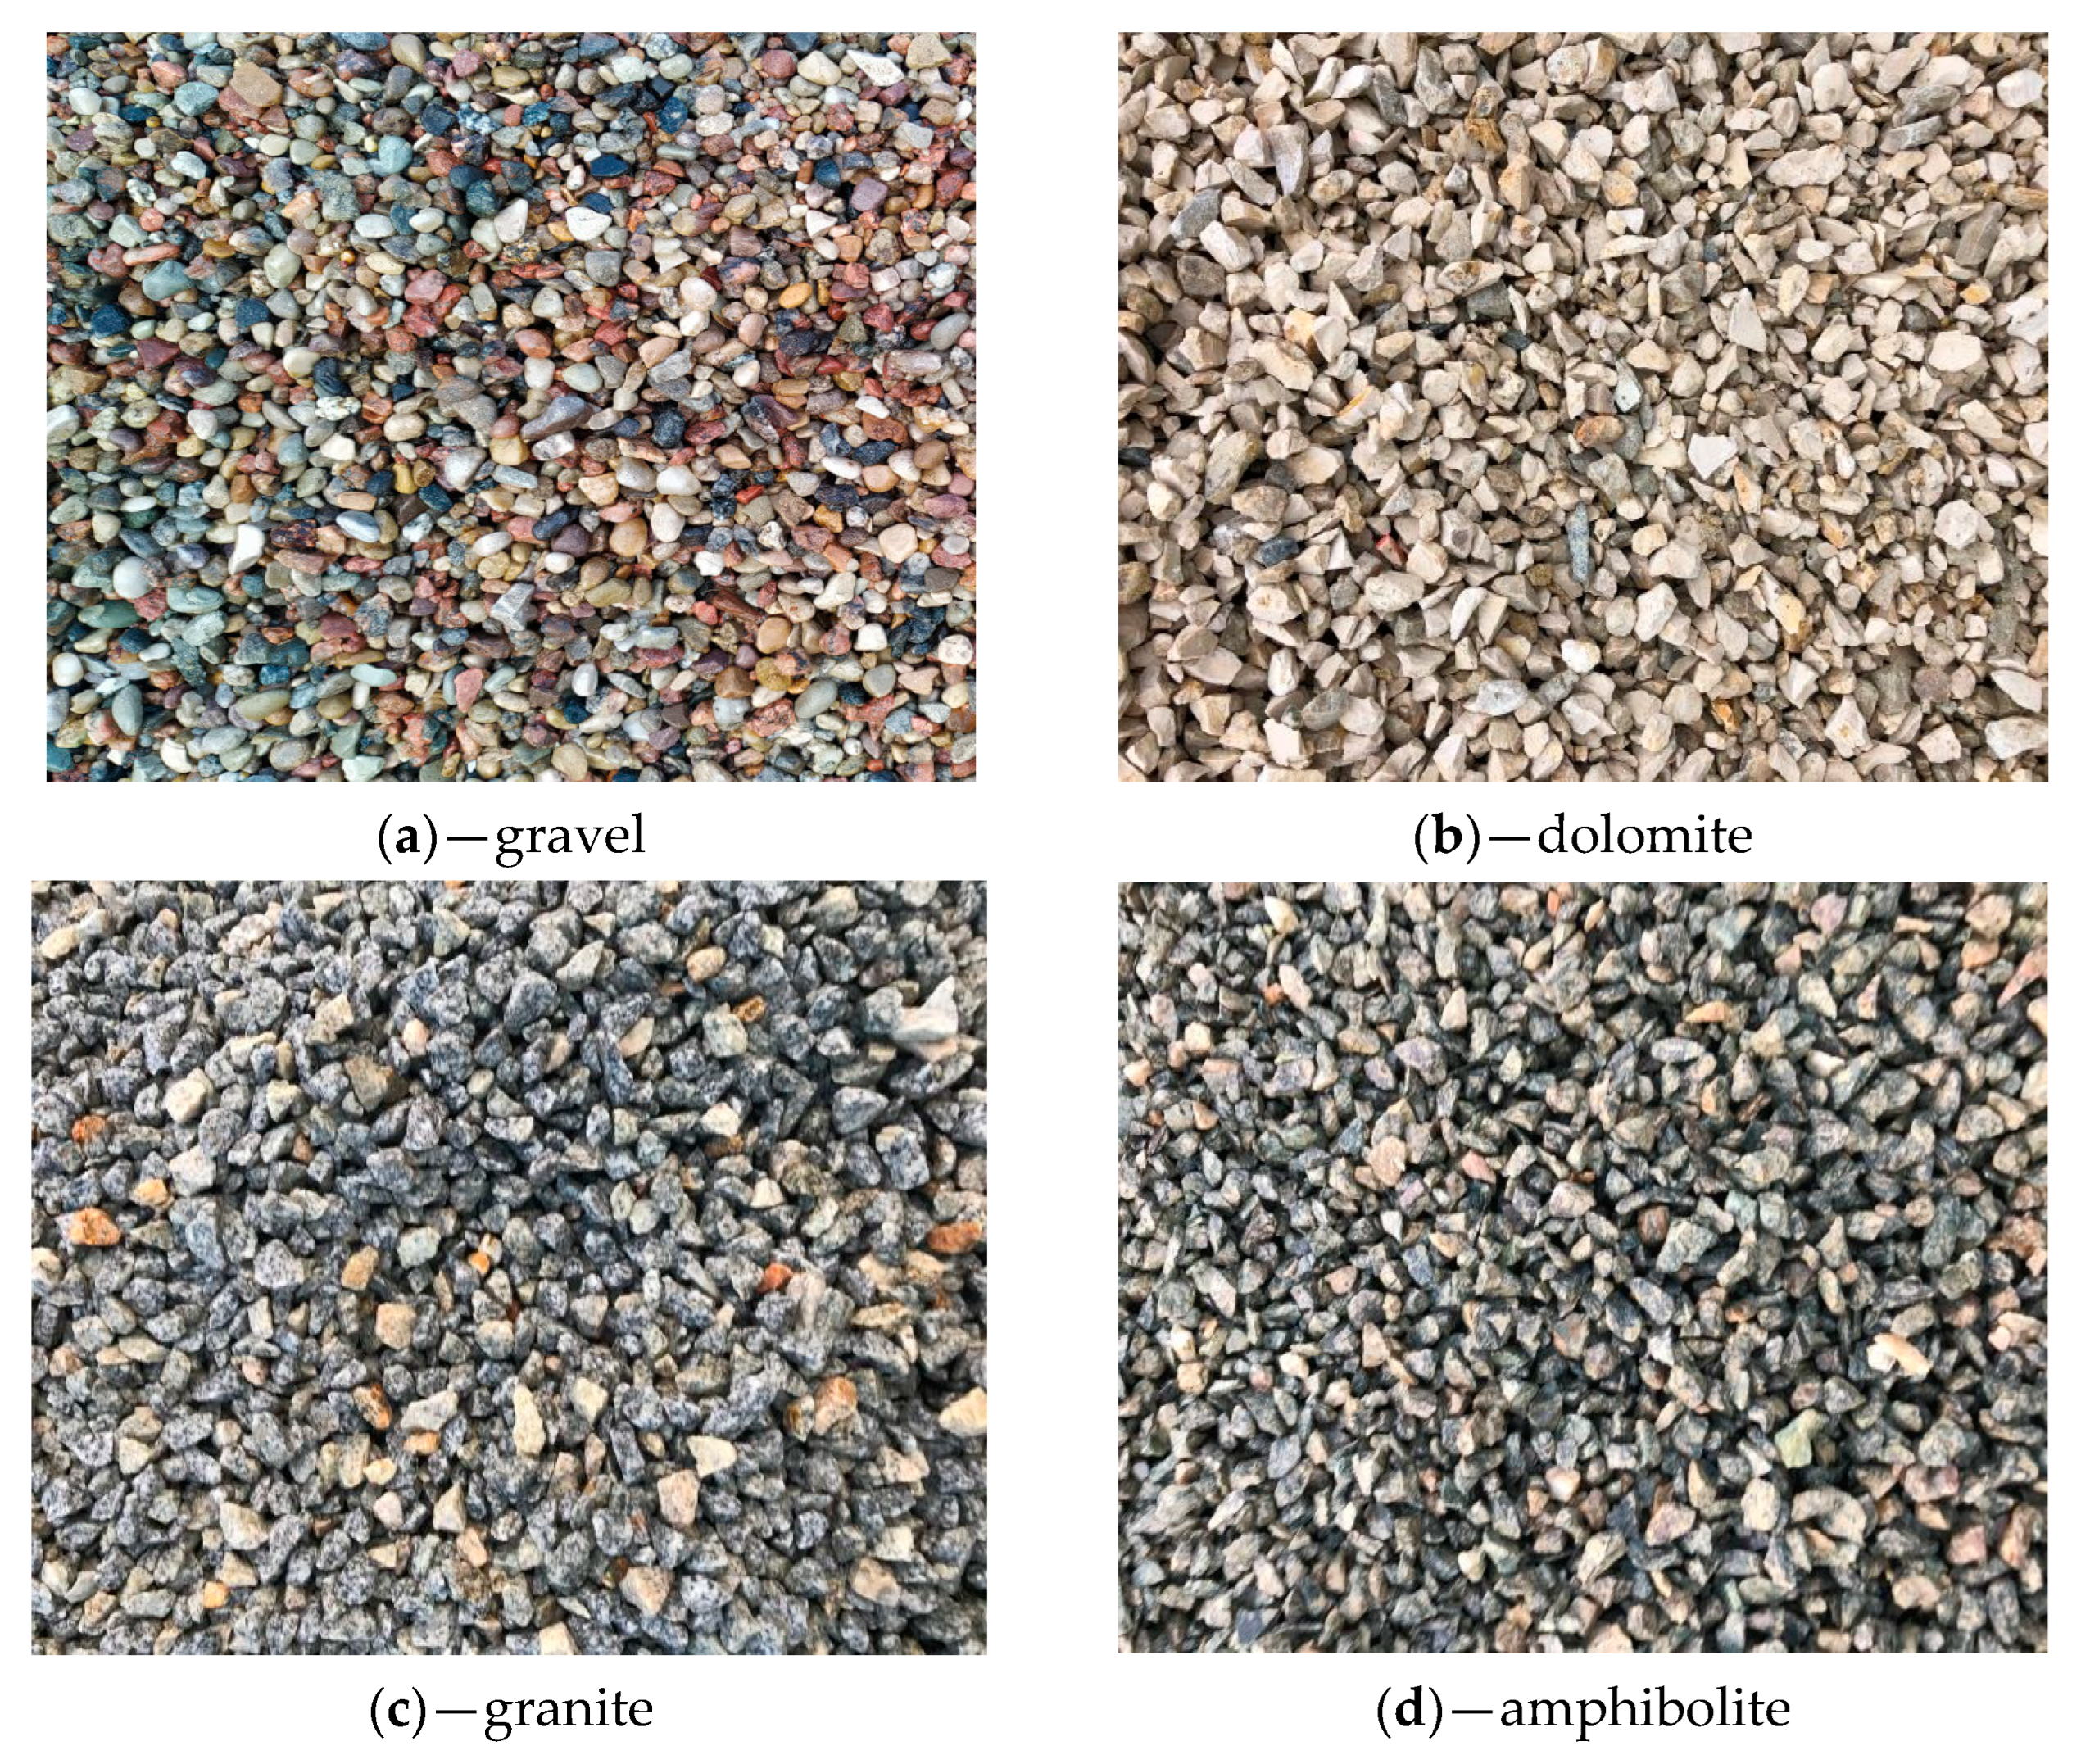
Figure 1. Aggregates used in the research.
Sustainability 14 16478 g001
Figure 2. Mineral mixture gradation curve.
Sustainability 14 16478 g002
Figure 3. Influence of the type of aggregate on the results of compressive strength.
Sustainability 14 16478 g003
Figure 4. Pictures of the prepared concrete samples: (a) A_I, (b) A_II, (c) A_III, (d) A_IV.
Sustainability 14 16478 g004
Table 1. Properties of cement provided by the manufacturer.
PropertyUnitType of Cement
CEM III 42.5 HSR-NA
Water lust%29.8
Beginning of bindingmin238
End of bindingmin317
Consistency in volumemm0.8
Specific surfacecm2/g4466
Compressive strength F2MPa14.2
Compressive strength F28MPa51.5
LOI%2.61
IR%0.82
SiO2%29.18
Al2O3%6.17
Fe2O3%1.55
CaO%50.54
MgO%4.04
SO3%2.48
Na2O%0.33
K2O%0.69
eqNa2O%0.78
Cl-%0.07
Table 2. Requirements for the concrete pavement for traffic categories KR5 ÷ KR7 (heavy traffic).
Properties of Pavement ConcreteRequirementsTest Method
Density, tolerance to the prescription± 3.0%PN-EN 12390-7
Compressive strength class for traffic category KR5 ÷ KR7,
not lower than:
C35/45PN-EN 12390-3
Flexural strength of concrete for traffic category KR5 ÷ KR7,
not lower than:
5.5 MPaPN-EN 12390-5
Tensile strength of concrete when splitting for traffic category
KR5 ÷ KR7, not lower than:
3.5 MPaPN-EN 12390-6
Characteristics of air pores in concrete:
-
the content of micropores with a diameter below 0.3 mm (A300) (%)
-
index of the distribution of pores in concrete ( L ¯ mm)
≥1.5%
≤0.200 mm
PN-EN 480-11
Concrete frost resistance test F150:
-
weight loss of the sample, not more than (%)
-
decrease in compressive strength, not more than (%)
5%
20%
PN-B-06250
Table 3. Gradation of materials.
SieveScreening [%]
[mm]Gravel
8/16
Gravel
2/8
Dolomite
8/16
Dolomite
2/8
Granite 8/16Granite 2/8Amphibolite
8/16
Amphibolite
2/8
Sand
0/2
16.0001.70.01.60.01.70.02.40.00.0
8.00096.31.294.41.496.31.290.62.20.0
4.0002.059.74.060.12.059.77.055.60.0
2.0000.039.10.038.50.039.10.042.22.5
1.0000.00.00.00.00.00.00.00.015.9
0.5000.00.00.00.00.00.00.00.025.5
0.2500.00.00.00.00.00.00.00.043.4
0.1250.00.00.00.00.00.00.00.011.9
0.0000.00.00.00.00.00.00.00.00.8
sum:100.0100.0100.0100.0100.0100.0100.0100.0100.0
Table 4. Composition of concrete mixtures.
MaterialsConcrete Mix Compositions [kg/m3]
A_IA_IIA_IIIA_IV
CEM III 42.5 HSR-NA380380380380
Water152152152152
Sand 0/2 665683668716
Gravel 2/8551---
Gravel 8/16684---
Dolomite 2/8-566--
Dolomite 8/16-703--
Granite 2/8--554-
Granite 8/16--687-
Amphibolite 2/8---593
Amphibolite 8/16---736
SP PC 3.03.03.03.0
LPA0.750.750.750.75
Density2436.62487.62445.92580.9
Table 5. Properties of concrete mix.
PropertyProperties of Concrete Mixtures
A_IA_IIA_IIIA_IVRequirements
Air content after 5 min, %6.36.25.75.8
Air content after 60 min, %5.55.95.05.24.5 ÷ 6.0
Consistency after 5 min, s91069
Consistency after 60 min, s14131214V2 (11÷20 s)
Density, g/cm32.4372.4882.4462.581±3.0%
Table 6. Influence of the type of aggregate on the compressive strength after 7, 28, and 90 days of curing.
MaterialsCompressive Strength [MPa]
A_IA_IIA_IIIA_IVRequirements
Compressive strength after 7 days41.6 ± 1.943.8 ± 2.450.2 ± 3.450.8 ± 2.8C35/45
Compressive strength after 28 days52.1 ± 2.557.1 ± 2.662.2 ± 3.059.7 ± 2.2
Compressive strength after 90 days61.2 ± 2.363.7 ± 3.669.4 ± 2.564.0 ± 2.6
Density, g/cm32.4402.4822.4462.579±3.0%
Table 7. Determination of flexural strength after 28 and 90 days.
MaterialsFlexural Strength [MPa]
A_IA_IIA_IIIA_IVRequirements
Flexural strength after 28 days5.7 ± 0.156.6 ± 0.286.1 ± 0.516.5 ± 0.29
Flexural strength after 90 days6.4 ± 0.177.2 ± 0.356.7 ± 0.306.9 ± 0.41>5.5
Table 8. Tensile strength determined after 28 and 90 days.
MaterialsTensile Splitting Strength of the Test Specimens [MPa]
A_IA_IIA_IIIA_IVRequirements
Concrete tensile splitting strength of the test
specimens after 28 days
3.6 ± 0.33.9 ± 0.23.5 ± 0.463.9 ± 0.27>3.5
Concrete tensile splitting strength of the test
specimens after 90 days
4.0 ± 0.44.9 ± 0.254.3 ± 0.444.8 ± 0.31
Table 9. Influence of the aggregate type on frost resistance after 28 days of maturation.
Frost Resistance Test F150Type of Mixture
A_IA_IIA_IIIA_IVRequirements
Mean decrease in the strength of specimens ΔR, %17.4 ± 1.15.4 ± 0.79.0 ± 1.21.7 ± 1.4<20
Weight loss of samples ΔG, %0.050.020.030.01<5.0
Visual assessment of samples no cracksno cracksno cracksno cracksno cracks
Table 10. Basic parameters of the concrete aeration structure.
ParameterType of Mixture
A_IA_IIA_IIIA_IVRequirements
Total air content, A %4.555.604.305.21
Spacing factor, L mm0.190.080.140.12<0.20
Micro air-void content, A300 %2.093.452.803.20>1.50
Specific surface of the air mm−144.557.050.954.2
Total traverse length, mm2646264626462646
Table 11. Determination of resistance to freezing and thawing in the presence of de-icing salts.
No.Mass Loss (kg/m2)Degree of Defect
after 28 Cyclesafter 56 Cyclesm56/m28Requirements
A_I0.440.912.07<2.0
A_II0.120.171.41<2.0
A_III0.240.311.29<2.0
A_IV0.090.101.11<2.0
Table 12. Carbon footprint analysis for pavement concrete with different cements.
ParameterUnitC35/45_IC35/45_IIC35/45_III
Carbon footprint cementCO2/kg0.8750.7150.578
Cement transportationCO2/km/t0.1660.1660.166
Carbon footprint granite aggregateCO2/kg0.0070.0070.007
Aggregate transportCO2/km/t0.1660.1660.166
Carbon footprint of concrete in cubic metersCO2/m3382324275
Table 13. Carbon footprint analysis for pavement concrete with different aggregates.
ParameterUnitA_IA_IIA_IIIA_IV
Carbon footprint of cement CEM III 42.5 HSR-NACO2/kg0.5780.5780.5780.578
Carbon footprint of cement, 380 kg/m3 219.64219.64219.64219.64
Cement transportCO2/km/t0.1660.1660.1660.166
Cement transport, 100 km 16.616.616.616.6
Carbon footprint aggregateCO2/kg0.0070.0070.0070.007
Aggregate transportCO2/km/t0.1660.1660.1660.166
Carbon footprint of gravel aggregate, 1235 kg/m3 8.65
Aggregate transport of gravel, 150 km 24.9
Carbon footprint of dolomite aggregate, 1269 kg/m3 8.88
Aggregate transport of dolomite, 80 km 13.28
Carbon footprint of granite aggregate, 1241 kg/m3 8.69
Aggregate transport of granite, 300 km 48.8
Carbon footprint of amphibolite aggregate, 1329 kg/m3 9.30
Aggregate transport of dolomite, 450 km 74.7
Carbon footprint of concrete in cubic metersCO2/m3269.8258.4293.7320.2
Publisher’s Note: MDPI stays neutral with regard to jurisdictional claims in published maps and institutional affiliations.