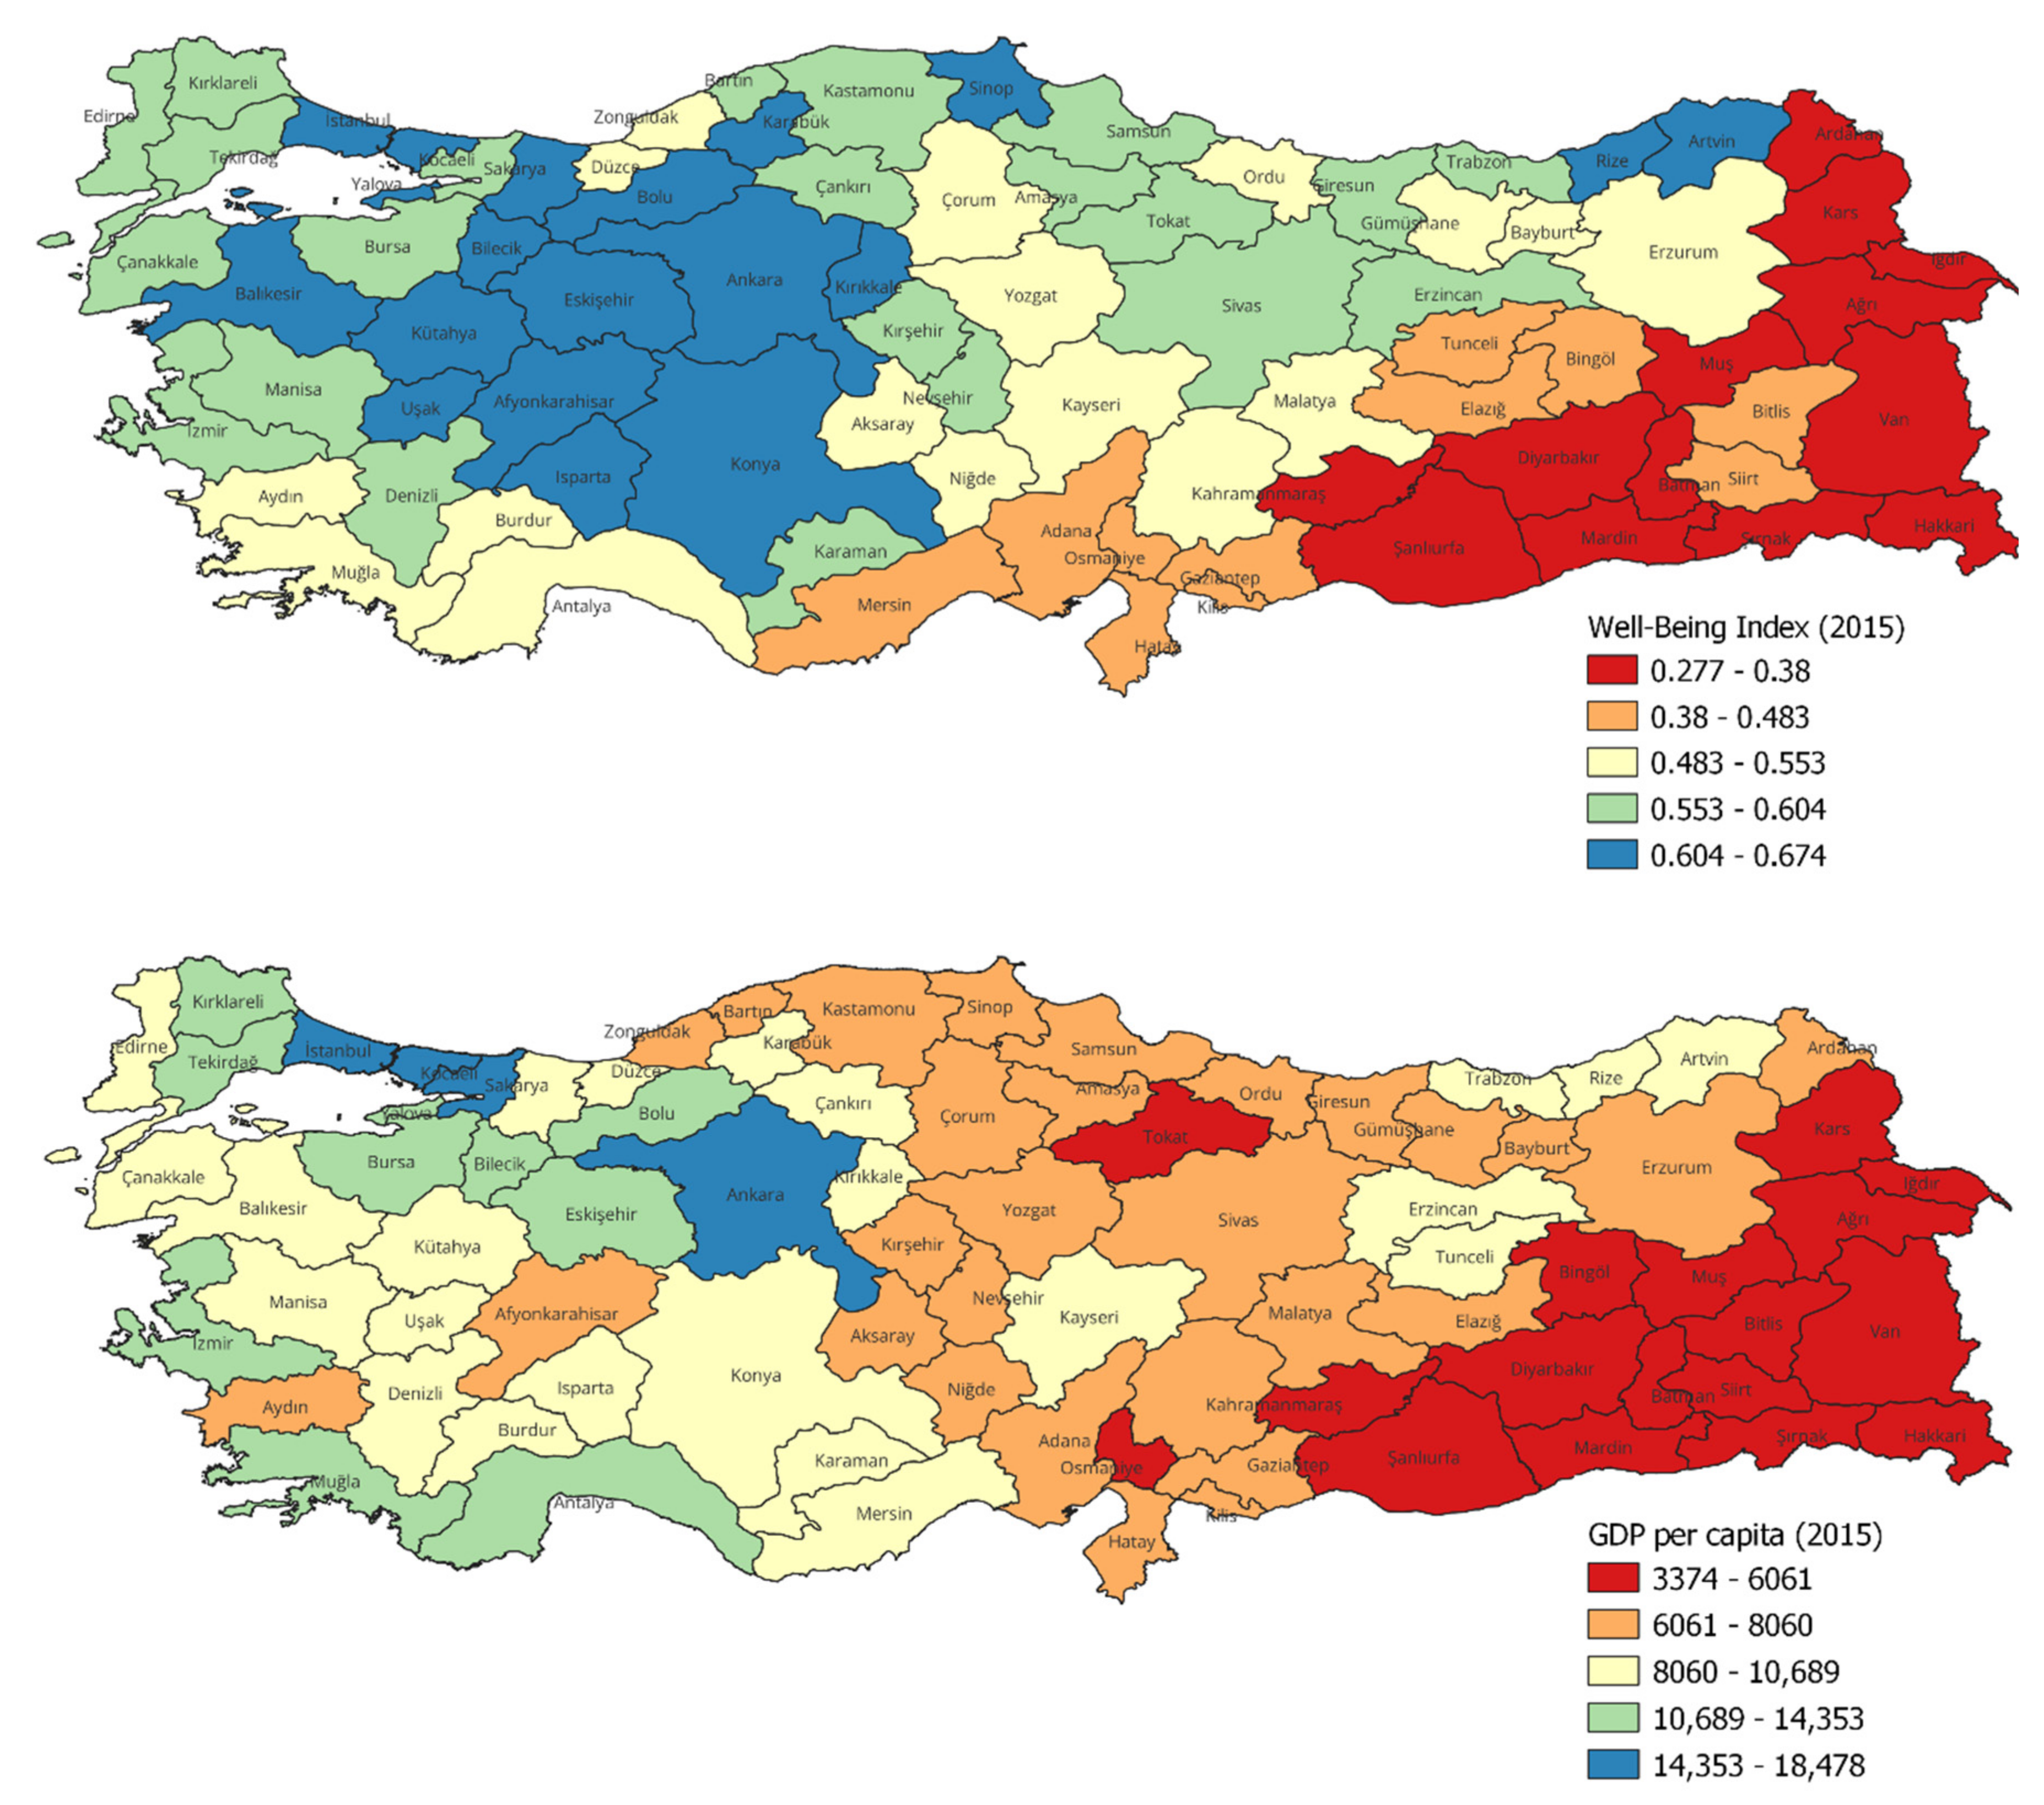
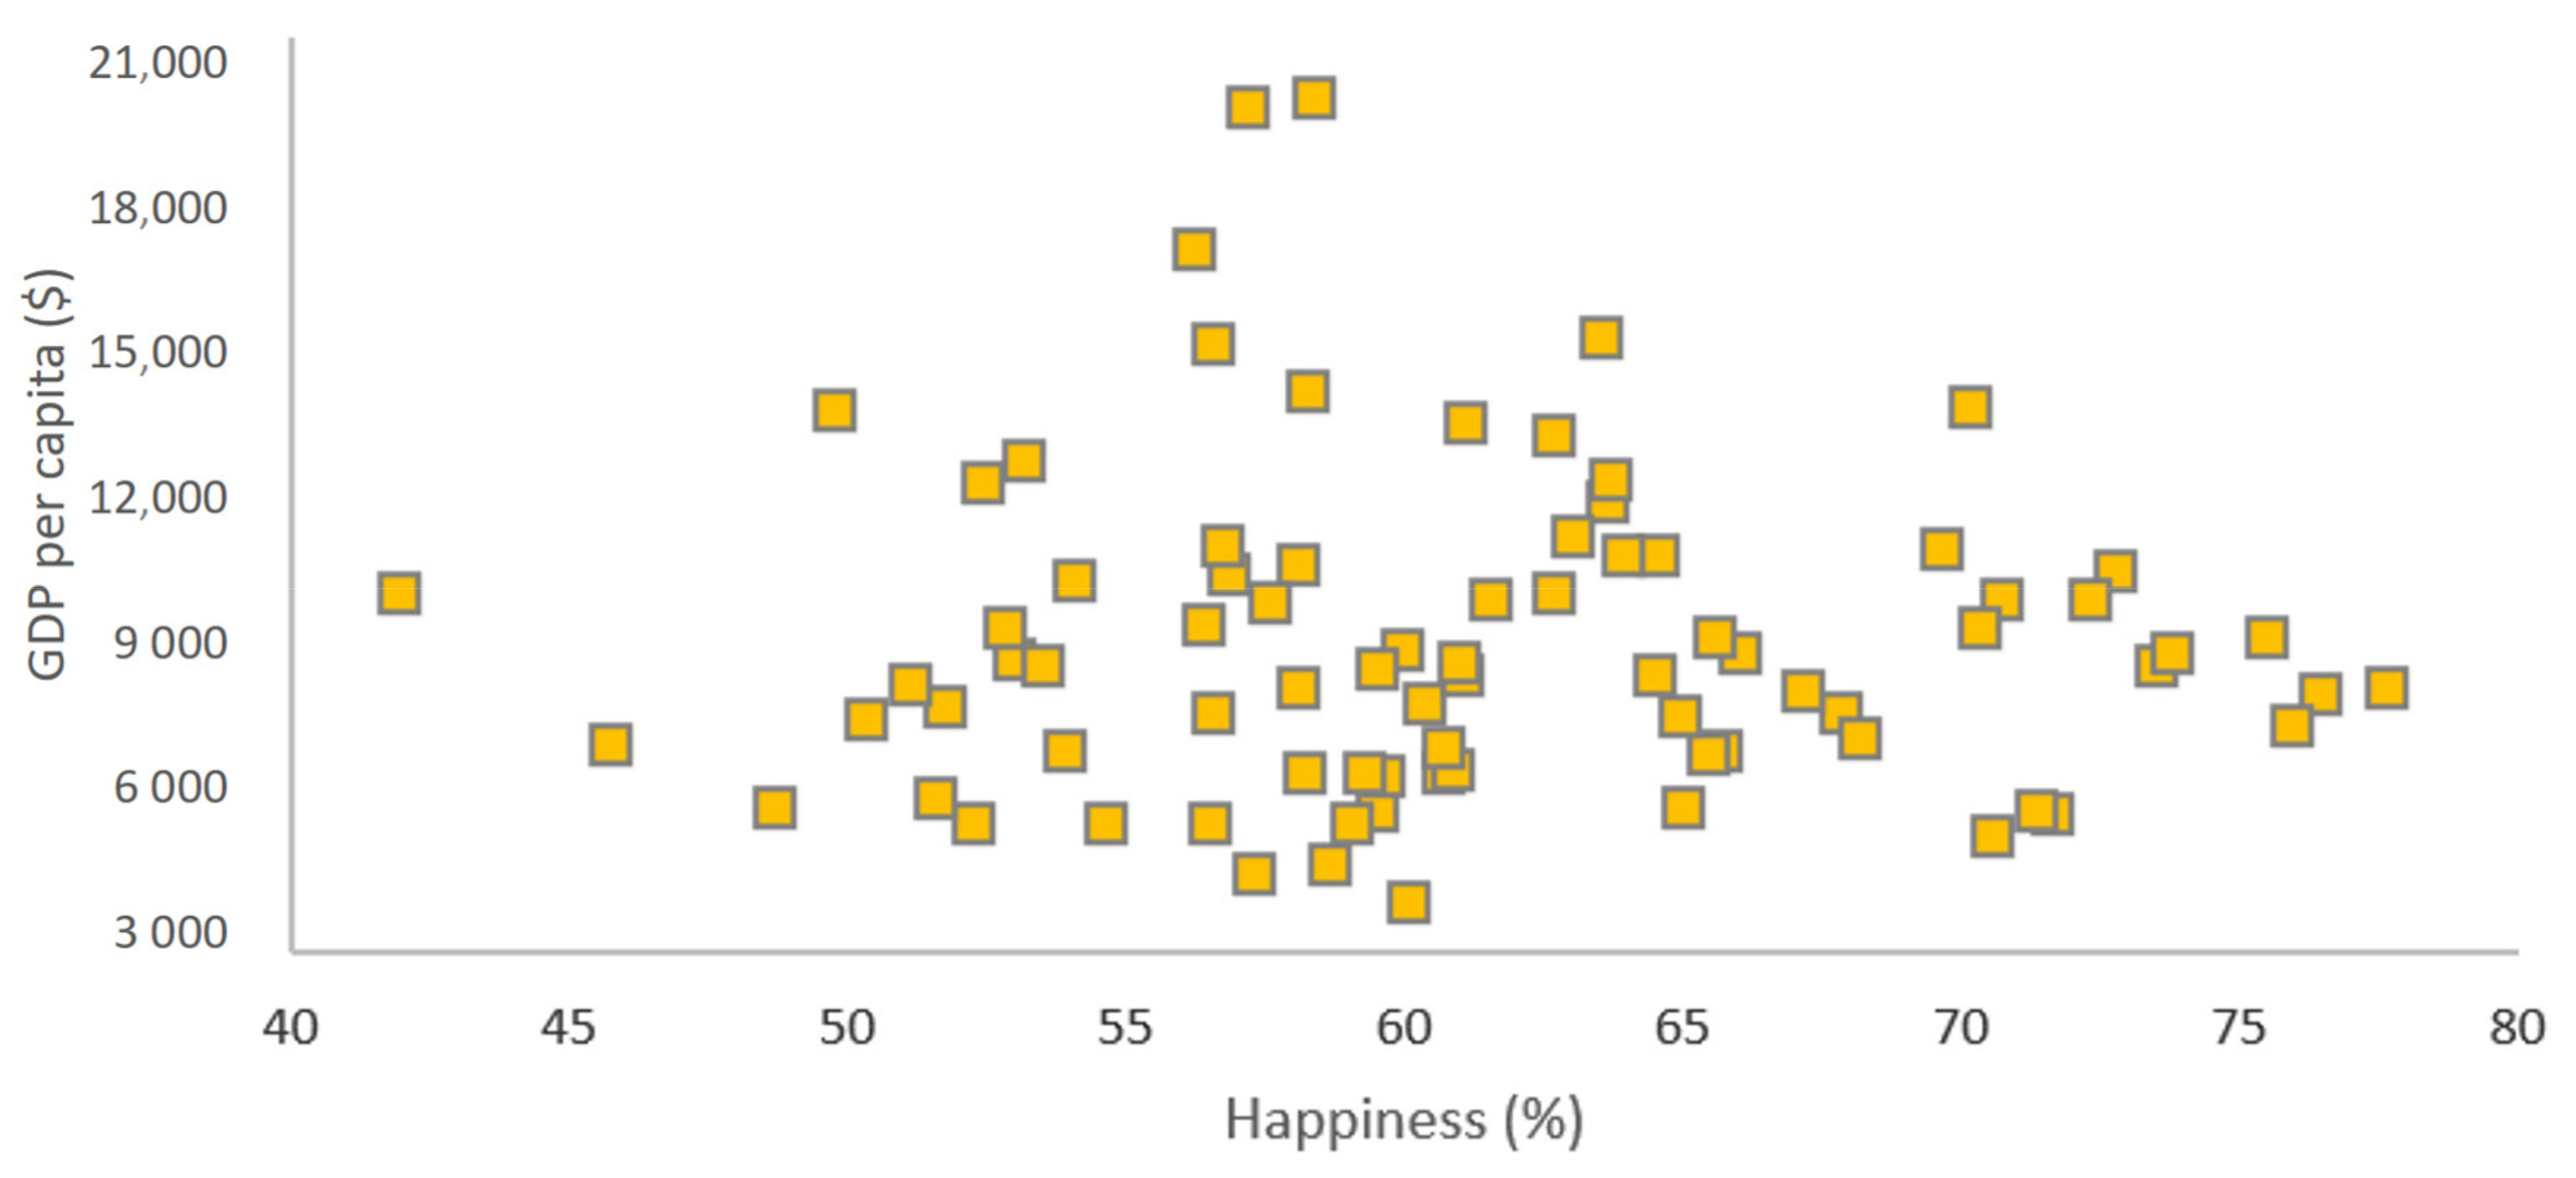
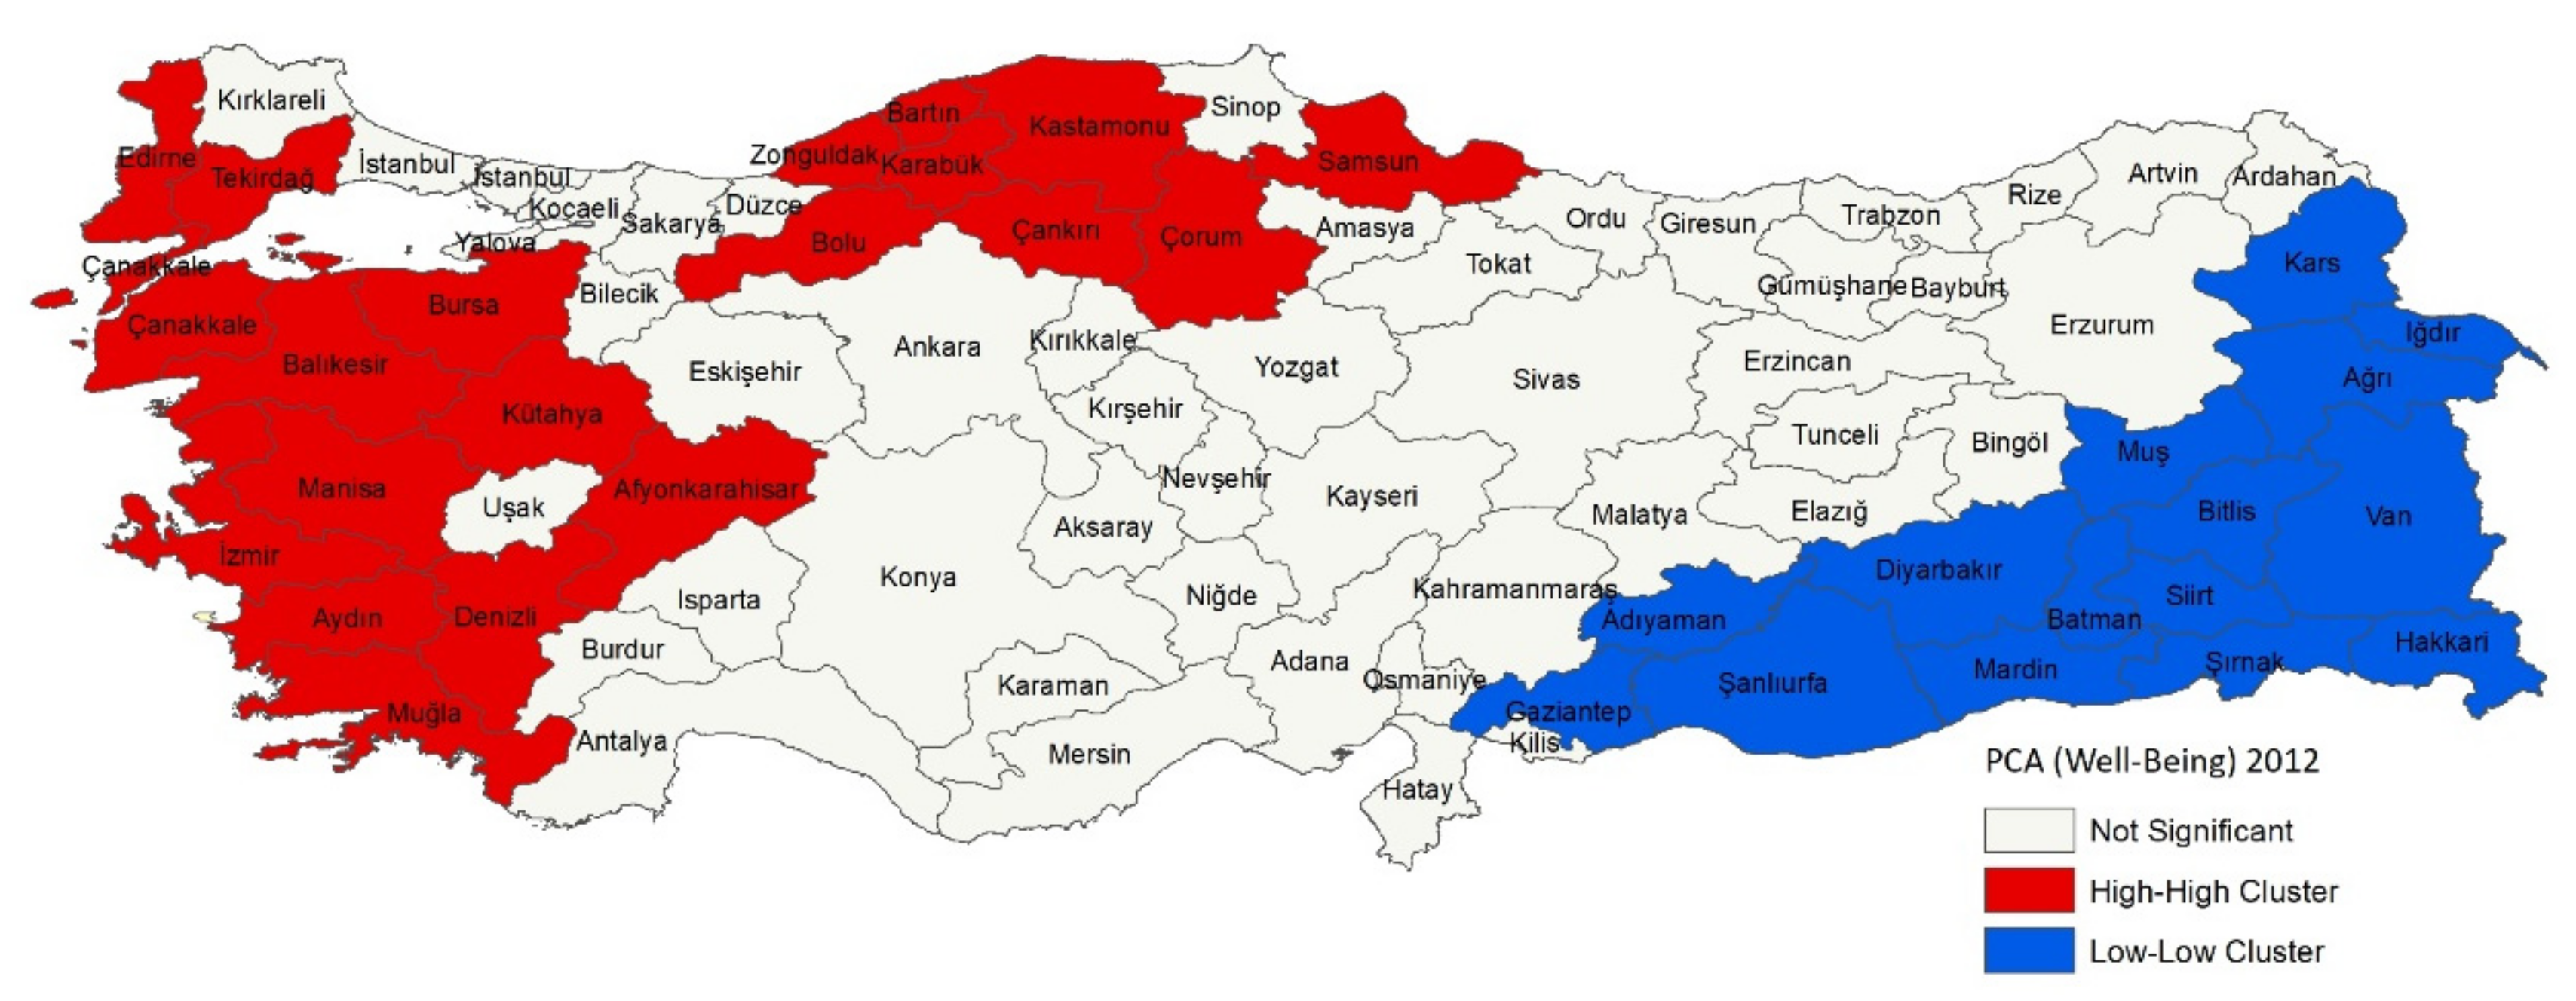
Well-Being and Geography: Modelling Differences in Regional Well-Being Profiles in Case of Spatial Dependence—Evidence from Turkey
Abstract
1. Introduction
2. Literature Review
3. Data
4. Methodology
5. Empirical Results
6. Discussion
7. Conclusions
Author Contributions
Funding
Conflicts of Interest
References
- Kalimeris, P.; Bithas, K.; Richardson, C.; Nijkamp, P. Hidden Linkages between Resources and Economy: A “Beyond-GDP” Approach Using Alternative Welfare Indicators. Ecol. Econ. 2020, 169, 106508. [Google Scholar] [CrossRef]
- Levy, C. Gender and the environment: The challenge of cross-cutting issues in development policy and planning. Environ. Urban. 1992, 4, 134–149. [Google Scholar] [CrossRef]
- Ballas, D. The Economic Geography of Happiness. In Handbook of Labor, Human Resources and Population Economics; Zimmermann, K.F., Ed.; Springer: Cham, Switzerland, 2021; pp. 1–24. [Google Scholar] [CrossRef]
- Kourtit, K.; Nijkamp, P.; Östh, J. My home is my castle—Assessment of city love in Sweden. Int. J. Inf. Manag. 2020, 58, 102213. [Google Scholar] [CrossRef]
- Dang, Y.; Chen, L.; Zhang, W.; Zheng, D.; Zhan, D. How does growing city size affect residents’ happiness in urban China? A case study of the Bohai rim area. Habitat Int. 2020, 97, 102120. [Google Scholar] [CrossRef]
- Wang, D.; Schwanen, T.; Mao, Z. Does exposure to richer and poorer neighborhoods influence wellbeing? Cities 2019, 95, 102408. [Google Scholar] [CrossRef]
- Morrison, P.S. Whose Happiness in Which Cities? A Quantile Approach. Sustainability 2021, 13, 11290. [Google Scholar] [CrossRef]
- Headey, B.; Muffels, R.; Wooden, M. Money Does not Buy Happiness: Or Does It? A Reassessment Based on the Combined Effects of Wealth, Income and Consumption. Soc. Indic. Res. 2008, 87, 65–82. [Google Scholar] [CrossRef]
- Frey, B.S. Economics of Happiness; Springer: Berlin/Heidelberg, Germany, 2018. [Google Scholar]
- Diener, E.; Oishi, S.; Lucas, R.E. Subjective Well-Being: The Science of Happiness and Life Satisfaction. In Handbook of Positive Psychology; Snyder, C., Lopez, S., Eds.; Oxford University Press: New York, NY, USA, 2002; pp. 463–473. [Google Scholar] [CrossRef]
- Wilson, W.R. Correlates of avowed happiness. Psychol. Bull. 1967, 67, 294–306. [Google Scholar] [CrossRef] [PubMed]
- Diener, E.; Suh, E.M.; Lucas, R.E.; Smith, H.L. Subjective Well-Being: Three Decades of Progress. Psychol. Bull. 1999, 125, 276. [Google Scholar] [CrossRef]
- Easterlin, R.A. Does Economic Growth Improve the Human Lot? Some Empirical Evidence. In Nations and Households in Economic Growth: Essays in Honor of Moses Abramovitz; Academic Press: New York, NY, USA, 1974; pp. 89–125. [Google Scholar]
- Frey, B.S.; Stutzer, A. What can Economists Learn from Happiness Research? J. Econ. Lit. 2002, 40, 402–435. [Google Scholar] [CrossRef]
- Blanchflower, D.G. Is happiness U-shaped everywhere? Age and subjective well-being in 145 countries. J. Popul. Econ. 2021, 34, 575–624. [Google Scholar] [CrossRef]
- Sen, A.K. Commodities and Capabilities; North-Holland: Amsterdam, The Netherlands, 1985. [Google Scholar]
- Stiglitz, J.E.; Sen, A.; Fitoussi, J.P. The Measurement of Economic Performance and Social Progress Revisited: Reflections and Overview; Sciences Po Publications 2009-33: Paris, France, 2009. [Google Scholar]
- Arcidiacono, A.; Torrisi, G. Decentralisation and Resilience: A Multidimensional Approach. Sustainability 2022, 14, 9919. [Google Scholar] [CrossRef]
- Calcagnini, G.; Perugini, F. A Well-Being Indicator for the Italian Provinces. Soc. Indic. Res. 2019, 142, 149–177. [Google Scholar] [CrossRef]
- OECD. How’s Life? 2015: Measuring Well-Being; OECD Publishing: Paris, France, 2015. [Google Scholar]
- Fadda, G.; Jirón, P. Quality of Life and Gender: A Methodology for Urban Research. Environ. Urban. 1999, 11, 261–270. [Google Scholar] [CrossRef]
- Dardha, E.; Rogge, N. How’s Life in Your Region? Measuring Regional Material Living Conditions, Quality of Life and Subjective Well-Being in OECD Countries Using a Robust, Conditional Benefit-of-the-Doubt Model. Soc. Indic. Res. 2020, 151, 1015–1073. [Google Scholar] [CrossRef]
- Samuel, R.; Hadjar, A. How Welfare-State Regimes Shape Subjective Well-Being Across Europe. Soc. Indic. Res. 2015, 129, 565–587. [Google Scholar] [CrossRef]
- Facchinetti, S.; Siletti, E. Well-being Indicators: A Review and Comparison in the Context of Italy. Soc. Indic. Res. 2021, 159, 523–547. [Google Scholar] [CrossRef]
- Veenhoven, R. Greater Happiness for a Greater Number Is that Possible and Desirable? J. Happiness Stud. 2010, 11, 605–629. [Google Scholar] [CrossRef]
- Duranton, G. Viewpoint: From cities to productivity and growth in developing countries. Wiley Online Libr. 2008, 41, 689–736. [Google Scholar] [CrossRef]
- Želinský, T.; Hudec, O.; Mojsejová, A.; Hricová, S. The effects of population density on subjective well-being: A case-study of Slovakia. Socio-Economic Plan. Sci. 2021, 78, 101061. [Google Scholar] [CrossRef]
- Çevik, S.; Taşar, M.O. Urban-rural Differences in Subjective Well-Being: Turkey. Ann. Wars. Univ. Life Sci.-SGGW Hortic. Landsc. Archit. 2016, 37, 23–39. [Google Scholar]
- Melo, P.C.; Graham, D.J.; Noland, R.B. A meta-analysis of estimates of urban agglomeration economies. Reg. Sci. Urban Econ. 2009, 39, 332–342. [Google Scholar] [CrossRef]
- Glaeser, E.L. Triumph of the City: How Our Greatest Invention Makes Us Richer, Smarter, Greener, Healthier, and Happier; Macmillan: London, UK, 2011. [Google Scholar]
- Berry, B.J.L.; Okulicz-Kozaryn, A. An Urban-Rural Happiness Gradient. Urban Geogr. 2011, 32, 871–883. [Google Scholar] [CrossRef]
- Okulicz-Kozaryn, A.; Valente, R.R. No urban malaise for Millennials. Reg. Stud. 2019, 53, 195–205. [Google Scholar] [CrossRef]
- Loschiavo, D. Big-city life (dis)satisfaction? The effect of urban living on subjective well-being. J. Econ. Behav. Organ. 2021, 192, 740–764. [Google Scholar] [CrossRef]
- Lawless, N.M.; Lucas, R. Predictors of Regional Well-Being: A County Level Analysis. Soc. Indic. Res. 2010, 101, 341–357. [Google Scholar] [CrossRef]
- Weckroth, M.; Kemppainen, T. (Un)Happiness, where are you? Evaluating the relationship between urbanity, life satisfaction and economic development in a regional context. Reg. Stud. Reg. Sci. 2021, 8, 207–227. [Google Scholar] [CrossRef]
- Morrison, P.S.; Weckroth, M. Human values, subjective well-being and the metropolitan region. Reg. Stud. 2017, 52, 325–337. [Google Scholar] [CrossRef]
- Zhang, J.; Xie, J.; Zhang, X.; Yang, J. Income, Social Capital, and Subjective Well-Being of Residents in Western China. Sustainability 2022, 14, 9141. [Google Scholar] [CrossRef]
- Okulicz-Kozaryn, A.; Mazelis, J.M. Urbanism and Happiness: A Test of Wirth’s Theory of Urban Life. Urban Stud. 2018, 55, 349–364. [Google Scholar] [CrossRef]
- Florida, R.; Mellander, C.; Rentfrow, P.J. The Happiness of Cities. Reg. Stud. 2013, 47, 613–627. [Google Scholar] [CrossRef]
- Sørensen, J.F. The rural happiness paradox in developed countries. Soc. Sci. Res. 2021, 98, 102581. [Google Scholar] [CrossRef] [PubMed]
- Walker, J.; Frediani, A.A.; Trani, J.-F. Gender, difference and urban change: Implications for the promotion of well-being? Environ. Urban. 2012, 25, 111–124. [Google Scholar] [CrossRef]
- Sorensen, J.F.L. Rural–Urban Differences in Life Satisfaction: Evidence from the European Union. Reg. Stud. 2013, 48, 1451–1466. [Google Scholar] [CrossRef]
- Lenzi, C.; Perucca, G. Urbanization and Subjective Well-Being. In Regeneration of the Built Environment from a Circular Economy Perspective; Della Torre, S., Cattaneo, S., Lenzi, C., Zanelli, A., Eds.; Research for Development; Springer: Cham, Switzerland, 2020; pp. 21–28. [Google Scholar]
- Diener, E.; Lucas, R.E.; Schimmack, U.; Helliwell, J.F. Well-Being for Public Policy; Oxford University Press: New York, NY, USA, 2009. [Google Scholar]
- Diener, E.; Diener, M.; Diener, C. Factors Predicting the Subjective Wellbeing of Nations. J. Personal. Soc. Psychol. 1995, 69, 851–864. [Google Scholar] [CrossRef]
- Inglehart, R.; Klingemann, H.D. Genes, Culture, Democracy and Happiness. In Culture and Subjective Well-Being; Diener, E., Suh, E., Eds.; MIT Press: Cambridge, UK, 2000; pp. 165–183. [Google Scholar]
- Ferrer-I-Carbonell, A. Income and well-being: An empirical analysis of the comparison income effect. J. Public Econ. 2005, 89, 997–1019. [Google Scholar] [CrossRef]
- Eren, K.A.; Aşıcı, A.A. Subjective Well-Being in an Era of Relentless Growth: The Case of Turkey Between 2004 and 2014. J. Happiness Stud. 2017, 19, 1347–1371. [Google Scholar] [CrossRef]
- Eren, K.A.; Aşıcı, A.A. The Determinants of Happiness in Turkey: Evidence from City-Level Data. J. Happiness Stud. 2016, 18, 647–669. [Google Scholar] [CrossRef]
- Rentfrow, P.J. Geographical Variation in Subjective Well-Being. In Handbook of Well-Being; Diener, E., Oishi, S., Tay, L., Eds.; DEF Publishers: Salt Lake City, UT, USA, 2018. [Google Scholar]
- Rentfrow, P.J.; Mellander, C.; Florida, R. Happy States of America: A state-level analysis of psychological, economic, and social well-being. J. Res. Pers. 2009, 43, 1073–1082. [Google Scholar] [CrossRef]
- TUIK. Life Satisfaction Survey. 2020. Available online: https://data.tuik.gov.tr/Bulten/Index?p=Life-Satisfaction-Survey-2020-37209&dil=2 (accessed on 18 February 2021).
- TUIK. Life Satisfaction by Provinces. 2013. Available online: https://data.tuik.gov.tr/Bulten/Index?p=Il-Duzeyinde-Yasam-Memnuniyeti-2013-18507 (accessed on 18 February 2021).
- TUIK. Well-Being Index for Provinces. 2015. Available online: https://data.tuik.gov.tr/Bulten/Index?p=Illerde-Yasam-Endeksi-2015-24561 (accessed on 18 February 2021).
- Karahasan, B.C.; Pinar, M.; Deniz, P. Political climate and regional well-being in Turkey. Territ. Politi.-Gov. 2021, 1–27. [Google Scholar] [CrossRef]
- Hsiao, C. Panel Data Analysis–Advantages and Challenges. Test 2007, 16, 1–22. [Google Scholar] [CrossRef]
- Bouayad, A.S.; Le Gallo, J.; Védrine, L. Spatial Econometrics on Panel Data. In Handbook of Spatial Analysis; de Bellefon, M.-P., Loonis, V., Eds.; INSEE Methods: Montrouge, France, 2018; Volume 131, pp. 185–212. [Google Scholar]
- Bavaud, F. Models for Spatial Weights: A Systematic Look. Geogr. Anal. 1998, 30, 153–171. [Google Scholar] [CrossRef]
- Elhorst, J.P. Dynamic Models in Space and Time. Geogr. Anal. 2001, 33, 119–140. [Google Scholar] [CrossRef]
- Kelejian, H.H.; Prucha, I.R. Specification and estimation of spatial autoregressive models with autoregressive and heteroskedastic disturbances. J. Econ. 2010, 157, 53–67. [Google Scholar] [CrossRef] [PubMed]
- Mutl, J.; Pfaffermayr, M. The Hausman test in a Cliff and Ord panel model. Econ. J. 2011, 14, 48–76. [Google Scholar] [CrossRef]
- Baltagi, B.H.; Song, S.H.; Koh, W. Testing panel data regression models with spatial error correlation. J. Econ. 2003, 117, 123–150. [Google Scholar] [CrossRef]
- Ergüt, Ö.; Çilingirtürk, A.M. Türkiye’nin Yaşam Memnuniyetine Mekansal Etkinin Analizi. J. Life Econ. 2022, 9, 65–80. [Google Scholar] [CrossRef]
- Lin, C.-H.A.; Lahiri, S.; Hsu, C.-P. Happiness and Regional Segmentation: Does Space Matter? J. Happiness Stud. 2013, 15, 57–83. [Google Scholar] [CrossRef]
- Lin, C.-H.A.; Lahiri, S.; Hsu, C.-P. Happiness and Globalization: A Spatial Econometric Approach. J. Happiness Stud. 2016, 18, 1841–1857. [Google Scholar] [CrossRef]
- Elhorst, J.P. Spatial Panel Data Models. In Handbook of Applied Spatial Analysis; Fischer, M.M., Getis, A., Eds.; Springer: Berlin/Heidelberg, Germany; New York, NY, USA, 2010; pp. 377–407. [Google Scholar]
- Anselin, L. The Local Indicators of Spatial Association—LISA. Geogr. Anal. 1995, 27, 93–115. [Google Scholar] [CrossRef]
- Kopczewska, K.; Kudła, J.; Walczyk, K. Strategy of Spatial Panel Estimation: Spatial Spillovers Between Taxation and Economic Growth. Appl. Spat. Anal. Policy 2015, 10, 77–102. [Google Scholar] [CrossRef]
- Anselin, L. Spatial Econometrics: Methods and Models; Kluwer Academic: Dordrecht, The Netherlands, 1988. [Google Scholar]
- LeSage, J.; Banerjee, S.; Fischer, M.M.; Congdon, P. Spatial Statistics: Methods, Models & Computation. Comput. Stat. Data Anal. 2009, 53, 2781–2785. [Google Scholar]


| Well-Being Index | Median Age | Household Size | Population 0–4 | |
|---|---|---|---|---|
| Well-Being Index | 1 | |||
| Median age | 0.843 *** | 1 | ||
| Household size | −0.836 *** | −0.962 *** | 1 | |
| Population aged 0–4 | −0.802 *** | −0.966 *** | 0.933 *** | 1 |
| Component Matrix | Component | % of Variance | Cumulative % | Kaiser–Meyer–Olkin Measure | Bartlett’s Test of Sphericity | |
|---|---|---|---|---|---|---|
| Median age | 0.991 | PCA (Well-being) | 96.611 | 96.611 | 0.740 *** | 0.000 |
| Household size | 0.979 | |||||
| Population aged 0–4 | 0.978 | |||||
| Variable | Description | Source | Time Period | N | Min | Max | Mean |
|---|---|---|---|---|---|---|---|
| PCA (Well-Being) | New well-being value for regions | Authors’ calculation | 2012–2019 | 648 | −2.85 | 1.34 | 0.00 |
| Typology (Urban) | 80% of the population lives in urban clusters | Eurostat | 2013 | 81 | 0.00 | 1.00 | 0.0671 |
| Typology (Rural) | At least 50% of the population lives in rural grid cells | Eurostat | 2013 | 81 | 0.00 | 1.00 | 0.6049 |
| City Size (Metropolitan) | Total population > 2,500,000 | TUIK | 2012–2019 | 648 | 0.00 | 1.00 | 0.1481 |
| City Size (Medium) | 250,000 < Total population < 500,000 | TUIK | 2012–2019 | 648 | 0.00 | 1.00 | 0.358 |
| City Size (Small) | Total population < 250,000 | TUIK | 2012–2019 | 648 | 0.00 | 1.00 | 0.321 |
| Density (Population density) | Gross population density per km2 | TUIK | 2012–2019 | 648 | 11 | 2987 | 125.699 |
| GDP per capita | Gross domestic product per capita ($) | TUIK | 2012–2019 | 648 | 2946 | 20726 | 8301.27 |
| Employment | Share of registered female employment | Social Security Institution | 2012–2019 | 648 | 11.37 | 35.85 | 24.31 |
| Schooling ratio | Schooling ratio for secondary education | TUIK | 2012–2019 | 648 | 35.46 | 100 | 80.89 |
| Health problems | Share of deaths caused by cancer, heart disease, obesity, respiratory problems | TUIK | 2012–2019 | 648 | 44.78 | 86.37 | 75.12 |
| Model 1 (Pool) | Model 2 (Random Effects) | Model 3 (Fixed Effects) | |
|---|---|---|---|
| GDP per capita | 0.450 ** | 0.319 *** | 0.019 |
| (0.194) | (0.057) | (0.076) | |
| employment | 1.664 *** | 0.520 *** | 0.307 *** |
| (0.280) | (0.062) | (0.072) | |
| schooling | 2.432 *** | 0.469 *** | 0.404 *** |
| (0.367) | (0.060) | (0.078) | |
| health problems | 2.886 *** | −0.070 | −0.171 |
| (0.714) | (0.077) | (0.131) | |
| density | −0.310 *** | −0.596 *** | −0.920 *** |
| (0.077) | (0.068) | (0.168) | |
| typology (urban) | 0.232 | 0.836 *** | - |
| (0.217) | (0.224) | ||
| typology (rural) | 0.025 | −0.595 *** | - |
| (0.098) | (0.120) | ||
| city size (metropolitan) | −0.205 | 0.043 | 0.071 *** |
| (0.195) | (0.061) | (0.014) | |
| city size (medium) | 0.0003 | 0.068 *** | 0.069 *** |
| (0.074) | (0.018) | (0.025) | |
| city size (small) | −0.005 | 0.055 * | 0.050 *** |
| (0.119) | (0.032) | (0.013) | |
| constant | −30.765 *** | −3.522 *** | - |
| −2.493 | (0.761) | ||
| observations | 648 | 648 | 648 |
| R2 | 0.885 | 0.809 | 0.464 |
| adjusted R2 | 0.882 | 0.804 | 0.371 |
| log-likelihood | −217 | 942 | 1160 |
| AIC | 470 | −1848 | −2128 |
| Model 4 (Fixed Effects) | Model 5 SAR-FE | Impacts (Direct) | Impacts (Indirect) | Impacts (Total) | |
|---|---|---|---|---|---|
| GDP per capita | 0.024 | 0.054 | 0.054 | 0.010 | 0.064 |
| (0.081) | (0.038) | (0.036) | (0.007) | (0.043) | |
| employment | 0.333 *** | 0.225 *** | 0.226 *** | 0.041 *** | 0.267 *** |
| (0.073) | (0.039) | (0.041) | (0.007) | (0.049) | |
| schooling | 0.369 *** | 0.300 *** | 0.296 *** | 0.054 *** | 0.351 *** |
| (0.078) | (0.038) | (0.039) | (0.007) | (0.046) | |
| health problems | −0.163 | −0.146 *** | −0.147 *** | −0.027 ** | −0.174 *** |
| (0.134) | (0.048) | (0.047) | (0.009) | (0.056) | |
| density | −0.958 *** | −0.834 *** | −0.836 *** | −0.154 *** | −0.989 *** |
| (0.167) | (0.064) | (0.065) | (0.013) | (0.077) | |
| Λ | - | 0.157 *** | |||
| (0.005) |
Publisher’s Note: MDPI stays neutral with regard to jurisdictional claims in published maps and institutional affiliations. |
© 2022 by the authors. Licensee MDPI, Basel, Switzerland. This article is an open access article distributed under the terms and conditions of the Creative Commons Attribution (CC BY) license (https://creativecommons.org/licenses/by/4.0/).
Share and Cite
Elburz, Z.; Kourtit, K.; Nijkamp, P. Well-Being and Geography: Modelling Differences in Regional Well-Being Profiles in Case of Spatial Dependence—Evidence from Turkey. Sustainability 2022, 14, 16370. https://doi.org/10.3390/su142416370
Elburz Z, Kourtit K, Nijkamp P. Well-Being and Geography: Modelling Differences in Regional Well-Being Profiles in Case of Spatial Dependence—Evidence from Turkey. Sustainability. 2022; 14(24):16370. https://doi.org/10.3390/su142416370
Chicago/Turabian StyleElburz, Zeynep, Karima Kourtit, and Peter Nijkamp. 2022. "Well-Being and Geography: Modelling Differences in Regional Well-Being Profiles in Case of Spatial Dependence—Evidence from Turkey" Sustainability 14, no. 24: 16370. https://doi.org/10.3390/su142416370
APA StyleElburz, Z., Kourtit, K., & Nijkamp, P. (2022). Well-Being and Geography: Modelling Differences in Regional Well-Being Profiles in Case of Spatial Dependence—Evidence from Turkey. Sustainability, 14(24), 16370. https://doi.org/10.3390/su142416370


