1. Introduction
As the lifeblood of the national economy, the manufacturing industry needs to maintain a relatively fast development speed to meet the growing needs of human beings [
1]. However, in the face of the energy and resource crisis, global ecological and environmental deterioration [
2], climate warming, and other issues, the manufacturing industry is facing a contradiction between development and environmental protection [
3], and the pressure on energy conservation is increasing [
4]. Therefore, it is of great significance to study the modern production model that takes into consideration both production capacity and environmental protection [
5].
At the same time, with the extensive cross-application of various high and new technologies in the manufacturing industry, a new industrial technology revolution is taking place, bringing new opportunities for the sustainable development of the manufacturing industry [
6]. Manufacturing enterprises need to absorb and utilize emerging technologies such as the IoT to explore low-carbon, efficient, and low-cost sustainable production models [
7].
As the realization carrier of the enterprise production model, resource allocation has become an essential part of actual production. It significantly impacts the manufacturing efficiency, cost and energy consumption [
8]. Reasonable resource allocation can continue to bring economic growth to the enterprise. However, current resource allocation research mainly considers production-efficiency-related indicators, such as maximum processing time [
9,
10], production delay and machine load [
11,
12], as optimization objectives. These studies cannot meet the actual needs of sustainable manufacturing because they do not consider processing energy consumption such as electric energy [
13,
14]. Green manufacturing is a modern model that considers manufacturing efficiency, environmental impact, and economic and social benefits. Its ultimate goal is to achieve the sustainable development of the manufacturing industry [
15]. Green manufacturing can improve energy efficiency and reduce carbon emissions in the manufacturing process. Therefore, more and more scholars consider green and low-carbon indicators [
16] to optimize multi-objective resource allocation because improving the energy utilization rate can effectively increase financial revenue [
17]. Zhang et al. [
18] and Li et al. [
19] studied the resource allocation of the hybrid flow shop and distributed displacement flow shop with the target completion time and energy consumption, respectively; Rifai et al. [
20] also considered the cost target to study the resource allocation of distributed reentrant permutation job shop; Feng et al. [
21] studied the resource allocation of flexible job shop with quality as one of the goals; Nouiri et al. [
22] and Sun et al. [
23] proposed a rescheduling method (GRM) that considered energy saving; Wang et al. [
24] established a two-stage optimization model for flexible job shop scheduling evaluating energy and operational dynamic characteristics; Liu et al. [
25] combined the green scheduling optimization of flexible job shop with crane transportation, paying attention to the workshop’s total energy consumption and expanding the research scope of the energy consumption. In terms of solving the resource allocation problem, Salimifard et al. [
26] proposed a dual-objective integer linear programming model with task segmentation and resource constraints to study the resource allocation problem in the injection moulding process. Wu et al. [
27] applied the improved NSGA-II algorithm to solve the problem of job shop resource allocation, aiming at energy consumption. Lei et al. [
28] designed a two-stage metaheuristic algorithm based on the imperialist competitive algorithm (ICA) and the variable neighborhood search algorithm to solve multi-objective problems with total energy consumption constraints. However, the above research mainly focuses on the configuration model and algorithm under the condition that the manufacturing resource status remains unchanged. It does not establish the relationship between the proposed method and the actual production, and cannot guide the actual production.
In the actual production process, production disturbances occur from time to time [
29], such as material delays, equipment failures [
30], quality fluctuations, etc., and the above static job-shop-based configuration methods will fail [
21]. Real-time status information and its use in guiding the resource allocation process is crucial. With the rapid development of IoT technology, it is gradually possible to obtain real-time production information from the discrete production workshop [
31]. Chen et al. [
32] proposed an energy efficiency monitoring and management system supported by emerging IoT technology to monitor machine status and scheduling plans; Singh et al. [
33] developed a new framework based on big data cloud computing technology; Tao et al. [
34] introduced the life cycle of manufacturing data; Dong et al. studied the state space modeling method [
35]; Qiu et al. [
36] discussed the role of data analysis in manufacturing. Singh et al. [
37] proposed an integrated approach based on DEMATEL-MMDE-ISM to analyze the barriers to the implementation of the Internet of Things in manufacturing; Zhang et al. [
6] studied the construction of a real-time data acquisition network in the workshop and proposed an energy-aware cyber physical system (E-CPS) used for energy extensive data analysis and hidden production anomaly detection. In addition, energy-saving strategies for CNC machine tools to achieve real-time and accurate control is also researched [
38,
39]; Syafrudin, et al. [
40] proposed a real-time monitoring system for automobile manufacturing based on IoT sensors, big data processing and machine learning models; Trakadas et al. [
41] studied artificial intelligence based collaboration in industrial IoT manufacturing method and proposed an architectural extension of the manufacturing IoT; Ayvaz et al. [
42] developed a predictive maintenance system for manufacturing lines through a machine learning approach that uses IoT data in real-time. The above research shows that the real-time status information of production can be obtained through the IoT in the workshop and can guide the further optimization of production management and control. Studying the optimal allocation of low-carbon resources for IoT discrete vehicles which take into consideration the dynamic real-time state of the machine is of great value.
However, there are two major gaps in current research. First, there is a lack of systematic methods for real-time data collection and analysis serving the optimal configuration of manufacturing resources. Secondly, there is a lack of dynamic optimal methods in manufacturing resources allocation based on real-time status. Therefore, based on the research of real-time state data collection and analysis of manufacturing resources, this paper proposes a real-time state-driven dynamic configuration method of manufacturing resources to achieve low-carbon manufacturing in the IoT discrete job shop. The contributions of this paper are summarized as:
1: A real-time data-driven job shop status monitoring framework is proposed to realize real-time collection and packaging modelling of resource status data and energy consumption data. The proposed framework improves the knowledge system of manufacturing process monitoring.
2: Taking into consideration the real-time state constraints of manufacturing resources, job shop carbon emission targets and maximum completion time goals, a low-carbon resource allocation method of discrete manufacturing job shop driven by real-time states of manufacturing resources is proposed.
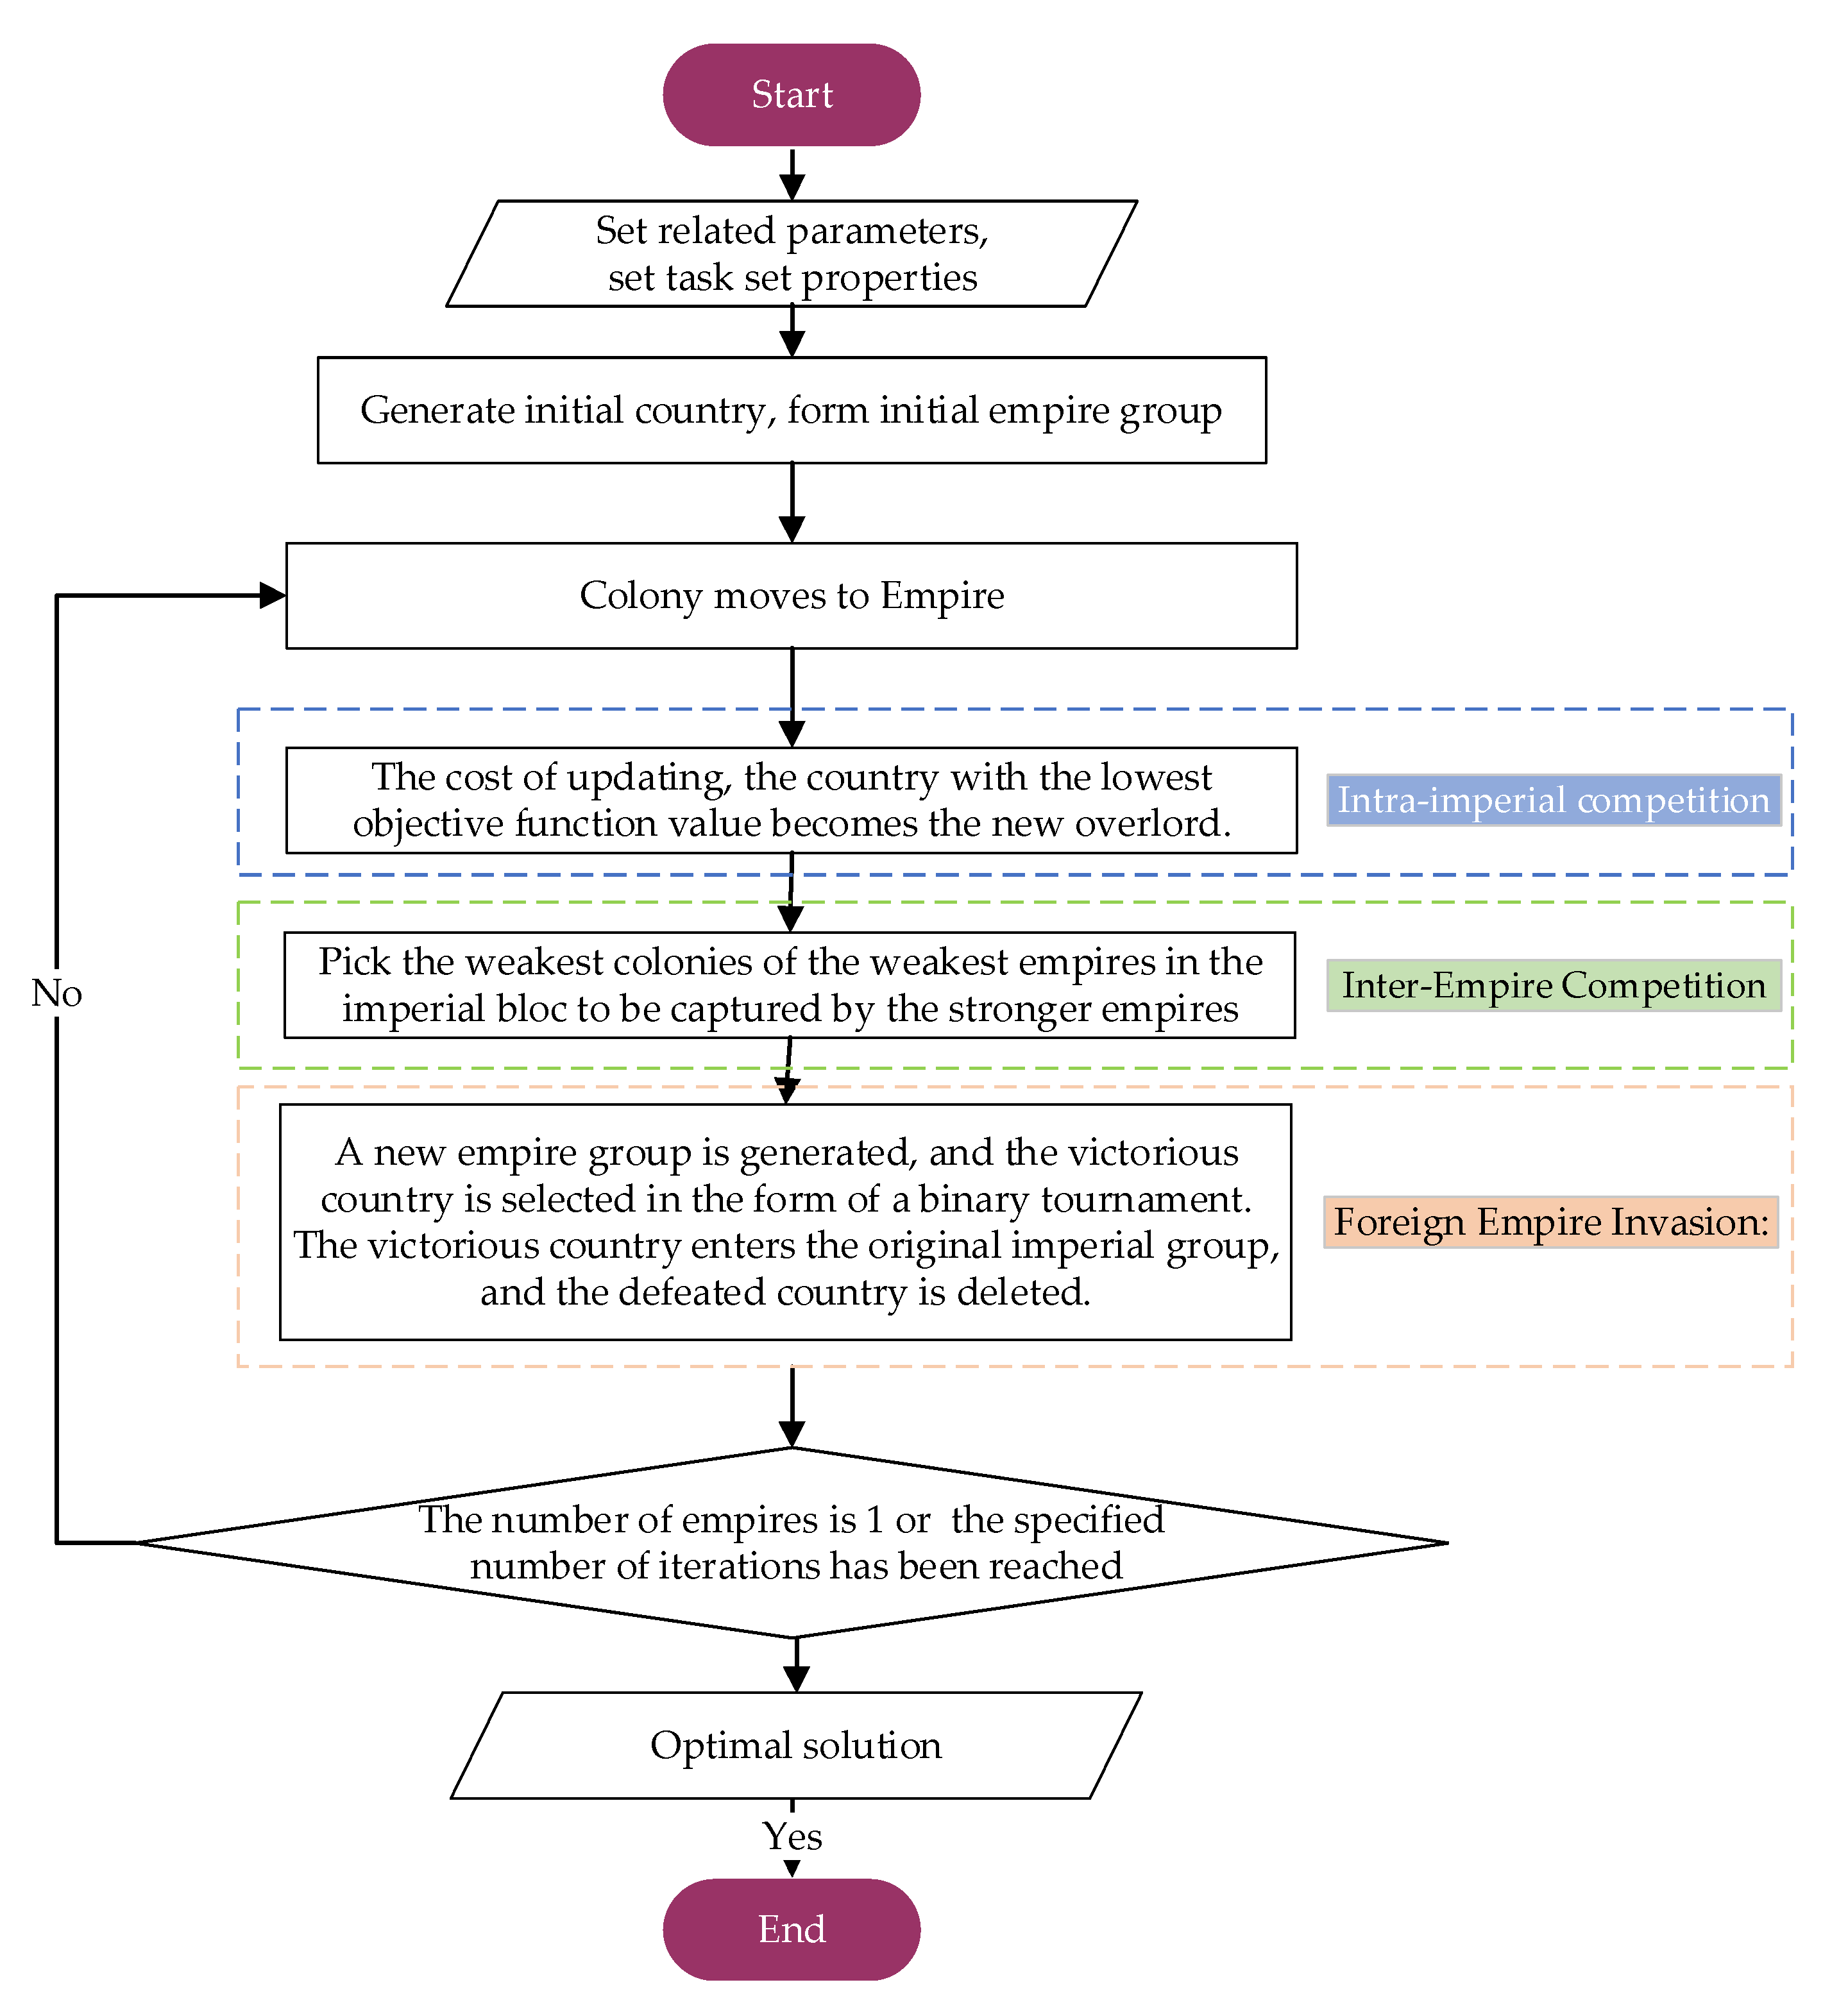
3: An improved multi-objective empire competition optimization algorithm is proposed for solving the allocation problem, and the concept of external population invasion is introduced to enhance the local optimization ability of the algorithm. This method can provide a reference for the evolutionary algorithm to function outside of the local optimum.
The sections of this paper are arranged as follows: In
Section 2, the dynamic configuration framework of IoT discrete job shop resources is introduced. The resource allocation model and solution algorithm are presented in
Section 3. In
Section 4, the effectiveness of the I-ICA algorithm is verified by comparing with different algorithms. It is proved that the proposed strategy can improve production efficiency and reduce carbon emissions by optimizing the resource allocation problem with abnormal job shop conditions.
Section 5 summarizes the complete work and gives an outlook on future work.
2. A Framework for Dynamic Configuration of IoT Discrete Job Shop Resources
Due to the existence of unforeseen factors, the original production plan in the actual production process often deviates from the actual processing situation, which reduces the production efficiency of the job shop. Therefore, real-time monitoring of job shop production is carried out with the help of IoT. The data obtained is converted into intuitive production events to guide managers to accurately handle abnormal events in the actual production process. At the same time, the manufacturing data acquired is input into the production scheduling in real-time to adjust the production plan and keep it consistent with the actual production situation so that the production plan can meet the production efficiency index and the optimal energy saving and emission reduction index as much as possible. Thereby, an important guarantee for the business-decision-making of enterprises can be provided because the management level and production efficiency is improved and the energy consumption and carbon emissions in the production process is reduced.
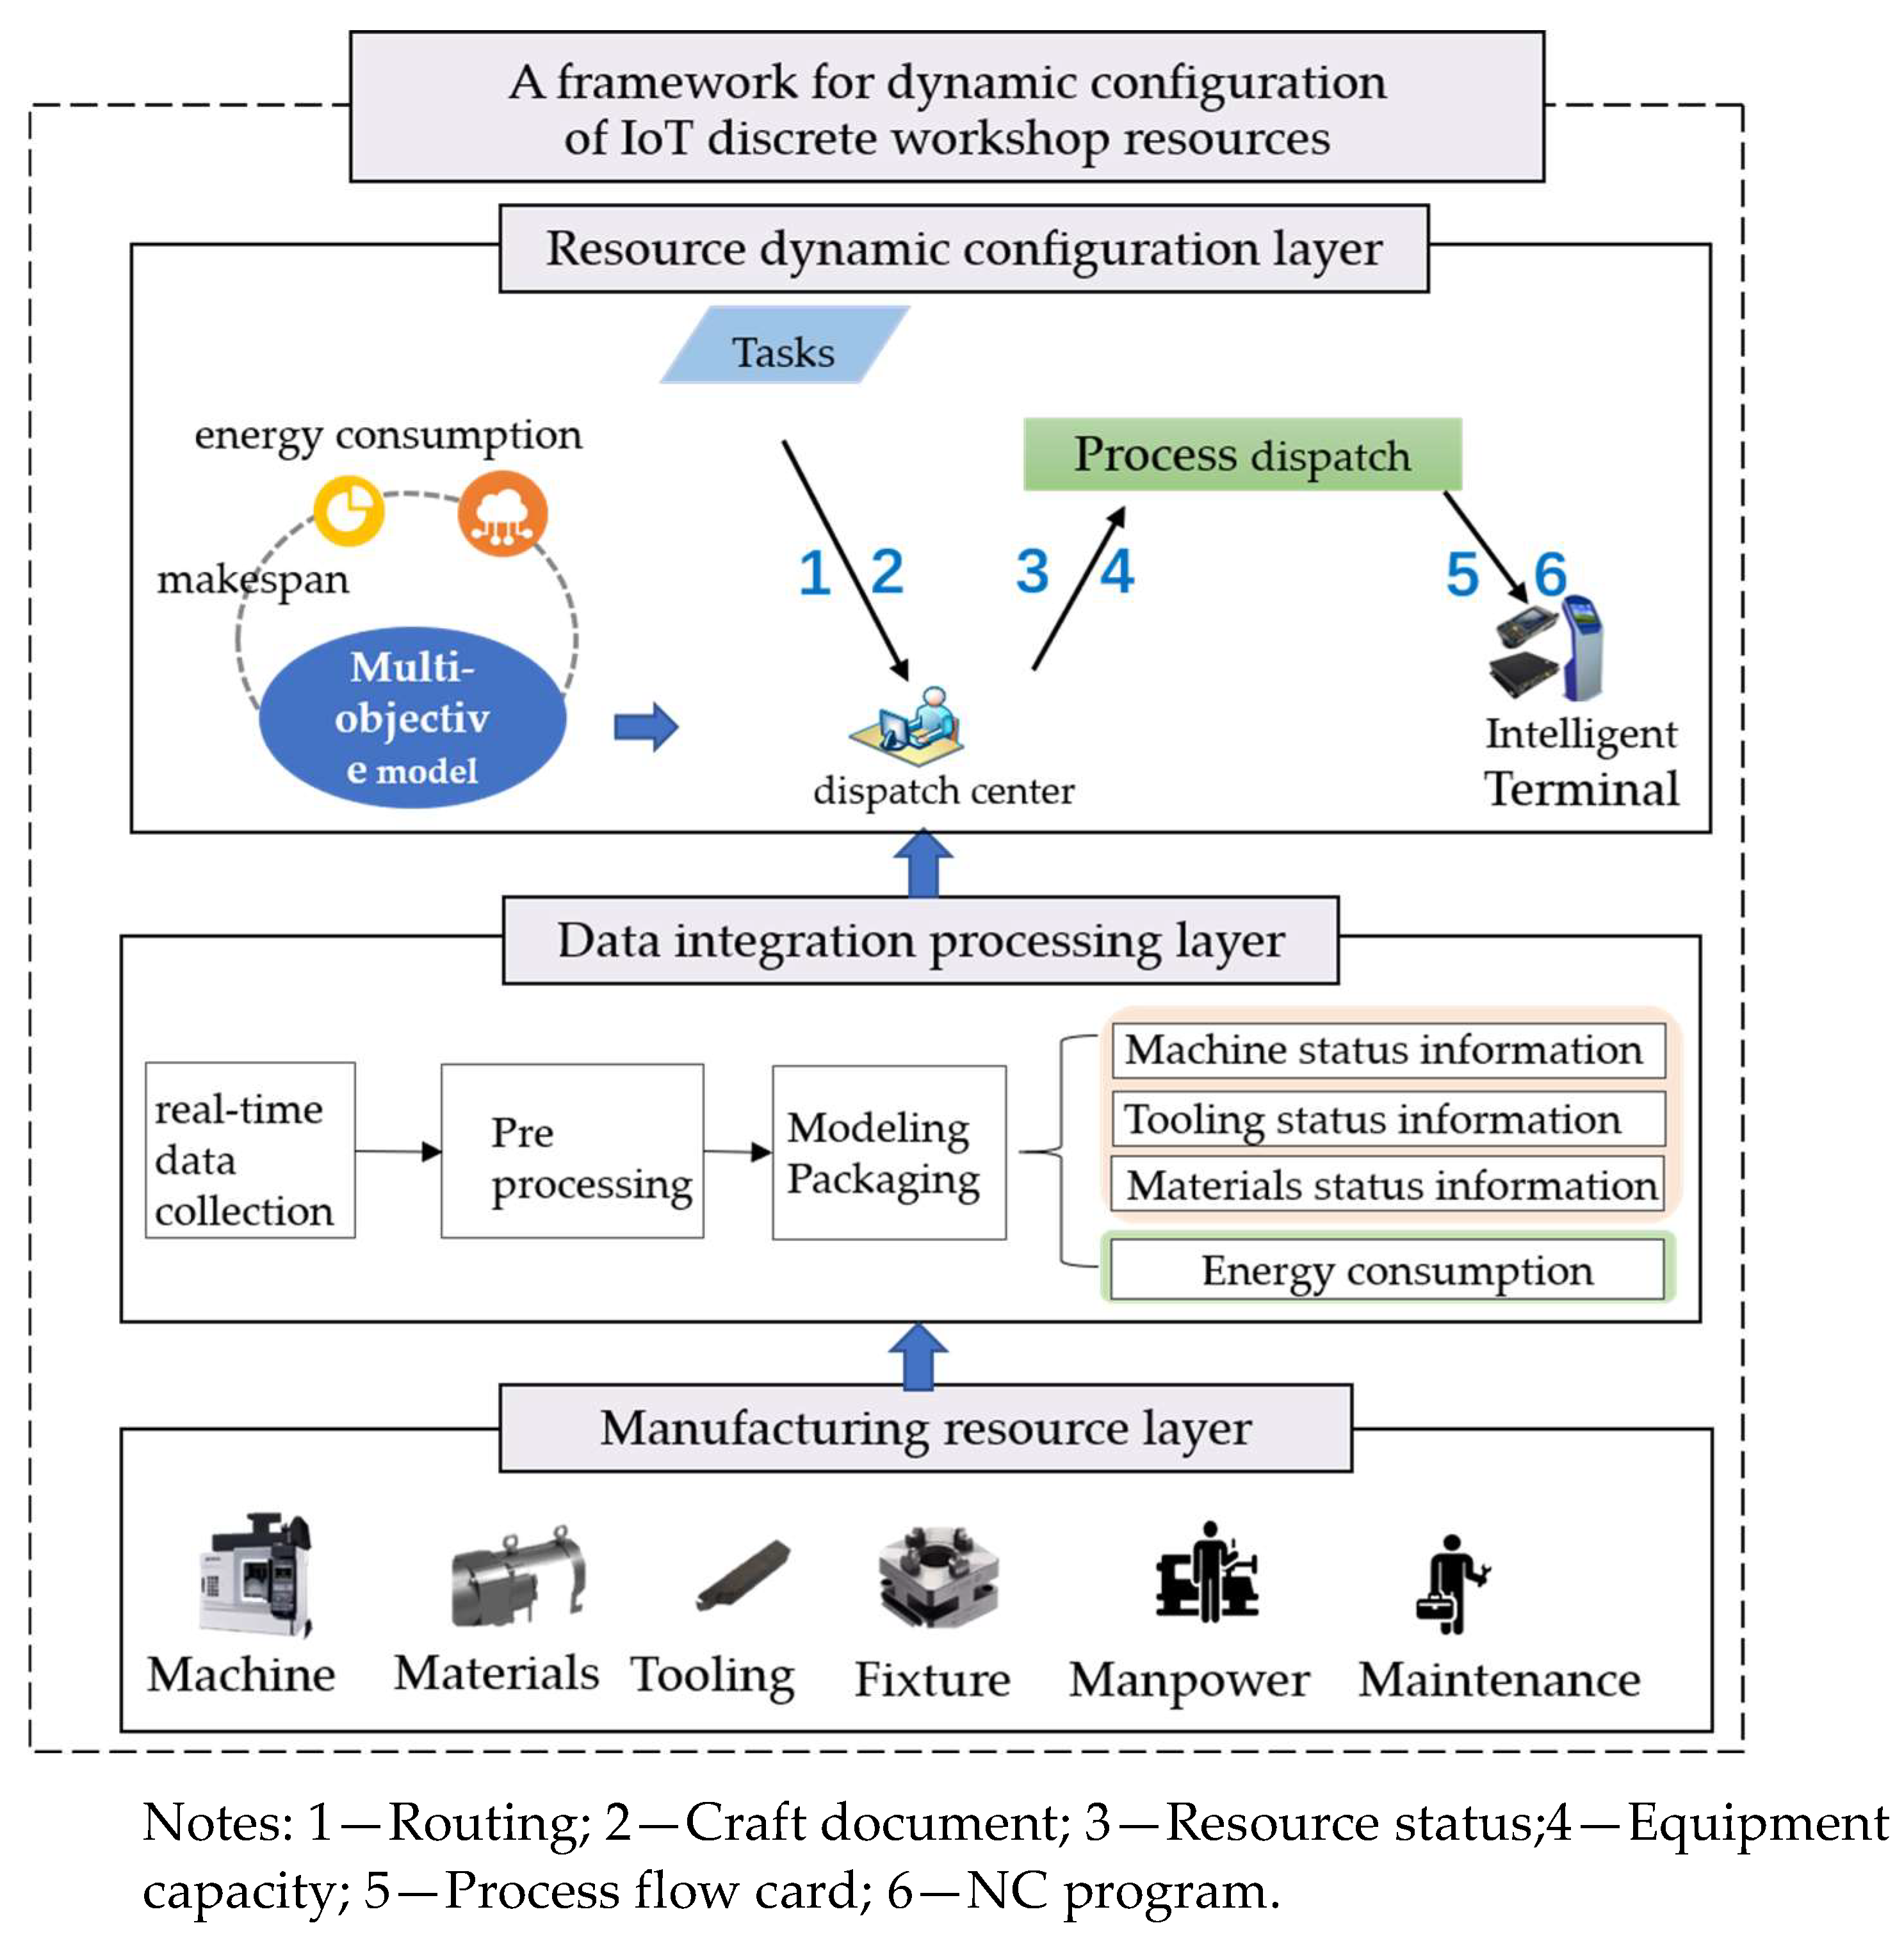
To realize the real-time state-driven job shop low-carbon scheduling of manufacturing resources, a real-time data-driven IoT discrete job shop resource dynamic configuration framework is constructed, as shown in
Figure 1. This framework includes a real-time data acquisition layer, a data integration processing layer and a resource dynamic configuration layer. The real-time data collection layer implements data collection for job shop manufacturing resources including workers, machine tools, fixtures, workpieces, etc., with the help of RFID equipment or directly using the serial port and network port of the machine tool. The data integration processing layer processes the data collected, including cleaning invalid data and filtering redundant data, modeling and encapsulating the pre-processed data to obtain an effective job shop data model. The resource dynamic configuration layer converts the encapsulated data model into a job shop abnormal event using the abnormal event knowledge base and complex event processing technology. The events acquired are converted into real-time job shop status information and input into the job shop scheduling system after being uploaded to the database.
2.1. Real-Time Data Collection of Workshop Manufacturing Process
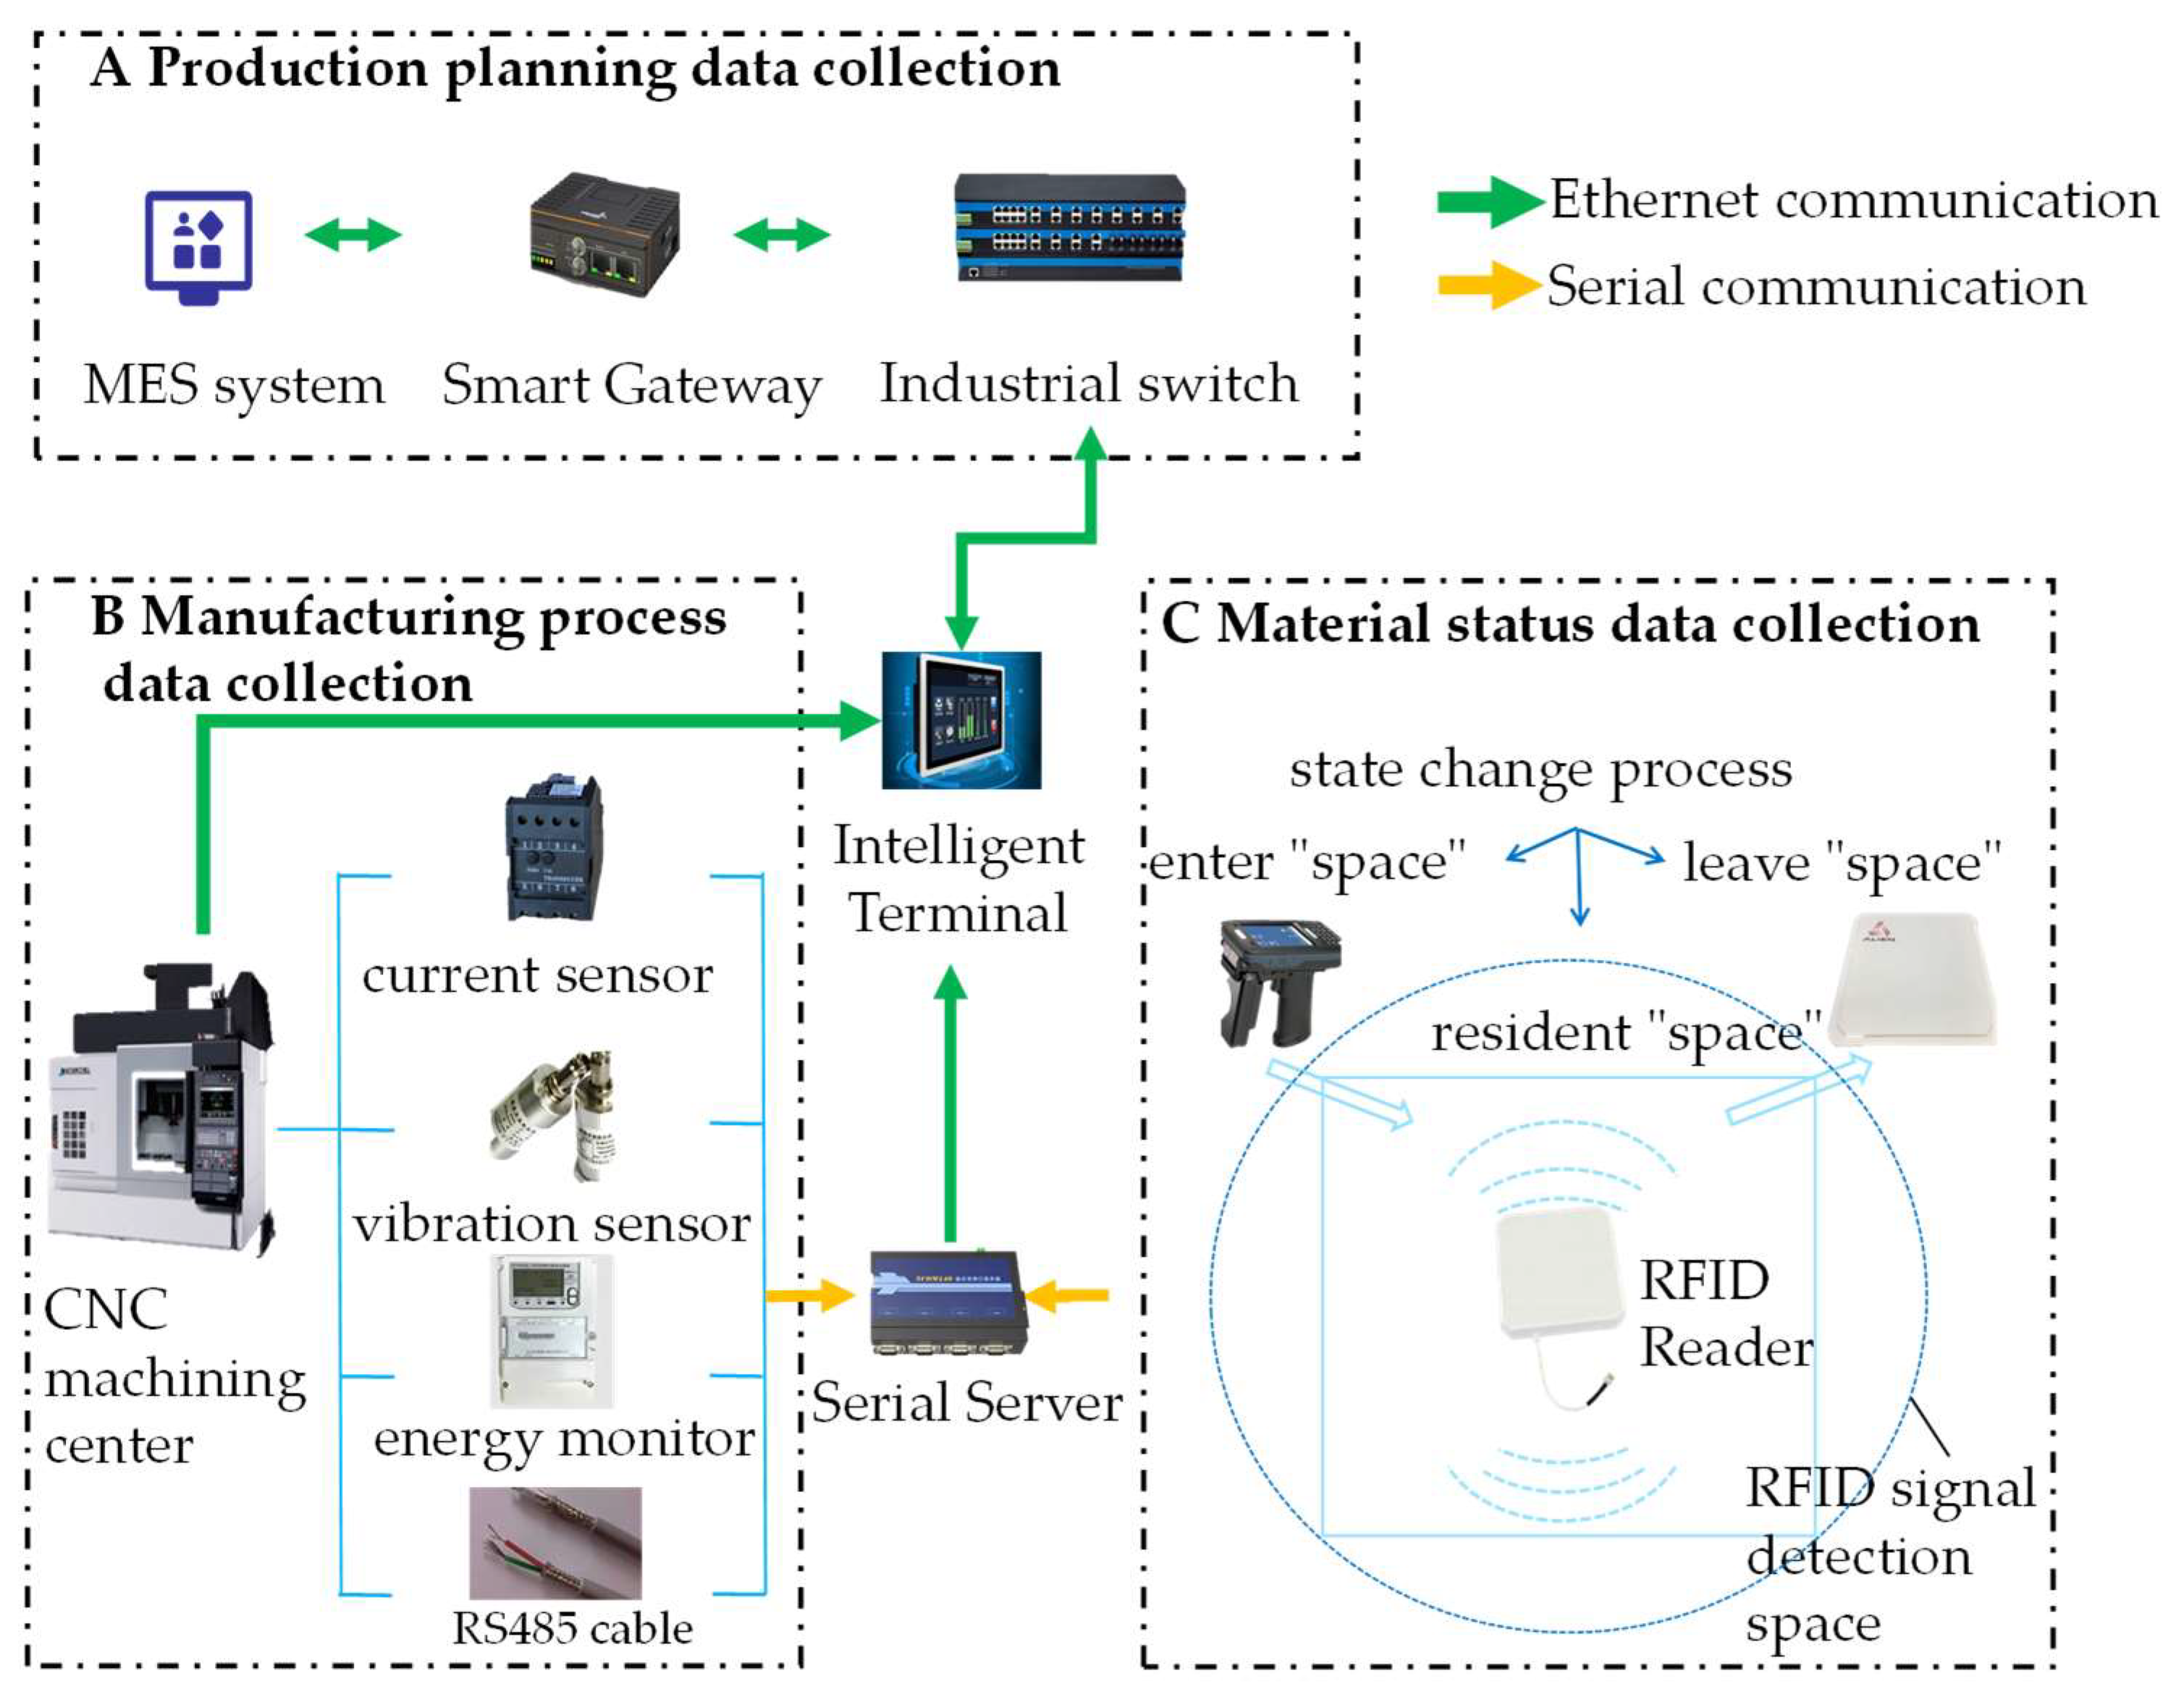
A real-time data acquisition scheme based on Cyber-Physical Systems (CPS) is designed to realize the real-time acquisition of manufacturing process data. It includes three parts: production planning data acquisition, manufacturing process data acquisition and material status data acquisition, as shown in
Figure 2. The job shop equipment realizes regular communication between the equipment and the intelligent terminal through a unified local network. It uses the data interface of the CNC machine tool to obtain the data collected by its monitoring module. The measures of adding auxiliary sensing devices are adopted for the problem of incomplete data collection from machine tool status. Radio frequency identification equipment, a current sensor, a temperature sensor, a vibration sensor and other commonly sensing devices are used to collect corresponding status data; Using RFID technology to sense material status data, the reader can automatically read the RFID signal to detect the data in the space and upload the read data to the intelligent terminal through the serial port server. The energy consumption data is collected by deploying electric energy sensors on each machine tool. And at the same time, the consumption of energy-consuming working fluids (such as cutting fluid) in the machining process is monitored by gas/liquid flow sensors. The data acquisition devices and their main parameters are shown in
Table 1.
2.2. Modeling and Encapsulation of Real-Time Data
The data processing of the IoT discrete job shop includes two main elements: energy consumption data and resource status data. Energy consumption data is collected by deploying power sensors on each machine tool; resource status data consists of machine tool, tooling and material data.
(1) Processing energy consumption data model
For energy-saving production in job shop, it is first necessary to collect relevant electrical energy data, and the consumption data model is:
where
ECID is the identification code of the processing energy consumption data;
MID is the identification code of the machine tool;
V and
T1 are the collected energy consumption data and collection time, respectively. The data collection frequency is twice per second, and the collected data will be stored in a temporary database.
(2) Machine tool state data model
where
S represents the switch of the machine tool;
WID represents the identified cation code of the processed material;
P represents the processing information;
H represents the tooling used;
B represents the fault information of the machine tool.
(3) Tooling state model
where
TID represents the identification code of the tooling;
PID represents the position information of the tooling;
W represents the wear condition.
(4) Material state model
where
PW and
T4 represent the processing status data and corresponding time of the material. The frequency of the RFID reader is five times per second, and the change data of the workpiece status will be stored in the database.
2.3. Dynamic Resource Allocation Mechanism
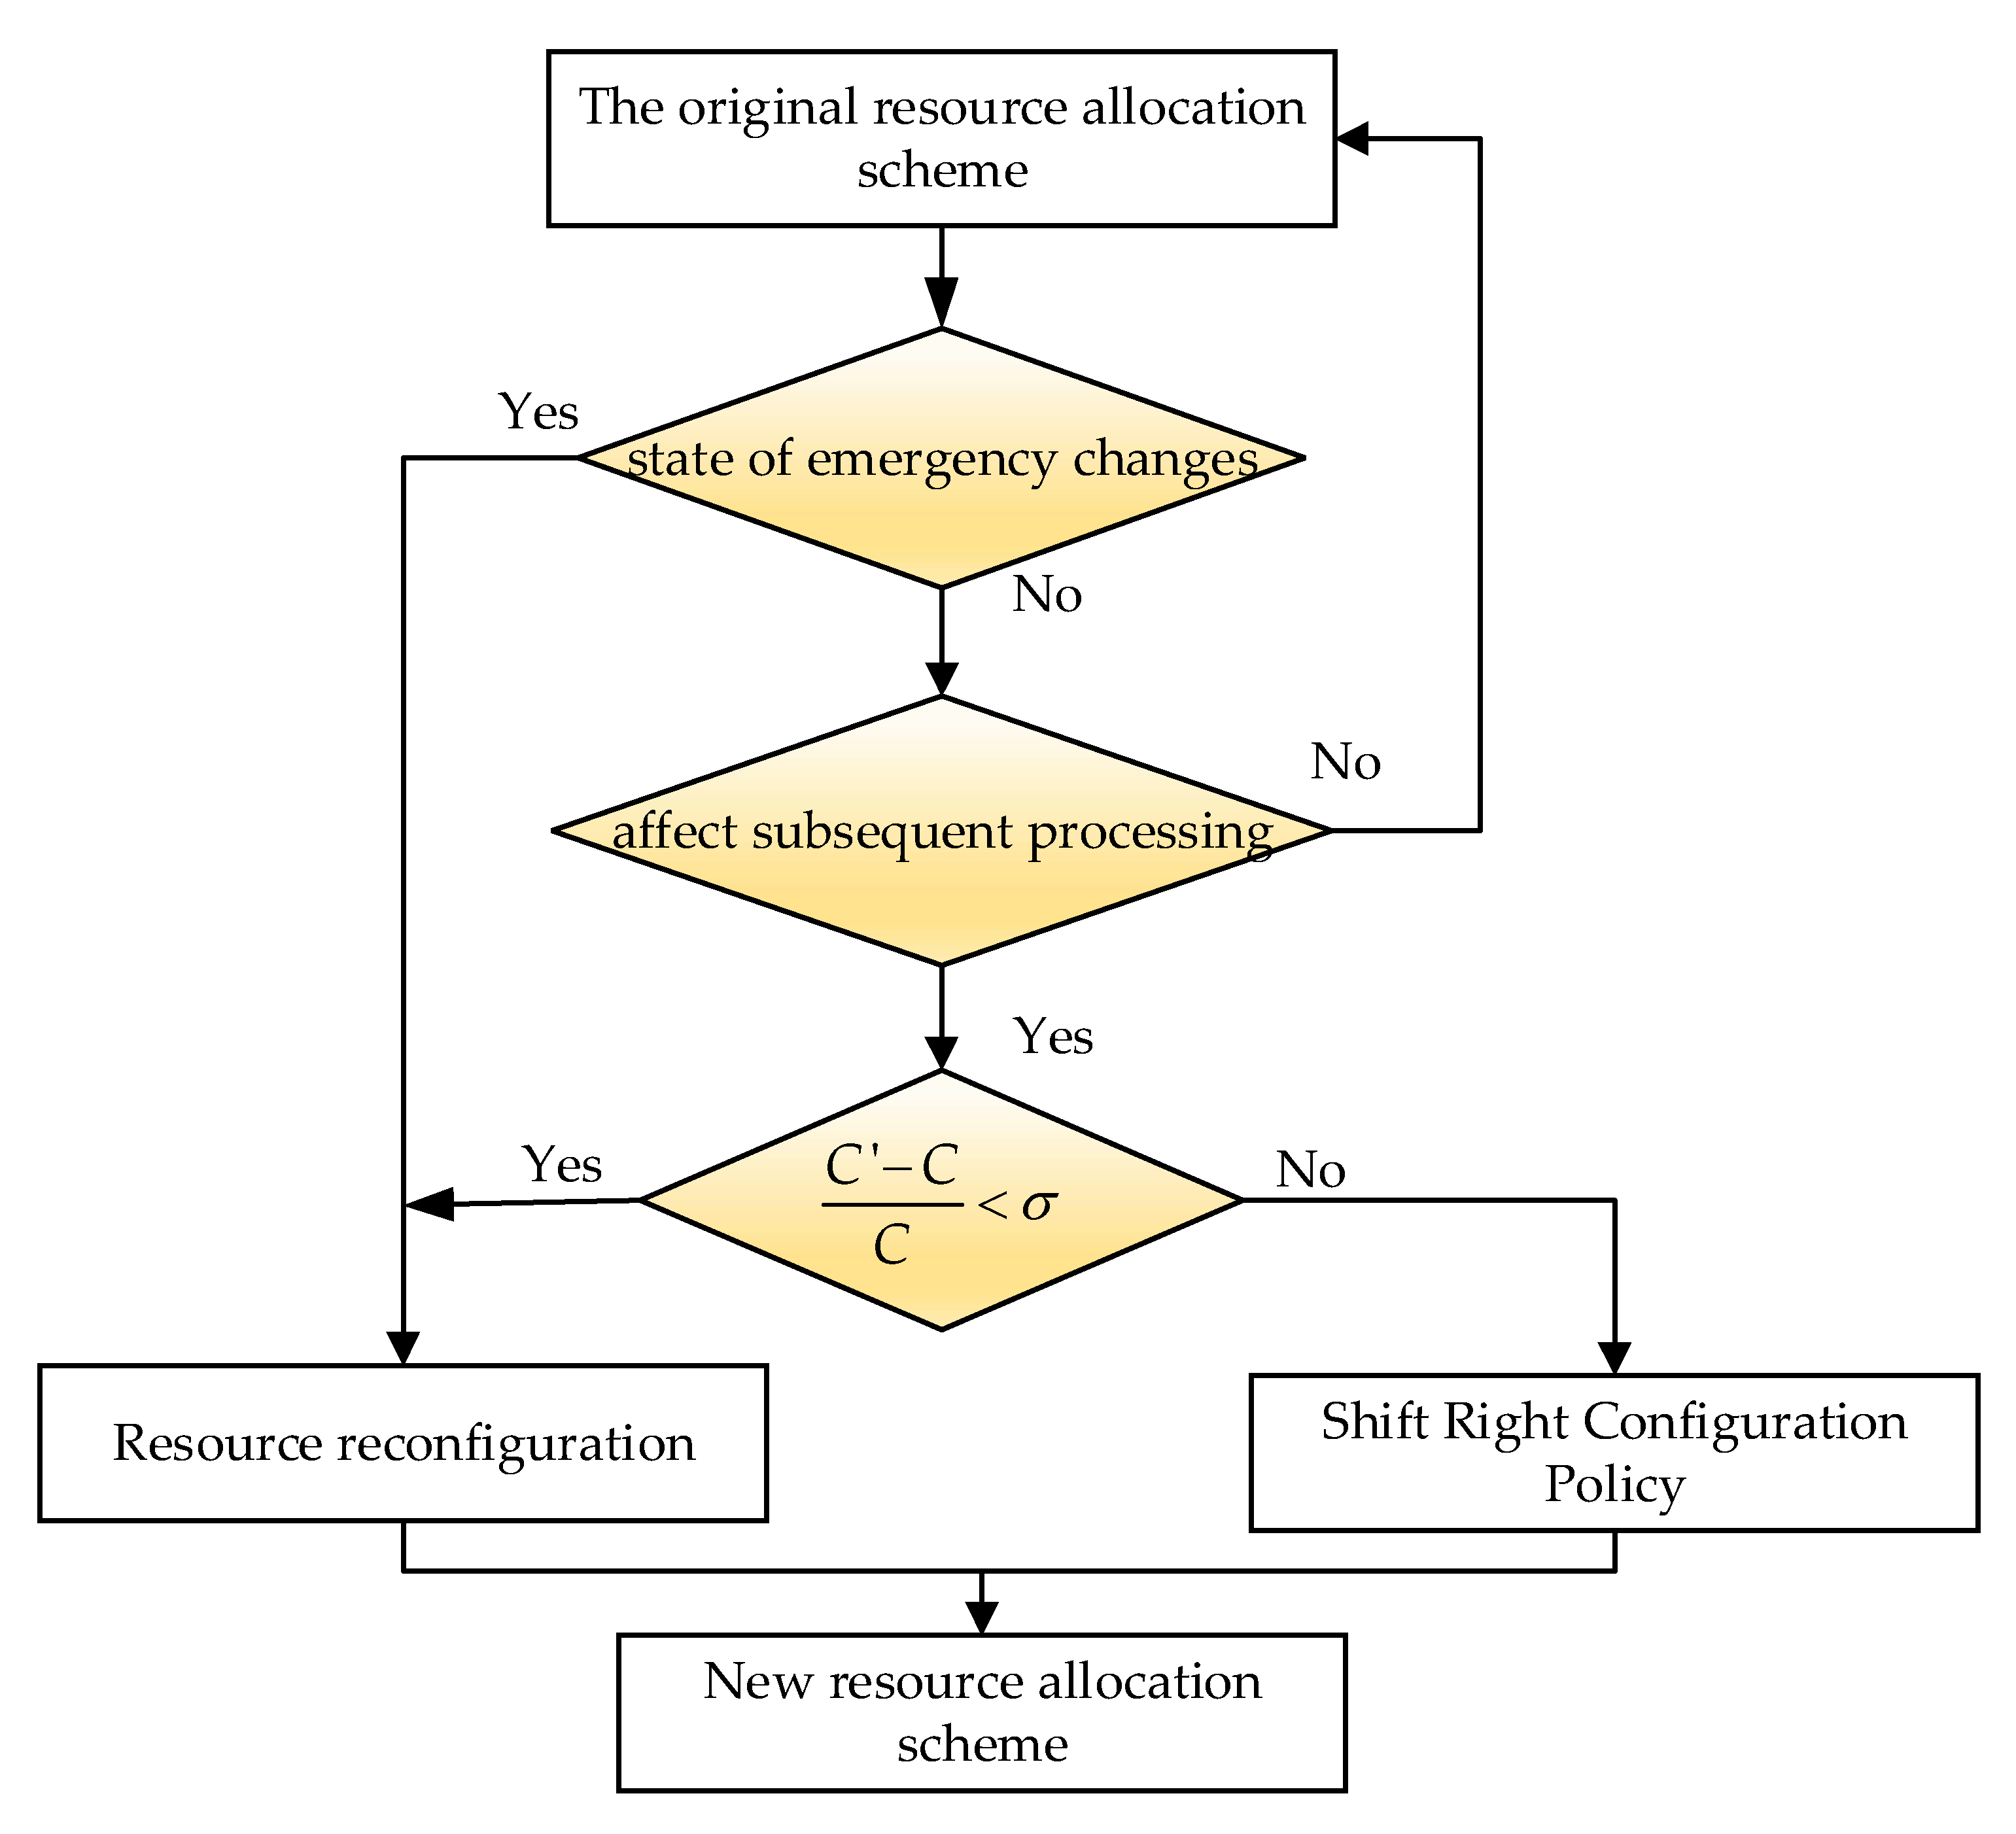
Cycle-driven, event-driven and hybrid-driven mechanisms are often used in reconfiguring job shop resources to ensure the smooth progress of production planning. Event-driven mechanisms have become popular among them due to their ability to respond to explicit production anomalies quickly. However, when the exception occurs frequently, it causes frequent resource reconfigurations, making production impossible. In addition, event-driven mechanisms cannot react to implicit disturbances. Therefore, this paper proposes a state-driven resource allocation mechanism which is driven by the real-time state of manufacturing resources, and combines this mechanism with a cycle-driven mechanism to form a hybrid-driven mechanism to respond to the cumulative impact of invisible disturbances. In addition, a method to evaluate the effects of anomalies using dynamic configuration thresholds is proposed to avoid production shutdowns caused by frequent reconfigurations. The proposed hybrid driving mechanism can give full play to the advantages of the event-driven and cycle-driven mechanisms, as shown in
Figure 3. It can design corresponding configuration strategies for different state transitions to accurately and respond to dynamic changes in the job shop in a timely manner, improve job shop production capacity and reduce costs.
Specifically, according to the degree of impact of state changes on the production process, this paper divides them into two categories: emergency state changes and ordinary state changes. Emergency state changes refer to changes that must be dealt with immediately after they occur, including job shop equipment failures and emergency work order insertion; common state changes refer to hidden disturbances in the job shop. Generally, these disturbances have little impact on job shop production or may be automatically resolved after they occur, including personnel leaving their posts, processing overtime, etc. A few ordinary state changes have little effect on the overall scheduling scheme, but if gradually accumulated, they will increase the deviation between the initial scheduling and the actual production. The change of the emergency state of the job shop is handled by completely rescheduling the configuration. The change of the ordinary state, firstly based on the above-mentioned earliest and latest starting time scheduling Gantt chart, is determined whether the cumulative delay of the event will affect the latest starting time of the next process of the machine. If there is an impact, the workpiece delay completion threshold is set based on the workpiece delivery date. If the point is not exceeded, the right-shift rescheduling method is used. If the threshold is exceeded, the entire rescheduling method is used. The threshold σ is obtained by the Formula (5), taking into consideration the two factors processing time and energy consumption.
where
Nk is the number of product types processed by the machine
k;
Ni is the number of processes included in part
i;
Tik is the maximum acceptable processing time of the
i-th product in machine
k;
Aik is the planned processing time of
i-th product in the machine
k;
Cik is the maximum acceptable carbon emission of the
i-th product in the machine
k;
Wik is the planned energy consumption of the
i-th product in the machine
k, and
η1 is the carbon emission factor of electric energy.
4. Results
This method is applicable to most discrete production plants targeting low carbon. Elevator parts have a wide range of application scenarios and are typical representatives of mechanical parts processed in a discrete job shop. Therefore, the effectiveness of the method was verified by taking the intelligent low-carbon resource allocation in the elevator parts processing job shop as an example. This is a virtual simplified model from a manufacturing company in Jiangsu Province, China, whose main products are various elevator parts, including traction machines, etc.
4.1. Data Preparation
The job shop was equipped with transfer equipment such as a mechanical arm, slide rail and roller table for the transportation, loading and unloading of materials, tooling and work in progress. By equipping various sensors, numerical control systems, industrial personal computers and other manufacturing IoT equipment, the workshop had the ability to monitor materials, equipment and other manufacturing elements in real time. The actual environment of the job shop is shown in
Figure 8. The production process studied was the processing of the brake disc, output shaft, and traction wheel. The processing equipment involved includes drilling and milling center (TC-R2B), precision machine tool (BNC427C), CNC lathe (L200E-M), face turning center (LT2000EX), and machining center (LJ-650), etc. In this discrete job shop, fine-grained status data of processing equipment are collected using CNC machine tools and sensor networks, while the position of workpieces is located using RFID equipment (Alien ALR-H450). The production process can be simplified as a 9
8 discrete job shop resource optimization problem. The average processing power (kWh), average standby power (kWh), and cutting fluid consumption per unit time (ml/min) corresponding to each equipment are shown in
Table 2. The values in the table are all dimensionless quantities, in which “-” indicates that the process cannot be processed on this equipment.
4.2. Algorithm Verification
4.2.1. Performance Comparison of the Proposed Method with Other Multi-Objective Optimization Methods
The production task sets PTS1-PTS9 of different scales shown in
Table 3 were used to compare I-ICA with traditional ICA and the current relatively advanced non-dominated genetic algorithm NSGA-III. The above algorithm was implemented using MATLAB R2016a programming. The operating environment of the test computer was the Windows10 operating system, the CPU frequency was 1.90 GHz, 2.11 GHz, and the memory was 16 GB. Numerical simulation experiments were carried out under the same conditions. The parameters of each algorithm are shown in
Table 4:
Each algorithm ran 10 times independently to solve nine production task sets and calculates the average completion time value and carbon emissions. According to the relevant literature,
η1 = 0.7478 kgCO
2/kWh, and
η2 = 29.6 kgCO
2/L. The statistical results are shown in
Table 5. Through analysis, it can be found that there is little difference between the optimal solutions obtained by the ICA algorithm and the NSGA-III algorithm. However, the optimal values obtained by the former were more concentrated on multiple targets, indicating that the algorithm is effective for multiple targets. The uniformity of the objective solution was better. The optimal values and average values of all indicators obtained by the I-ICA were superior to the ICA and the NSGA-III, indicating that the I-ICA algorithm has better local and global search capabilities. The bolded values in the table were better. When solving small-scale problems, NSGA-III obtains three better values, ICA obtains two better values, and I-ICA obtains five better values. When solving large-scale problems, the values obtained by I-ICA were all the better than that of NSGA-III and ICA.
In contrast to the single-objective problem, evaluating the multi-objective situation cannot only stop at comparing the values of each optimization objective function, but also needs to consider the spatial distribution of the solution. Therefore, the spacing and H.V. indexes are selected to evaluate different aspects of the algorithm performance. In particular, since the ICA algorithm normalizes multiple targets through a weighting method, the optimal solution within a specific range is selected to form a solution set for analysis.
The spacing index can reflect the uniformity of the individual distribution in the non-dominated solution set, which is specifically defined as follows:
where
dl is the shortest distance from individual l to other individuals,
is the average value of all dl, and
N is the solution set size. The lower the index value, the better the distribution and diversity of individuals in the solution set. The value of 0 means that all individuals are equally spaced.
The H.V. index was used to measure the volume of a target space, which can comprehensively reflect the convergence and diversity of the algorithm. The specific definition is as follows:
where
δ represents the Lebesgue measure, which is used to measure the volume,
N is the size of the non-dominated solution set, and
vl represents the hypervolume formed by the reference point and the
l-th individual in the solution set. The reference point is to be dominated by all individuals in the non-dominated solution set. In this paper, the point corresponding to the maximum value of each optimization objective function value is selected as the reference point in the H.V. index.
Figure 9 shows the comparison box plot of the algorithm spacing index. It can be seen that the spacing value of the I-ICA is the lowest, and the gap with the other two algorithms increases with the increase of the solution scale, indicating the uniformity of the algorithm solution. Diversity is better than the two algorithms and has more advantages in solving large-scale problems. In addition, the NSGA-III algorithm’s box is more comprehensive, meaning that the data volatility was relatively high and the data stability was rather poor.
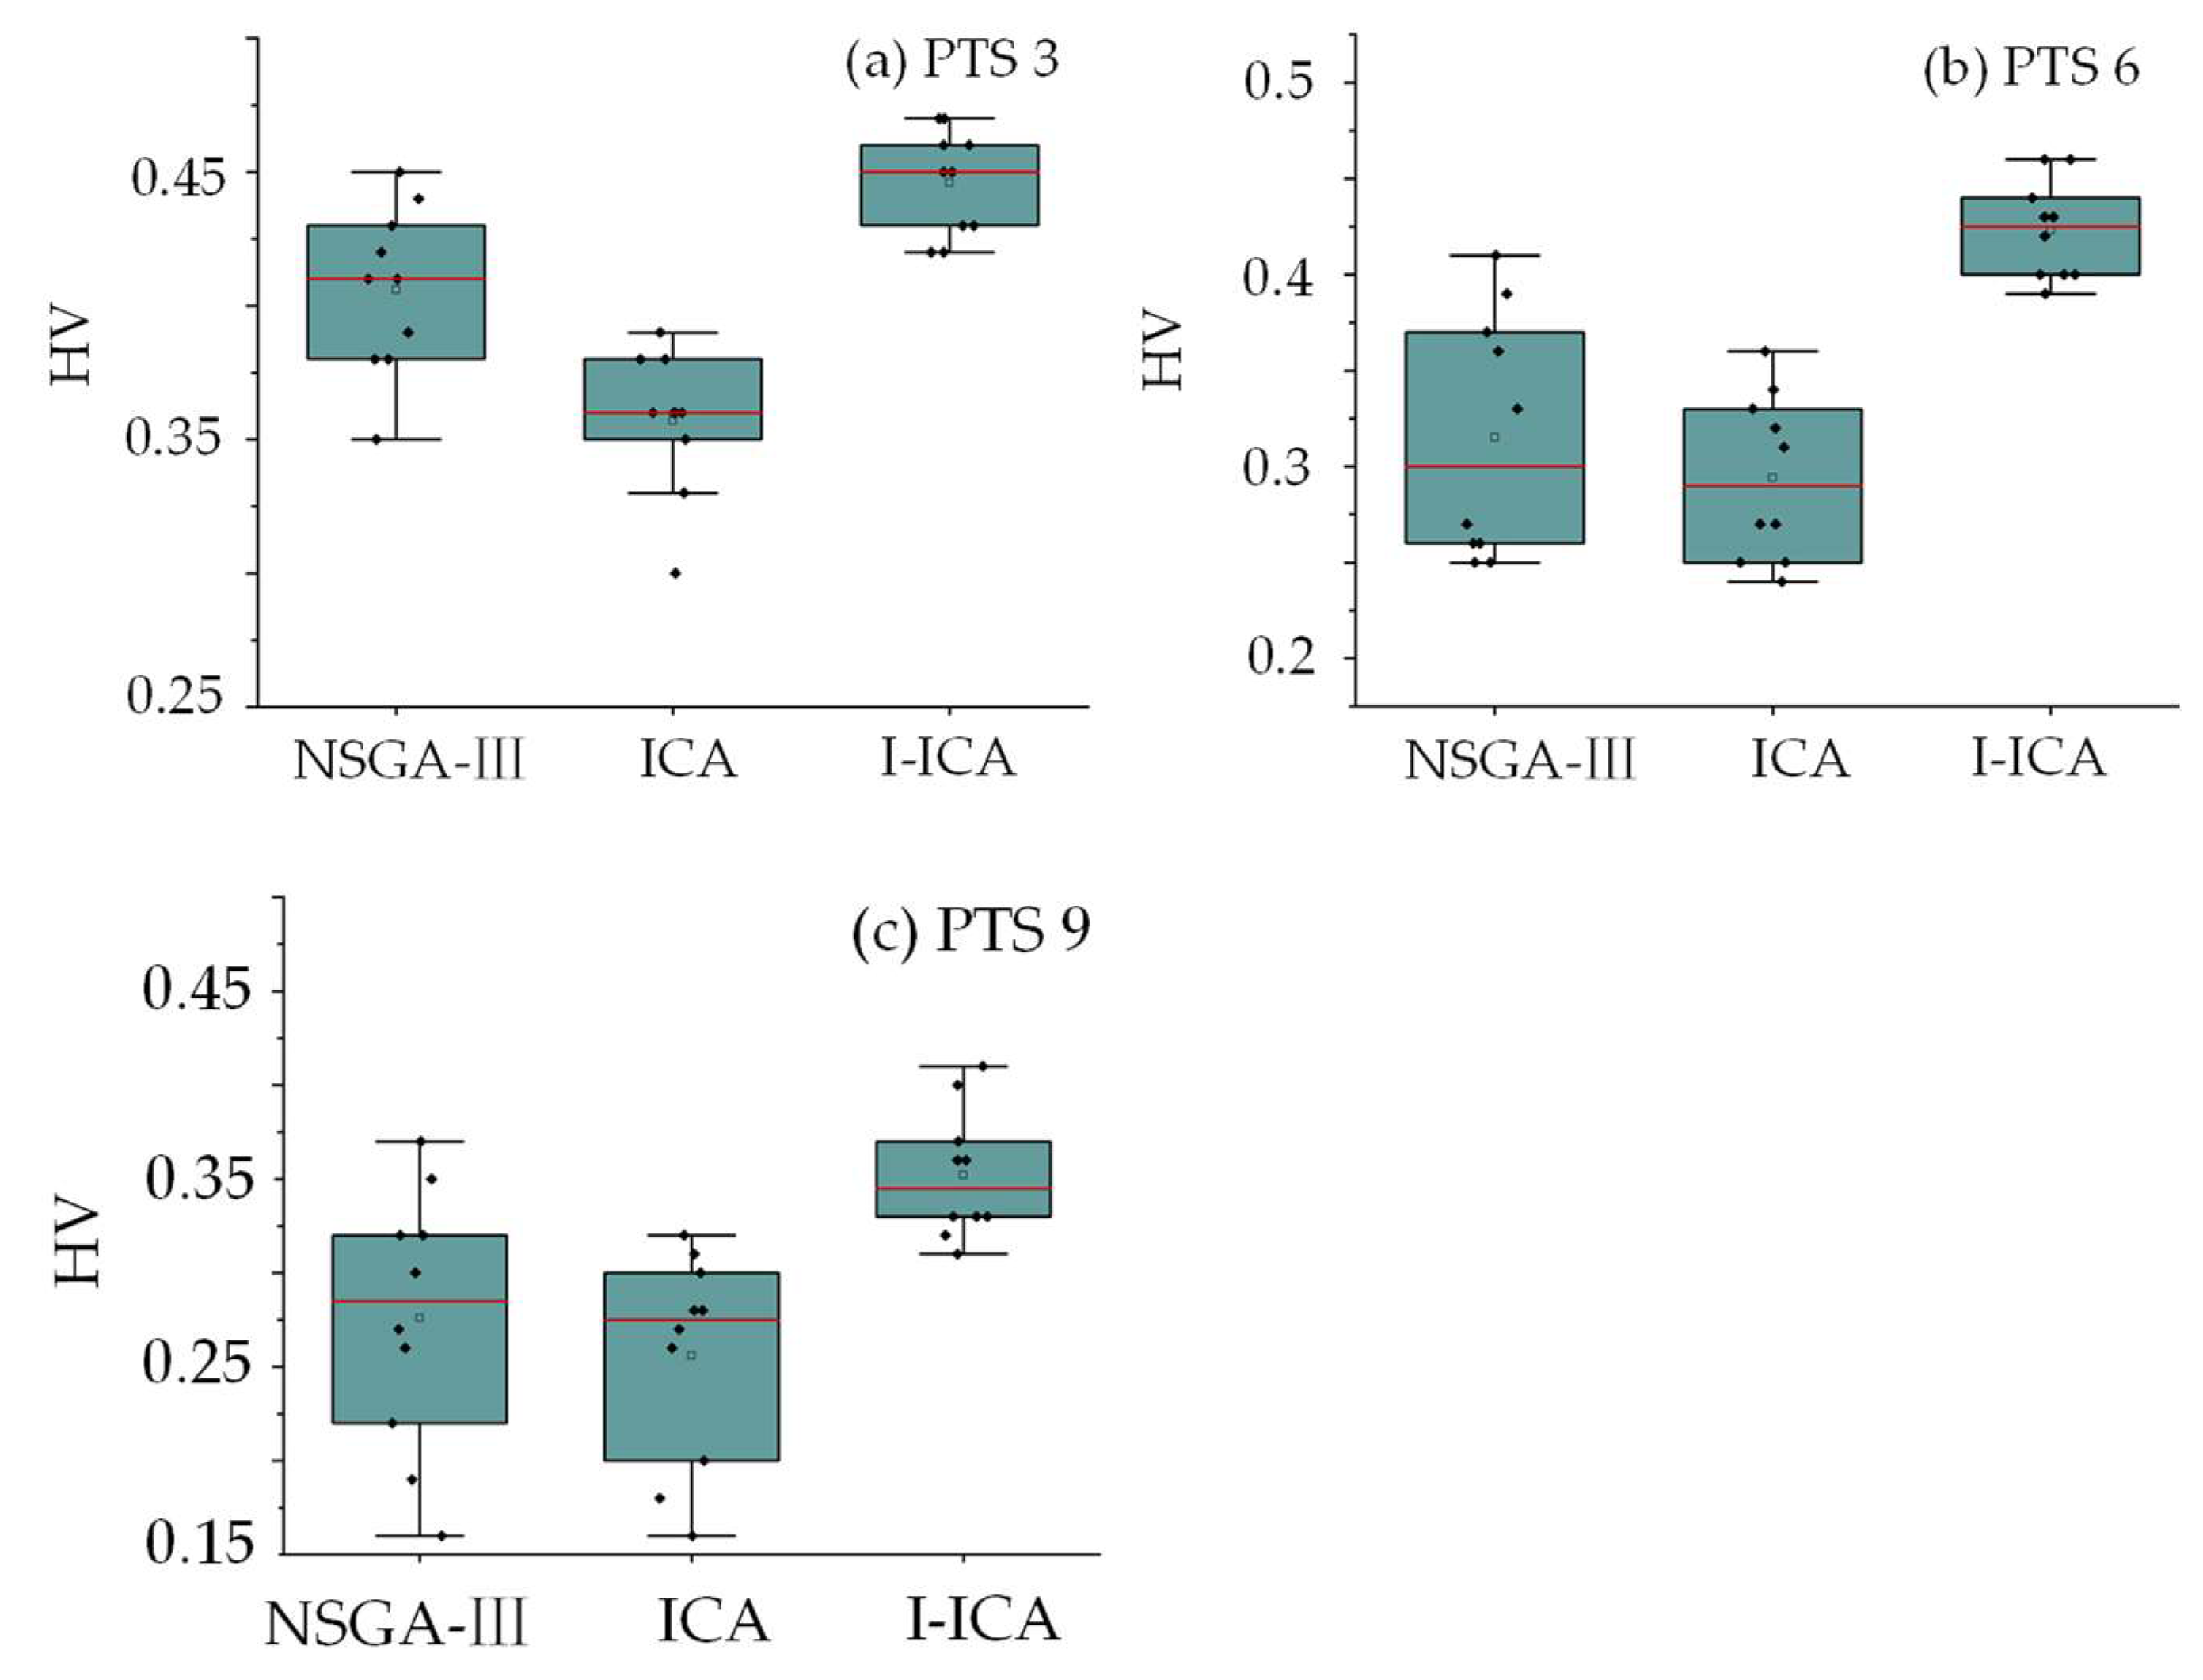
Figure 10 is a box plot of the algorithm H.V. index comparison, from which it can be seen that the H.V. values of the I-ICA algorithm are the highest, indicating that the algorithm’s overall performance was better than the other two algorithms. As the scale of the problem increased, although the algorithm’s advantages were weakened, the box remains within a narrow range, indicating that the algorithm’s stability was better than the ICA and NSGA-III algorithms.
On the whole, the upper and lower limits of the box plot of the algorithm in this paper were lower, the overall distribution was more concentrated, and it was closer to the optimal value. It shows that in the comparison experiment, the solution set obtained by the I-ICA algorithm has little difference between the spacing index and the H.V. index. In other words, the proposed algorithm is better than the comparison algorithm in terms of convergence, uniformity and diversity.
4.2.2. Validation of the Proposed Method under Disturbance
In uncertain disturbances, machine failures occur frequently and significantly impact the production process. Therefore, this paper selected the scene of machine failures to verify the effectiveness of the proposed method in solving the problem of dynamic resource allocation in a flexible job shop. The real-time state-driven low-carbon resource allocation strategy proposed in this paper was compared with the results of traditional shift-right scheduling and ADSM [
9] to verify its effectiveness. The original configuration scheme remained unchanged in the specific strategy of right-shift processing. The workpiece process directly affected and the available time of the machine tool then directly delayed the time it takes to deal with the exception, and the indirectly affected process delayed the corresponding time according to the constraints of the process and the machine tool.
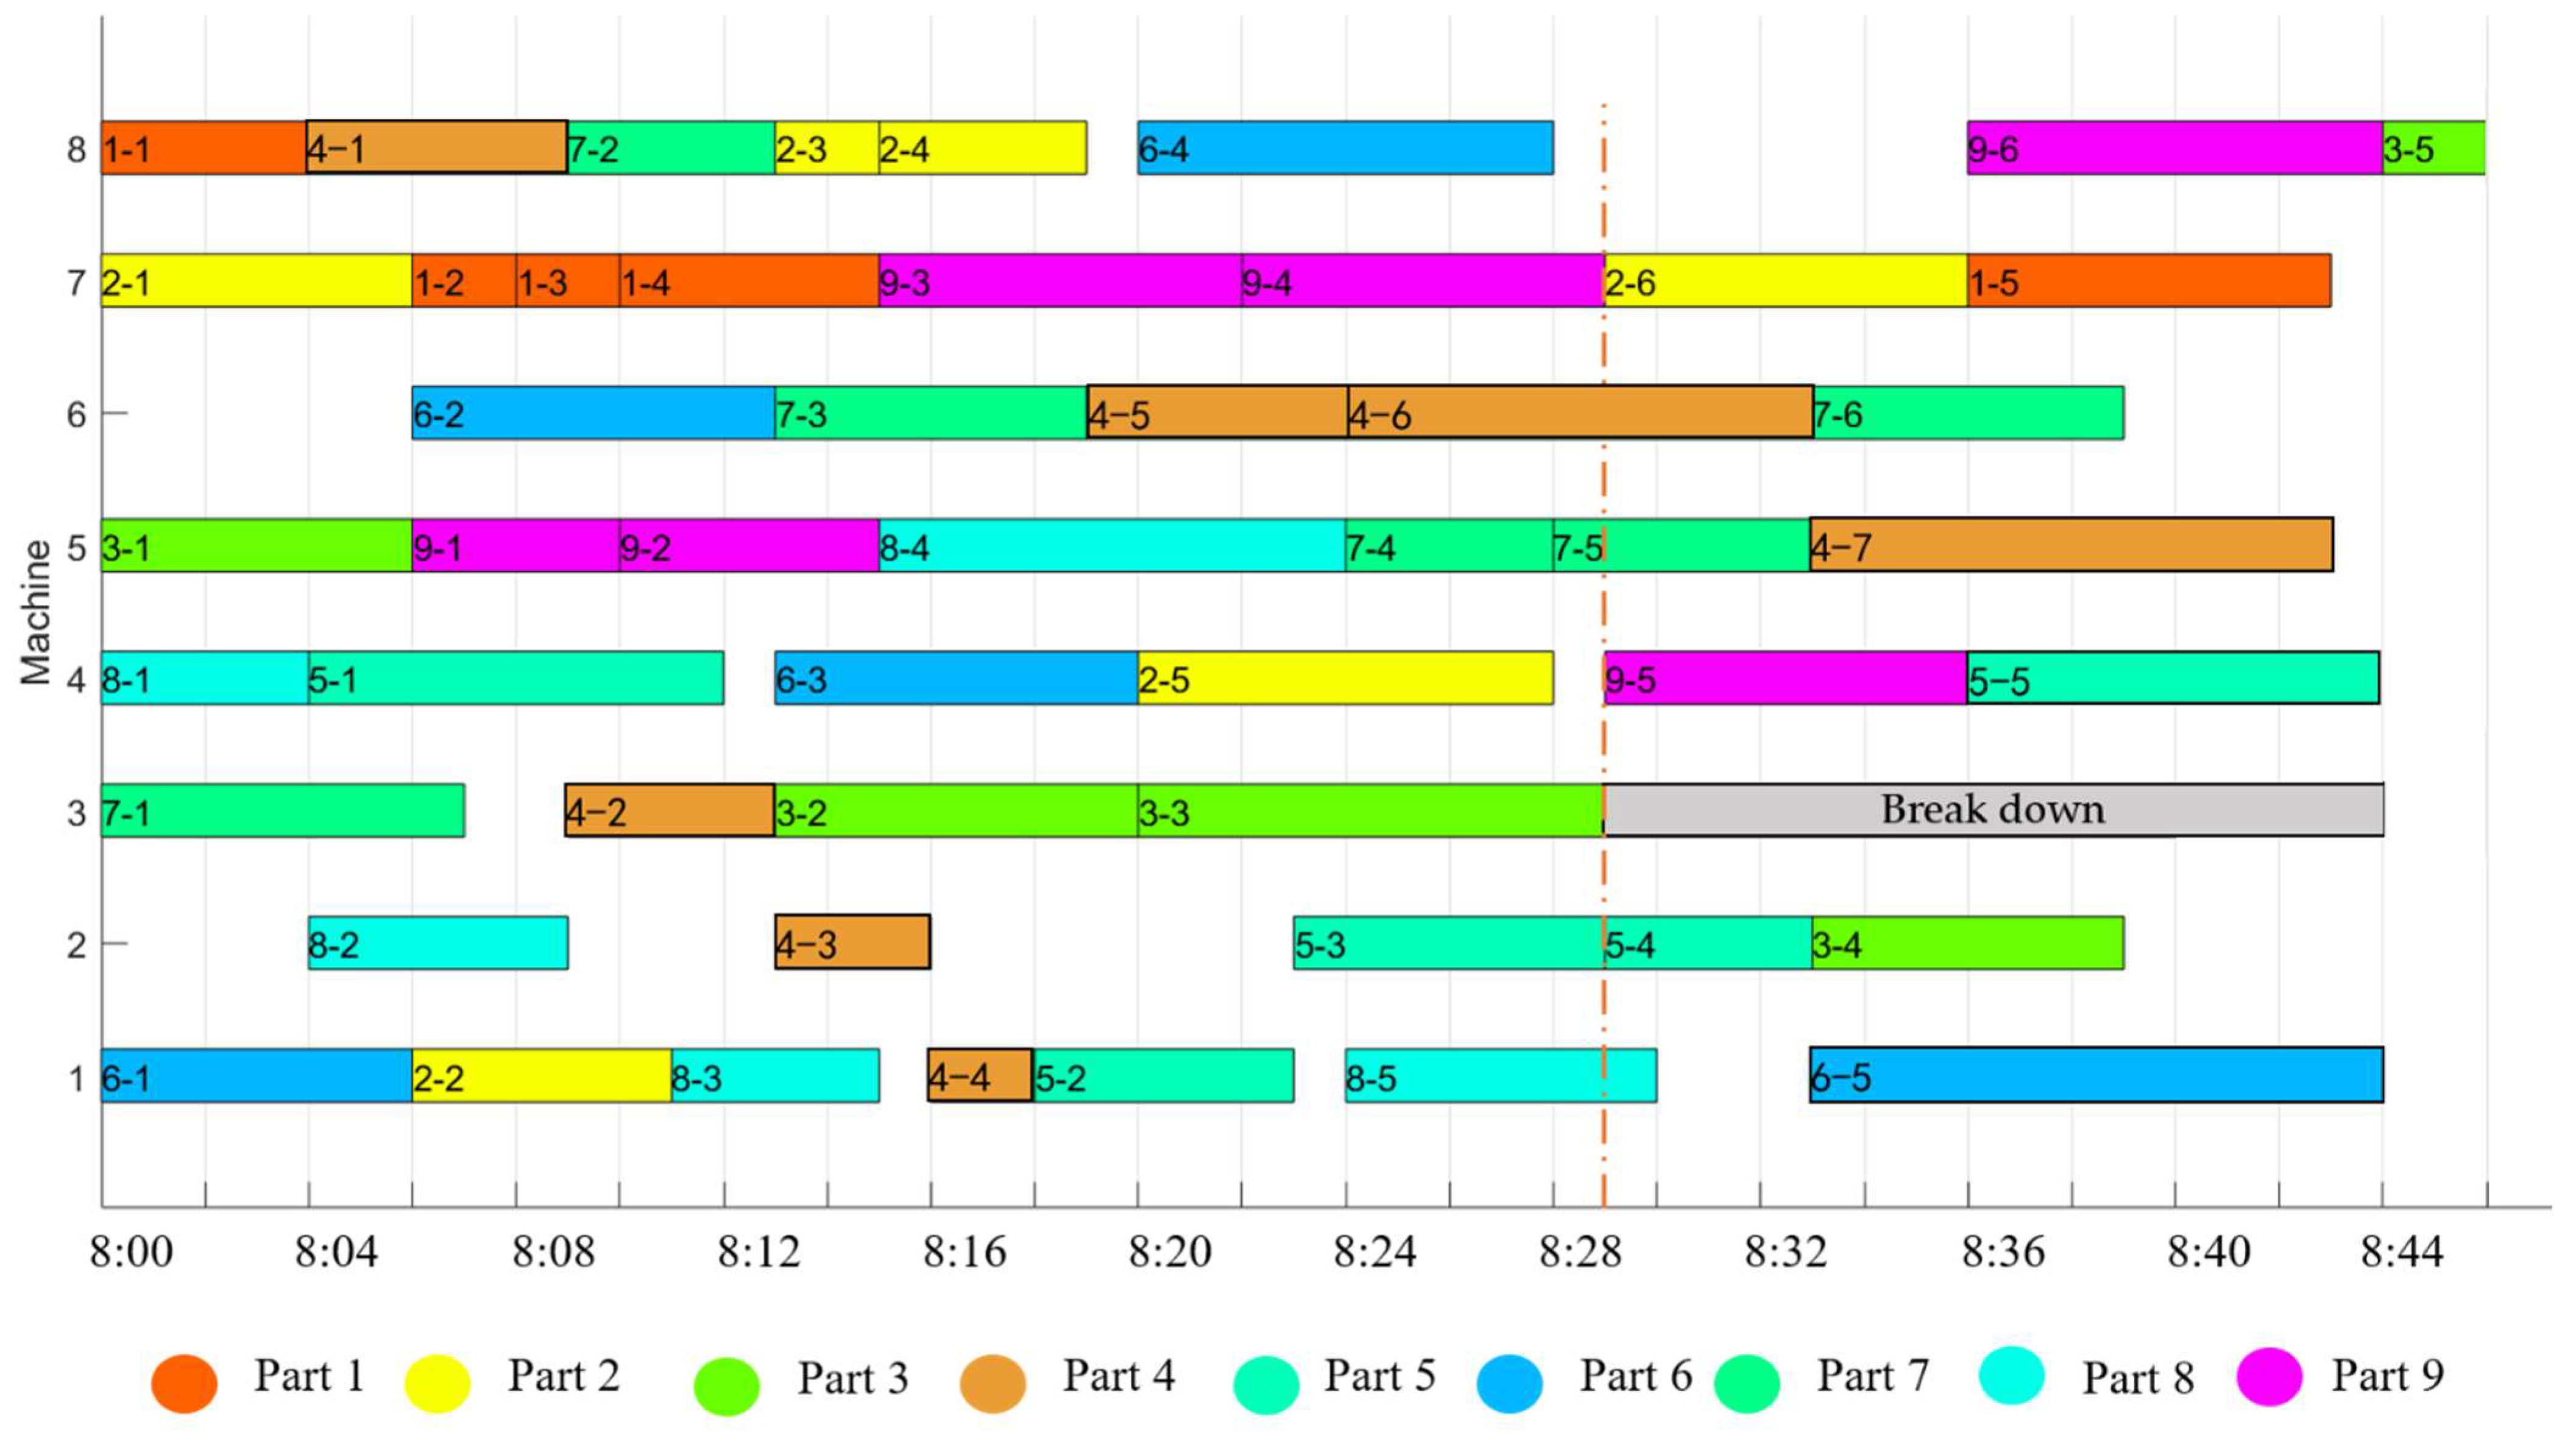
First, the I-ICA algorithm was called to configure the production tasks mentioned above without considering the abnormality of the job shop, and the initial configuration scheme was obtained.
Figure 11 shows the Gantt chart of the iterative optimal solution. The same color represents the same workpiece. The numbers on the color block are expressed as follows: the first number is the workpiece number, and the last two digits represent the process number, such as ‘1-1’ for the first process of workpiece 1, ‘4-2’ Indicates the second process of workpiece 4. Machine 3 failed at 8:28, and the fault repair time was 8:44. Perform right-shift processing on all initial scheduling schemes to obtain the right-shift configuration scheme, as shown in
Figure 12. Reconfigure the manufacturing resources after the machine failure through method ADSM, and obtain the configuration scheme as shown in
Figure 13. Perform dynamic resource allocation on all initial scheduling schemes to obtain the reconfiguration scheme, as shown in
Figure 14.
The comparison shows that since the traditional model does not consider the real-time state of manufacturing resources, processing can only be performed after the abnormality is resolved when an abnormal situation occurs. The model in this paper used manufacturing resources as constraints through real-time state monitoring so that the processes affected could be reasonably adjusted. For example, process 5 of the workpiece 6 on the faulty machine 3 was arranged on other machines for processing, and the final result was obtained. Compared with the traditional strategy, the scheduling scheme reduced the maximum completion time and carbon emissions by 16.36% and 9.36%, respectively. Compared with the ADSM method, the maximum completion time and carbon emissions were reduced by 8% and 5.27%, respectively.
4.3. Discussion
In terms of algorithm performance, without considering the machine state transition, it can be seen from
Table 4 that the I-ICA can comprehensively consider the processing time and processing energy consumption. When the completion time is short, the carbon emission is relatively tiny. The mean and optimal value of the genetic algorithm are larger than those of the proposed method, so the latter runs stably and has an excellent solution. With the increase in the problem size, the advantages are more prominent. In addition, the method can couple the two objectives through the fitness function so that they both approach the optimal solution. Combined with the comparison results of spacing and H.V. indicators, it can be seen that the proposed algorithm performs better in the spatial distribution, diversity and convergence of the solution. The main reasons for this are as follows:
(1) The traditional NSGA-III algorithm has limitations in terms of initial population quality, crossover mutation rate, retention strategy, etc., making the algorithm search effect poor and prone to falling into local optimum.
(2) The improved external empire invasion strategy optimizes the multiple objectives of the initial empire collaboratively, preventing the empire from moving to a certain target direction so that the initial empire is to a certain extent better than the comparison algorithm in all target dimensions, in speeding up the algorithm convergence;
(3) Regarding solution speed, NSGA-III is a single-structure algorithm, and ICA and I-ICA are multi-structure algorithms. The distribution of the latter in the solution space is more uniform, making the multi-structure algorithm closer to the optimal solution. When the scale of the problem is small, the distance between the initial solution and the optimal solution is relatively small, and the difference between the algorithms of the two structures is not obvious. However, the advantages of multi-structure algorithms gradually become more prominent as the problem scale increases.
In addition, when the machine state changes, compared with the right-shift strategy and ADSM method, the proposed dynamic allocation strategy can detect the sudden change of the machine state in time and perform low-carbon reconfiguration to respond to the sudden change of the machine state to the original configuration. The scheme’s impact can be more comprehensively considered by examining the processing time and energy consumption, and the optimal solution can be found. This proves the necessity and importance of intelligent monitoring and diagnosing machine states. In addition, the low-carbon resource allocation, considering the uncertainty of machine states, has excellent practical application value.
5. Conclusions
This paper introduces a low-carbon resource allocation method for discrete manufacturing job shop driven by the real-time status of manufacturing resources. Considering the two objectives of job shop carbon emissions and maximum completion time, a low-carbon resource allocation model for discrete manufacturing job shop was established, and an improved multi-objective I-ICA algorithm was proposed to solve the model. Finally, the algorithm performance comparison and example verification proved that the proposed method runs stably, performs well and has great practical value. The main contributions of this paper are as follows:
(1) The framework of discrete job shop resource dynamic configuration in the IoT environment is proposed, and the real-time data collection and encapsulation modeling of manufacturing resource are realized;
(2) A calculation model of the dynamic allocation threshold of manufacturing resources based on delivery date is established and a dynamic allocation mechanism of manufacturing resources based on allocation threshold is proposed;
(3) The hybrid evolutionary algorithm was improved in order to solve the resource optimization allocation model. A new cost normalization formula was proposed to solve the problem of losing some colonial countries during initialization; the intrusion mechanism is proposed to help the algorithm function outside of the local optimal solution, which improves the speed and quality of the algorithm.
With the increasingly severe environmental situation, enterprises should shoulder the responsibility of environmental protection, improve their awareness of environmental protection, and put reducing carbon emissions in the production process in an important position while pursuing benefits. At the same time, various countries have proposed different carbon emission limitation measures. In the future, manufacturing enterprises in various countries will actively or passively enter the carbon emission quota market and undertake the task of quantifying and reducing carbon emissions. It is found that the proposed method can be used to guide the manufacturing resource allocation process, and both the completion time and energy consumption goals can be considered. In addition, the framework proposed in this paper can provide reference for the real-time carbon emission perception quantification of a manufacturing job shop.
In future research, the carbon emission tooling model (such as cutting tools, etc.) can be established and added to the objective function. In addition, the threshold value of the machine tool switch can be studied, and the reasonable operation mode of the machine tool can be explored to further reduce the energy consumption in the manufacturing process. A dynamic resource allocation evaluation system can be established to guide the allocation process, including the stability of the allocation scheme and the allocation cost.


