1. Introduction
Wind energy is considered a pillar of the low-carbon energy system of the future [
1]. Whereas there is broad scientific consensus that electricity from wind has a low CO
2 footprint [
2], there is growing public concern about adverse side effects of this technology. Moreover, a comparative assessment of energy technologies is incomplete as long as the social costs of wind energy are not as well understood as those of coal, oil, gas and nuclear energy. The aim of the present work is to summarize the present understanding of three side effects of wind energy that have not been comprehensively assessed to date. Moreover, we formulate open questions that should be investigated in order to create impact mitigation strategies for future wind farms.
The
primary effect of wind rotors is the extraction kinetic energy from atmospheric flows for conversion to electrical energy. This field is extensively addressed by current research and will not be discussed here. The present work is devoted to
secondary effects of wind rotors and wind farms, which we refer to as
side effects and involve two layers: physical and biological effects as the inner layer and social costs as an outer layer. The focus of this review is unresolved questions regarding the inner layer, including the redistribution of atmospheric flows and the influence of rotors on humans and wildlife, as well as on agricultural yield. In part of our review, we propose policy incentives to answer these open questions. In addition to this main focus, we also briefly address open questions about the social costs of wind power. Before providing an outline of the present paper, it is appropriate to briefly refer to the definition of the concept of social costs [
3] and their estimate for nuclear energy [
4] and to mention that, to the best of our knowledge, there exists no comprehensive analysis of the social costs of wind energy.
We approach the formulated open question with a review of existing literature with particular emphasis on three topics. In the following section, we analyze the knowledge about the impact of wind energy on flying insects. In contrast to the other two sections, the opening topic is built around a key reference [
5] from the institution of the first author expanding upon and detailing with current literature. We decided not to include the topic of how offshore wind farms affect marine mammals, as it was comprehensively discussed in [
6], which we strongly recommend for further reading.
Section 3 is devoted to the question of how perturbations in the turbulent flow field affect air velocity, temperature, moisture and precipitation in the vicinity of wind parks. In
Section 4, we discuss the effects of sound emitted from wind turbines on humans.
Section 3 and
Section 4 comprise a conventional systematic screening of recent relevant literature and selected expert judgement. We selected the three topics (insects, flow fields and sound) for this review because we believe them to be the most important. We therefore deliberately omitted topics such as birds, particle emissions from turbine blades, recycling of wind turbines and their foundations and optical perturbations. In
Section 5, we discuss multicriteria selection of sites for future wind farms. In
Section 6, we summarize our conclusions and highlight open questions should be addressed in future research.
2. Impact of Wind Power Generation on Flying Insects
2.1. Correlation of Insect Migration and Rotor Height
In 2018, the German Aerospace Center (DLR) carried out a study based on a comprehensive literature research and simplified modelling of the possible interferences with flying insects by wind rotors in Germany [
5]. The FlyWiP study provides comprehensive evidence from entomological literature that many insect species migrate at a higher altitude than their quotidian flight boundary layer (FBL), which usually reaches up to approximately 30 m above ground level [
7,
8,
9,
10,
11,
12,
13,
14,
15,
16,
17,
18,
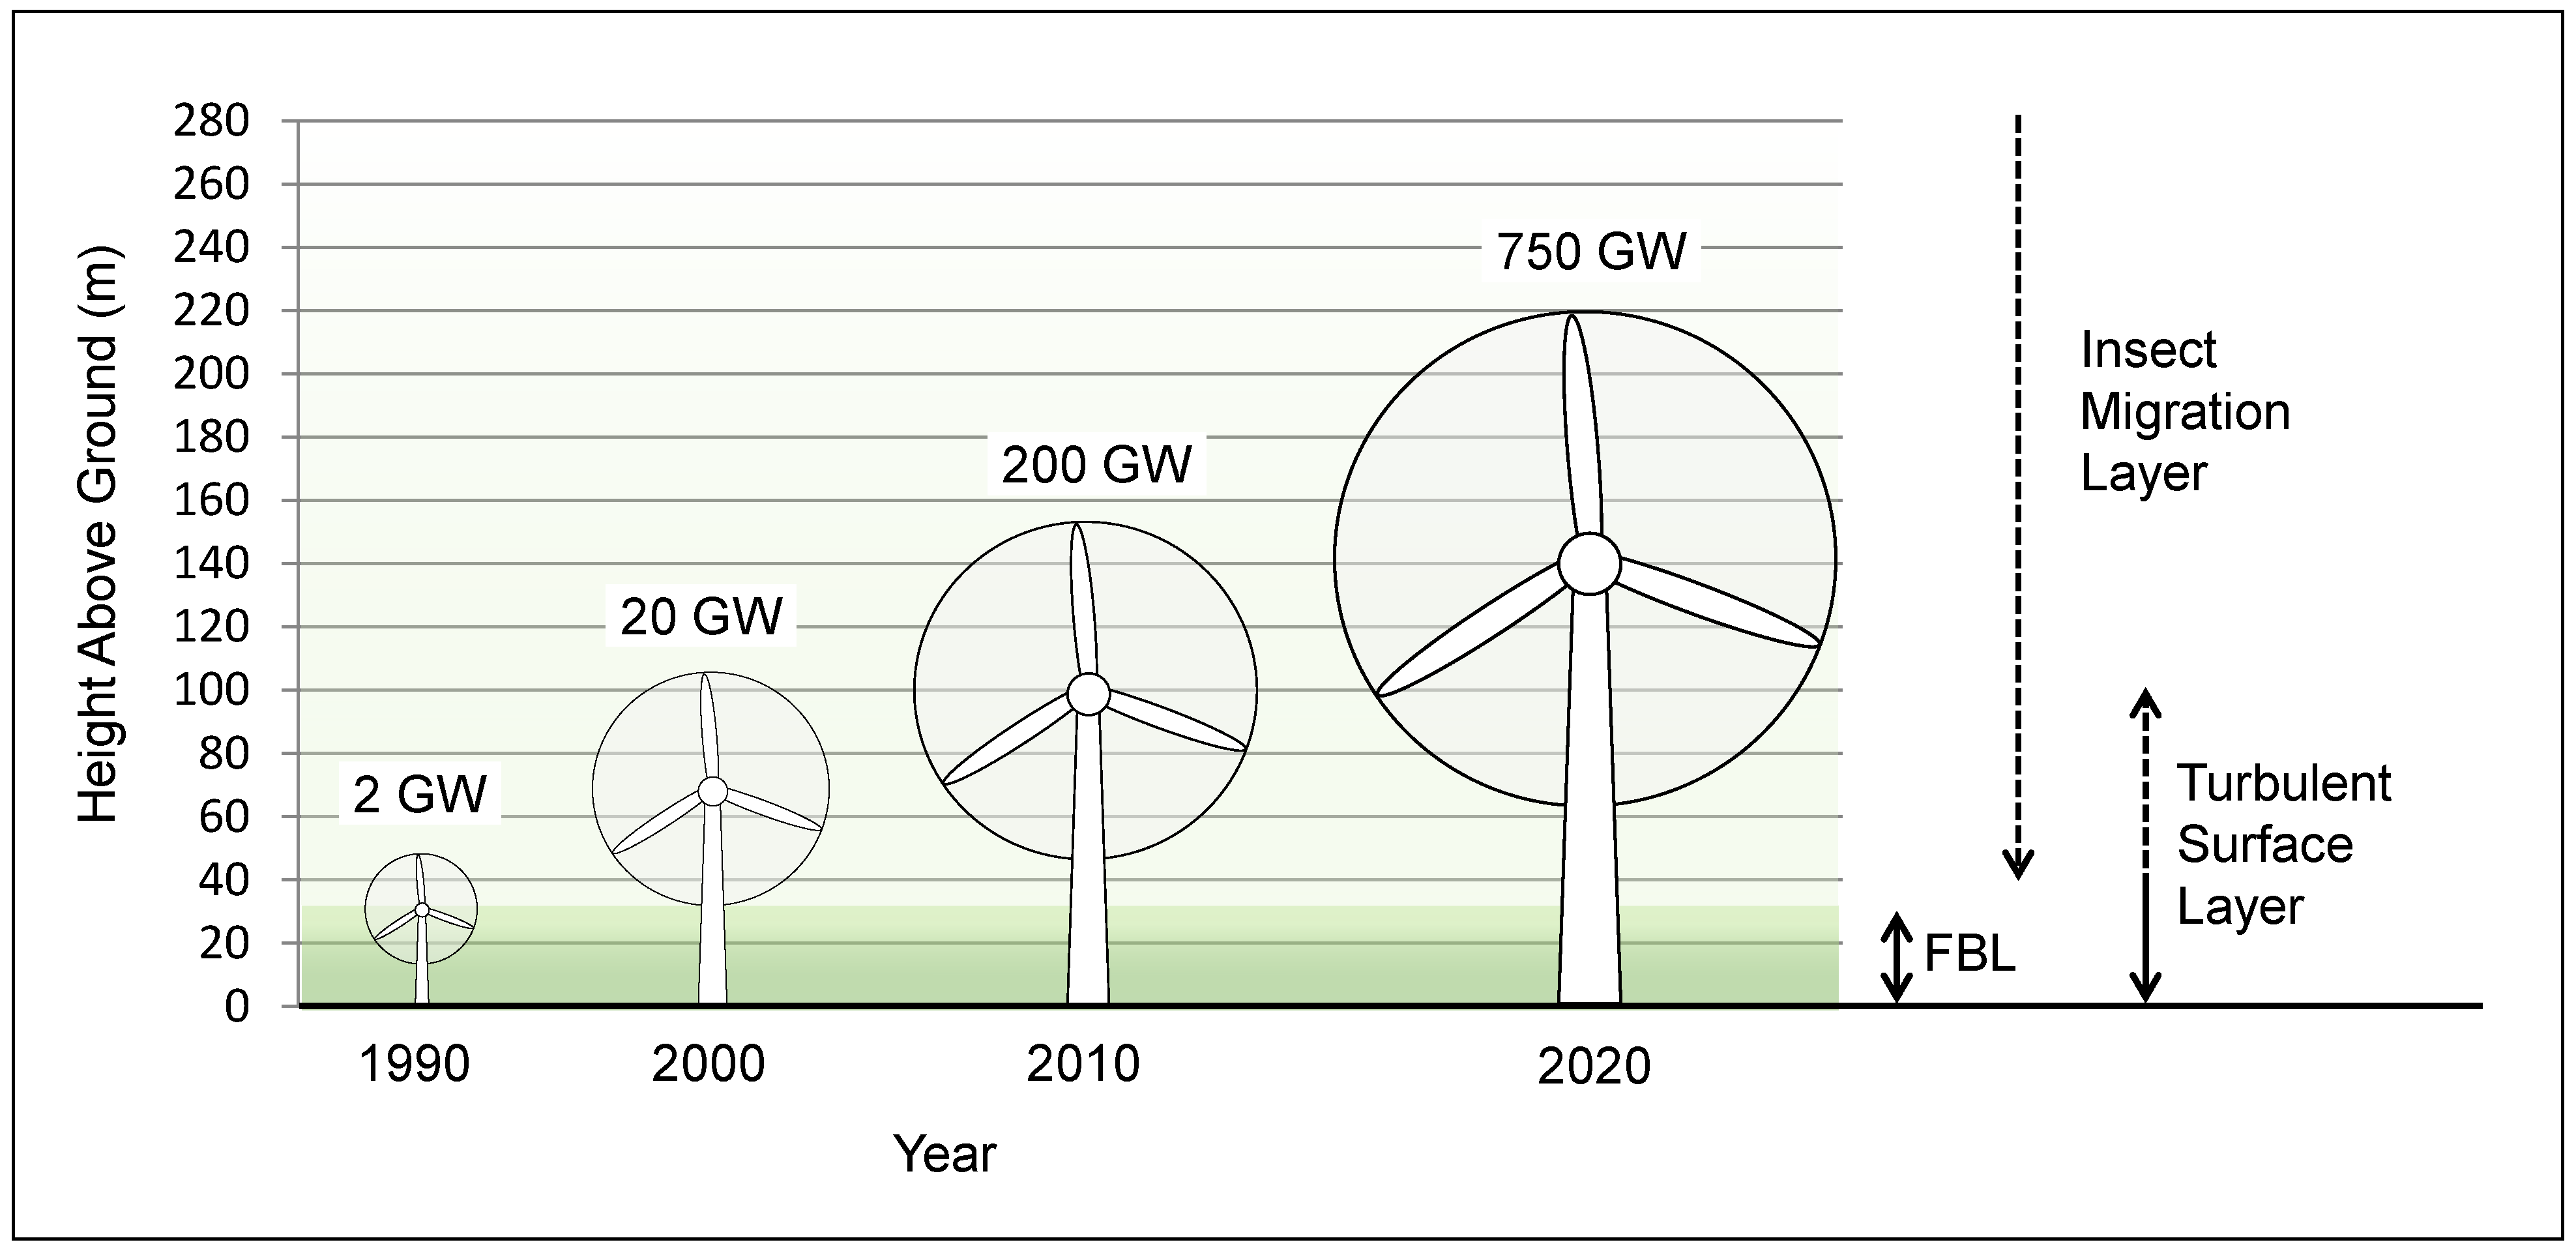
19]. A widespread axiom that insects are safe from wind turbine damage because the blades rotate above the FBL was proven incorrect by that analysis (
Figure 1).
When migrating insects reach maturity, and as soon as wind direction, wind speed, air temperature and season match with their intrinsic behavior patterns, they ascend above the turbulent surface layer of the atmosphere, which varies in height between 40 and 100 m above ground level [
20]. There, they find strong, directional, undisturbed winds that they can use as transport vehicle to get to their preferred mating, breeding and feeding grounds, which contradicts the general assumption that flying insects are intrinsically safe from being captured by modern wind rotors that stand higher than their presumed flight boundary layer. Furthermore, it is likely that for efficiency reasons, insects do not rise much higher than necessary to find strong winds. This is the same reasoning that has motivated wind power developers to place rotors just above the turbulent surface layer. It is unsurprising that migrating insects and wind rotors sooner or later meet at the same places. Damaged insects have been found within wind farms, and in-depth analysis of related impacts and countermeasures [
21].
Regardless of such findings, Ref. [
22] concluded that there is no significant interaction between flying insects and wind farms based on low numbers of insects caught at rotor height with a light trap placed on the top of a wind turbine during operation. In contrast, using a Scheimpflug LIDAR for insect swarm identification, another group of scientists registered significant insect activity at rotor height [
23]. Whether an illuminated insect trap or LIDAR is the indicated instrument for the detection of insect swarms at the operating wind speeds of wind turbines of 5 to 20 m per second is a subject for further discussion.
2.2. Correlation of Wind Farm Locations and Insect Migration Routes
A prominent example from the United States illustrates the obvious coincidence of migration routes of flying insects and wind farms. In spring, the monarch butterfly leaves its hibernation grounds in Florida, central Mexico and the coast of southern California and starts traveling north, making use of strong winds that help it to overcome large distances in a relatively short time. Insects dislike turbulence. They use strong, uniform winds for travelling but select calm areas for habitat (
Figure 2).
The first generation, after leaving its hibernation grounds in Mexico, starts breeding in spring in calm areas in the southeastern US, providing the basis for two more generations that later travel further north and breed during summer all over the northern US and the southern rim of Canada [
24,
27]. Finally, during only two months in fall, the fourth and last generation returns back to their original hibernation grounds. There is some evidence that the milkweed beetle also migrates within that region in a similar manner, possibly explaining related impacts on milkweed pollination. Both species have been reported to suffer massive losses [
28].
The US Wind Atlas developed by NREL (2021) and the US Wind Turbine Database by USGS (2019) provide highly detailed and high-resolution information about wind speeds and wind farms in the US, clearly showing a strong coincidence of migration routes and wind farms, even on a small-scale level [
25]. This leads to the easily verifiable hypothesis that many attractive sites for the development of wind farms are located along insect migration routes.
2.3. Modelling Insect Impingement in Wind Farms
The model set up in the frame of the FlyWiP study uses three parameters to quantify the number of insects jeopardized in Germany during the flying season from April to October [
5].
2.3.1. Insect Density in the Atmosphere
The first parameter is the average content of insects in a specific volume of air, which has been identified by field measurements between the years 1998 and 2004, quantifying average insect density up to several thousand meters above ground [
29]. The vertical average density distribution of insects in the atmosphere has been assessed in recent decades [
30,
31], showing an exponential reduction in density with height [
11,
12].
Considering those findings and the loss of 75% of the insect population in Germany since 1990 [
32], average insect density at rotor height in the FliWiP study model year 2017 has been estimated to amount to three average-sized insects within 1000 cubic meters of air or 3 kg of insect biomass per cubic kilometer of air [
5]. Using such average values is a rather conservative approach, as swarm events can result in up to 100 times higher densities [
16].
2.3.2. Air Volume Flow through Rotor Area
The second model parameter quantifies the volume flow through the 30,000 German wind rotors with a total of 56 GW capacity and a rotor area of 160 square kilometers in operation in 2017. The corresponding air flow through this rotor area of approximately 8 million cubic kilometers is calculated by multiplying the rotor area (160 km²), wind speed at nominal turbine capacity (50 km/h) and the equivalent full-load operating hours of wind turbines during the insect flying season in Germany (1000 h/a). This can be expressed using the equation V
rotor = A
rotor·v
nom·t
op, where V
rotor denotes the air volume flow through wind rotors during the insect flying season in km³/year, A
rotor is the total installed rotor area in km², v
nom is the nominal operating wind speed in km/h and t
op is the equivalent full-load operating hours during insect flying season in h/year. Multiplying the air flow and the insect density yields a total insect biomass of 24,000 tons or 24,000 billion average-sized insects flying through German wind rotors during operation in the model year (2017) [
5].
2.3.3. Impingement Rate of Insects Crossing Wind Rotors
Finally, the third model parameter quantifies the fraction of insects that is damaged and leaves residues at the blades when flying through a rotor. This model parameter has been assessed by wind power industry research for more than 30 years, recognizing that insect impacts and residues on rotor blades reduce the efficiency and life period of wind farms [
33,
34]. The simplified approach of the FlyWiP study yields a damage factor of 5%, which is plausible and conservative, considering that the ratio of solid blade area to circular (mostly empty) rotor area of most wind turbines is in the same order of magnitude. During operation, rotor blades move at speeds of about 40 km per hour near the rotor center and about 250 km/h at the tip, with little chance for any creature to survive an impact, but leaving a chance (in our model, 95%) to pass the rotor area undisturbed.
2.3.4. Estimating Annual Insect Damage in a Wind Park
Multiplying the three model parameters (air flow, insect density and damage factor) yields a first indication of potentially damaged insect biomass by the German wind park in the year 2017, which amounts to 1200 tons or 1200 billion average-sized insects (at 1 mg/cap) per year. This can be expressed as mdamage = Vrotor·δinsects ·ρdamage, where mdamage denotes the damaged insect biomass in kg/year, Vrotor is the air volume flow through wind rotors during the insect flying season in km³/year, δinsects is the average insect density at rotor height in kg/km³ and ρdamage is the average damage rate of insects flying through a rotor in operation in %.
Extrapolating those numbers to the global level, with 750 GW wind power capacity installed today (scaling factor: 750 GW/56 GW = 13.4), including countries with a year-round flying season (scaling factor: 12 months/6 months = 2) and higher insect density than in Germany (scaling factor: 1/(1–75% loss) = 4), the total global damage could amount to roughly 100 times this value, corresponding to a potential wind-power-induced loss of 120,000 tons of insect biomass or 120,000 billion individuals per year on the global scale. As insect impingement takes place during migration, shortly before the annual reproduction process of the insect population is finalized, it might eventually propagate to following generations, amplified by the number of potential descendants each damaged female insect. Despite such evidence, although a worldwide decline in insect biomass has been reported in many analyses, none has taken wind power into consideration as a possible cause [
35].
2.4. Intensive Research Effort for the Protection and Cleaning of Rotor Blades
Insect impingement is not a fiction; during the past 30 years, a considerable scientific and industrial effort has been dedicated to the development of rotor blade surfaces that resist erosion by airborne particles and the adherence of residues from such impacts. Erosion of the blade’s leading edge reduces the economic lifetime of a wind farm, and residues sticking to the blade surface reduce the efficiency of power generation [
36,
37]. Particles under assessment include ice, sand and flying insects. In order to understand the phenomenon and to identify mitigating measures, part of the literature is dedicated to the quantification of insect impacts. Such studies quantify the “insect collection efficiency” of airfoils and the “rupture velocity” of insects as a function of their size and of the airfoil design [
33,
34,
38].
Another major part of the technical literature on wind power design is dedicated to measures and developments for the protection of rotor blades against insect impingement. Blade surface structures and blade operation have subsequently been optimized in order to minimize insect erosion and fouling. Minimal effort has been made to avoid an impact, but considerable effort has been dedicated to the avoidance of its consequences, resulting in sturdier and antiadhesive blade surfaces [
39,
40,
41].
Finally, a third category of technical literature is dedicated to the cleaning of rotor blades in order to maintain high efficiency. The problem of insect impingement can be found in the advertising of cleaning companies and in the motivation of scientific papers on rotor blade cleaning [
42,
43,
44].
In response to the FlyWiP study, the German Wind Power Association [
45] claimed to be able to refute its key arguments and assumptions. Although we do not consider this claim to be justified, we do concede that the dimension of the effect of insect loss due to wind power, particularly when compared to other factors, is not yet well known. Therefore, we believe that international research should be started to quantify (and possibly avoid) such impact, which is also the central statement resulting from the FlyWiP study.
A key argument proposed in [
45] is that insect impingent damage on wind rotor blades is a phenomenon of the past. We believe that this line of argument is flawed. According to our interpretation, the reduced visibility of insect impingement on modern wind turbines can be explained by the technical developments of the blade surfaces mentioned above and by the massive loss of insects in the same time span. The parallel evolution of insect decline and wind power expansion alone certainly does not prove any causal correlation between the two phenomena. However, there seems to be sufficient evidence to justify investigation of possible coherence.
For example, assuming that the above calculated 1200 billion insects lost during one season in Germany would leave about 10% of their body weight as residue on the blades that make up approximately 5% of the total rotor area of 160 million square meters in the model year (2017), the residue per square meter of rotor blade would amount to a value of 15 g per year. This means that the tremendous growth of the German wind park in the past 30 years, together with the massive parallel loss of insects, has made insect impingement practically invisible. Tragically, the relative reduction in visible insect residues on rotor blades since 1990 has been interpreted erroneously as a generally and globally valid consequence of increasing turbine height, which was assumed to bring rotors outside of the range of the insect flight boundary layer, as predicted by early wind power developers [
46,
47]. Therefore, although no longer a serious problem for wind turbines, insect impingement might still represent a problem for migrating insect populations.
2.5. Measures to Avoid Insect Damage by Rotor Blades
What can be learned from insect migration discussed above gives hope that impacts of wind power on flying insects could eventually be reduced at least to a certain level. Insects migrate within a defined season and in a defined direction. The monarch migrates north from March until June and returns south in September and October, the rest of the year breeding or hibernating in relatively calm places that are probably distant from windy migration routes (and thus from most wind farms) and staying low within its flight boundary layer during most of that time. Increasing our understanding of insect migration and its correlation with wind power generation could answer open questions regarding the possible need to shut down wind farms due to swarm events. On the other hand, it would shed light to the question of whether such events must only be expected in a few critical months and only if the wind blows in the appropriate direction because otherwise, most insects would stay low within their flight boundary layer.
LIDAR can capture particles in the air approaching a wind farm and stop operation in case densities at rotor height become critical. LIDAR has been used for many years in to predict the wind speed approaching wind farms [
48,
49] and has recently also been applied to track insect swarms at rotor height [
23]. Hypothetically, wind turbines adapting to insect behavior and reacting to swarm events could reduce damage to insects without considerable losses in energy yield, in addition to improving efficiency and reducing maintenance cost by keeping the rotor blades clean.
2.6. Open Questions about Wind Parks and Flying Insects
Both insect migration and the expansion of wind farm capacity take place at a global level [
7,
11,
12,
13]. Strong evidence suggests that insect migration routes cross existing wind farm sites, and the height of insect migration over the ground coincides at least partially with the height of modern wind rotors [
21,
23,
24,
25,
30]. Prominent examples that are possibly affected include the painted lady butterfly travelling between central Africa and Europe [
17] and the monarch butterfly travelling between Mexico, the United States and Canada [
27]. Derived from prior assessment for Germany [
5], the worldwide loss of mature flying insects as a result of wind rotors just before finalizing their reproduction cycle has been estimated to amount to roughly 100,000 tons or 100 trillion individuals per year. This order of magnitude does not suggest negligibility, particularly considering that female insects typically deposit hundreds of eggs that are lost together with them, potentially failing to hedge the stability of the next generation.
Damage to wind turbines caused by flying insects has been reported since the beginnings of wind power industry [
33,
37,
41,
43,
47]. Since then, intensive efforts to avoid insect erosion and fouling of rotor blades have solved the problem of insect impingement for the wind industry but not for insects. At first glance, mitigation measures to protect insects from impingement seem feasible and affordable, and related losses of wind energy seem to be acceptable. We conclude that international energy policy and environmental protection standards should be adopted to understand and mitigate the impacts of wind power generation on flying insect populations.
There is a series of open questions related to insect impingement in wind farms:
What policies and technical measures are needed to start research on the interference of insect migration and wind power generation?
What policies and technical measures are needed to detect, quantify and mitigate insect losses in wind farms?
What policies and measures are needed to determine and implement proof of compatibility of wind farms and flying insects?
What political, technical and economic impact on wind power industry results from insect protection efforts?
3. Impact on Air Velocity, Temperature, Moisture and Precipitation
The fluid-dynamic effects of wind turbines on the flow field in the turbulent atmospheric boundary layer are, in principle, well known. Wind turbines extract kinetic energy from the atmospheric flow. The influence of individual rotors and wind farms on the flow field pertains both to the mean flow and the turbulent fluctuations. Wind farms increase the effective surface roughness of the ground and redistribute the mean flow. In particular, they create upward flow (so-called convergence zones) upstream and downward flow (so-called divergence zones) downstream of the wind farms [
50]. Moreover, the rotor blades create additional turbulent fluctuations that propagate downstream and intensify the turbulent kinetic energy per unit volume. The link between the fluid dynamical mechanisms and the potential social costs is summarized in
Table 1, which will serve as the guideline for the discussion presented in this section. Despite recent evidence [
51] that wind farms also affect subsurface flow in the sea, alter temperature and salinity distributions and have a potential impact on marine ecosystem processes, this aspect will not be covered in the present review.
On the length scales of individual wind farms, the temperature field behaves as a passive scalar, i.e., the temperature field is advected by the turbulent atmospheric flow. The modification of the flow field by the presence of a wind farm redistributes the temperature field as a result of vertical mixing. The modified temperature field also redistributes moisture and may affect precipitation.
Before providing an overview of the relevant literature, it is useful to illustrate the magnitude of the flow phenomena at hand using a simple back-of-the-envelope computation for the particular case of Germany. Based on the 56-gigawatt installed wind power in Germany, an estimated annual air flow of 8 × 10
6 km
3 through the German wind turbines and an estimated 1000 full-load hours, we can upscale the figures to obtain the global annual air flow through all wind turbines (please refer to
Section 2). Assuming a global installed wind power of 750 gigawatts and 2000 full-load hours globally, we obtain a throughput of 215 million cubic kilometers of air per year. Given that the land surface of the Earth is approximately 150 million square kilometers, the volume would occupy a surface layer with a height of 1.5 km.
For the following overview of the existing literature in the field, we divide the discussion into observations and simulations.
3.1. Observation Studies
Observations are far less numerous than simulations. The authors of ref. [
50] analyzed wind speed and precipitation upstream and downstream of two wind farms in the United Kingdom, namely the Walney wind farm for the period from 1995 to 2018 and the Crosby wind farm from 1997 to 2018. The authors also compared the data with a control site in Saint Bees, demonstrating that the wind speed drops by approximately 8 percent and precipitation drops by roughly 10 percent. However, this study did not analyze how such changes in wind speed would potentially affect adjacent wind farms or how they would modify agricultural yields. Roy and Traiteur [
52] studied temperature data in the vicinity of a wind farm in Texas and compared the findings with 306 simulations. They demonstrated that the wind farm has a warming effect on surface temperature during the night and a cooling effect during the day, mostly due to turbulent vertical mixing in the atmospheric boundary layer. They mentioned that “impacts are likely to affect agricultural practices” but did not attempt to quantify them. Zhou [
53] analyzed satellite data of wind farms from a moderate-resolution image spectrometer (MODIS) in west-central Texas between 2003 and 2011. A warming of up to 0.72 K per decade, particularly at night, was demonstrated. In our literature research, we have observed a conspicuous lack of experimental data outside Europe and North America. Specifically, we found no experimental data for South America, despite its attractive wind energy potential. Furthermore, we found no data for Africa, Asia or Australia. Referring to our discussion about desired future research needs in
Section 6, there is a dire need for observational data, both ground-based and from satellites, for these three continents.
3.2. Simulation Studies
The literature on simulation studies is more extensive than that on observations. Fiedler and Bukovsky [
54] found that “the presence of a mid-west wind farm, either giant or small, can have an enormous impact on the weather and the amount of precipitation for one season, which is consistent with the known sensitivity of long-term weather forecasts to initial conditions”. The simulations performed by Miller and Keith [
55] demonstrated, using numerical simulation, that covering the US electricity demand with wind energy would lead to a 0.24 K increase in US surface temperatures. Using a high-resolution regional climate model with implemented wind farm parameterizations, Akhtar et al. [
56] showed that the annual mean wind speed deficit within a wind farm can reach 2–2.5 m/s depending on the wind farm geometry.
Bichet et al. [
57] investigated wind stilling using an atmospheric global climate model and investigated changing roughness length, aerosol emissions, sea surface temperature and greenhouse gas concentrations in association with surface wind speed changes. The wind speed trends simulated by the model generally underestimate the observed trends (land and ocean) but confirmed the stilling effect. Huang et al. [
58] simulated the climate impact of wind farms in China under several deployment scenarios. They demonstrated that flow above relatively large-scale windfarms could induce regional warming with a maximum of more than 0.8 K in North China. In a simulation study by Keith et al. [
59], large-scale wind power was found to be capable of altering climate, with a temperature increase of less than 0.5 K. None of the studies referred to above investigated the social costs associated with these changes, which remain predominantly open questions.
3.3. Open Questions
In order to improve our understanding, we identified the following research questions:
- (1)
How does a redistribution of the velocity field, as reported by observations [
51] and simulations [
56], affect the economics of adjacent wind parks (deterioration of power output and increased OPEX costs). and what is the social cost of increased erosion?
- (2)
How does a redistribution of the temperature distribution, as reported by observations [
52,
53] and simulations [
55] affect the yield of agricultural activities in the vicinity of wind farms, and how does it affect animals?
- (3)
What are the social costs of a modified pattern of moisture and precipitation (e.g., [
52,
53]) expressed by change in the agricultural yield, behavior of animals and soil erosion?
- (4)
How can a combination of global (cf. [
57,
59]) and regional simulation (cf. [
54]) improve our understanding of regional climate under the influence of wind parks?
- (5)
How can multicriteria optimization with a similar methodology as that used in [
60,
61,
62] be applied to identify wind energy sites with maximum yield and minimum adverse effects?
In order to answer these questions, it is necessary to significantly extend the observational basis (for instance, [
50]) and to couple simulations of the thermal fluid dynamics with economic assessment models. Moreover, additional observations are necessary involving simultaneous measurements of wind speed, temperature, moisture and precipitation over long periods.
Before proceeding to the next section, it seems appropriate to briefly address the phenomenon of wind stilling. Terrestrial stilling (TS) denotes the decline in wind speed over land in recent decades [
63,
64]. Although the reasons for TS are not fully understood, it bears some resemblance to the phenomena reviewed here. In particular, the effects of TS, including the social costs associated with the influence on agricultural yields and soil erosion, are similar to the present topic.
4. Impact on Human Health through Sound and Infrasound
4.1. Noise Characteristics of Wind Turbines
Wind energy expansion, especially on land, has also been discussed in the context of potential health concerns for humans. Several items have been raised in that context, but the main problem relates to sound, especially low-frequency and infrasound exposure.
Wind turbine sound has several special characteristics. It can propagate relatively freely, as it is generated at higher altitudes than surrounding obstacles. Wind turbine sound includes low-frequency (20–200 Hz) and infrasound (below 20 Hz) waves, which have practically zero attenuation due to atmospheric absorption, whereas natural or built structures have a much lower impact on their propagation compared to waves at higher frequencies. At high distances, long-wave sound decreases almost exclusively according to geometric principles; if the distance doubles, the sound energy is distributed (and thus diluted) over four times the area. Accordingly, the noise level drops by six decibels (dB). Noise from wind turbines is not abated at night, as opposed to, e.g., traffic noise. The noise emission from wind turbines mainly depends on wind conditions (ignoring the effect of ice accumulation on rotor blades extensively discussed in [
65]. Under similar weather conditions, sound emission remains the same, regardless of the time of year. In addition, the sound originating from blade rotation is regularly variating/intermittent and typically described as distinctive swishing or thumping. Further detail can be found in [
66,
67].
4.2. Sound Emittance from Wind Turbines
Sound emittance from wind turbines is not easy to measure, especially at longer distances, as the measured noise levels are influenced/altered by environmental conditions and other sounds. However, some instructive data are available from an extensive government-commissioned project in Finland. One part relates to indoor sound measurements conducted near two wind turbine locations [
66]. The results were clear; the unweighted equivalent continuous sound pressure levels in houses near wind powerplants were about 20 dB higher than in previous long-term measurements in natural areas (distance to wind parks was about 1.5 km, but parks were considerable, with 17 wind turbines) [
66]. According to the equivalent continuous sound pressure levels, the most important frequencies were less than 1 Hz and frequencies below 2 Hz if the highest equivalent levels are considered, with values as high as LZ, max = 93 dB and LZ, max = 97 dB in the two locations, respectively [
66], for full detail.
The conscious hearing threshold for the infrasonic range starts at approximately 80 dB and extends to more than 100 dB for lower frequencies. However, the thresholds for potential health concerns are considerably lower [
68], with the Swedish EPA (Naturvårdsverket) noise level guidelines suggesting that equivalent (A-weighted) noise levels must not exceed 40 dB(A) in residences [
69]. Regarding the higher hearing thresholds, the measurements from Finland indicate that infrasound is strong enough to approach or even exceed even these thresholds.
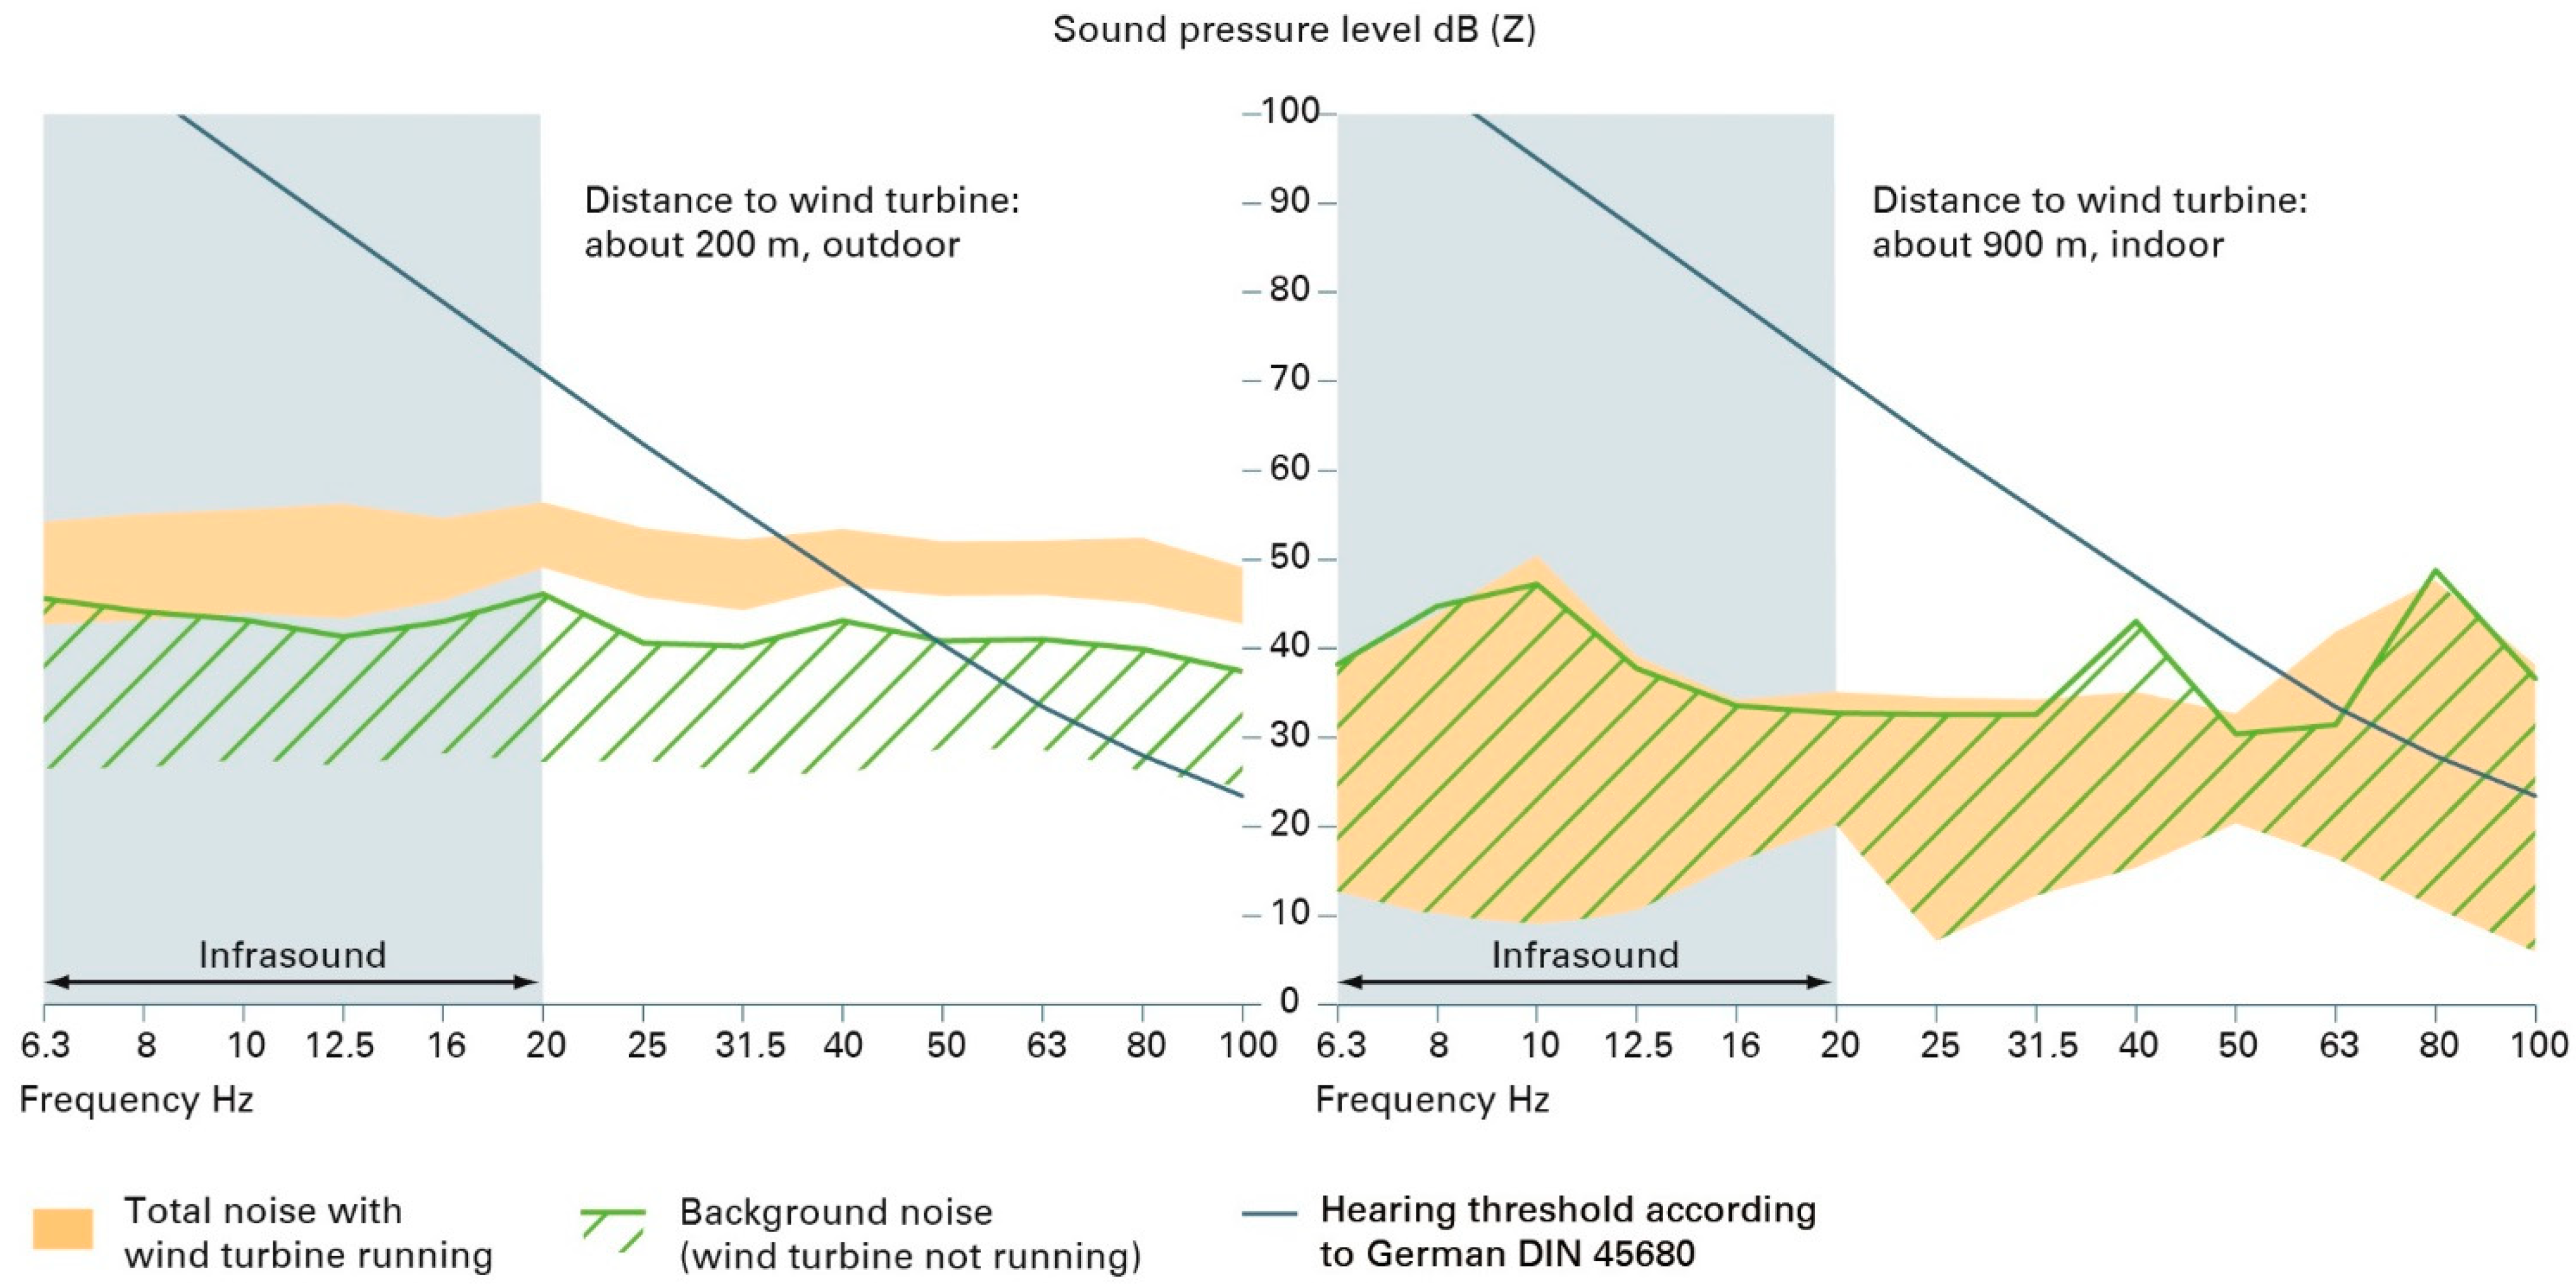
Measurements of governmental institutions in Bavaria, Germany, point in a similar direction [
70]. Although generally below the hearing detection threshold, low-frequency and infrasound noise from wind turbines was clearly detectable above the background level in measurements at 200 m distance from modern wind turbines (height of 140 m and 2300 or 2400 KW) [
70]. At a distance of 900 m, the difference relative to background is no longer clearly distinguishable. It should be noted that in relatively close proximity, the level of the lowest measured infrasound frequencies is well above 35 or 40 db, even exceeding 50 dB [
70]. This key result is reproduced in
Figure 3 [
70].
An independent report from Taiwan also contains data on low-frequency noise (LFN) level measurements both in houses and outdoors in the vicinity of wind turbines [
71]. The measurement revealed considerable levels of LFN. The average indoor LFN levels at nighttime in four of the seven monitored households were above 30 dB (LAeq) (measured houses were located at distances of 290–330 m from the nearest wind turbine) [
71]. The investigation revealed a clear influence on LFN of distance from turbines, building materials used, and types of windows installed and whether they are open or closed [
71].
4.3. Experimental Evidence on Potential Physiological and Psychological Effects
Potential physiological and psychological effects of low-frequency and infrasound exposure in humans have been measured in audio chambers and in outdoor experiments, e.g., [
66,
67]. The previously mentioned government-initiated investigation in Finland includes a full substudy on controlled infrasound exposure investigations (“provocation experiments”) with volunteers using an audio chamber, which was also published separately [
72].
In one experiment, annoyance related to various characteristics of wind turbine sound, i.e., presence of infrasound, level of amplitude modulation and recording site, were investigated. The presence of infrasound had no systematic effect on the rated annoyance; ratings were highly similar with and without infrasound. However, an effect of recording site and amplitude modulation (AM) was found; wind power plant stimuli were rated more annoying than yard stimuli, and maximum AM stimuli were rated more annoying than minimum AM stimuli [
72].
In addition to indirect measurements using audio chambers, direct measurements of impact on humans by actual operating wind turbines can be used. In a recently published field investigation from Taiwan, changes in heart rate variations (HRVS) of recruited subjects were measured while taking low-frequency noise (LFN) measurements at the same time at two designated sites with an intervention design [
71]. The results revealed a significant association between LFN exposure and changes in HRV, especially in with respect to the SDNN parameter (standard deviation of all normal to normal R-R intervals), indicating potential health impacts of exposure to LFN [
71].
4.4. Real-World Evidence of Potential Health Effects
Regarding the third dimension of real-world evidence documenting potential health effects, it is fair to say that the available data are extensive. With increased installations of wind turbines additional data are expected to become available in significant quantities. A summary can be found in [
68,
73,
74].
Regarding the prevalence of symptoms, the data recently gathered in Germany and Finland point in a clear direction. The prevalence of reported symptoms seems high, as shown, for example, the data from Finland.
In the Finish VNTEAS study, a survey sampling strategy was established to enable inhabitant participation in areas previously identified as appearing to be the most problematic in terms of symptoms intuitively associated with wind turbine infrasound [
66]. A self-administered questionnaire was mailed to all persons in the sample (
n = 4847) in April 2019, and a reminder was sent to non-respondents (
n = 3986) in June 2019. After the first mailing, the response rate was 18%, and the final response rate was 28% (
n = 1351). A total of 5% of all respondents (70 individuals) reported symptoms that they intuitively associated with wind turbine infrasound (termed “symptomatic respondents” in the report). In the closest-distance zone, the prevalence was 15% (34 individuals). Of the symptomatic respondents, 49% (34 individuals) reported ear symptoms (for example, pressure sensations in the ear or tinnitus); 45% (32 individuals) reported sleep disturbance; 26% (18 individuals) reported cardiac symptoms (for example, arrhythmia); 24% (17 individuals) reported headache; 21% (15 individuals) reported dizziness; 13% (9 individuals) reported anxiety; 9% (6 individuals) reported fatigue, high blood pressure or joint and other aches; and 7% (5 individuals) reported nausea or difficulties in concentrating (data not shown here) [
66]. Similar results were reported in a survey data collected in Germany [
67].
Even conceding that the exact mechanisms and dose–effect correlations are not fully worked out and considering the rather low-barrier setting in the surveys, it still seems farfetched to ascribe all such reports to a nocebo effect, as in a 2014 hypotheses paper by Crichton et al. [
75].
Taking all existing data together, a pattern seems to emerge—a comprehensive review scrutinizing the literature on health effects of wind turbines commissioned by the Swiss Federal Office for the Environment published by Schmidt and Klokker in 2014 puts it as follows [
68]:
“At present it seems reasonable to conclude that noise from wind turbines increases the risk of annoyance and disturbed sleep in exposed subjects in a dose-response relationship. There seems to be a tolerable limit of around LAeq of 35 dB”. Still, the uncertainty regarding the exact conclusions to be drawn is palpable: “These conclusions are, however, affected by a potential risk for selection and information bias even in the larger cross-sectional studies providing the current best evidence”.
In a recent “update” of an effort commissioned by the Government of the Netherland published at the end of August 2021, one key summary paragraph reinforces the point, while also adding a caveat: “This leads to the conclusion that low-frequency sound is part of the total sound of wind turbines and has the same effects normal sound has; it can be annoying and may have effects on (getting to) sleep and, if chronic, this may lead to further health effects” [
74].
4.5. Open Questions and a Potential Way Forward
Regarding the question of potential health concerns for humans and wind power installations, especially in view of sound and infrasound, the main question does not seem to be “if”—the effect is real. Sound and infrasound emittance of wind turbines and wind parks are phenomena resulting in health concerns. The key question is: what is the best regulatory way forward?
In 2014, Schmidt and Klokker concluded that “It (…) seems reasonable to conclude that a cautious approach is needed when planning future wind farms. Furthermore, there is an indication that noise annoyance and sleep disturbance are related and that disturbed sleep potentially can lead to adverse health effects” [
68].
The question of what kind of regulatory frame and standards are appropriate is not fully solved at the moment, and the answer will likely differ slightly in every major affected country worldwide. However, a similar challenge is likely faced across the continents: the setting of robust and pragmatic frames seems to be necessary in order to enable further acceptable major expansion of wind energy utilities. The regulatory frame should relate not only to distance to inhabited space but also to the design and features of the actual turbines, as well as, potentially, the hours of operations. Noise thresholds are an obvious key item. Simply arguing that wind turbines emit infrasound below the hearing threshold seems too simplistic; the much lower threshold of 40 dB set by the Swedish EPA seems more appropriate. However, more detailed measurements might be of value.
The social costs of increased health issues in regions heavily affected by the expansion of wind power generation are another important area for future research. This seems somewhat under-researched at the moment.
An interesting proposal emerged out of the work of the Australian Government’s Independent Scientific Committee on Wind Turbines, which was tasked with optimizing the approach to determining the minimum distance from wind turbines from noise-sensitive receivers and their management [
6]. In a summary published in June 2020, the Committee suggested that ‘annoyance’ should be the primary measure according to which to set wind turbine noise limits. In their view, the appropriate limit is one that ensures that no more than 10% of the population would be highly annoyed when exposed to it. This threshold appears to be between 34–40 dB LAeq (10 min) outside residences, with a mean value of 37 dB LAeq (10 min) [
6]. If this innovative approach were implemented, which seems desirable, accompanying research is warranted.
Further research is warranted to detail and advance the following key items:
Definition and refinement of health concern infrasound noise level thresholds to generate data-based rules concerning distances between wind parks and residencies;
Social costs of health-related issues in regions heavily affected by wind parks; and
Reality testing of the innovative Australian proposal to set regulatory frames based on a target to stay below a “highly annoyed residents” threshold.
5. Discussion and Relation to Existing Development and Site Selection Criteria
Side effects of wind energy should be part of the development and site selection criteria. There is already a substantial body of literature on this topic with respect to, e.g., site selection criteria case studies for offshore wind parks [
62], as well as onshore projects [
60]. The authors systematically searched and reviewed the literature to create a taxonomic review of this topic [
61].
Not surprisingly, the site effects described in
Section 4 (potential health impacts) are already somewhat covered in the site selection criteria both directly (e.g., distance to cites) and indirectly, e.g., distance to power lines and other infrastructure related to human settlements.
The impact on flora and fauna is also currently part of site selection criteria discussions, with birds and marine species explicitly mentioned; however, the potential impact on migrating insects does not seem to be a consideration at present. None of three exhaustive references mentioned above even contains the word “insects”.
Thirdly, whereas climate factors influencing the performance and output and thus the economic evaluation of the envisaged wind parks are extensively discussed in site selection criteria, the question of potential impact of wind parks on local weather and climate does not seem to be considered. This might not be so surprising, as the general direction likely needs to be set by a political framework, as the concern extends beyond individual wind parks and could be achieved by, e.g., capping the density of wind farming in certain regions, as suggested in [
58]. A change in the political–regulatory frame would directly influence site selection criteria. For example, Gil-Garcia lists a full set of “Political Category” criteria in Table 6 of their systematic review [
61].
6. Summary and Policy Implications
The work at hand constitutes a review of three undesired side effects of wind power generation that could represent a potential risk for wildlife, the local environment and human health but have not been adequately addressed to date.
As a consequence of energy policy not demanding satisfying proof of the compatibility of wind power with respect to these three side effects to date, the order of magnitude and the possible importance of their impact remain unknown, and it may take a long time before possible and perhaps necessary measures for mitigation are realized.
The literature confirms the concurrence of insect migration and rotor blades in terms of both height over the ground and in geographic distribution, resulting from the motivation of both insects and wind power developers to use strong winds for their purposes. Damage to insects crossing rotors is an irrefutable fact, and its order of magnitude is conservatively estimated to amount to an annual loss of about 100,000 tons or 100 trillion individuals per year. The related open question is whether this simplistically estimated amount is per se negligible and whether it justifies further investigation and related policy incentives to protect declining species.
Recent theoretical work has opened several questions regarding the effects of wind farms on local weather patterns and soil structure, providing evidence of changes in average air speed, temperature, moisture and precipitation, which might affect wildlife and agriculture.
Finally, the sonic and subsonic noise emitted by wind turbines during operation has considerable potential to annoy people and possibly wildlife constrained to live in their vicinity, particularly if measurable health effects appear over the years.
Given that the annual volume flow through today’s global wind park equals an air column of 1.5 km above the total land surface of the planet and in view of the size and speed of rotor blades implemented in the living environment of many species, including humans, we believe that additional attention should be paid to the three unwanted effects and possible mitigation measures discussed in the paper at hand. Furthermore, the related open questions should be answered in due time.
Once these questions have been answered, a comprehensive methodology remains to be developed along the lines of those outlined [
60,
61,
76] based on multicriteria optimization in order to base location decisions for future wind farms on maximum energetic efficiency and the fewest possible side effects.


