Abstract
Urban and residential roads play an integral role in the infrastructure system of a city. Although they take up a large proportion of the national road network, maintenance plans for urban roads are beset by many problems. These include difficulty in collecting enormous volumes of data, implementing analyses, and interpreting results because of complicated frameworks. Thus, this study aims to introduce an effective and reliable method of formulating a maintenance plan using integrated criteria of spatial autocorrelation analysis and roadside conditions. The results demonstrate that defective pavements are clustered in certain areas, for example, mountainous and forested areas, which indicate environmental effects. Using a mixed index as a criterion for prioritization, approximately 55% of roadside residents (represented by the total residential housing floor area) and 90% of commercial and medical facilities surrounding critical sections gained benefit from maintenance activities in the second year. Importantly, the proposed method presents the advantages of simplifying implications and quantitative outcomes that could support local agents in not only implementing but also making decisions and interpreting such decisions for the community.
1. Introduction
1.1. Background
An urban road network is one of the vital components of an infrastructure system that needs to be maintained properly. With the rapid progress of urbanization, urban streets and low-traffic roads have developed widely and account for approximately 80% of a nation’s road system [1,2,3]. Also known as the backbone of any city, the deterioration of the urban road network may significantly affect the local community in areas such as traffic safety, driving comfort, and economic activities. Thus, preventing the downgrade of urban roads is one of the major concerns of local administrations.
To maintain urban road networks in good condition, researchers and agents have developed methodologies and practices to respond to this demand. For example, Torres-Machi et al. [4] introduced a framework to formulate urban network maintenance plans. He et al. [5] applied MicroPAVER version 5, a pavement management software developed by the U.S. Army Corps of Engineers, Washington, DC, USA, for Madison city, with 53 mi of street. Likewise, Cottrell et al. [6] performed transportation infrastructure management in a small suburb of Salt Lake City. The authors found that pavement preservation accounted for approximately 75% of the budget. Another study [7] implemented a pavement management plan for the town of Christiansburg using the framework introduced by Shahin [8]. In this study, the authors inspected and analyzed approximately 22% of the residential roads (equivalent to 20.7 mi). The study declared that implementing a pavement management system (PMS) significantly supports a road agent in selecting the optimal maintenance plan.
Remarkably, to our knowledge, there is no complete maintenance plan for an entire city. This lack of studies and practices constitutes a substantial challenge for the research community and road administrations that need to pay attention to such issues. Moreover, this problem leads to the question of why this issue emerges and how to address it.
1.2. Previous Studies on Current Problem
Regarding the abovementioned issue, the present study argues that the approaches used for data collection and assessments are the major causes. For the first term, data collection involves road condition inspections, which typically use automated vehicles [9]. These vehicles are equipped with high-technology devices, such as 3D laser scanners, accelerometers, and light detection and ranging. Although this method is highly accurate, its costly implementation may hinder local agents from deploying these devices across an urban network. An alternative approach is to apply an imaging process with the support of deep learning (DL) and artificial intelligence (AI). These techniques enable agents to survey an entire network quickly and economically using simple devices, such as commercial cameras or smartphones [10,11,12,13]. This alternative opens a promising approach for collecting data. However, its application has not been tested in or applied to a PMS project [9].
Regarding the assessment approach, a typical method is the multi-objective optimization process characterized by a multi-criterion nature at the network level [14,15,16]. In addition, researchers have also favored using the analytic hierarchy process (AHP) [17,18,19], genetic algorithms [1,2,20,21], or particle swarm optimization [22,23]. As these methods are advanced techniques, they provide reliable results and optimal solutions. However, they present disadvantages in computation cost and complexity in implementation. These disadvantages would prevent the agent from explaining decisions to residents, who are the main users. Thus, a new, simple, effective, and interpretable method is necessary.
Another aspect that requires scholarly attention regarding PMS formulation is the lack of spatial analysis. As road networks spread in large areas, damaged surfaces may occur in clusters due to differences in construction time, standards, geological conditions, etc. A high density of defective pavements indicates degradation in sub-networks. In this case, agents should implement maintenance activities in these areas to improve the local environment. Thus, examining patterns of damaged pavements in the formulation of a PMS is necessary.
Nonetheless, the spatial element has only been considered in managing network information in geographic information systems (GIS). For instance, Zhang et al. [24] applied a GIS in managing urban roadways and infrastructure in Austin, Texas. Likewise, Pantha et al. [25] adopted a GIS-based maintenance model given pavement and roadside slope stability conditions. Montoya-Alcaraz et al. [26] applied a GIS as a supporting tool to extract and visualize road network information in a maintenance plan. Recently, Nautiyal and Sharma [27] developed a tool for integrating a GIS with a prioritization process for low-volume rural roads. As denoted by relevant studies, a GIS is a helpful tool that supports data storage, road condition analysis, and result visualization. However, the spatial distribution of pavement distress remains unclear.
Last but not least, recent studies have mostly overlooked social-political criteria, a substantial aspect of prioritizing and evaluating a maintenance plan. The popular benchmarks used for prioritization are technical, economic, and environmental. For example, in terms of technical and monetary indexes, the pavement condition index (PCI), maintenance time, and cost of agents and users, among others, were used as the criteria for prioritization [28,29]. Similarly, Sandamal et al. [30] adopted the safety index to determine optimal maintenance plans for low-traffic roads. In terms of environmental aspects, various studies have integrated energy consumption, greenhouse gas emissions, or carbon footprint reduction as constraints in optimizing a maintenance strategy [31,32,33,34,35]. Meanwhile, social-political factors appeared in a few studies.
The current study pinpointed several articles that integrated social-political aspects into a PMS. For instance, Cafiso et al. [36] claimed that maintenance decisions should include social factors, not just economic and environmental effects. Specifically, these factors involve, but are not limited to, access to education and healthcare institutions, safety for drivers and roadside residents, improvement in the living environment, and the promotion of economic activities. Unfortunately, the authors did not integrate all these factors into a pilot experiment for analysis. Later, Zhang and Mohsen [37] introduced a list of rating indexes that utilize several social–political indicators of pavement maintenance. This approach, however, was seemingly complicated. Alternatively, Li et al. [38] used building information as a supplemental indicator to predict the pavement damage level in Beijing. Sayadinia and Beheshtinia [19] integrated the social importance of roads as one of the major criteria in ranking urban roads for maintenance. However, the primary outcome of the study was the level of importance of each criterion. Along with problems stated above, these research gaps have led to an issue that warrants further investigation.
1.3. Research Objectives
Japan is known as a developed and motorized country. In 2015, the motorization rate of Japan was higher than the average rate for European countries or the United States [39]. For this demand, Japan has constructed an extensive road system. As of March 2019, the network was composed of approximately 1.2 million km of roads [40], of which 85% were residential roads managed by local municipalities. Nonetheless, a contradiction exists in which the budget for urban road construction is much higher than that for maintenance. As the Ministry of Land, Transport, and Tourism [40] reported, from 1956 to 2018, the total money allocated to maintenance was approximately 9% of the construction budget. In addition, most urban roads are over 20 years old and require preservation or rehabilitation. Thus, making an optimal maintenance plan is more urgent than ever.
Starting from the abovementioned gaps, this study aims to introduce a new method of establishing an effective maintenance plan for an entire city network. We will integrate the damaged pavement spatial distribution and social indexes into the analysis process. In addition, the proposed approach would be easy to implement and interpret. Specifically, we intend to address the following research questions:
- (1)
- Do damaged pavements cluster in certain areas?
- (2)
- What is the process for establishing a network pavement maintenance plan for an entire city, considering the effect of the roadside environment?
- (3)
- How does a pavement maintenance plan effectively contribute to the local environment and community?
To achieve these objectives, this study takes the case of Muroran, a small urban area characterized by an aging road network and a shortage of resources. The findings could contribute to the theory of infrastructure maintenance management by introducing a novel approach to making and assessing a maintenance plan. In addition, the successful application of applying pavement inspection data to the entire urban area based on information and communication technology (ICT) could be a helpful practice for other cities to emulate.
The remainder of the paper is organized as follows. Section 2 outlines the data collection and analysis methods. In Section 3, we describe the results in relation to the research questions. Section 4 highlights the main findings. Finally, Section 5 presents the limitations and conclusions and provides suggestions for pavement management and prospective studies.
2. Materials and Methods
2.1. Target City
Muroran is located in Hokkaido Prefecture, the largest northern island in Japan. Figure 1 shows that the area is within a snowy and cold region [41]. Extreme weather causes substantial damage to the pavement on a large scale. In particular, repeated freezing and thawing of snow results in the degradation of bearing capacity and the rapid growth of fatigue cracks [42,43].
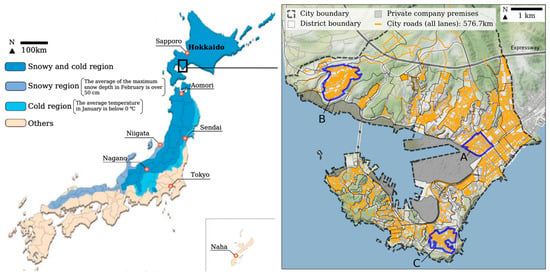
Figure 1.
Regional classification in Japan (left side) [41] and location of Muroran (right side).
Currently, the city manages 576.7 km of all-lane road, with a high proportion of damaged sections [44]. Meanwhile, pavement repair work in this city is decided based on maintenance patrols and complaints from residents. These localized and subjective inspections lead to difficulty in performing pavement management in an objective and effective manner. Moreover, Muroran’s population dropped by about 50% within the 50 years from 1970 to the present [45]. Such depopulation leads to a lack of resources for maintaining the infrastructure system, including the road network. As a result, the city is now struggling to formulate an appropriate road pavement maintenance plan.
Regarding geography, the city has an area of 80.65 km2, which covers 98 administrative districts. This study analyzed all the roads, excluding port and industry premises. The number of surveyed areas was 89. In addition, we visualized the results for three zones: Nakajima-Cho (city center; District A); Hakuchodai-Cho (a large and modern residential area; District B); and Bokoi-Cho (an old residential area; District C), to reveal the relationship between outcomes and urban structure. Of these three districts, Districts B and C are located in the highland, while District A is located in the lowland and flat areas.
2.2. Data
2.2.1. Pavement Survey Data
In a PMS, the quality and quantity of the data on pavement conditions play key roles. These factors depend mainly on the used condition indexes and collecting method. The popular indexes measuring the severity of pavement damage are the pavement condition index (PCI, developed by the United States Army Corps of Engineers in 1987) and the international roughness index (IRI, introduced by the World Bank in 1986). Although these indexes are the best pavement condition indicators, related data are difficult to collect at the network level because of time and device costs. Hence, the PCI and IRI are more likely suitable for high-grade roads, such as expressways or airport runways.
An alternative pavement condition index for urban roads is cracking. As described in the standard of the American Society for Testing and Materials (ASTM) [46], 9 of the 19 forms of distress in the PCI are associated with cracking, such as alligator, block, edge, and joint reflection cracking. In addition, the traffic volume and vehicle load on urban roads are lower than on highways and expressways. Cracks commonly appear on urban pavements instead of potholes, bending, or roughness [5,7]. Thus, several studies have considered cracks as indicators of pavement durability, driving safety, and comfort [47,48]. In Japan, based on the pavement inspection guidelines of the Japan Road Association [49], local administrators can decide on which investigation criteria to use. Therefore, most Japanese cities evaluate pavement condition using cracks [50].
For Muroran, this study collected pavement condition data from June to November 2018 using an AI-aided cracking detection method developed by Asada et al. [51]. As described by the author in [51], an attached camera (GoPro HERO5 produced by GoPro, Inc., San Mateo, CA, USA) on a moving vehicle records videos of the road surface and extracts each 5 m segment based on the location information (Figure 2). Then, the AI program (the U-net network architecture [52]) detects cracks in extracted images. Finally, the process calculates the crack ratio (CR) value for each segment, a conventional pavement damage index in Japan [53].

Figure 2.
Crack ratio measurement using the U-net model [51]. (a)—Crack ratio equation; (b)—Coefficient of determinant between hand sketch and U-net method.
Figure 2 illustrates the process for determining the CR by following the Handbook of Pavement Survey and Test Methods published by the Japan Road Association [54]. In this figure, M1 and M2 account for the number of meshes with one and more than one crack, respectively (Figure 2a). Likewise, MA denotes the total number of meshes in the measured area. A correlation coefficient value of 0.84 verifies the accuracy of the applied method using the hand sketch method (Figure 2b). By measuring every 5 m segment of each lane, the total length of the surveyed road was found to be 557.7 km (111,540 units), which accounted for approximately 96.7% of the entire network. The remaining segments (3.3%) were coarse pavement or under construction.
2.2.2. Building Location Data
Regarding building data, the present study used the latest Urban Planning Basic Survey Data for Muroran, an official and fundamental database for planning and construction work in Japan, updated in 2018. Specifically, we focused on three building types: residential housing, commercial buildings, and medical facilities. These buildings represent road users, economic activities, and public healthcare facilities, respectively, which are the primary objectives of road service.
Figure 3 depicts the locations of buildings in Muroran by type and floor area. As described in this figure, housing, commercial, and medical facilities accounted for approximately 93.9%, 5.5%, and 0.6% of building types, respectively. Of the three districts, Districts B and C have a higher residential housing density than District A. District A, however, exhibits a bigger housing size and a higher number of commercial and medical facilities than District B and C. These descriptions reflect the complex function of District A.

Figure 3.
Location of buildings and total floor space in Muroran. (a)—Building location by type; (b)—Building total floor area.
2.3. Spatial Analyses of Cracking Pavements
To address the first research question, we propose to apply spatial autocorrelation analysis, including global Moran’s I and local Moran’s I or local indicators of spatial association (LISA). Global Moran’s I (introduced by Moran [55]) determines the level of correlation among neighboring objects in space [56,57]. Equation (1) exhibits the calculation of a global Moran’s I value (Ix) [58].
where n denotes the total number of objects in an area; and are the CR values of segments I and j, respectively; stands for the average CR of all segments; and lastly, refers to the spatial weight matrix and is defined by Equation (2). Note that features in this analysis are represented by midpoints of segments. Using these terms, we defined the condition as a distance shorter than 100 m from a calculated object, which equals the standard size of a unit block in Japan.
Equation (1) returns a range of Ix values from −1 to 1. When Ix has a value of −1, the CR is dispersed perfectly. Meanwhile, a value of +1 indicates a perfectly clustered CR, and a value of 0 implies that the CR is dispersed randomly.
Equations (3) and (4) express the calculation of the local Moran’s I index (Ii) Using the same annotation from Equation (1).
Using Ii values, we classified each segment into one of four groups. A positive Ii value refers to high–high (HH) and low–low (LL) clusters. They denote a similar level of damage at neighboring locations. By contrast, a negative Ii value suggests low–high (LH) and high–low (HL) clusters, which present levels of divergent damage at neighboring locations. In this study, we focused on the HH clusters, which have a high density of damaged segments. Moreover, we excluded areas with few roads (less than 500 m) to remove noise from the analyses. The final number of districts was 75.
2.4. Assessment of Network Level Pavement Maintenance Plans
This section introduces a novel approach that helps create and evaluate a road network maintenance plan. The content includes (1) roadside pavement condition indexes, (2) determining repair target sections, and (3) prioritizing and assessment for maintaining sections.
2.4.1. Roadside Pavement Condition Indexes
Regarding roadside pavement conditions, we present six indexes, considering their association with the neighboring environment. These indexes are the spatial lag of the CR (SCR), total residential housing floor area (TFSH), total commercial facility floor area (TFSC), total medical facility floor area (TFSM), total floor area of the three types of buildings (TFSA), and the mixed index. Generally, the value of these indexes is equal to their mean value within 100 m of the pavement segment, except for the last index.
- SCR
Because the SCR represents the average value of the CRs of neighboring segments within 100 m of the calculated location, a high value of SCR reflects the damaged pavement concentrated in certain areas. Repairing these segments would improve specific roads and surrounding areas. Therefore, a section with high SCR values indicates a high priority for maintenance.
- TFSH
Residential housing is a proxy for the population; thus, a high housing density would indicate numerous road users in an area. Several studies use this index to assess the benefits that can be gained by roadside residents when the pavement is repaired [59,60]. This study used the TFSH as an indicator of benefits for residents.
- TFSC
Commercial facilities are places for business and social activities. They also serve as public spaces that attract citizens from inside and outside the city to visit. Hence, maintaining the esthetics and road conditions would enhance the city’s economy [61]. Consequently, the TFSC would be one of the essential prioritization indicators for pavement repair.
- TFSM
Recently, the number of medical facility users is increasing with the aging society in Japan. Vibration due to damaged pavements may decrease driving safety and cause danger to residents. For this reason, the quality of medical services could be affected [38,62]. Thus, the TFSM should be a critical index for the road maintenance plan.
- TFSA
The TFSA denotes the combination of the TFSH, TFSC, and TFSM and includes three types of buildings in its value.
- Mixed index
Using the single roadside condition index to extract sections that require repair may lead to an imbalance in expected benefits. For example, the TFSH may promote the benefits of roadside residents but compromise comfort and safety in commercial areas. Intuitively, a multi-objective optimization method is a possible solution [14,15,16]. Such methods, however, typically incur high computation costs, especially with an enormous volume of data at the network level. In addition, interpreting and explaining the outputs of these processes is difficult because of their complexity. Thus, the current study proposes a mixed index that integrates the TFSA and SCR, as defined in Equation (4). We expected this index would satisfy social–political and technical requirements in a maintenance plan. Note that we normalized the proposed index values to range from 0 to 1 because the units of the TFSA and SCR are different.
2.4.2. Determining Repair Target Sections
The primary task in a maintenance plan is to identify repair target sections. A typical index used in this task is the defective rate, the proportion of defective segments in a road section [63,64]. Afterward, the administration uses the rate threshold to classify target units. The prioritization process is then implemented in these sections to build the maintenance plan for each year. However, there is no regulation or instruction on this threshold value. The administrations may set it arbitrarily. Therefore, the present study used the presence of critical segments as a criterion to select repaired target sections instead. We defined a critical segment as an HH pavement with a CR value of over 40% (Figure 4). Then, a pavement would be a target when it has at least one critical segment.
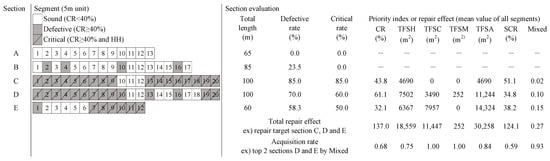
Figure 4.
Illustration of the identification and prioritization processes of repair target sections.
As shown in Figure 4, we first divided each route into 100 m sections, a typical smallest unit for maintaining [8,46]. We then split these sections into 5 m segments to fit the applied survey method. Second, we assigned each segment a label: sound (CR < 40%), defective (CR ≥ 40%), or critical (CR ≥ 40% and HH). The threshold of 40% follows the instruction of the Japan Road Association [54]. Following the definition above, Sections C, D, and E are target sections.
2.4.3. Prioritizing Repair Target Sections and Maintaining Plan Assessment
The process of prioritizing repair target sections is as follows. First, we calculated the mean value of the roadside condition indexes for each repair target section. Second, we prioritized these sections following the top-down rule using these indexes’ values. For example, as Figure 4 expresses, when using the CR, TFSH, or Mixed index as the prioritization indicator, the set of the order of repair is (D–C–E), (D–E–C), or (E–D–C), respectively.
Regarding the third research question, we introduced the repair effect ratio as the benchmark score to assess the maintenance plan. This score is the ratio of the sum of the repair effect indexes of the selected sections divided by the total repair effect index of all repair target sections. For example, Figure 4 exhibits the repair effect ratio or acquisition rate when selecting Sections D and E for repair (last row).
3. Results
3.1. Pavement Condition and Autocorrelation Analyses
3.1.1. Current Pavement Condition
Figure 5 exhibits the CR index distribution with three grades of pavement condition [54]. Of the 557.7 km of surveyed road, the sound segments (CR < 20%) comprised 378.4 km, which accounted for 67.9% of the total. Likewise, nearly impaired segments (CR of 20% to less than 40%) totaled 112.2 km. Lastly, defective segments (CR ≥ 40%) comprised 67.1 km, which accounted for 12.0% of the surveyed road. This figure suggests that the city’s road network has been heavily deteriorating.
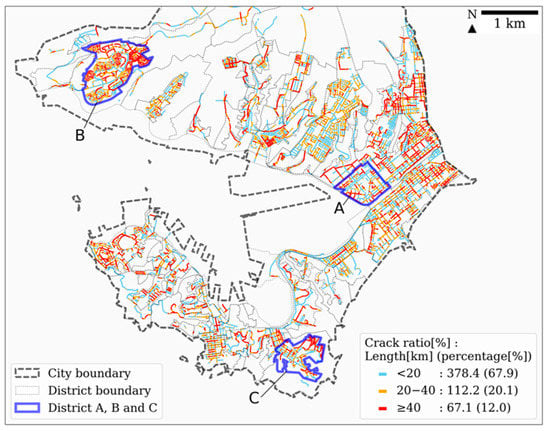
Figure 5.
Spatial distribution of the crack ratio (CR) in Muroran.
Table 1 summarizes the pavement crack ratios for the city’s network and Districts A, B, and C. As the results express, the defective segment lengths for Districts A, B, and C were 2.7 km, 9.4 km, and 3.3 km, respectively. Though District B is a new residential area, its road damage level was higher than in Districts A and C.

Table 1.
Summary of pavement crack ratios.
3.1.2. Autocorrelation Analysis
Figure 6 expresses the global Moran’s I statistics (a) and HH segment length distribution obtained from local spatial autocorrelation analysis (b). As shown in Figure 6a, 71 districts were significant and positive for global statistics. This result implied that the CR values clustered into either HH or LL in these areas. Meanwhile, Figure 6b exhibits the level of hot-spots (presented by the total length of HH segments) concentrated in some areas. For instance, a high level of HH appeared on the east side of the city.

Figure 6.
Spatial autocorrelation analysis outputs. (a) Global Moran’s I value. (b) HH segment distribution.
Figure 7 illustrates LISA maps of Districts A–C. The results show that the HH segments in Districts A, B, and C accounted for approximately 17.3%, 22.8%, and 21.3% of the total, respectively. In addition, the number of HH segments was highest in District B, which accounted for 10,330 m. Alternatively, the lengths of HH segments in Districts A and C were 3450 m and 3525 m, respectively.

Figure 7.
LISA maps of Districts A, B, and C. (a–c) represent Districts A, B, and C, respectively.
Figure 8 visualizes the distribution of the critical segments (CS) in the three districts. As the results denote, the CS segment lengths were lower than those of the HH segments. The CS lengths for Districts A, B, and C were 1860 m, 6020 m, and 2500 m, respectively. This output suggests that the damaged pavement level seemed higher in the highland (Districts B and C) than in the lowland area (District A).

Figure 8.
Distribution of critical segments (CS) in Districts A, B, and C. (a–c) represent Districts A, B, and C, respectively.
3.2. Assessment of Network Level Pavement Maintenance Plans
3.2.1. Acquisition Rate by Prioritization Criterion
In Japan, a pavement maintenance plan is usually set for five years. In addition, the Muroran road maintenance administration can handle repairing 4 km of road per year [65]. Therefore, we extracted 20 km from the top of the critical rate as the repair target section. Table 2 presents the acquisition rates obtained from 4 km (the first-year maintenance) of prioritized pavement concerning the seven scenarios. Also, in this table, we used the conventional method, with CR as the criterion, as the baseline for comparison with other scenarios.
Table 2.
Repair effect by periodization criteria on the top 4 km.
The results show that the roadside condition indexes improved in all scenarios compared with those in the CR scenario. Specifically, the TFSM and TFSA improved in five scenarios and decreased in only the SCR scenario. Likewise, the TFSH and TFSC increased in four scenarios. In addition, only the SCR increased in the SCR and mixed methods, whereas it decreased in repair effect in the others. Remarkably, the Mixed index scenario improved all roadside conditions. The TFSC increased the most at 0.41 point percent, followed by the TFSA, TFSM, and TFSH, with increases of 0.14, 0.12, and 0.05 point percent, respectively. Meanwhile, the SCR had the same value.
Furthermore, Figure 9 exhibits the accumulative repair effect when using the CR and Mixed indexes for making a five-year maintenance plan (20 km of road). The figure indicates that the mixed method improved roadside conditions considerably faster than the conventional method, except for the SCR index. For example, when using the proposed index, the acquisition ratios of the TFSH, TFSC, TFSM, and TFSA reached approximately 0.27, 0.83, 0.44, and 0.4 in the first year, respectively. Meanwhile, these values for the conventional method were about 0.22, 0.42, 0.32, and 0.27. The rate of improvement was even faster in the second year, as the repair effects increased from approximately 0.55 to 0.93 using the mixed method. The conventional index, however, increased the repair effect ratio from 0.41 to 0.64. In summary, although the proposed method did not attain the highest benefit for individual roadside conditions, it presents the best trade-off between indicators. Meanwhile, the prioritization criteria of the other approaches maximized their index only.

Figure 9.
Accumulative repair effect of roadside conditions using the CR and Mixed indexes as the criteria.
3.2.2. Visualization of Maintenance Plans
Figure 10 visualizes the locations of prioritized sections in the first-year maintenance plan using the conventional and mixed methods. Table 3 summarizes information on the maintenance plan in the three districts.

Figure 10.
Location of the top 4 km priority sections (red) by each index. (a) Conventional method. (b) Proposed method.
Table 3.
Length of repair target sections in the first year of each district.
The results indicate that the mixed method increased the length of the repaired pavements by 0.79 km (from 0.74 to 1.53 km) in the first year across the three districts. More specifically, District A increased by 0.43 km (from 0.08 to 0.51 km), while Districts B and C increased by 0.18 km (from 0.49 to 0.67 km) and 0.18 km (from 0.17 to 0.35 km), respectively. Notably, the increase in the repaired pavements of the three districts is associated with the decrease in the other areas. Figure 10 indicates that numerous prioritized pavements in the mid-north region of the city become less significant when changing from the conventional to the mixed method. This shifting suggests the effect of buildings on the prioritizing process. The higher density of buildings in Districts A, B, and C would increase the roads’ priority in these areas.
4. Discussion
4.1. Spatial Distribution of Defective Pavements in the Urban Road Network
Regarding the first research question, the spatial autocorrelation analysis suggests that the damaged pavements (HH segments) were clustered strongly in certain areas. Furthermore, to our best knowledge, though autocorrelation analysis is a useful tool, it has not been used in pavement maintenance. However, the present study has successfully produced a multi-objective pavement maintenance plan for an urban road network using this technique.
Also, the hotspot analysis revealed the deterioration of pavements locally, which may relate to the service life of pavements. This period refers to the expected time for which pavements are functional. Beyond this period, the pavement may degrade and require maintenance, preservation, or rehabilitation. For example, based on the Japanese manual for pavement inspection [66], the crack ratios of low-traffic pavements or residential roads would reach a threshold of 40% by year 20. Nevertheless, the actual service time of road pavements is typically shorter than their expected shelf life because of uncertain factors, including an increase in traffic load, climate change, and quality of materials or construction work [67].
Regarding traffic load, in contrast to highways, traffic volume is more likely to be distributed unequally throughout an urban road network. Intuitively, weight load and vehicle intensity depend mainly on the roads’ function and location. As such, unequal traffic load leads to differences in the degradation speed of road pavements. In addition, urban roads are related intrinsically to the urbanization process. Specifically, the expansion of urban areas requires the construction of new roads. Hence, the age of roads would seem to vary across the city, resulting in early damage occurrence in specific areas compared with others. In this regard, inventory data on road construction would help to predict the deterioration of pavements. Based on this prediction, road agents can proactively create a maintenance plan.
In terms of the environment, high levels of damage would likely cluster in the highland (refer to LISA analysis), where temperatures and humidity are low. This factor delays the freeze–thaw cycle, which causes a slow deterioration in the condition of asphalt-concreted pavements, especially at the wearing course [68]. We suggest that maintenance and construction work in these areas should apply specialized techniques or reduce the freeze–thaw duration to protect the pavements.
4.2. Effectiveness of Proposed Maintenance Strategies
The results imply that the proposed method outperforms the others in achieving repair effects. Moreover, it can quantitatively produce the social effectiveness offered by the maintenance plan. These advantages might reflect the efficiency of directly integrating roadside conditions into the criteria for prioritization. Similarly, Torres-Machi et al. [4] used major infrastructure near a road (MI; the major infrastructure within 300 m of the road section under analysis) and the benefited population (BP; high-density city blocks served by the pavement) as aspects of social–political factors. The MI and BP, however, were assigned dummy values for yes or no. The authors then standardized the social–political factor to one of four values—0, 0.33, 0.66, and 1—based on the combinations of the two indexes. This process may lead to bias in results because the levels of the MI and BP were ambiguous. For example, the number of MIs and level of block density were undefined. In addition, the approach followed the best-first strategy in the prioritization process, which may be unsuitable for a situation with numerous damaged pavements. For this reason, Chu and Huang [69] claimed that the best-first strategy yields the lowest efficiency among other methods, including optimization-based, threshold-based, and worst-first methods (the present study’s approach). Thus, we believe the proposed technique would have more advantages than the previous one.
Another advantage of the proposed method is its simplicity and flexibility compared with the other approaches. For instance, Godoy et al. [60] introduced a social–political priority factor (SPPF), a combination of the four social–political criteria, namely, social perception, critical infrastructure near a road, BP, and the presence of alternative routes. Similarly, Zhang and Mohsen [37] adopted eight categories composed of 60 indicators to verify whether a pavement is suitable for repair. Remarkably, the two methods used expert judgment or interviewee opinions to estimate the SPPF using a regression model [60] and the priority of a category using AHP [37]. We argue that this approach may lead to difficulty in application to various areas because of the diversity of the social–political aspects. For example, variations in design and construction standards, differences in levels of service (LOS), or culture may change the coefficients of the regression model and the results of AHP. As a result, these models would have to be rebuilt and re-validated for each area. In contrast, the proposed method does not require these external terms. Thus, it could apply at regional, national, and global scales.
Finally, the proposed method does not use complex algorithms in its analysis compared with the other approaches. Therefore, local engineers can conduct the maintenance plan using costless devices. In addition, the quantitative results could help road agents easily make decisions. Particularly, the outcomes would support them in explaining and convincing residents, which could help to achieve high agreement with the community.
5. Limitations and Conclusions
5.1. Limitations
This study has certain inherent limitations. First, analyses used only the cracking index as an indicator of pavement damage, which may not comprehensively reflect the pavement conditions. Hence, future studies could supplement the current results using other data on pavement distress, such as rutting and potholes, to address this disadvantage. We believe that with the aid of ICT, collecting these types of data would be possible.
Second, to simplify the analyses, this study considers the length of the road as a budgetary constraint by hypothesizing that defective pavements should be resurfaced. This aspect may be suitable for the case of Muroran, where the damaged pavement level was high. However, resurfacing would be inappropriate when the conditions have been improved or in other cities with better pavement conditions. In these cases, repair activities may change to patching or sealing, which are less expensive than reconstruction. Thus, we propose that integrating the repair activities into the maintenance plan is a promising alternative to budgetary constraints.
Finally, although the pavement is the most expensive part of an urban road, other components, such as sidewalks and various facilities, require maintenance. Hence, future studies should aim to include these components in analyses. This initiative could comprehensively solve the management of the maintenance of urban road networks.
5.2. Conclusions
This study conducted maintenance planning for the urban road network in Muroran, a small to medium-sized city in Japan, using data on pavement inspection and buildings. The results of spatial analyses indicate that defective pavements would seem to cluster in specific areas, especially in mountainous and forested areas. Furthermore, the proposed method produced an optimal plan that significantly improved roadside conditions within a short period. Specifically, for the 5-year plan, approximately 55% of roadside residents (represented by the TFSH) and 90% of commercial and medical facilities surrounding the critical sections gained benefits from maintenance activities in the second year. Similarly, the plan still ensured that over 40% of the critical sections were repaired. Finally, the proposed method is not only reliable but also easy to implement and interpret, which supported the local road agents in making decisions and explaining such decisions to residents.
Finally, to the best of our knowledge, this study is the first that implements a maintenance plan for an entire road network in a city. The main contributions of this study are twofold. First, it enriches the literature by introducing a new approach to establishing a pavement maintenance plan. Second, it provides a good practice for municipal road administrations to address the current problem.
Author Contributions
Conceptualization, T.A.; methodology, T.A. and T.V.H.; formal analysis, T.A.; investigation, T.A. and T.V.H.; writing—original draft preparation, T.A.; writing—review and editing, T.V.H.; visualization, T.A.; supervision, S.K.; project administration, S.K.; funding acquisition, M.A. and T.A. All authors have read and agreed to the published version of the manuscript.
Funding
This work was supported by the Japan Society for the Promotion of Science (JSPS KAKENHI), grant numbers JP20K04730 and JP22K04360.
Institutional Review Board Statement
Not applicable.
Informed Consent Statement
Not applicable.
Data Availability Statement
Not applicable.
Acknowledgments
The pavement inspection survey was conducted jointly with the Muroran City Urban Construction Department, Civil Engineering Section. The basic urban planning survey data was provided by Muroran City Urban Construction Department, Urban Policy Promotion Section.
Conflicts of Interest
The authors declare no conflict of interest.
References
- Mathew, B.S.; Isaac, K.P. Optimisation of maintenance strategy for rural road network using genetic algorithm. Int. J. Pavement Eng. 2014, 15, 352–360. [Google Scholar] [CrossRef]
- Hamdi, H.; Hadiwardoyo, S.P.; Correia, A.G.; Pereira, P. Pavement Maintenance Optimization Strategies for National Road Network in Indonesia Applying Genetic Algorithm. Procedia Eng. 2017, 210, 253–260. [Google Scholar] [CrossRef]
- Loprencipe, G.; Pantuso, A.; Di Mascio, P. Sustainable Pavement Management System in Urban Areas Considering the Vehicle Operating Costs. Sustainability 2017, 9, 453. [Google Scholar] [CrossRef]
- Torres-Machi, C.; Osorio, A.; Godoy, P.; Chamorro, A.; Mourgues, C.; Videla, C. Sustainable Management Framework for Transportation Assets: Application to Urban Pavement Networks. KSCE J. Civ. Eng. 2018, 22, 4095–4106. [Google Scholar] [CrossRef]
- He, Z.; Qin, X.; Wang, H.; Comes, C. Implementing Practical Pavement Management Systems for Small Communities: A South Dakota Case Study. Public Work. Manag. Policy 2017, 22, 378–391. [Google Scholar] [CrossRef]
- Cottrell, W.D.; Bryan, S.; Chilukuri, B.R.; Kalyani, V.; Stevanovic, A.; Wu, J. Transportation Infrastructure Maintenance Management: Case Study of a Small Urban City. J. Infrastruct. Syst. 2009, 15, 120–132. [Google Scholar] [CrossRef]
- Bryce, J.M.; Hosten, A.M.; Priddy, L.P.; Flintsch, G.W.; de León Izeppi, E.; Nelson, W.O. Using Pavement Management to Support Maintenance and Engineering Policy Decisions for Small and Mid-Sized Municipalities. Public Work. Manag. Policy 2014, 19, 148–163. [Google Scholar] [CrossRef]
- Shahin, M.Y. Pavement Management for Airports, Roads, and Parking Lots; Springer Science+Business Media LLC: New York, NY, USA, 2005; ISBN 9780387234649. [Google Scholar]
- Peraka, N.S.P.; Biligiri, K.P. Pavement asset management systems and technologies: A review. Autom. Constr. 2020, 119, 103336. [Google Scholar] [CrossRef]
- Guan, J.; Yang, X.; Ding, L.; Cheng, X.; Lee, V.C.S.; Jin, C. Automated pixel-level pavement distress detection based on stereo vision and deep learning. Autom. Constr. 2021, 129, 103788. [Google Scholar] [CrossRef]
- Mei, Q.; Gül, M. A cost effective solution for pavement crack inspection using cameras and deep neural networks. Constr. Build. Mater. 2020, 256, 119397. [Google Scholar] [CrossRef]
- Maeda, H.; Sekimoto, Y.; Seto, T.; Kashiyama, T.; Omata, H. Road Damage Detection and Classification Using Deep Neural Networks with Smartphone Images. Comput. Civ. Infrastruct. Eng. 2018, 33, 1127–1141. [Google Scholar] [CrossRef]
- Arya, D.; Maeda, H.; Ghosh, S.K.; Toshniwal, D.; Mraz, A.; Kashiyama, T.; Sekimoto, Y. Deep learning-based road damage detection and classification for multiple countries. Autom. Constr. 2021, 132, 103935. [Google Scholar] [CrossRef]
- Chen, W.; Zheng, M. Multi-objective optimization for pavement maintenance and rehabilitation decision-making: A critical review and future directions. Autom. Constr. 2021, 130, 103840. [Google Scholar] [CrossRef]
- Shon, H.; Lee, J. Integrating multi-scale inspection, maintenance, rehabilitation, and reconstruction decisions into system-level pavement management systems. Transp. Res. Part C Emerg. Technol. 2021, 131, 103328. [Google Scholar] [CrossRef]
- Yu, B.; Gu, X.; Ni, F.; Guo, R. Multi-objective optimization for asphalt pavement maintenance plans at project level: Integrating performance, cost and environment. Transp. Res. Part D Transp. Environ. 2015, 41, 64–74. [Google Scholar] [CrossRef]
- Ahmed, S.; Vedagiri, P.; Krishna Rao, K.V. Prioritization of pavement maintenance sections using objective based Analytic Hierarchy Process. Int. J. Pavement Res. Technol. 2017, 10, 158–170. [Google Scholar] [CrossRef]
- Li, H.; Ni, F.; Dong, Q.; Zhu, Y. Application of analytic hierarchy process in network level pavement maintenance decision-making. Int. J. Pavement Res. Technol. 2018, 11, 345–354. [Google Scholar] [CrossRef]
- Sayadinia, S.; Beheshtinia, M.A. Proposing a new hybrid multi-criteria decision-making approach for road maintenance prioritization. Int. J. Qual. Reliab. Manag. 2020, 38, 1661–1679. [Google Scholar] [CrossRef]
- Elhadidy, A.A.; Elbeltagi, E.E.; Ammar, M.A. Optimum analysis of pavement maintenance using multi-objective genetic algorithms. HBRC J. 2015, 11, 107–113. [Google Scholar] [CrossRef]
- Hafez, M.; Ksaibati, K.; Atadero, R.A. Applying Large-Scale Optimization to Evaluate Pavement Maintenance Alternatives for Low-Volume Roads using Genetic Algorithms. Transp. Res. Rec. J. Transp. Res. Board 2018, 2672, 205–215. [Google Scholar] [CrossRef]
- Nik, A.A.; Moghadas Nejad, F.; Zakeri, H. A Survey on Pavement Sectioning in Network Level and an Intelligent Homogeneous Method by Hybrid PSO and GA. Arch. Comput. Methods Eng. 2020, 27, 977–997. [Google Scholar] [CrossRef]
- Tayebi, N.R.; Nejad, F.M.; Mola, M. Comparison between GA and PSO in Analyzing Pavement Management Activities. J. Transp. Eng. 2014, 140, 99–104. [Google Scholar] [CrossRef]
- Zhang, Z.; Dossey, T.; Weissmann, J.; Hudson, W.R. GIS integrated pavement and infrastructure management in urban areas. Transp. Res. Rec. 1994, 1429, 84–89. [Google Scholar]
- Pantha, B.R.; Yatabe, R.; Bhandary, N.P. GIS-based highway maintenance prioritization model: An integrated approach for highway maintenance in Nepal mountains. J. Transp. Geogr. 2010, 18, 426–433. [Google Scholar] [CrossRef]
- Montoya-Alcaraz, M.; Mungaray-Moctezuma, A.; García, L. Sustainable Road Maintenance Planning in Developing Countries Based on Pavement Management Systems: Case Study in Baja California, México. Sustainability 2020, 12, 36. [Google Scholar] [CrossRef]
- Nautiyal, A.; Sharma, S. Condition Based Maintenance Planning of low volume rural roads using GIS. J. Clean. Prod. 2021, 312, 127649. [Google Scholar] [CrossRef]
- Babashamsi, P.; Golzadfar, A.; Yusoff, N.I.M.; Ceylan, H.; Nor, N.G.M. Integrated fuzzy analytic hierarchy process and VIKOR method in the prioritization of pavement maintenance activities. Int. J. Pavement Res. Technol. 2016, 9, 112–120. [Google Scholar] [CrossRef]
- Khavandi Khiavi, A.; Mohammadi, H. Multiobjective Optimization in Pavement Management System Using NSGA-II Method. J. Transp. Eng. Part B Pavements 2018, 144, 04018016. [Google Scholar] [CrossRef]
- Sandamal, R.M.K.; Ranawaka, R.K.T.K.; Pasindu, H.R. A Framework to Incorporate Safety Performance for Low Volume Roads in Pavement Management Systems. In Proceedings of the 2020 Moratuwa Engineering Research Conference (MERCon), IEEE, Moratuwa, Sri Lanka, 28–30 July 2020; pp. 407–412. [Google Scholar]
- Torres-Machi, C.; Pellicer, E.; Yepes, V.; Chamorro, A. Towards a sustainable optimization of pavement maintenance programs under budgetary restrictions. J. Clean. Prod. 2017, 148, 90–102. [Google Scholar] [CrossRef]
- Torres-Machi, C.; Osorio-Lird, A.; Chamorro, A.; Videla, C.; Tighe, S.L.; Mourgues, C. Impact of environmental assessment and budgetary restrictions in pavement maintenance decisions: Application to an urban network. Transp. Res. Part D Transp. Environ. 2018, 59, 192–204. [Google Scholar] [CrossRef]
- Chong, D.; Wang, Y. Impacts of flexible pavement design and management decisions on life cycle energy consumption and carbon footprint. Int. J. Life Cycle Assess. 2017, 22, 952–971. [Google Scholar] [CrossRef]
- Ogwang, A.; Madanat, S.; Horvath, A. Optimal Cracking Threshold Resurfacing Policies in Asphalt Pavement Management to Minimize Costs and Emissions. J. Infrastruct. Syst. 2019, 25, 04019003. [Google Scholar] [CrossRef]
- Lee, J.; Madanat, S.; Reger, D. Pavement systems reconstruction and resurfacing policies for minimization of life-cycle costs under greenhouse gas emissions constraints. Transp. Res. Part B Methodol. 2016, 93, 618–630. [Google Scholar] [CrossRef]
- Cafiso, S.; DI Graziano, A.; Kerali, H.R.; Odoki, J.B. Multicriteria Analysis Method for Pavement Maintenance Management. Transp. Res. Rec. J. Transp. Res. Board 2002, 1816, 73–84. [Google Scholar] [CrossRef]
- Zhang, Y.; Mohsen, J.P. A Project-Based Sustainability Rating Tool for Pavement Maintenance. Engineering 2018, 4, 200–208. [Google Scholar] [CrossRef]
- Li, S.; Liu, Y.; Wang, P.; Liu, P.; Meng, J. A novel approach for predicting urban pavement damage based on facility information: A case study of Beijing, China. Transp. Policy 2020, 91, 26–37. [Google Scholar] [CrossRef]
- OICA Motorization Rate 2015—Worldwide. Available online: https://www.oica.net/category/vehicles-in-use/ (accessed on 10 October 2021).
- MLIT Annual Report of Road Statistics. Available online: https://www.mlit.go.jp/road/ir/ir-data/tokei-nen/index.html (accessed on 10 October 2021).
- MLIT Snow Country Japan (Yukiguni Nihon). Available online: https://www.hrr.mlit.go.jp/hokugi/yukinavi/pdf/archive/leaflet/t_02.pdf (accessed on 20 April 2020).
- Lin, T.; Ishikawa, T.; Maruyama, K.; Tokoro, T. Pavement design method in Japan with consideration of climate effect and principal stress axis rotation. Transp. Geotech. 2021, 28, 100552. [Google Scholar] [CrossRef]
- Ud Din, I.M.; Mir, M.S.; Farooq, M.A. Effect of Freeze-Thaw Cycles on the Properties of Asphalt Pavements in Cold Regions: A Review. Transp. Res. Procedia 2020, 48, 3634–3641. [Google Scholar] [CrossRef]
- Asada, T.; Ikoma, S.; Arimura, M.; Kameyama, S. Construction of Database by Exhaustive Pavement Inspection on Residential Roads and Application to Management. J. Japan Soc. Civ. Eng. Ser. D3 (Infrastruct. Plan. Manag.) 2021, 76, I_41–I_49. [Google Scholar] [CrossRef]
- Muroran City. Available online: https://www.city.muroran.lg.jp/main/org1200/documents/02_jinkou.pdf (accessed on 21 February 2020).
- ASTM ASTM D6643-20; Standard Practice for Roads and Parking Lots Pavement Condition Index Surveys. ASTM Int.: Conshohocken, PA, USA, 2020.
- Kheradmandi, N.; Mehranfar, V. A critical review and comparative study on image segmentation-based techniques for pavement crack detection. Constr. Build. Mater. 2022, 321, 126162. [Google Scholar] [CrossRef]
- Ouma, Y.O.; Hahn, M. Wavelet-morphology based detection of incipient linear cracks in asphalt pavements from RGB camera imagery and classification using circular Radon transform. Adv. Eng. Informatics 2016, 30, 481–499. [Google Scholar] [CrossRef]
- JARA Maintenance Guidebook for Road Pavement; Japan Road Association: Tokyo, Japan, 2017; ISBN 978-4-88950-718-8.
- Tomiyama, K.; Kawamura, A.; Fujita, S.; Ishida, T. An effective surface inspection method of urban roads according to the pavement management situation of local governments. J. Jpn. Soc. Civ. Eng. Ser. F3 (Civ. Eng. Inform.) 2013, 69, I_54–I_62. [Google Scholar] [CrossRef]
- Asada, T.; Ikoma, S.; Nagaya, H.; Kameyama, S. Development of pavement inspection system by using car-mounted camera and u-net model. J. Jpn. Soc. Civ. Eng. Ser. E1 Pavement Eng. 2020, 76, I_123–I_131. [Google Scholar] [CrossRef] [PubMed]
- Olaf, R.; Philipp, F.; Thomas, B. U-Net: Convolutional Networks for Biomedical Image Segmentation. Med. Image Comput. Comput. Interv. 2015, 9351, 234–241. [Google Scholar] [CrossRef]
- Nakamura, H.; Kameyama, S.; Sakuraba, A.; Yokota, Y. Examination on crack evaluation index of pavement. J. Jpn. Soc. Civ. Eng. Ser. E1 Pavement Eng. 2020, 76, 60–68. [Google Scholar] [CrossRef]
- JARA Handbook of Pavement Survey and Test Methods; Japan Road Association: Tokyo, Japan, 2019; ISBN 978-4-88950-337-1.
- Moran, P.A.P. The Interpretation of Statistical Maps. J. R. Stat. Soc. Ser. B 1948, 10, 243–251. [Google Scholar] [CrossRef]
- Lan, F.; Zhang, Y. Spatial Autoregressive Model of Commodity Housing Price and Empirical Research. Syst. Eng. Procedia 2011, 1, 206–212. [Google Scholar] [CrossRef]
- Chen, K.; Cong, P.; Qu, L.; Liang, S.; Sun, Z. Wetland degradation diagnosis and zoning based on the integrated degradation index method. Ocean Coast. Manag. 2022, 222, 106135. [Google Scholar] [CrossRef]
- Getis, A. Spatial Autocorrelation. In Handbook of Applied Spatial Analysis; Fischer, M.M., Getis, A., Eds.; Springer: Heidelberg, Germany; Dordrecht, The Netherlands; London, UK; New York, NY, USA, 1973; pp. 255–278. [Google Scholar]
- Kontokosta, C.E.; Hong, B. Bias in smart city governance: How socio-spatial disparities in 311 complaint behavior impact the fairness of data-driven decisions. Sustain. Cities Soc. 2021, 64, 102503. [Google Scholar] [CrossRef]
- Godoy, P.; Mourgues, C.; Chamorro, A. Incorporating socio-political criteria into the maintenance prioritization of Chilean urban pavement networks. Transp. Res. Part A Policy Pr. 2015, 80, 151–162. [Google Scholar] [CrossRef]
- Jamshidi, A.; Kurumisawa, K.; White, G.; Nishizawa, T.; Igarashi, T.; Nawa, T.; Mao, J. State-of-the-art of interlocking concrete block pavement technology in Japan as a post-modern pavement. Constr. Build. Mater. 2019, 200, 713–755. [Google Scholar] [CrossRef]
- Huang, J.; Losa, M.; Leandri, P.; Kumar, S.G.; Zhang, J.; Sun, Y. Potential anti-vibration pavements with damping layer: Finite element (FE) modeling, validation, and parametrical studies. Constr. Build. Mater. 2021, 281, 122550. [Google Scholar] [CrossRef]
- Yoshida, T. Estimating percent defective and allocating funds for rehabilitation of road pavements under the diversification of inspection methods. J. Jpn. Soc. Civ. Eng. Ser. E1 Pavement Eng. 2018, 74, 30–41. [Google Scholar] [CrossRef]
- Abu Dabous, S.; Zeiada, W.; Zayed, T.; Al-Ruzouq, R. Sustainability-informed multi-criteria decision support framework for ranking and prioritization of pavement sections. J. Clean. Prod. 2020, 244, 118755. [Google Scholar] [CrossRef]
- Asada, T.; Kachi, K.; Arimura, M. Exhaustive Pavement Inspection on Residential Roads Using Car-Mounted Cameras and U-Net. In Proceedings of the 2020 IEEE 9th Global Conference on Consumer Electronics (GCCE), Kobe, Japan, 13–16 October 2020; pp. 698–699. [Google Scholar]
- MLIT. Pavement Inspection Procedure; MLIT: Tokyo, Japan, 2016. [Google Scholar]
- Setyawan, A.; Nainggolan, J.; Budiarto, A. Predicting the Remaining Service Life of Road Using Pavement Condition Index. Procedia Eng. 2015, 125, 417–423. [Google Scholar] [CrossRef]
- Özgan, E.; Serin, S. Investigation of certain engineering characteristics of asphalt concrete exposed to freeze–thaw cycles. Cold Reg. Sci. Technol. 2013, 85, 131–136. [Google Scholar] [CrossRef]
- Chu, J.C.; Huang, K.-H. Mathematical programming framework for modeling and comparing network-level pavement maintenance strategies. Transp. Res. Part B Methodol. 2018, 109, 1–25. [Google Scholar] [CrossRef]
Publisher’s Note: MDPI stays neutral with regard to jurisdictional claims in published maps and institutional affiliations. |
© 2022 by the authors. Licensee MDPI, Basel, Switzerland. This article is an open access article distributed under the terms and conditions of the Creative Commons Attribution (CC BY) license (https://creativecommons.org/licenses/by/4.0/).