Article

Two-Dimensional Modelling of the Mixing Patterns in a Tropical Semiarid Reservoir

by
Sofia Midauar Gondim Rocha
1,
João Victor Barros da Silva
2,
Wictor Edney Dajtenko Lemos
2,
Francisco de Assis de Souza Filho
2 and
Iran Eduardo Lima Neto
2,*
1
Lancaster Environment Centre, Lancaster University, Lancaster LA1 4YF, UK
2
Department of Hydraulic and Environmental Engineering, Federal University of Ceará—UFC, Campus do Pici, bl. 713, Fortaleza 60451-970, Ceará, Brazil
*
Author to whom correspondence should be addressed.
Sustainability 2022, 14(23), 16051; https://doi.org/10.3390/su142316051
Submission received: 12 October 2022 / Revised: 15 November 2022 / Accepted: 29 November 2022 / Published: 1 December 2022
(This article belongs to the Section Environmental Sustainability and Applications)

Abstract

:
Tropical semi-arid regions suffer with recurrent droughts and uncertain water availability, but a few research studies have been conducted to further understand those complexities and their relationships with reservoir hydrodynamics. This study assessed the hydrodynamic processes of a multiple-use reservoir located in the Brazilian semiarid region. The aim was to apply the CE-QUAL-W2 model to understand the lake’s thermal structure and its variabilities in time and space by using the Richardson’s number (Ri) as a reference. Meteorological patterns were also investigated. Results show that: (1) no significant changes were found by analysing the spatial variabilities of stratification; (2) seasonal changes were relevant as more robust stratification stability was observed in the wet period when water availability may be impacted by poor water quality; (3) from meteorological evaluations, rainfall showed a strong coefficient of determination with Ri (r² of 0.77); and (4) a threshold value of 60 mm in monthly precipitation was found as an indication of a stable stratification in the water column. Wind speed and water level partly influenced Ri’s variabilities, while low impact was noted for air temperature and inflow. These results can promote an improvement in water-resources management by linking rainfall regime and reservoir hydrodynamics.

1. Introduction

Water availability is a major concern throughout the world [1,2,3,4,5]. This issue is evident in tropical semi-arid reservoirs, as high evaporation indexes and low storage volumes are associated with poor water-quality standards [6,7,8,9]. For instance, Lima Neto [7] analysed such reservoirs to evaluate the impacts of artificial-destratification techniques on water availability by evaporation suppression. Multiple man-made reservoirs were built in the Brazilian semi-arid region in order to fulfil the local population needs of water as recurrent droughts occur, generating a dense reservoir-network system [9,10,11]. Wiegand et al. [9] evaluated trophic-state changes under drought conditions in Brazilian semi-arid reservoirs that provide water supply for the population. On this basis, the importance of fully understanding reservoir hydrodynamics and thermal structure is strengthened, as they are determinant factors for water quality [12,13,14,15,16,17,18]. Zouabi-Aloui et al. [13] evaluated the impacts of withdrawal on a Tunisian reservoir’s thermal structure and multiple water- quality parameters. Ziaie et al. [13] investigated water-quality parameters with stratification patterns in an Iranian reservoir, finding correlated dynamics between them.
Most studies on reservoir hydrodynamics have been performed in temperate-climate reservoirs, which usually have low water level variation and where water availability is not a frequent issue, compared to arid and semiarid regions [6,19,20,21,22,23]. On the other hand, only a few research studies have been conducted in tropical semi-arid water bodies, although these regions show highly unstable climate with frequent droughts, irregular rainfall throughout the year, high volume variation, and massive evaporation rates [5,24,25,26,27,28,29]. Ma et al. [24] studied a Mediterranean reservoir (semi-arid climate), noticing seasonal patterns in stratification and its variation with selective withdrawal, but the lake’s thermal structure was evaluated only by water-temperature differences. Further, Saber et al. [25] applied different stability numbers using in-lake measurements in a semi-arid reservoir to understand its thermal structure, and water-velocity gradients were estimated by wind-induced surface shear velocities.
In this context, in relatively small water bodies, where the earth-rotation effects are small, stratification is the central force in the transport processes [30]. Stratification influences the nutrient release from sediment as it favours the development of a well-mixed and low-nutrient epilimnion with an anoxic, and a high-nutrient hypolimnion isolated by a stable thermocline (oxycline) [3,31,32,33,34,35]. Moura et al. [34] evaluated phosphorus-sediment release for semiarid reservoirs under oxic and anoxic conditions, the latter favouring phosphorus-internal loading and being developed with increased stratification.
On this basis, the mixing patterns of a water body are mainly influenced by meteorological forcings, such as air temperature, wind speed and direction, and rainfall, along with in-lake dynamics, namely inflow, outflow, withdrawal, and its water depth [22,36,37,38,39,40,41,42]. Plec et al. [42] investigated, with a 3D model set-up in a Brazilian reservoir, the impacts of stream inflow on the lake’s thermal structure and found that colder inflows might generate a density current that favours nutrient release from sediment. Also, the reservoir’s morphology is significant in its hydrodynamic behaviour [22,41,43]. Magee and Wu [41] studied lakes located in Wisconsin/USA with a different morphology, finding that meteorological conditions have multiple impacts on their thermal structure, depending on each surface area and water depth. This supports the idea that each water impoundment has its particularities, depending on its latitude, shape, watershed size, land use and occupation, and rainfall regime.
Different indexes are used to describe the hydrodynamics of a reservoir [23,30,44,45]. Among them, Richardson’s Number (Ri), which represents the ratio of buoyancy to shear forces, is commonly used to analyse the mixing patterns in water bodies [23,25,46]. There is no need to determine the extent of the thermocline to estimate Ri as it depends only on the surface and bottom horizontal velocity and density (see Equation (1)), the latter determined from water temperature [47,48,49].
R i = b u o y a n c y s h e a r = ( g ρ ) ( ρ z ) ( u z ) 2
where z = depth [m], which is positive in the downward direction, g = acceleration due to gravity [m/s2], ρ = water density [kg/m3], ∂ρ∂z = gradient of density with depth, and ∂u∂z = gradient of horizontal velocity with depth or shear.
The value of Ri = 0.25 is commonly accepted as a threshold, above which the stratification is considered stable, and otherwise the water column is fully mixed [25,46,48,50]. Xing et al. [46] evaluated mixing and water quality patterns under varying wind conditions along with Ri analysis. Moreover, multiple studies have shown a range for Ri that characterizes a water regime transitioning from mixed to stratified, with 0.25 < Ri < 1.00 [25,30,51]. Saber et al. [25] found water column’s stability when analysing Ri increase from under 0.25 to over 1.00 values in Arizona/USA.
In order to study the hydrodynamics of water bodies and to apply the above-mentioned indexes, such as Ri, different numerical and multidimensional models are available [19,52,53,54,55]. These models can be unidimensional, bidimensional, and tridimensional. Within them, bidimensional models, such as CE-QUAL-W2, have properly represented reservoirs’ hydrodynamic processes with relatively low computational effort and are largely used to simulate lakes and reservoirs [5,12,24,56,57,58]. Mesquita et al. [5] analysed an urban lake’s hydrodynamics and evaporation processes with their impacts on water quality by applying CE-QUAL-W2. Moreover, Kim et al. [58] evaluated seasonal patterns and its dynamics with water quality parameters in a Korean hydropower-generating reservoir using CE-QUAL-W2 simulations.
The aim of this work was to assess meteorological and thermal-stratification variance of a tropical semiarid reservoir and understand its main temporal and spatial variabilities. In order to evaluate the mixing patterns of the water body, Richardson’s Number (Ri) was applied. Correlations between Ri and different variables, namely wind speed, air temperature, rainfall, inflow, and water level, were calculated. Afterward, the influence of meteorological forcing on the reservoir’s stratification regime was estimated with seasonal and long-term variabilities. The laterally averaged CE-QUAL-W2 model was used for the analysis to improve the current knowledge on the particular processes of semiarid water bodies.

2. Materials and Methods

2.1. Study Site

The Pentecoste reservoir (3.80° S, 39.26° W) is approximately 80 km west of Fortaleza, the state of Ceará, Brazil, in a semi-arid region accordingly to the Koppen climate classification (see de Araújo & Piedra [6]; Muniz et al. [59]), and has multiple uses. The mean annual rainfall is 820 mm, usually concentrated between February and May (wet season). The mean air temperature is 27 °C, and an average wind speed of 2.80 m/s was estimated between 2009 and 2010 when appropriate data measurements were available for the model set-up. Semi-arid regions have pronounced seasonality noted in climate conditions as rainfall events are concentrated in a few months of the year (see Alazard et al. [60]; de Araújo et al. [2]; Lima Neto et al. [61]).
Pentecoste reservoir has a maximum capacity of 360 hm³, a surface area of 46.6 km², a maximum depth of 19.8 m, a mean depth of 6.5 m, and a catchment area of 3090 km². The theoretical residence time is approximately 13 months. Furthermore, as shown in Figure 1, the Pentecoste reservoir is formed by two main branches that come from rivers Canindé and Curu, both intermittent (i.e., streamflow only occurs during the wet season).

2.2. Model Description

The CE-QUAL-W2 model was chosen for this study as it is a multidimensional model that allows systemic evaluation of hydrodynamic patterns with relatively low computational effort when compared to 3D systems. It is a 2-D laterally averaged hydrodynamic model that is adequate for long and narrow water bodies [57]. The model solves the Reynolds Averaged Navier-Stokes (RANS) equations in the longitudinal and vertical directions. The equations are written in the conservative form using Boussinesq and hydrostatic approximations. The model predicts water-surface elevations, velocities (longitudinal and vertical), and temperatures. Temperature is in the hydrodynamics calculations because of its effect on water density [57]. The turbulence-closure model named W2 assumes the maximum vertical-grid spacing as the mixing length and uses the turbulence- viscosity formulation derived by Cole and Buchak [62].
Also, the surface heat exchange is computed as described in Equation 2 (see Cole & Wells [57]).
H n = H s + H a + H e + H c ( H s r + H a r + H b r )
where H n is the net rate of heat exchange across the water surface [W/m²], H s is the incident-short-wave solar radiation [W/m²], H a is the incident long-wave radiation [W/m²], H s r is the reflected-short-wave solar radiation [W/m²], H a r is the reflected-long- wave radiation [W/m²], H b r is the back radiation from the water surface [W/m²], H e is the evaporative heat loss [W/m²], and H c is the heat conduction [W/m²].
The model requires a bathymetric map as a geometry input, inflow, and outflow data, with the following meteorological forcing: air temperature, dew point temperature, cloud cover, wind speed, wind direction, and precipitation. Radiation can be either given by the user or estimated by the model. The latter was performed in this study. Also, equations were applied using the finite difference method in the grid (see Mesquita et al. [5]).

2.3. Meteorological Data

Meteorological data consisted of wind speed and direction 10 metres from the surface, air temperature and dew point temperature 10 metres from the surface, rainfall, and cloud cover, following the model’s requirements for heat-fluxes estimations and with measurements every six hours between July 2009 and April 2010. Parameters from ECMWF (European Centre for Medium-Range Weather Forecasts) were used to reanalysis data.
The data from reanalysis were adjusted to correct bias based on five years of measurements (2006–2010) from a Data Collection Platform operated by the Ceará State Meteorology and Water Resources Foundation (FUNCEME), located ~1.3 km from the Pentecoste reservoir.

2.4. Model Configuration and Accuracy Evaluation

Input data consisted of bathymetry, flow rates, and meteorology. The period analysed ranged between July 2009 and April 2010, when measurements of temperature profiles and water levels were available for the model set-up.
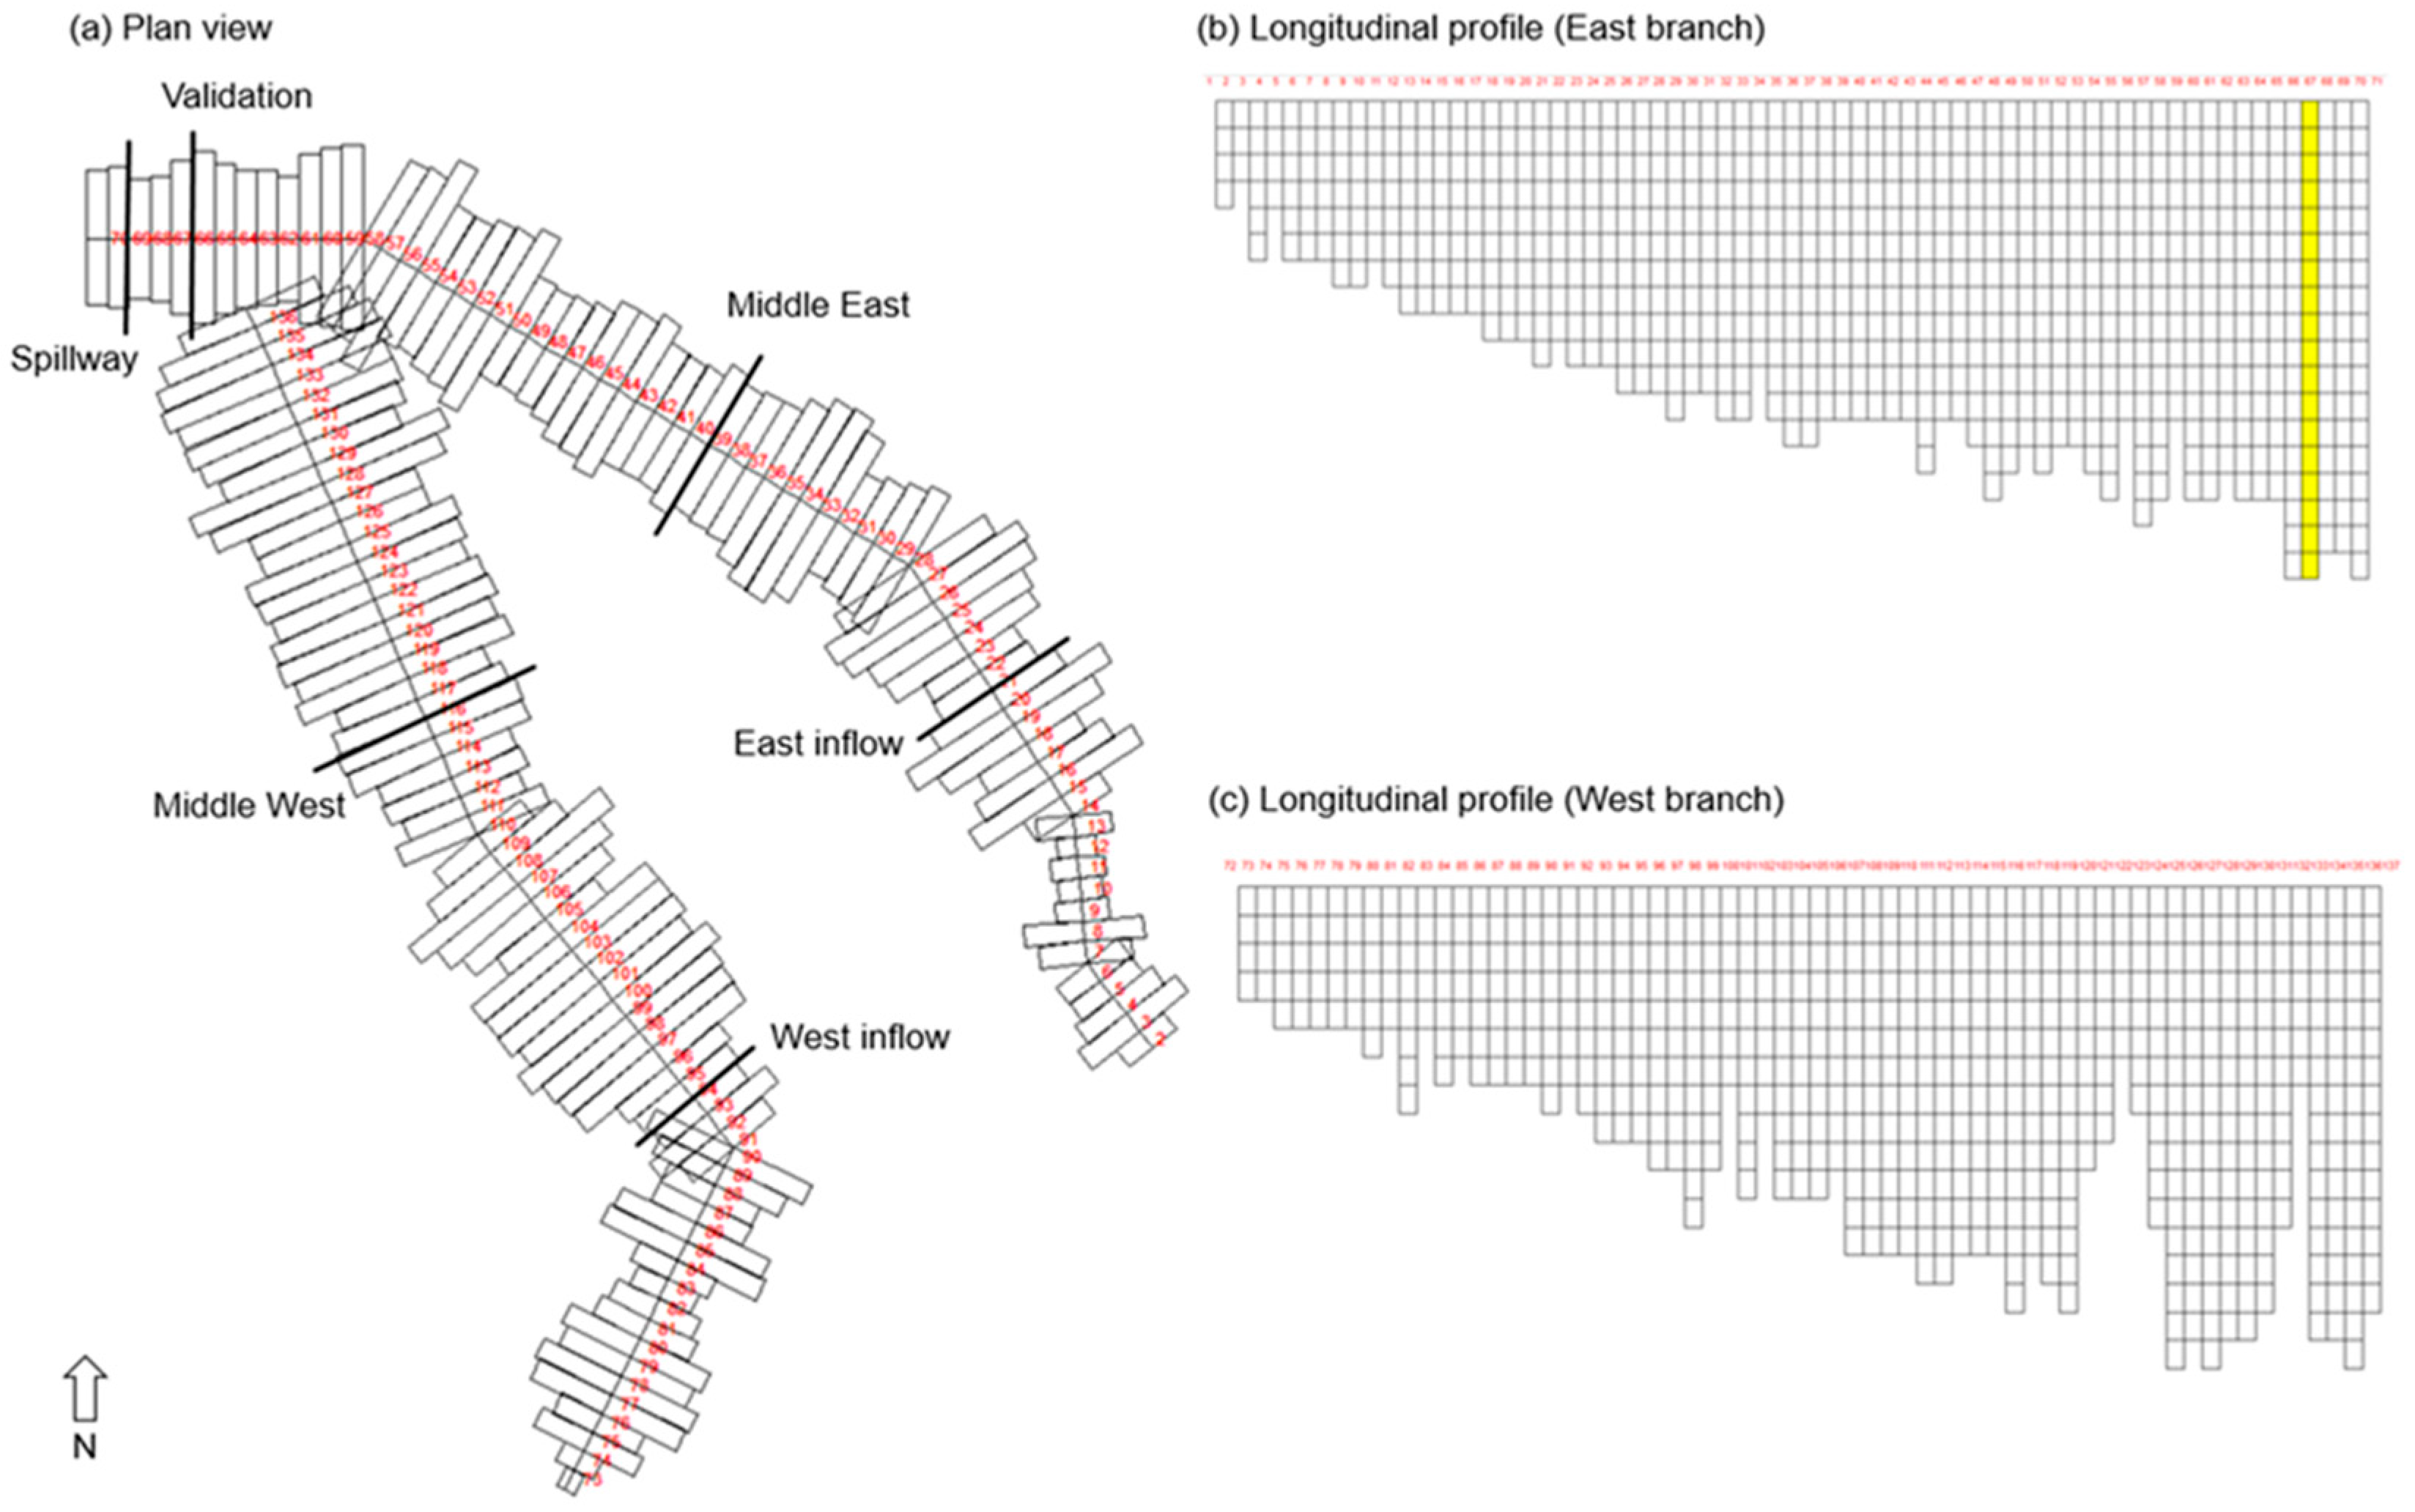
On this basis, the Pentecoste reservoir was discretized into 137 longitudinal segments of 200 m each, and into vertical layers at each 1 m, resulting in a maximum of 21 layers according to the variation of the lake’s bathymetry, and considering the two inactive boundary layers. A total of six segments along the reservoir were chosen for spatial analysis (see Figure 2). Figure 2b shows the position where field measurements were carried out. Additionally, the computation timestep of the model was 1 s.
The model is relatively insensitive to variations over default values in the constituents and temperature-turbulent-dispersion coefficients when it comes to reservoirs [57]. On the other hand, preliminary sensitivity analysis indicated that the most sensitive parameters were the SHADE and WSC coefficients, related respectively to shading of incoming radiation and wind sheltering. Note that small variations in those coefficients alter considerably the model’s result.
The calibration and validation of the model were performed using temperature and water-level data. The CE-QUAL-W2 shading (SHADE) and wind sheltering coefficients (WSC) were manually adjusted for this evaluation. The Mean Absolute Error (MAE) was used for the accuracy estimation (Equation (3)). Calibration was conducted for the dry season, from 7-2-2009 to 1-31-2010, and validation was performed for the wet season, from 2-1-2010 to 5-31-2010, given the limited data availability in the region. Ideally, multiple years of data would be used in the model setup; yet, this condition was not possible for the present study. Therefore, the authors chose to make calibration for one season and validation for the other one, assessing model’s performance in both periods.
MAE = ( ( i = 1 ) n | ( x i - x ι ^ ) | ) / n
where xi is the predicted value, x ι ^ is the measured value, and n is the number of observations.

2.5. Stratification

The Pentecoste Reservoir stratification stability was estimated using Richardson’s Number (Ri), a non-dimensional index largely applied to lakes and reservoirs [25,30,46,47,48,63,64]. Ri formulation was applied, as proposed in Chapra [48] (see Equation (1)).
Ri was calculated for each analysed segment of Figure 2. In order to determine Ri, density and velocity values are necessary for both surface and bottom layers. Those values were estimated as the average for three metres in the surface and three metres in the bottom, meaning that we estimated the mean of water temperature and water horizontal velocity model results for the three first layers of the water column and then for the three bottom ones. This assumption was considered as the velocities of the bottom layer are very close or equal to zero, resulting in extremely high or infinite Ri values, which is not coherent. The water density was calculated from temperature with the empirical formulation (Equation (4)) as in Dingjman [49].
ρ = 1000 0.019549 · | T 3.98 | 1.68
where ρ is water density [kg/m³] and T is water temperature [°C].
Correlations between the Ri estimated for the validation segment and different variables, e.g., wind speed, air temperature, rainfall, inflow, and water level, were analysed to evaluate their influence on the reservoir’s stratification regime. For that, we used monthly averaged values of each variable and then estimated the coefficient of determination. As no water-velocity measurements were available, Ri was determined only for the numeric-model results.

3. Results and Discussion

The results for the accuracy evaluation using MAE are described by Table 1. Figures S1 and S2 from the supplementary material give the comparison between modelled and measured temperature profiles for calibration and validation periods, respectively. MAE mean results are under 1 °C for both calibration and validation intervals, indicating a good adherence between modelled and measured data, following Sharaf et al. [27] who found similar MAE results in a semiarid reservoir located in Lebanon.
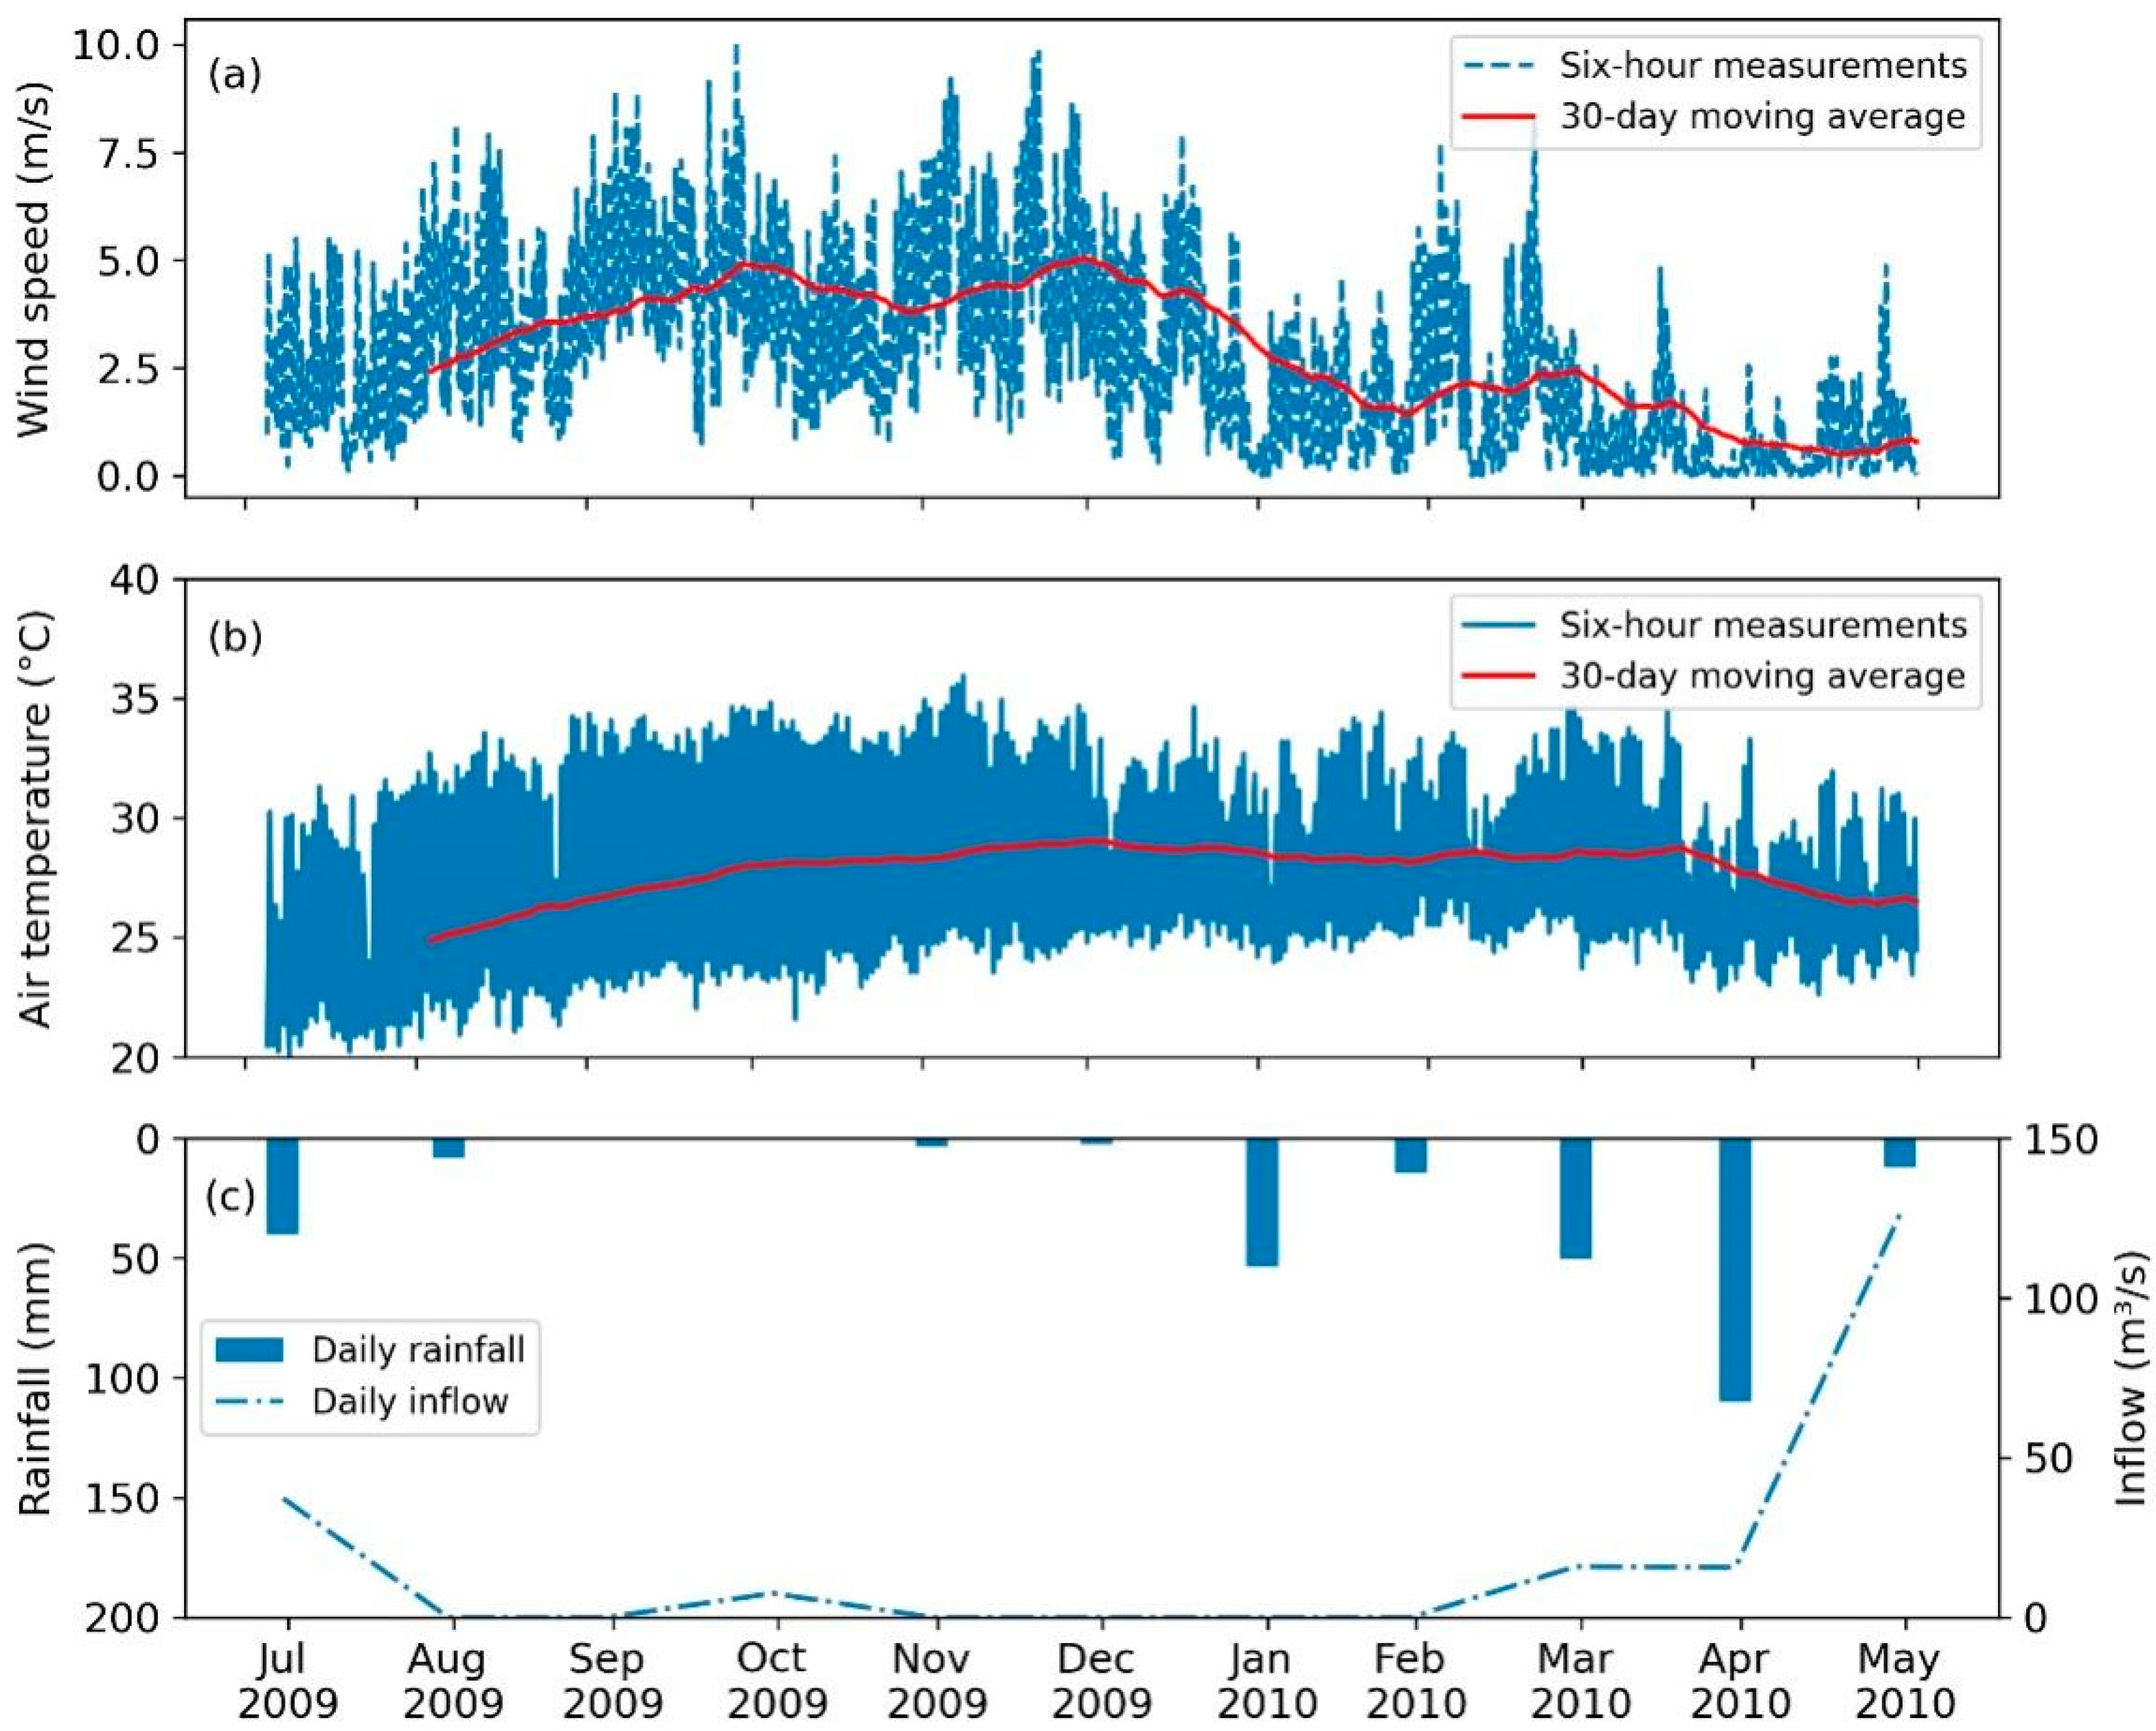
Figure 3 shows the wind speed and air-temperature time series, and their 30-day moving average, with the monthly rainfall and inflow for Pentecoste Reservoir’s location within the period of interest. The time series of wind speed, rainfall, and inflow bring a clear seasonal pattern, while for air temperature, this variation is more discrete as slightly lower temperatures, along with a lower range of variation, are observed for the rainy months. Ma et al. [24] investigated a semiarid lake in the USA that has similar seasonal behaviour of meteorological conditions, especially when analysing inflow time series. The previous discussions highlight the importance of artificial-water impoundments to guarantee water supply for the population. For the region evaluated in the present work, the mean air temperature observed for the dry period (second semester) was 28.1 °C, while for the wet season, it was 27.2 °C, 3% lower than the first and the time series are significantly different (p-value of 0.0059). Likewise, for the wind-speed trends, the values decrease from a 4.1 m/s mean between August and December of 2009 to a 1.5 m/s mean in the other months (~60% lower). In agreement to that, similar patterns were observed by Curtarelli et al. [39] in a tropical reservoir and by França et al. [64] in a semi-arid water body, with two well-defined seasons marked by lower wind speeds in the wet period.
This pattern is due to the rainfall behaviour of the region and the higher wind speeds on the dry season, when barely any precipitation is noticed. Also, low precipitation rates concentrated on a few months of the year characterize semi-arid regions, which impacts water availability and quality, as shown by De Araújo and Piedra [6]. De Araújo and Piedra [6] found that, between two tropical watersheds, the river discharge availability was 73% in the humid watershed, while it was only 28% in the semi-arid one due to evaporation losses.
In addition, the lack of rainfall associated with high wind speeds and air temperatures favours the high evaporation rates of the Pentecoste reservoir in the second semester of the year (dry period). This scenario alters the heat balance of the lake with the loss of energy due to the evaporation process, a condition that might result in lower water temperatures, impacting the lake’s thermal structure. Moreover, as the reservoirs retain the water precipitation in the wet season and allow it to be used in the dry season, their water levels vary significantly throughout the year. For this reason, the lake’s hydrodynamics and water-quality behaviour are altered, as pointed out by Soares et al. [15] and Sharaf et al. [27]. Also, Sharaf et al. [27] noted water-level fluctuations of around 25 metres that are related to dry-season water withdrawal.
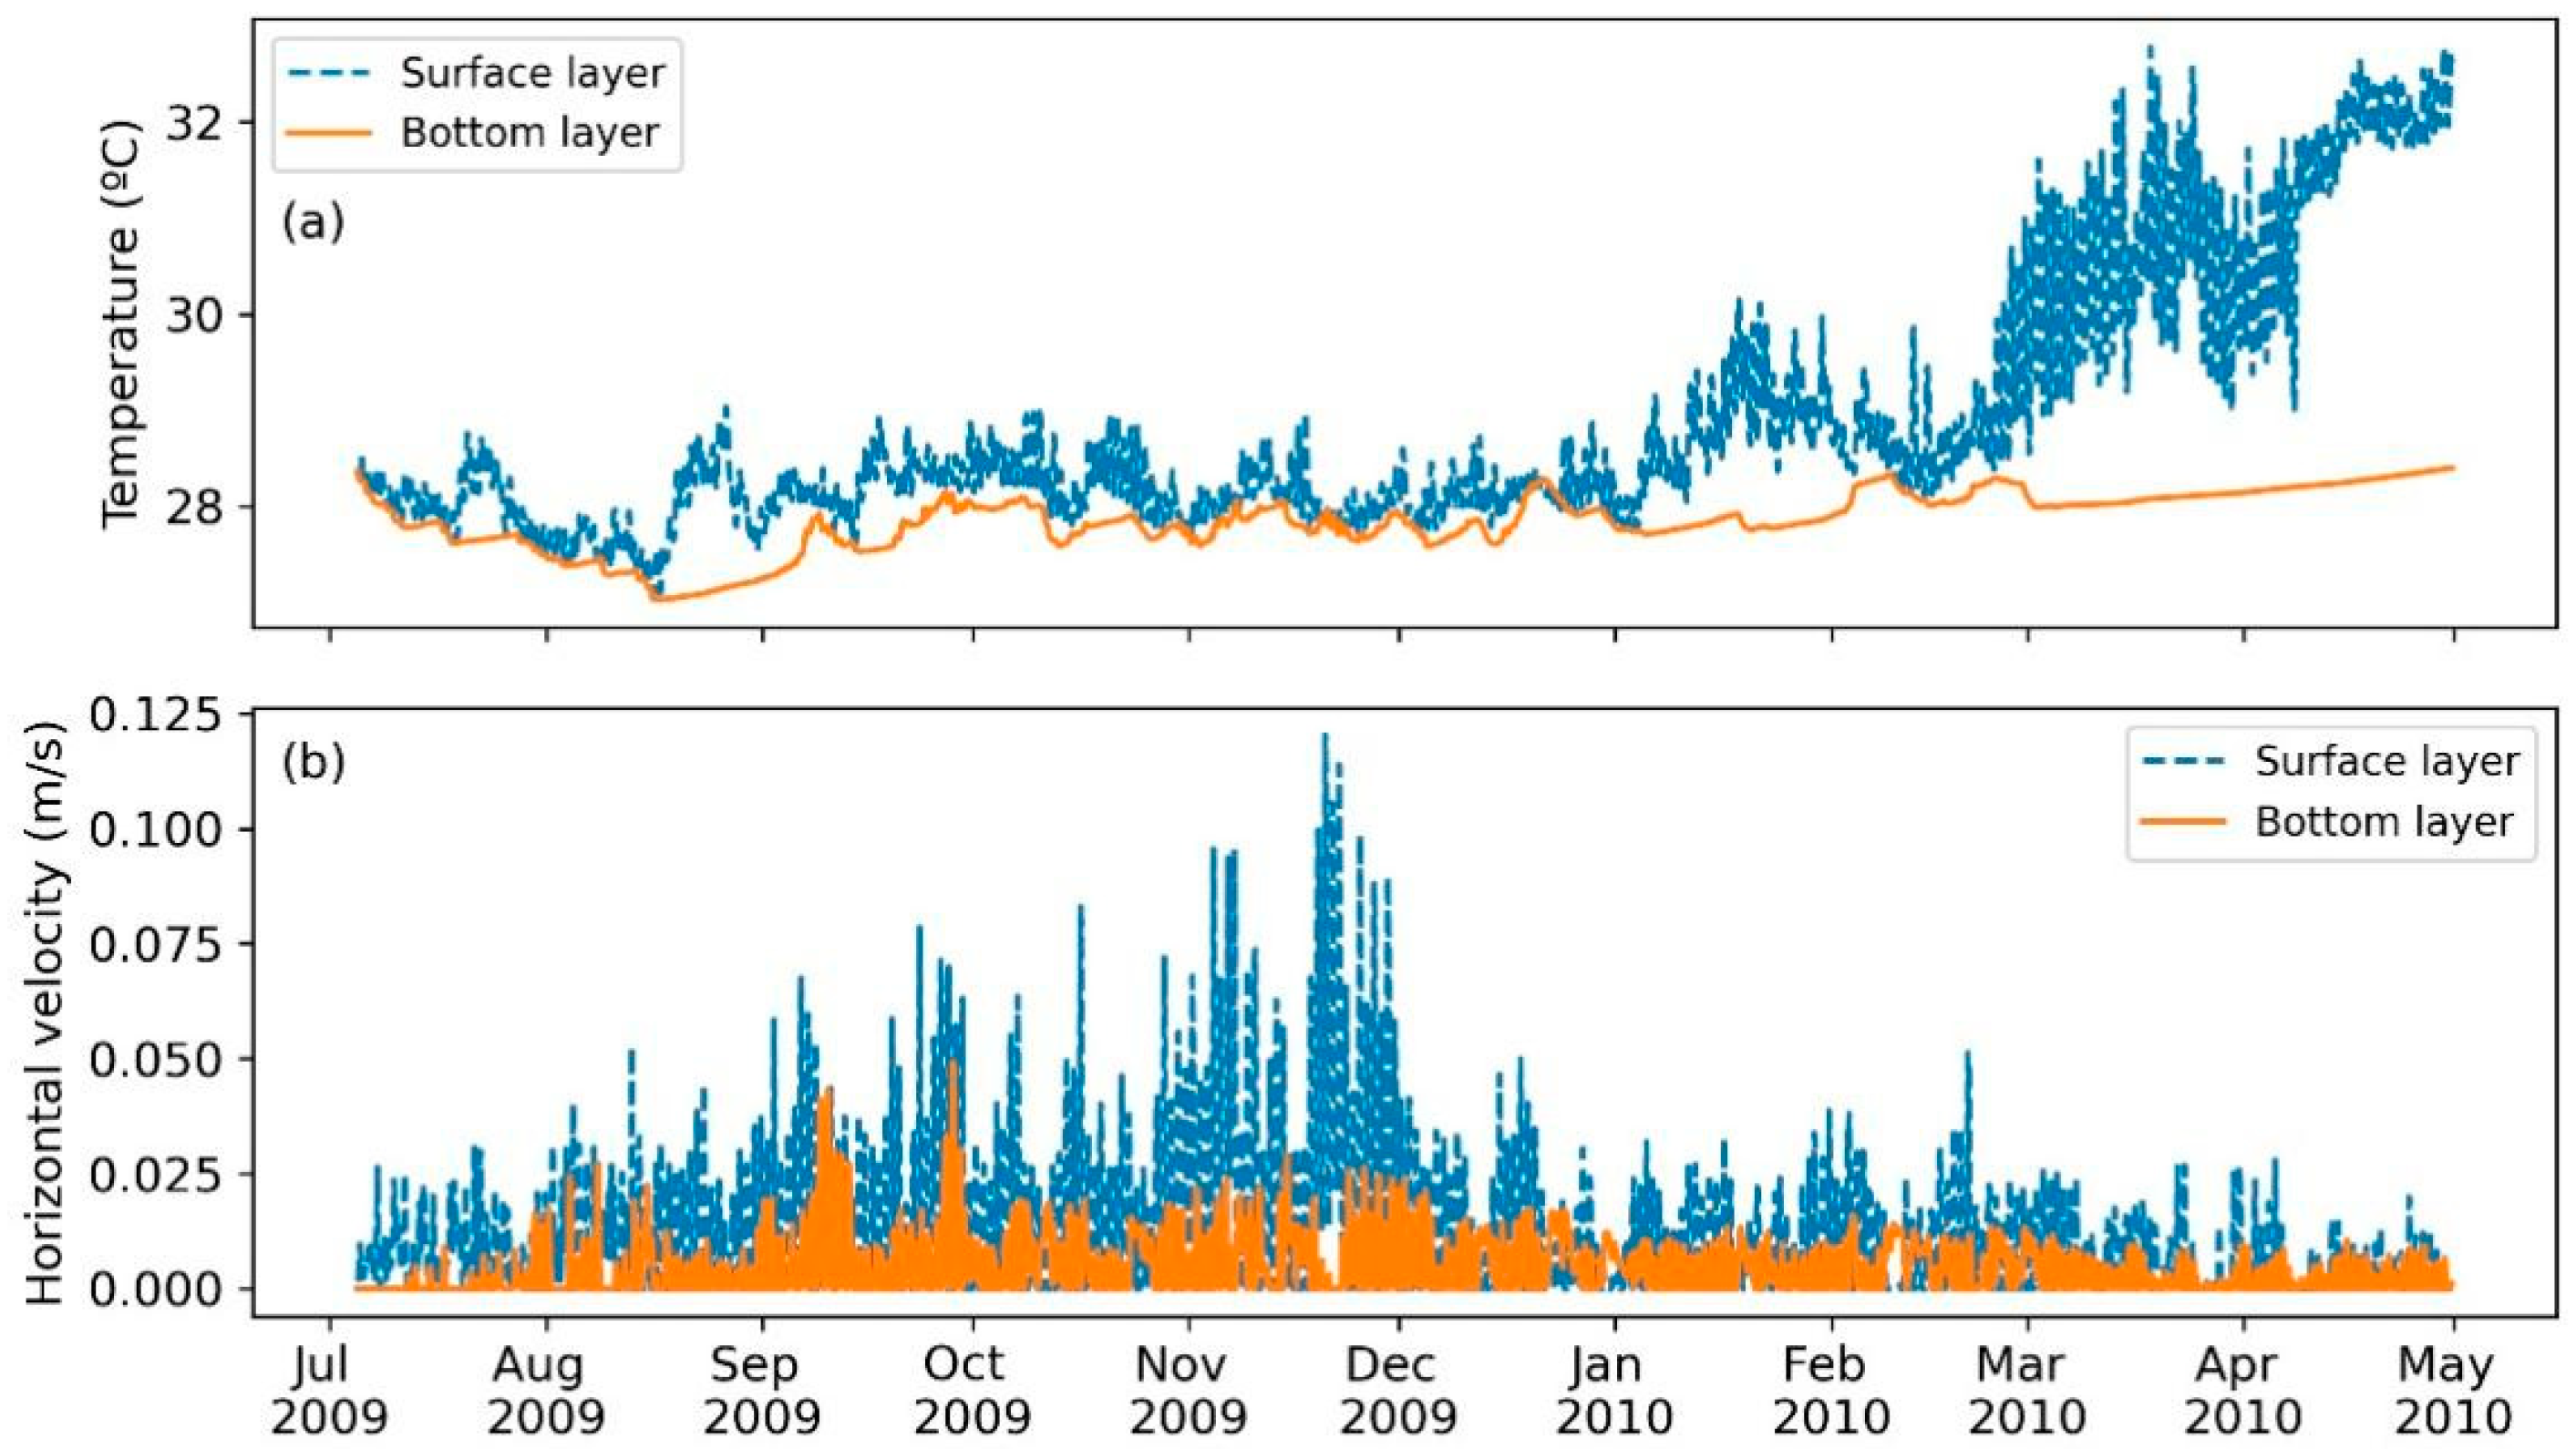
Figure 4 gives the CE-QUAL-W2 hydrodynamic modelling results for the validation segment of the lake (segment near the dam), with time series for water temperature and horizontal velocity. The average temperature of the water surface in the rainy season is 8% higher than the air temperature, at 29.4 °C. Meanwhile, the difference between water and air temperatures for the dry period is less than 1%, indicating a more relevant retaining of heat by the water body in the wet season. The previous scenario could be due to the higher evaporation losses, i.e., energy losses, in the dry season, altering the energy balance of the lake, as previously discussed. In this setting, Saber et al. [25] found that evaporation was the main heat-loss mechanism during summer in a hot semi-arid deep reservoir. Furthermore, higher temperature differences between the surface and bottom are noted when lower wind speeds and higher precipitation rates occur, similarly to França et al. [64]. Contrastingly, Sharaf et al. [27] found a stratified water column during the dry season in a relatively deep semi-arid reservoir in Lebanon. This opposite behaviour observed between the Pentecoste reservoir and the Lebanese one, which are both under semi-arid conditions, may occur because they present alternating wind patterns. In Pentecoste’s location, higher wind speed is noted when there is no rain, while in Lebanon, no rain is associated with lower wind speed.
The surface and bottom-water temperature difference in the Pentecoste reservoir has an average of 1.4 °C in the wet season, while in the dry period, this difference drops to 0.7 °C. This scenario indicates that either wind or rainfall could be a dominant force in this environment. Also, similar to the behaviour observed by Polli and Bleninger [20], the surface-layer temperatures show a higher variability than the bottom ones, reflecting energy absorption from atmospheric conditions through radiation. Note that, for such high temperatures, the water density variation is more significant than for a similar temperature difference in colder regions, which means that a stable pycnocline can develop with a relatively low temperature variation [49]. In addition, it is notable that meteorological forcings are the main driver for the water column’s thermal structure, but they do not act independently. Zouabi-Aloui et al. [13] demonstrated the impacts of fifteen different withdrawal scenarios on a lake’s stratification pattern and found varying temperature gradients with multiple outflow conditions.
Meanwhile, when the horizontal-velocity time series are analysed (Figure 4), the surface-layer velocities follow a similar pattern to that of wind speed. The coefficient of determination between daily wind speed and surface-horizontal velocity equals 0.51, which indicates the wind is a determinant variable in surface-layer velocities, in agreement with the findings of Curtarelli et al. [39]. Periods with higher wind speeds have lower temperature differences between the surface and bottom, which indicates a mixing trend in this period, as expected. The coefficient of determination between wind speed and the temperature difference between the surface and bottom is 0.38, evidencing the existence of a correlation between those two variables. Additionally, in the wet season, the bottom- horizontal velocity was on average 5% lower than that of the surface. For then, the bottom- horizontal velocity in the dry period was 47% lower than the surface one. This discussion indicates that the water column’s circulation is driven by wind force in Pentecoste reservoir, similar to the findings of Zhang et al. [22], where the impact of wind forcing was highlighted as a vital factor determining circulation by analysing the thermal-structure results with and without the wind-speed time series.
In Figure 5, the Ri time series is presented along with the threshold value of 0.25. In agreement with the previous discussions, Ri shows a stable stratification period in the wet season, with values remaining consistently over 0.25. Contrasting with that found by Anis & Singhal [65], and Curtarelli et al. [39], the Pentecoste reservoir did not exhibit significant diurnal variability in stratification, although a seasonal pattern was notably present (see Supplementary Material, Figure S1).
Moreover, to understand the influence of meteorological forcing on stratification, the Ri temporal response needs to be evaluated with meteorological time series, because Ri cannot solely determine if external forcing favours the development of stratification (see Kirilin & Shatwell [30]). The stratification in the Pentecoste reservoir tends to remain stable when lower wind speeds and higher precipitation rates occur, as observed by França et al. [64] and Garcia et al. [66]. We expected a mixing condition for Pentecoste reservoir in the wet period due to the impact of inflow velocities on the reservoir’s stability, as found by Sharaf et al. [27]. However, as the inflow rates are notably low and scarce, this scenario does not occur.
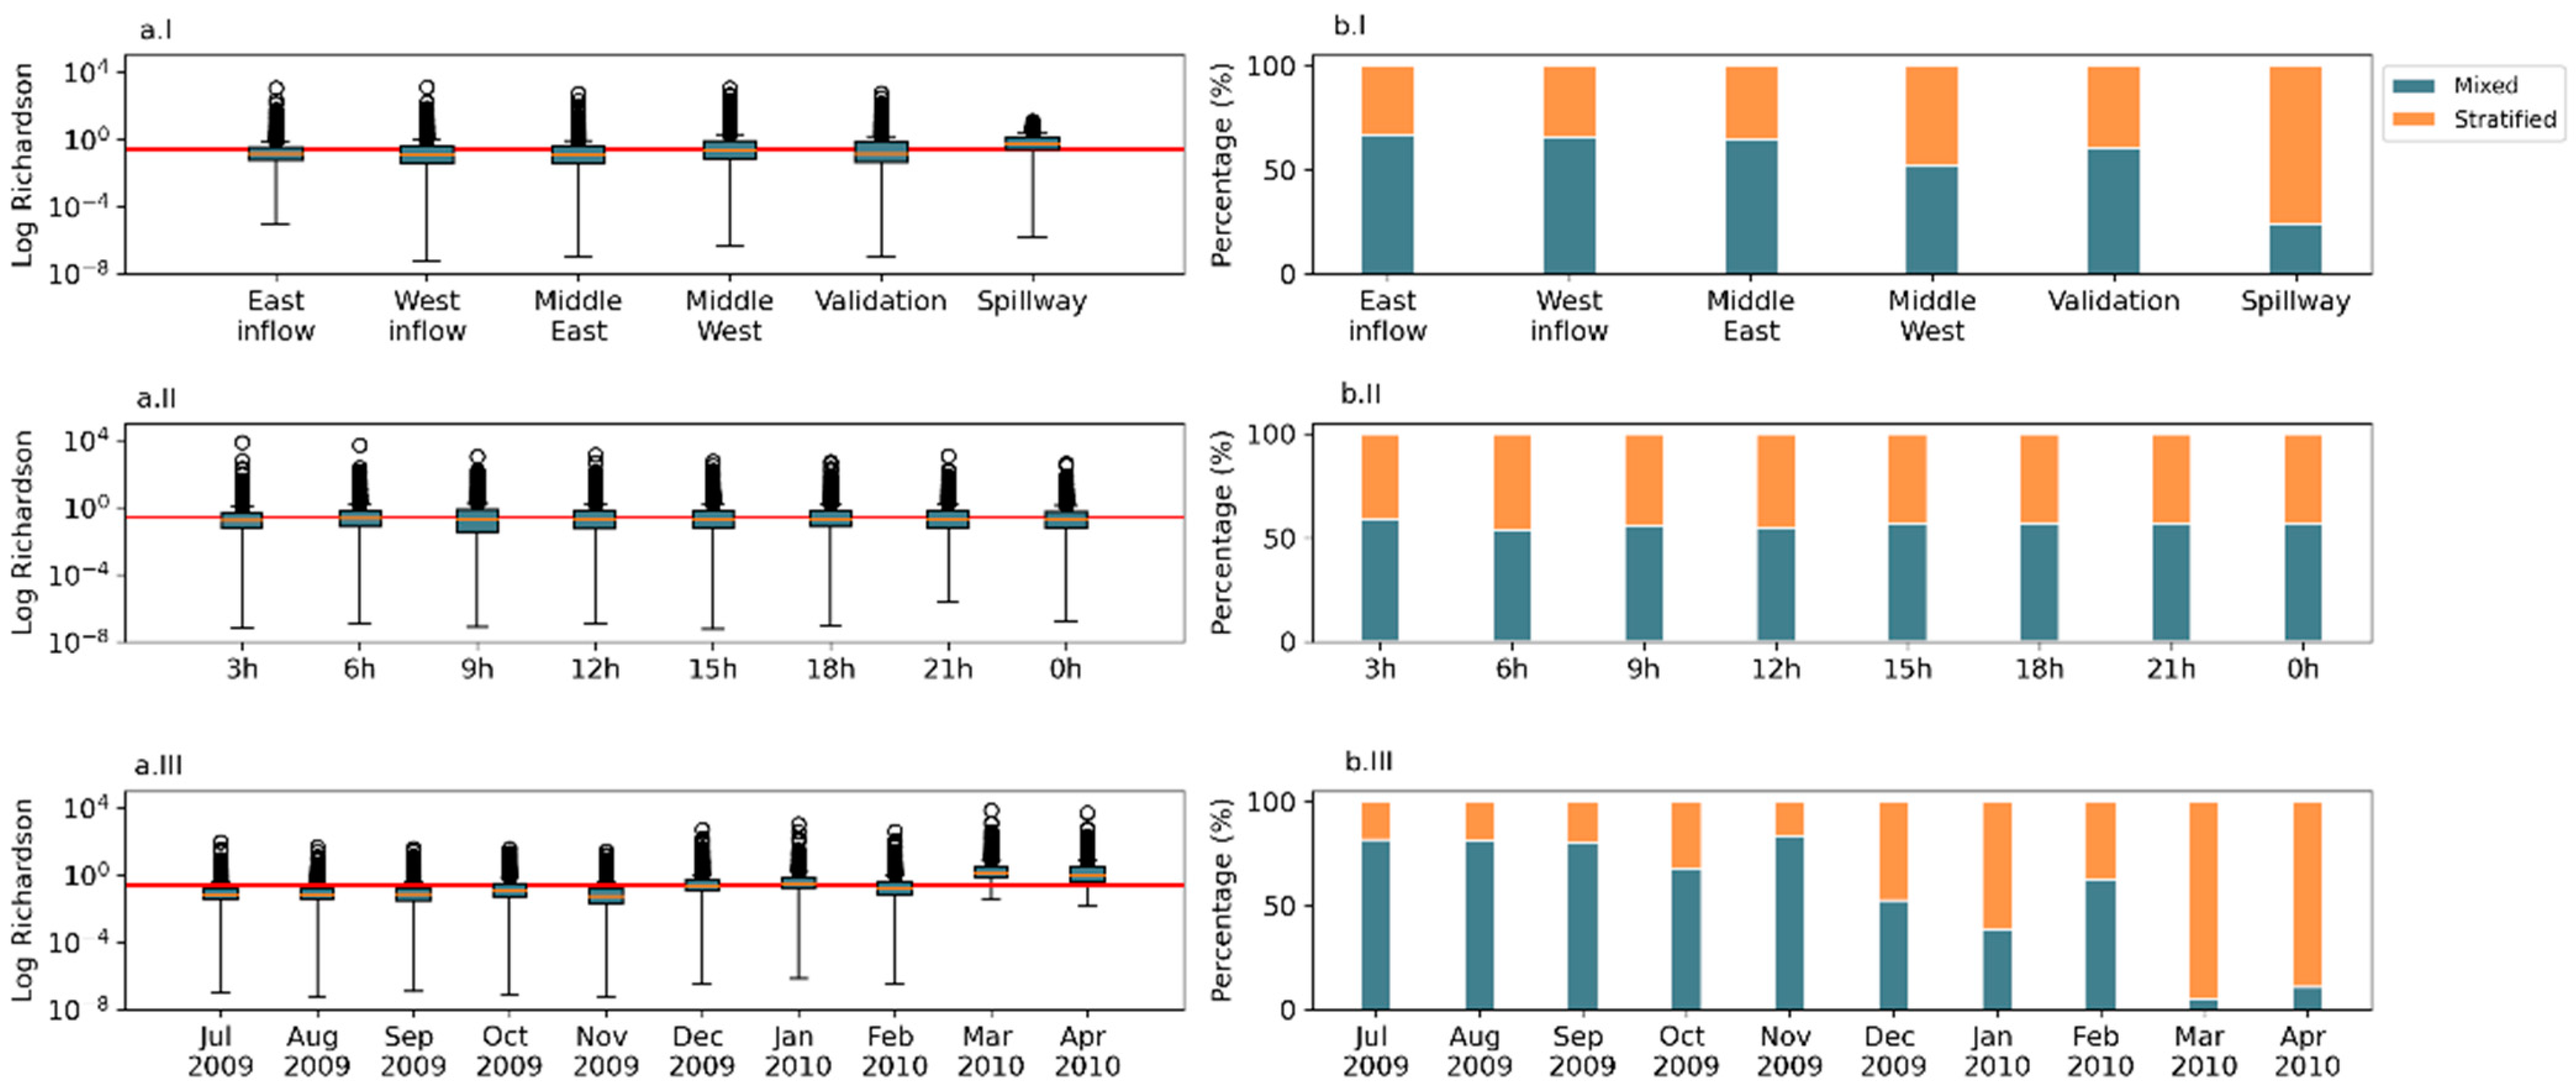
On this basis, Figure 6 introduces Ri spatial and temporal (hourly and monthly) evaluations to observe which variability is higher. Boxplots are plotted accordingly to the analysed variability with a highlight on the thermal-structure breakdown (Ri = 0.25) in subplot (a). Subplot (b) shows the frequency at which the water column is mixed and stratified. The spatial analysis indicates remarkable differences among segments only for the one closer to the spillway, in which the stratification remains stable (>0.25) most of the time. This scenario follows the expected since the area near the dam is the deepest region of the reservoir; therefore, it is more susceptible to temperature stratification. The monthly and hourly evaluations for each segment were developed, and the previous statement was confirmed (see Supplementary Material, Figures S2 and S3). This result is similar to what Zhang et al. [22] found in an Australian reservoir, with thermal stratification observed near the dam. Equally, Lacerda et al. [3] found a well-established stratification pattern in the deepest region of a large semi-arid reservoir.
Furthermore, the impact of seasonal variability on Pentecoste’s stratification is clearly shown in Figure 6, as the reservoir remains stratified in March and April of 2010 when higher precipitation rates and lower wind speeds occur. On this basis, Saber et al. [25] also found that seasonal climate variations remarkably influenced the water column’s stability. Similarly, Xing et al. [46] observed lower Ri values when higher and more uniform wind occurred. As for nictemeral variations, i.e., variability through the day, in the Pentecoste reservoir, they are insignificant, since the portion of time that the lake remains stratified is almost constant throughout the hours (Figure 6b.II), contrasting with what was found by Xing et al. [46].
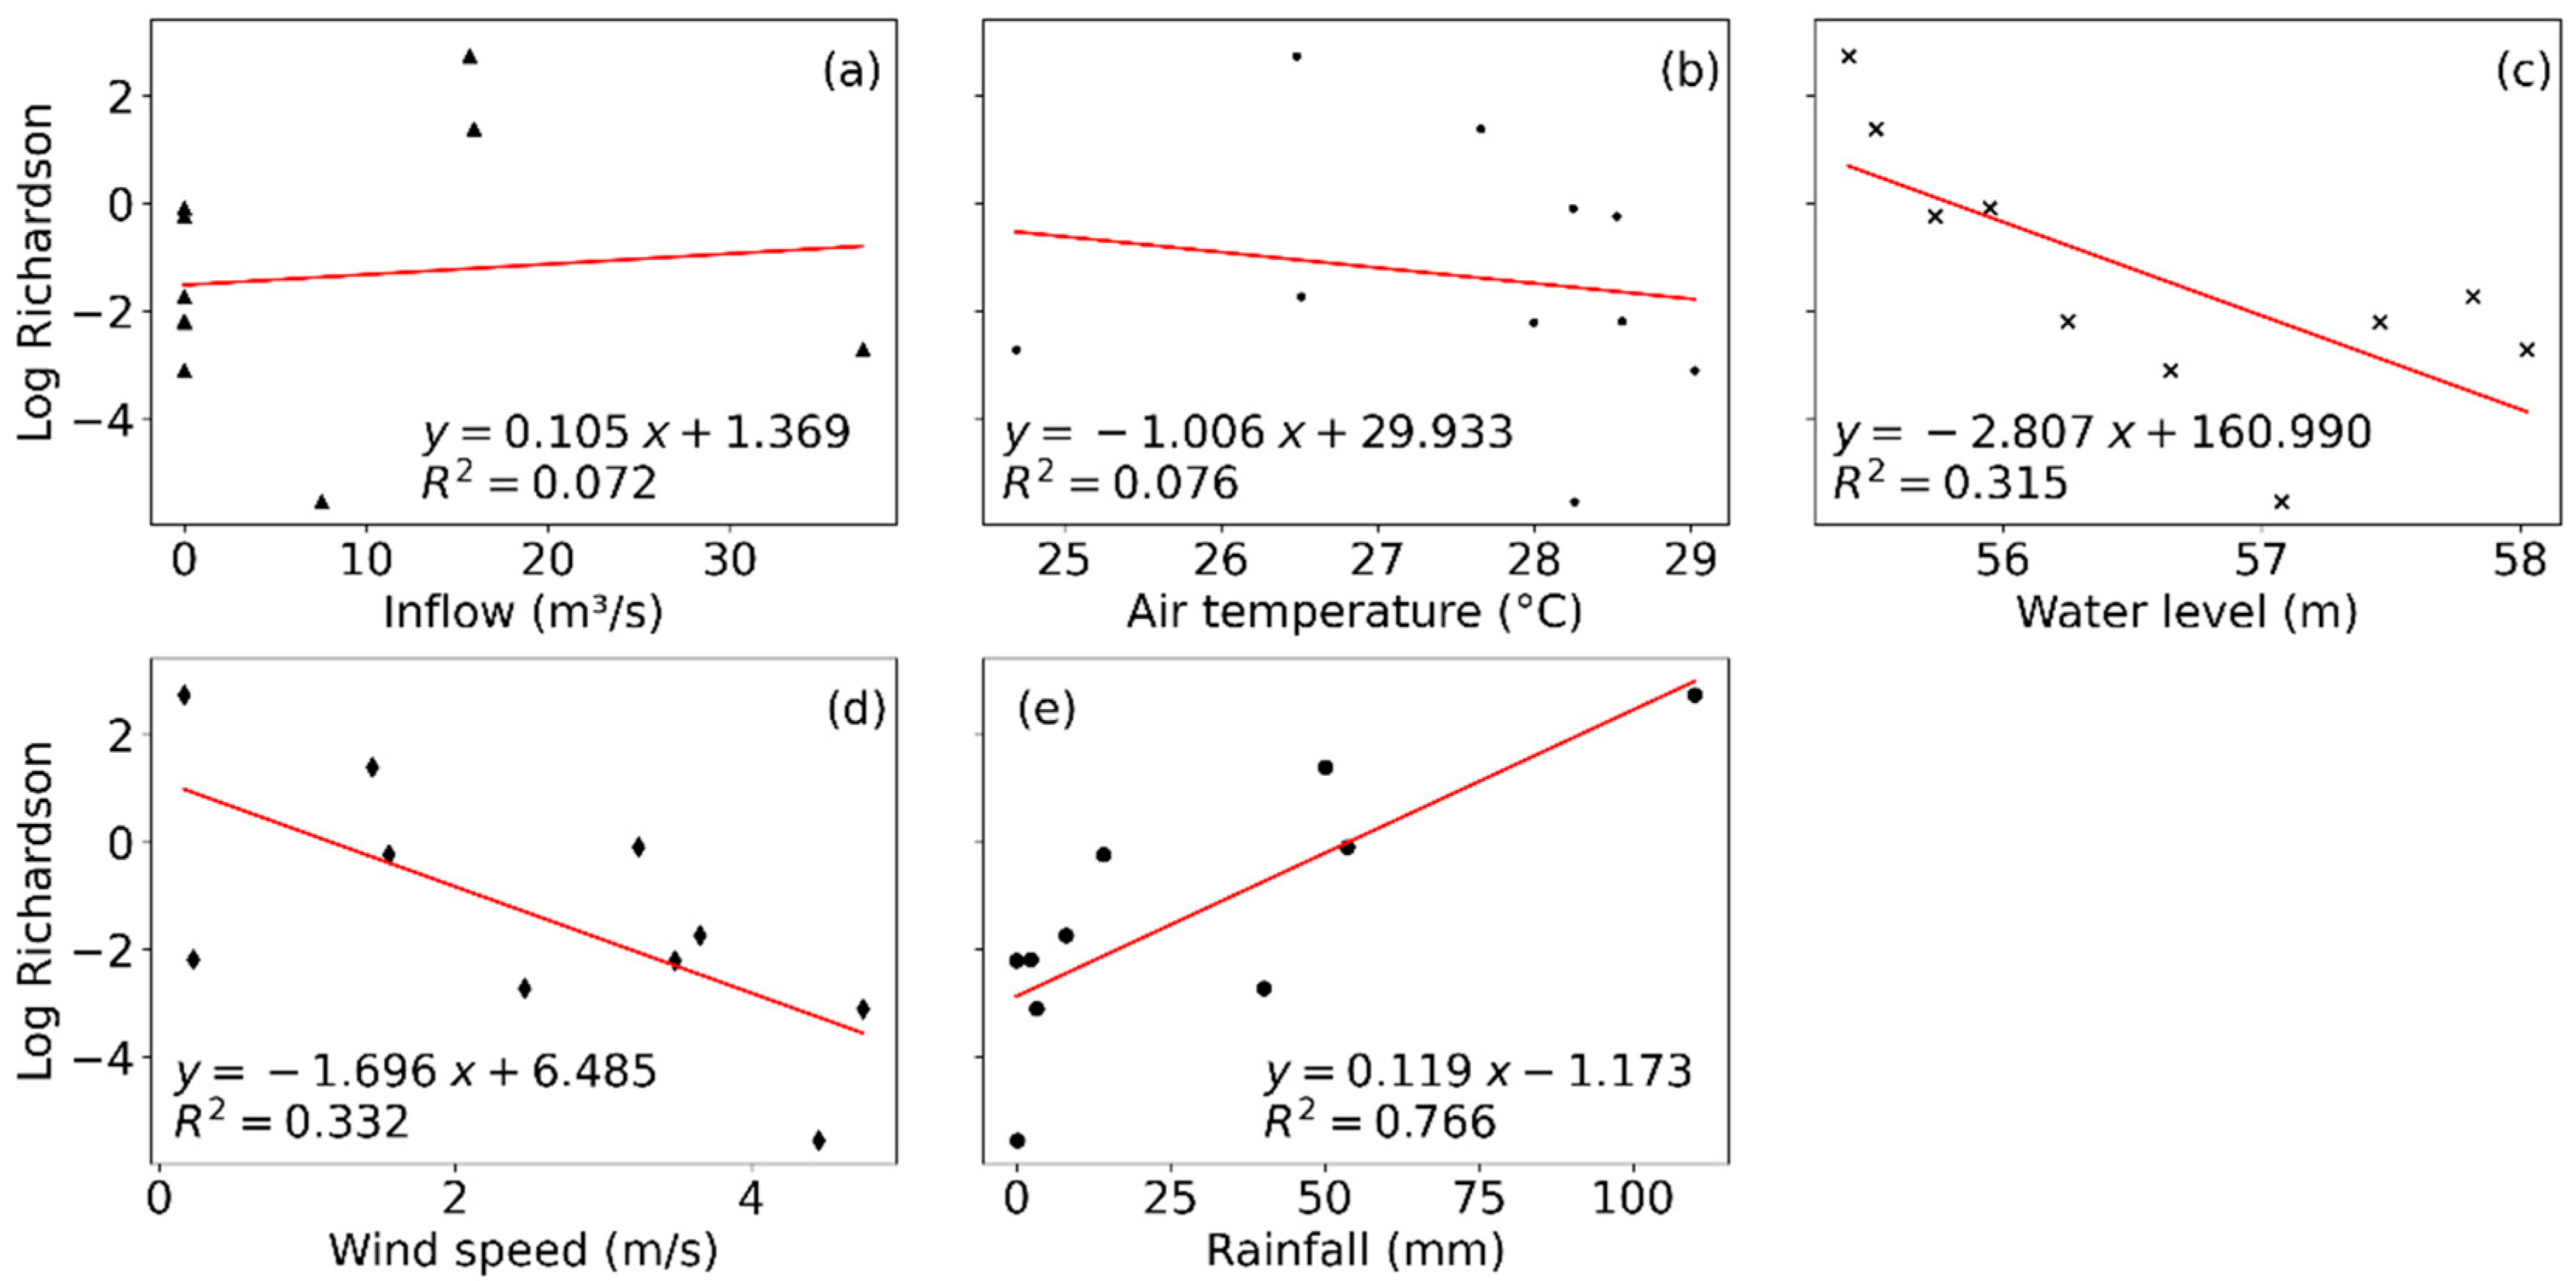
The correlation of monthly Ri and each forcing was developed to quantify the analysed the forcing which impacts most on the lake’s stratification pattern, as shown in Figure 7. A monthly timescale was adopted due to the seasonal effects on stratification and knowing Ri presents high oscillation in a daily basis. The latter statement indicates an increase or decrease in the stratification’s stability. From a management perspective, it is important to know whether the water column is stratified or fully mixed along with its drivers. Thus, the variables with stronger coefficients of determination were rainfall (r2 of 0.77), wind speed (r2 of 0.33), and water level (r2 of 0.31). Air temperature and inflow relationships with Ri did not significantly explain the variations in the data.
According to the evaluation criteria proposed by Moriasi et al. [67], the results indicate that rainfall has a good coefficient of determination and is the main factor determining the Pentecoste reservoir stratification. This condition means that, during the wet season, the water column tends to be in a stratified state. Physically, rainfall may cause a density current of colder water in the deepest region of the lake along with the retainment of heat on the surface, as lower wind speeds and barely any evaporation are noted. The previous condition favours the development of temperature followed by density gradients and, consequently, stratification. On the other hand, wind speed and water level showed no satisfactory results. In contrast, Han et al. [50] studied the hydrodynamics of a Spanish reservoir using a 1-D model and found that its thermal structure is mainly controlled by inflow. Also, Santos et al. [68] found that decreasing water depth associated with high wind speeds led to a breaking of the water column’s stability.
Moreover, as previously discussed, the results indicate that the precipitation represents most of the thermal stratification’s variability since the relationship between rainfall and Ri explains more than 75% of the variations in the data. In the wet season, inflow temperatures are usually lower than the water temperature in the reservoir. This condition can potentially induce an underflow in the lake followed by stratification of the water column developed not by heating the water surface but by cooling its deeper layer. Accordingly, Curtarelli et al. [39] noted river inflow as a contributor to the water column’s stability with higher-temperature gradients in the river-reservoir transition zone. Also, Plec et al. [42] found underflow conditions in a tropical reservoir.
Additionally, with the proposed Ri and precipitation curve, the thermal stratification is stable when monthly precipitation rates reach around 60 mm. This is a management threshold as thermal stratification is usually associated with worse water quality. Therefore, this information might be considered for reservoir’s operation. Note that wet seasons have lower wind speeds, favouring the stratification process. Contrasting to the above, Zhang et al. [22] found that rainfall hardly influenced the thermal stratification of a temperate reservoir, with the thermal structure of the water body depending on both the maximum depth of the water column and wind conditions. Ma et al. [24] analysed a semi-arid reservoir with a remarkable seasonal behaviour of inflows, as in Pentecoste reservoir, and concluded that the complete mixing of the reservoir is likely the result of variations mainly in air temperature and wind, not mentioning the rainfall impact. Hence, during drought periods, the reservoir remains at a lower water level, which could potentially favour the mixing of the water column. Even though this scenario might indicate a better water quality, a lower volume in the reservoir means less self-purification capability, highlighting a complex issue.
The results of the Pentecoste reservoir did not exhibit a significant influence of the air temperature on its thermal structure, in agreement with Magee and Wu [41]. Contrastingly, Liu et al. [33] analysed a reservoir with an average depth of 30 m in China and found that the increased air temperature significantly affected the thermal stability of the hypolimnion layer during spring.
As for water level, in contrast to the findings of this study, Li et al. [1] and Lacerda et al. [3] concluded that water-level drawdown significantly influences the lake’s thermal stratification. Furthermore, Curtarelli et al. [39] found that the thermal structure of a Brazilian reservoir is influenced by many environmental factors, although none of these studies proposed a quantitative evaluation.
Overall, the results of this research are representative for other reservoirs with similar environmental conditions as the ones located in the Northeast region of Brazil, since they are all under the same meteorological-hydrological regimes: inflows limited to the wet season and stronger wind speeds in the dry period [69,70,71,72]. The marked stratification pattern observed in the wet season suggests that periods with high storage volumes probably have poor water quality. This is confirmed by Rocha and Lima Neto [69,70], who noted peaks of external-phosphorus loads during the wet period, which favoured the reservoir’s water-quality deterioration. On the other hand, Carneiro et al. [72] found a more stable stratification pattern in the wet period, which was associated with very low dissolved-oxygen levels below the thermocline and internal-phosphorus release from the bottom sediment to the water column. However, it is important to stress that severe drought periods may present a complex behaviour as lower water volume indicates both mixing conditions, a state usually associated with better water quality, and less self-purification efficiency, which is one of the circumstances indicative of poor water quality. Therefore, future studies under severe drought conditions are suggested, as poor water quality has also been related to low water volumes and higher wind speeds, as reported by Rocha and Lima Neto [71].
Previous findings can help improve the regional water-management tools, even though it is important to highlight that more extended calibration and validation periods with dry and wet seasons in both phases to improve model’s reliability. We also suggest further investigation into the water-quality behaviour of Pentecoste reservoir, along with conjunct evaluations of hydrodynamics, especially during severe drought periods.

4. Conclusions

The thermal regime of Pentecoste reservoir, a multiple-use lake with a maximum depth of about 20 metres located in the Brazilian semi-arid region, was analysed with Richardson’s number (Ri) by using the laterally averaged CE-QUAL-W2 model.
The main findings were that seasonality is the dominant variability for the lake’s thermal structure, with higher stratification stability occurring during the wet season and potentially promoting poorer water quality. This resulted in a strong coefficient of determination between Ri and rainfall (r2 of 0.77) and a monthly rainfall threshold of 60 mm for the initiation of stratification of the water column. Seasonal variance of meteorological forcing proved to influence most on the lake’s stratification pattern, as no significant nictemeral variability, i.e., variability through the day, on the thermal structure of the reservoir was observed. Contrastingly, Ri showed no significant spatial variability along the reservoir.
This study advances the knowledge of dryland-reservoir dynamics, although limitations need to be highlighted. Among them, data for the model set-up is not available. The lack of measurements spatially distributed in the reservoir is also a weakness. Therefore, as recommendations for future research, we suggest that the measurements are made through an extended period, e.g., at least two years, allowing for both calibration and validation processes to be developed for all seasons. Ideally, data collection would take place in multiple sampling points in the lake and also including severe drought periods and water-quality parameters. As for meteorological data, installing a weather station in-loco would be beneficial.
Finally, the results presented in this study can lead to an improvement in water- management tools, as Pentecoste reservoir has a more stable stratification pattern and probably poorer water quality in the wet season. On the other hand, future studies under severe drought conditions are suggested, as poor water quality has also been related to low water volumes.

Supplementary Materials

The following supporting information can be downloaded at: https://www.mdpi.com/article/10.3390/su142316051/s1, Figure S1: Modelled and measured temperature profiles for the calibration period; Figure S2: Modelled and measured temperature profiles for the validation period; Figure S3: Pentecoste reservoir’s variability in Richardson’s Number (validation segment); Figure S4: Richardson’s hourly evaluation for each analysed segment. The red line represents the threshold Ri = 0.25; Figure S5: Richardson’s monthly evaluation for each analysed segment. The red line represents the threshold Ri = 0.25.

Author Contributions

Conceptualization, S.M.G.R., F.d.A.d.S.F. and I.E.L.N.; methodology, S.M.G.R., F.d.A.d.S.F. and I.E.L.N.; software, S.M.G.R., J.V.B.d.S. and W.E.D.L.; validation, W.E.D.L.; formal analysis S.M.G.R., J.V.B.d.S., W.E.D.L. and I.E.L.N.; investigation, W.E.D.L. and S.M.G.R.; resources, F.d.A.d.S.F. and I.E.L.N.; data curation, W.E.D.L.; writing—original draft preparation, S.M.G.R.; writing—review and editing, S.M.G.R. and I.E.L.N.; visualization, S.M.G.R., J.V.B.d.S., F.d.A.d.S.F. and I.E.L.N.; supervision, F.d.A.d.S.F. and I.E.L.N.; project administration, F.d.A.d.S.F. and I.E.L.N.; funding acquisition, F.d.A.d.S.F. and I.E.L.N. All authors have read and agreed to the published version of the manuscript.

Funding

This research was funded by the Coordination for the Improvement of Higher Education Personnel—CAPES [Research Grant PROEX 04/2021], National Council for Scientific and Technological Development—CNPq and Ceará State Research Foundation—FUNCAP [Research Grant PNE-0112-00042.01.00/16].

Institutional Review Board Statement

Not applicable.

Informed Consent Statement

Not applicable.

Data Availability Statement

Upon request.

Acknowledgments

The present study was supported by the Coordination for the Improvement of Higher Education Personnel—CAPES [Research Grant PROEX 04/2021], the National Council for Scientific and Technological Development—CNPq, and the Ceará State Research Foundation—FUNCAP [Research Grant PNE-0112-00042.01.00/16]. We thank Sophie Mowbray, from Lancaster University, for providing this study’s final English language review.

Conflicts of Interest

The authors declare no conflict of interest.

References

  1. Li, Y.; Acharya, K.; Chen, D.; Stone, M. Modeling Water Ages and Thermal Structure of Lake Mead under Changing Water Levels. Lake Reserv. Manag. 2010, 26, 258–272. [Google Scholar] [CrossRef]
  2. de Araújo, J.C.; Mamede, G.L.; de Lima, B.P. Hydrological Guidelines for Reservoir Operation to Enhance Water Governance: Application to the Brazilian Semiarid Region. Water 2018, 10, 1628. [Google Scholar] [CrossRef] [Green Version]
  3. de Lacerda, L.D.; Santos, J.A.; Marins, R.V.; Da Silva, F.A.T.F. Limnology of the Largest Multi-Use Artificial Reservoir in NE Brazil: The Castanhão Reservoir, Ceará State. An. Acad. Bras. Cienc. 2018, 90, 2073–2096. [Google Scholar] [CrossRef] [PubMed] [Green Version]
  4. Azadi, F.; Ashofteh, P.S.; Chu, X. Evaluation of the Effects of Climate Change on Thermal Stratification of Reservoirs. Sustain. Cities Soc. 2020, 66, 102531. [Google Scholar] [CrossRef]
  5. Mesquita, J.B.d.F.; Lima Neto, I.E.; Raabe, A.; de Araújo, J.C. The Influence of Hydroclimatic Conditions and Water Quality on Evaporation Rates of a Tropical Lake. J. Hydrol. 2020, 590, 125456. [Google Scholar] [CrossRef]
  6. de Araújo, J.C.; Piedra, J.I.G. Comparative Hydrology: Analysis of a Semiarid and a Humid Tropical Watershed. Hydrol. Process. 2009, 23, 1169–1178. [Google Scholar] [CrossRef]
  7. Lima Neto, I.E. Impact of Artificial Destratification on Water Availability of Reservoirs in the Brazilian Semiarid. An. Acad. Bras. Cienc. 2019, 91, 1–12. [Google Scholar] [CrossRef] [Green Version]
  8. Raulino, J.B.S.; Silveira, C.S.; Lima Neto, I.E. Assessment of Climate Change Impacts on Hydrology and Water Quality of Large Semi-Arid Reservoirs in Brazil. Hydrol. Sci. J. 2021, 66, 1321–1336. [Google Scholar] [CrossRef]
  9. Wiegand, M.C.; do Nascimento, A.T.P.; Costa, A.C.; Lima Neto, I.E. Trophic State Changes of Semi-Arid Reservoirs as a Function of the Hydro-Climatic Variability. J. Arid Environ. 2021, 184, 104321. [Google Scholar] [CrossRef]
  10. Mamede, G.L.; Araújo, N.A.M.; Schneider, C.M.; De Araújo, J.C.; Herrmann, H.J. Overspill Avalanching in a Dense Reservoir Network. Proc. Natl. Acad. Sci. USA 2012, 109, 7191–7195. [Google Scholar] [CrossRef]
  11. Rabelo, U.P.; Dietrich, J.; Costa, A.C.; Simshauser, M.N.; Scholz, F.E.; Nguyen, V.T.; Lima Neto, I.E. Representing a dense network of ponds and reservoirs in a semi-distributed dryland catchment model. J. Hydrol. 2021, 603, 127103. [Google Scholar] [CrossRef]
  12. Chung, S.W.; Imberger, J.; Hipsey, M.R.; Lee, H.S. The Influence of Physical and Physiological Processes on the Spatial Heterogeneity of a Microcystis Bloom in a Stratified Reservoir. Ecol. Modell. 2014, 289, 133–149. [Google Scholar] [CrossRef]
  13. Zouabi-Aloui, B.; Adelana, S.M.; Gueddari, M. Effects of Selective Withdrawal on Hydrodynamics and Water Quality of a Thermally Stratified Reservoir in the Southern Side of the Mediterranean Sea: A Simulation Approach. Environ. Monit. Assess. 2015, 187, 1–19. [Google Scholar] [CrossRef] [PubMed]
  14. Yang, Z.; Xu, P.; Liu, D.; Ma, J.; Ji, D.; Cui, Y. Hydrodynamic Mechanisms Underlying Periodic Algal Blooms in the Tributary Bay of a Subtropical Reservoir. Ecol. Eng. 2018, 120, 6–13. [Google Scholar] [CrossRef]
  15. Soares, L.M.V.; Silva, T.F.d.G.; Vinçon-Leite, B.; Eleutério, J.C.; de Lima, L.C.; Nascimento, N.d.O. Modelling Drought Impacts on the Hydrodynamics of a Tropical Water Supply Reservoir. Inland Waters 2019, 9, 422–437. [Google Scholar] [CrossRef]
  16. Ziaie, R.; Mohammadnezhad, B.; Taheriyoun, M.; Karimi, A.; Amiri, S. Evaluation of Thermal Stratification and Eutrophication in Zayandeh Roud Dam Reservoir Using Two-Dimensional CE-QUAL-W2 Model. J. Environ. Eng. 2019, 145, 05019001. [Google Scholar] [CrossRef]
  17. Shilei, Z.; Yue, S.; Tinglin, H.; Ya, C.; Xiao, Y.; Zizhen, Z.; Yang, L.; Zaixing, L.; Jiansheng, C.; Xiao, L. Reservoir Water Stratification and Mixing Affects Microbial Community Structure and Functional Community Composition in a Stratified Drinking Reservoir. J. Environ. Manag. 2020, 267, 110456. [Google Scholar] [CrossRef]
  18. Barbosa, C.C.; Calijuri, M.d.C.; dos Santos, A.C.A.; Ladwig, R.; de Oliveira, L.F.A.; Buarque, A.C.S. Future Projections of Water Level and Thermal Regime Changes of a Multipurpose Subtropical Reservoir (Sao Paulo, Brazil). Sci. Total Environ. 2021, 770, 144741. [Google Scholar] [CrossRef]
  19. Bruce, L.C.; Frassl, M.A.; Arhonditsis, G.B.; Gal, G.; Hamilton, D.P.; Hanson, P.C.; Hetherington, A.L.; Melack, J.M.; Read, J.S.; Rinke, K.; et al. A Multi-Lake Comparative Analysis of the General Lake Model (GLM): Stress-Testing across a Global Observatory Network. Environ. Model. Softw. 2018, 102, 274–291. [Google Scholar] [CrossRef] [Green Version]
  20. Polli, B.A.; Bleninger, T. Comparison of 1D and 3D Reservoir Heat Transport Models and Temperature Effects on Mass Transport. Rev. Bras. Recur. Hidricos 2019, 24, 1–19. [Google Scholar] [CrossRef]
  21. Soares, L.M.V.; Calijuri, M.d.C.; Silva, T.F.d.G.; Moraes Novo, E.M.L.d.; Cairo, C.T.; Barbosa, C.C.F. A Parameterization Strategy for Hydrodynamic Modelling of a Cascade of Poorly Monitored Reservoirs in Brazil. Environ. Model. Softw. 2020, 134, 104803. [Google Scholar] [CrossRef]
  22. Zhang, F.; Zhang, H.; Bertone, E.; Stewart, R.; Lemckert, C.; Cinque, K. Numerical Study of the Thermal Structure of a Stratified Temperate Monomictic Drinking Water Reservoir. J. Hydrol. Reg. Stud. 2020, 30, 100699. [Google Scholar] [CrossRef]
  23. Ishikawa, M.; Bleninger, T.; Lorke, A. Hydrodynamics and Mixing Mechanisms in a Subtropical Reservoir. Inland Waters 2021, 11, 286–301. [Google Scholar] [CrossRef]
  24. Ma, S.; Kassinos, S.C.; Fatta Kassinos, D.; Akylas, E. Effects of Selective Water Withdrawal Schemes on Thermal Stratification in Kouris Dam in Cyprus. Lakes Reserv. Res. Manag. 2008, 13, 51–61. [Google Scholar] [CrossRef]
  25. Saber, A.; James, D.E.; Hayes, D.F.; Moret, G.J.M. Effects of Seasonal Fluctuations of Surface Heat Flux and Wind Stress on Mixing and Vertical Diffusivity of Water Column in Deep Lakes. Adv. Water Resour. 2018, 119, 150–163. [Google Scholar] [CrossRef]
  26. Freire, L.L.; Costa, A.C.; Lima Neto, I.E. Spatio-temporal Patterns of River Water Quality in the Semiarid Northeastern Brazil. Water Air Soil Pollut. 2021, 232, 452. [Google Scholar] [CrossRef]
  27. Sharaf, N.; Lemaire, B.J.; Fadel, A.; Slim, K.; Vinçon-Leite, B. Assessing the Thermal Regime of Poorly Monitored Reservoirs with a Combined Satellite and Three-Dimensional Modeling Approach. Inland Waters 2021, 11, 302–314. [Google Scholar] [CrossRef]
  28. Krisnayanti, D.S.; Bunganaen, W.; Frans, J.H.; Seran, Y.A.; Legono, D. Curve Number Estimation for Ungauged Watershed in Semi-Arid Regiom. Civ. Eng. J. 2021, 7, 1070–1083. [Google Scholar] [CrossRef]
  29. Kasri, J.E.; Lahmili, A.; Soussi, H.; Jaouda, I.; Bentaher, M. Trend Analysis of Meteorological Variables: Rainfall and Temperature. Civ. Eng. J. 2021, 7, 1868–1879. [Google Scholar] [CrossRef]
  30. Kirillin, G.; Shatwell, T. Generalized Scaling of Seasonal Thermal Stratification in Lakes. Earth-Sci. Rev. 2016, 161, 179–190. [Google Scholar] [CrossRef]
  31. Boegman, L.; Sleep, S. Feasibility of Bubble Plume Destratification of Central Lake Erie. J. Hydraul. Eng. 2012, 138, 985–989. [Google Scholar] [CrossRef]
  32. Noori, R.; Berndtsson, R.; Franklin Adamowski, J.; Rabiee Abyaneh, M. Temporal and Depth Variation of Water Quality Due to Thermal Stratification in Karkheh Reservoir, Iran. J. Hydrol. Reg. Stud. 2018, 19, 279–286. [Google Scholar] [CrossRef]
  33. Liu, M.; Zhang, Y.; Shi, K.; Zhu, G.; Wu, Z.; Liu, M.; Zhang, Y. Thermal Stratification Dynamics in a Large and Deep Subtropical Reservoir Revealed by High-Frequency Buoy Data. Sci. Total Environ. 2019, 651, 614–624. [Google Scholar] [CrossRef] [PubMed]
  34. Moura, D.S.; Lima Neto, I.E.; Clemente, A.; Oliveira, S.; Pestana, C.J.; Aparecida de Melo, M.; Capelo-Neto, J. Modeling Phosphorus Exchange between Bottom Sediment and Water in Tropical Semiarid Reservoirs. Chemosphere 2020, 246, 125686. [Google Scholar] [CrossRef]
  35. Lu, J.; Liu, T.; Zhang, X.; Gao, R.; Liu, Y. A Dynamic Flux Model for Analyses of Phosphorus Exchange between Overlying Water and Sedimentary Deposits of a Reservoir in the Cold Area of North China. Ecol. Eng. 2021, 161, 106116. [Google Scholar] [CrossRef]
  36. Lewis, W.M., Jr. Tropical Lakes: How Latitude Makes a Difference. Perspect. Trop. Limnol. 1996, 43–64. [Google Scholar]
  37. Imberger, J. Flux Paths in a Stratified Lake: A Review. Coast Estuar. Stud. (Phys. Proc. Lakes Ocean.) 1998, 54, 1–17. [Google Scholar] [CrossRef]
  38. Rouse, W.R.; Oswald, C.M.; Binyamin, J.; Blanken, P.D.; Schertzer, W.M.; Spence, C. Interannual and Seasonal Variability of the Surface Energy Balance and Temperature of Central Great Slave Lake. J. Hydrometeorol. 2003, 4, 720–730. [Google Scholar] [CrossRef]
  39. Curtarelli, M.P.; Alcântara, E.; Rennó, C.D.; Assireu, A.T.; Bonnet, M.P.; Stech, J.L. Modelling the Surface Circulation and Thermal Structure of a Tropical Reservoir Using Three-Dimensional Hydrodynamic Lake Model and Remote-Sensing Data. Water Environ. J. 2014, 28, 516–525. [Google Scholar] [CrossRef]
  40. Chen, G.; Fang, X.; Devkota, J. Understanding Flow Dynamics and Density Currents in a River-Reservoir System under Upstream Reservoir Releases. Hydrol. Sci. J. 2016, 61, 2411–2426. [Google Scholar] [CrossRef] [Green Version]
  41. Magee, M.R.; Wu, C.H. Response of Water Temperatures and Stratification to Changing Climate in Three Lakes with Different Morphometry. Hydrol. Earth Syst. Sci. 2017, 21, 6253–6274. [Google Scholar] [CrossRef]
  42. Plec, D.F.; das Graças Silva, T.F.; Vinçon-Leite, B.; Nascimento, N. Thermal Functioning of a Tropical Reservoir Assessed through Three-Dimensional Modelling and High-Frequency Monitoring. Rev. Bras. Recur. Hidricos 2021, 26, 1–25. [Google Scholar] [CrossRef]
  43. León, L.F.; Imberger, J.; Smith, R.E.H.; Hecky, R.E.; Lam, D.C.L.; Schertzer, W.M. Modeling as a Tool for Nutrient Management in Lake Erie: A Hydrodynamics Study. J. Great Lakes Res. 2005, 31, 309–318. [Google Scholar] [CrossRef]
  44. Imberger, J.; Hamblin, P.F. Dynamics of Lakes, Reservoirs, and Cooling Ponds. Annu. Rev. Fluid Mech. 1982, 14, 153–187. [Google Scholar] [CrossRef]
  45. Zhao, Q.; Ren, Y.; Wang, J.X.L. Temporal and Spatial Characteristics of Potential Energy Anomaly in Lake Taihu. Environ. Sci. Pollut. Res. 2018, 25, 24316–24325. [Google Scholar] [CrossRef]
  46. Xing, Z.; Chua, L.H.C.; Miao, H.; Imberger, J.; Yang, P. Wind Shielding Impacts on Water Quality in an Urban Reservoir. Water Resour. Manag. 2018, 32, 3549–3561. [Google Scholar] [CrossRef]
  47. Sundaram, T.R.; Rehm, R.G. Formation and Maintenance of Thermoclines in Temperate Lakes. AIAA J. 1971, 9, 1322–1329. [Google Scholar] [CrossRef]
  48. Chapra, S.C. Surface Water-Quality Modeling; Waveland Press: Long Grove, IL, USA, 2008; pp. 1–866. [Google Scholar]
  49. Dingjman, S.L. Physical Hydrology; Waveland Press: Long Grove, IL, USA, 2008; pp. 1–657. [Google Scholar]
  50. Boegman, L.; Imberger, J.; Ivey, G.N.; Antenucci, J.P. High-Frequency Internal Waves in Large Stratified Lakes. Limnol. Oceanogr. 2003, 48, 895–919. [Google Scholar] [CrossRef]
  51. Galperin, B.; Sukoriansky, S.; Anderson, P. On the Critical Richardson Number in Stably Stratified Turbulence. Atmos. Sci. Lett. 2007, 8, 65–69. [Google Scholar] [CrossRef]
  52. Han, B.P.; Armengol, J.; Carlos Garcia, J.; Comerma, M.; Roura, M.; Dolz, J.; Straskraba, M. The Thermal Structure of Sau Reservoir (NE: Spain): A Simulation Approach. Ecol. Modell. 2000, 125, 109–122. [Google Scholar] [CrossRef]
  53. Vinçon-Leite, B.; Casenave, C. Modelling Eutrophication in Lake Ecosystems: A Review. Sci. Total Environ. 2019, 651, 2985–3001. [Google Scholar] [CrossRef] [PubMed]
  54. Man, X.; Lei, C.; Carey, C.C.; Little, J.C. Relative Performance of 1-D versus 3-D Hydrodynamic, Water-Quality Models for Predicting Water Temperature and Oxygen in a Shallow, Eutrophic, Managed Reservoir. Water 2021, 13, 88. [Google Scholar] [CrossRef]
  55. Soares, L.M.V.; do Carmo Calijuri, M. Deterministic Modelling of Freshwater Lakes and Reservoirs: Current Trends and Recent Progress. Environ. Model. Softw. 2021, 144, 105143. [Google Scholar] [CrossRef]
  56. Gelda, R.K.; King, A.T.; Effler, S.W.; Schweitzer, S.A.; Cowen, E.A. Testing and Application of a Two-Dimensional Hydrothermal/Transport Model for a Long, Deep, and Narrow Lake with Moderate Burger Number. Inland Waters 2015, 5, 387–402. [Google Scholar] [CrossRef]
  57. Cole, T.M.; Wells, S.A. CE-QUAL-W2: A Two-Dimensional, Laterally Averaged, Hydrodynamic and Water Quality Model, Version 3. 71 User Manual By 2018; Portland State University: Portland, OR, USA, 2018. [Google Scholar]
  58. Kim, D.; Kim, Y.; Kim, B. Simulation of Eutrophication in a Reservoir by CE-QUAL-W2 for the Evaluation of the Importance of Point Sources and Summer Monsoon. Lake Reserv. Manag. 2019, 35, 64–76. [Google Scholar] [CrossRef]
  59. Muniz, L.F.; Pereira, J.M.R.; Ximenes Júnior, C.L.; Studar, T.M.d.C. Classificação Climática Para O Estado Do Ceará Climate Classification for the State of Ceará Using Various Characterization Systems. In Proceedings of the XXII Simpósio Brasileiro de Recursos Hídricos, Florianópolis, Brazil, 26 November 2017. [Google Scholar]
  60. Alazard, M.; Leduc, C.; Travi, Y.; Boulet, G.; Ben Salem, A. Estimating Evaporation in Semi-Arid Areas Facing Data Scarcity: Example of the El Haouareb Dam (Merguellil Catchment, Central Tunisia). J. Hydrol. Reg. Stud. 2015, 3, 265–284. [Google Scholar] [CrossRef] [Green Version]
  61. Lima Neto, I.E.; Medeiros, P.H.A.; Costa, A.C.; Wiegand, M.C.; Barros, A.R.M.; Barros, M.U.G. Assessment of Phosphorus Loading Dynamics in a Tropical Reservoir with High Seasonal Water Level Changes. Sci. Total Environ. 2022, 815, 152875. [Google Scholar] [CrossRef]
  62. Cole, T.; Buchak, E. A Two-Dimensional, Laterally Averaged, Hydro-dynamic and Water Quality Model, Version 2.0; U.S. Army Engineer Waterways Experiment Station: Vicksburg, MS, USA, 1995. [Google Scholar]
  63. Spigel, R.H.; Imberger, J. The Classification of Mixed-Layer Dynamics in Lakes of Small to Medium Size. J. Phys. Oceanogr. 1980, 10, 1104–1121. [Google Scholar] [CrossRef]
  64. França, J.M.B.; Lopes, I.K.C.; Souza, A.C.; Paulino, W.D.; Monteiro, C.M.G.; Avelino, F.F.; Capelo Neto, J. Estudo das condições de estratificação e da qualidade da água do reservatório Gavião (Ceará—Brasil). Revista DAE 2021, 69, 119–132. [Google Scholar] [CrossRef]
  65. Anis, A.; Singhal, G. Mixing in the Surface Boundary Layer of a Tropical Freshwater Reservoir. J. Mar. Syst. 2006, 63, 225–243. [Google Scholar] [CrossRef]
  66. García, P.R.; Nandini, S.; Sarma, S.S.S.; Valderrama, E.R.; Cuesta, I.; Hurtado, M.D. Seasonal Variations of Zooplankton Abundance in the Freshwater Reservoir Valle de Bravo (Mexico). Hydrobiologia 2002, 467, 99–108. [Google Scholar] [CrossRef]
  67. Moriasi, D.N.; Gitau, M.W.; Pai, N.; Daggupati, P. Hydrologic and Water Quality Models: Performance Measures and Evaluation Criteria. Trans. ASABE 2015, 58, 1763–1785. [Google Scholar] [CrossRef] [Green Version]
  68. Santos, J.A.; Marins, R.V.; Aguiar, J.E.; Chalar, G.; Silva, F.A.T.F.; Lacerda, L.D. Hydrochemistry and Trophic State Change in a Large Reservoir in the Brazilian Northeast Region under Intense Drought Conditions. J. Limnol. 2017, 76, 41–51. [Google Scholar] [CrossRef] [Green Version]
  69. Rocha, M.d.J.D.; Lima Neto, I.E. Modeling Flow-Related Phosphorus Inputs to Tropical Semiarid Reservoirs. J. Environ. Manag. 2021, 295, 113123. [Google Scholar] [CrossRef] [PubMed]
  70. Rocha, M.d.J.D.; Lima Neto, I.E. Phosphorus mass balance and input load estimation from the wet and dry periods in tropical semiarid reservoirs. Environ. Sci. Pollut. Res. 2021, 29, 10027–10046. [Google Scholar] [CrossRef]
  71. Rocha, M.d.J.D.; Lima Neto, I.E. Internal phosphorus loading and its driving factors in the dry period of Brazilian semiarid reservoirs. J. Environ. Manag. 2022, 312, 114983. [Google Scholar] [CrossRef]
  72. Carneiro, B.L.D.S.; Rocha, M.d.J.D.; Barros, M.U.G.; Paulino, W.D.; Lima Neto, I.E. Predicting anoxia in the wet and dry periods of tropical semiarid reservoirs. J. Environ. Manag. 2022, 326, 116720. [Google Scholar] [CrossRef]
Figure 1. Schematic of the Pentecoste reservoir, located in the state of Ceará, Brazil.
Sustainability 14 16051 g001
Figure 2. Model setup for Pentecoste reservoir (a) plan view with the segments chosen to perform spatial analysis, (b) longitudinal profile for East branch, and (c) longitudinal profile for West branch. Segment marked in yellow is the one where field measurements were performed.
Sustainability 14 16051 g002
Figure 3. CE-QUAL-W2 input data (a) six-hour measurements and 30-day moving average of wind speed, (b) six-hour measurements and 30-day moving average of air temperature, and (c) monthly plot of rainfall and inflow daily measurements.
Sustainability 14 16051 g003
Figure 4. CE-QUAL-W2 modelled hydrodynamics of Pentecoste reservoir (a) water temperature, and (b) horizontal velocity. Results extracted for validation segment.
Sustainability 14 16051 g004
Figure 5. Time series of Richardson’s Number from validation segment.
Sustainability 14 16051 g005
Figure 6. Richardson’s Number (a.I) spatial, (a.II) hourly and (a.III) monthly variability with the respective percentage of time that the lake remains mixed (Ri < 0.25) or stratified (Ri > 0.25) shown in (b.Ib.III). The red line represents the threshold Ri = 0.25.
Sustainability 14 16051 g006
Figure 7. Coefficient of determination results for monthly averaged Richardson’s Number and (a) wind speed, (b) air temperature, (c) rainfall, (d) inflow, and (e) water level.
Sustainability 14 16051 g007
Table 1. MAE results from temperature profiles for both calibration and validation periods.
CalibrationValidation
DayMAE (°C)DayMAE (°C)
12/8/2009 6:000.0313/2/2010 6:000.122
12/8/2009 12:000.1513/2/2010 9:000.173
12/8/2009 18:000.23/2/2010 12:000.235
12/9/2009 6:000.0693/2/2010 15:000.364
12/9/2009 12:000.1533/2/2010 18:000.326
12/9/2009 18:000.193/2/2010 21:000.34
1/26/2010 6:001.3353/3/2010 0:000.222
1/26/2010 9:001.0163/3/2010 3:000.207
1/26/2010 12:001.3514/6/2010 6:000.4
1/26/2010 15:001.6374/6/2010 9:000.428
1/26/2010 18:001.4294/6/2010 12:000.503
1/26/2010 21:001.3654/6/2010 15:000.486
1/27/2010 3:001.3644/6/2010 18:000.528
1/27/2010 6:001.2934/6/2010 21:000.598
4/7/2010 0:000.54
4/7/2010 3:000.454
Mean0.828Mean0.37
Standard deviation0.639Standard deviation0.146
Publisher’s Note: MDPI stays neutral with regard to jurisdictional claims in published maps and institutional affiliations.