Article

Can the Smart City Pilot Policy Promote High-Quality Economic Development? A Quasi-Natural Experiment Based on 239 Cities in China

1
School of Marketing Management, Liaoning Technical University, Huludao 125105, China
2
School of Business Administration, Liaoning Technical University, Huludao 125105, China
*
Author to whom correspondence should be addressed.
Sustainability 2022, 14(23), 16005; https://doi.org/10.3390/su142316005
Submission received: 31 October 2022 / Revised: 27 November 2022 / Accepted: 29 November 2022 / Published: 30 November 2022
(This article belongs to the Topic Sustainable Smart Cities and Smart Villages, 2nd Volume)

Abstract

:
By the end of 2020, more than 900 cities in China had made plans to construct smart cities. Based on the data of 239 cities in China from 2003 to 2019, this study developed difference-in-difference (DID) models to evaluate the promoting effect of the smart city pilot policy on high-quality economic development. The results show that the smart city pilot policy has significantly promoted high-quality economic development, and this conclusion is still valid after a series of robustness tests. The policy is more conducive to high-quality economic development in the small and medium-sized cities of mid-western regions than in the large cities in eastern regions. The impact mechanism test shows that the pilot policy affects the high-quality economic development of a region by improving the levels of innovative development, coordinated development, green development, open development and shared development.

1. Introduction

With the rapid development of China’s economy, which has led to the increasing expansion of the urban scale, the rapidly growing urban population, traffic congestion, environmental pollution and the insufficient provision of public services have become increasingly serious, and the conflicts between the population, resources and the environment have intensified.
In 2008, IBM proposed the concept of “Smart Earth”, taking the construction of smart cities as an important breakthrough to solve the governance problems caused by the excessive scale of cities. It has been recognized by many countries and regions, such as the United Kingdom, Singapore, the United States and others—they all have demonstrated great interest in developing smart cities [1,2,3].
In 2012, China implemented the smart city pilot policy; the Ministry of Housing and Urban-Rural Development issued a smart city pilot policy list that included 290 cities (districts, counties and towns) divided into three groups [4,5,6]. The Guidance on Promoting the Healthy Development of Smart Cities proposed to support a number of smart cities with distinctive features, enhanced aggregation and radiation-driven effects and obvious comprehensive competitive advantages by 2020 [7]. By the end of 2020, more than 900 cities in China had taken up such initiatives or made plans to construct smart cities. The report of the 19th Party Congress proposed that “China’s economic development has shifted from rapid development to high-quality development”, and “Technological power, Digital China, Smart society” should be conducted [8]. As the primary stage of a smart society, smart cities apply new information and communication technology to analyze and integrate key information of the urban core system, and to connect and integrate various subsystems of the city, which represents a new urban development model in the new era of China and provides an important opportunity to promote high-quality economic development.
Against this background, the present study focuses on addressing three questions: Firstly, we ask whether the smart city pilot policy has a policy effect on high-quality economic development. Secondly, the influence of regional heterogeneity on the policy is discussed. Thirdly, we discuss the impact mechanism of the smart city pilot policy on high-quality economic development. The findings can provide insights into smart city pilot policy formulation for urban policymakers and planners.

2. Literature Review

Since the concept of the “smart city” was proposed, it has been regarded as an effective model to solve the problems of urban development, and many countries have constructed smart cities. Many scholars have examined the impact of smart city projects on the development of economic and social aspects from different perspectives, including economic efficiency, innovation levels, the industrial structure and environmental pollution.
Building smart cities has a significant impact on the optimization of the development of the urban economy, by applying advanced information technologies [9,10,11]. Smart city construction has an impact on economic development, which significantly improves economic efficiency [12,13], by using the method of quasi-natural experiments [14]. Zhou et al. [15] analyzed the impact mechanism of smart city initiatives on economic growth, which included optimizing the allocation of resources, improving the level of economic agglomeration and promoting the upgrading of the industrial structure, etc. Smart city initiatives significantly promote the quality of urban development, and there are differences in the administrative hierarchy, degree of innovation and population density of cities [16,17].
Smart cities can improve the level of information and technology development. Dameri [18] argued that a smart city project is an effective model to solve various governance challenges by using investment innovations as well as high-technology tools for cities. Kumar [19] asserted that by applying an advanced information and communication infrastructure, smart cities can be interconnected with different cities around the world, and we can thus increase the level of smart innovation. There is a significant positive correlation between smart city construction and urban innovation [20]. He et al. [21] argued that smart city construction has a significant impact on the improvement of the urban innovation level, and there is no lag effect for the innovation. A smart government in a smart city boosts innovation [22,23].
Smart cities can promote the transformation and upgrading of manufacturing industries, by accelerating technological innovation and improving the efficiency of factor resource allocation [24,25]. Gu et al. [26] argued that smart cities have promoted the upgrading of the industrial structure by transforming traditional industries and developing new industries. Zhao et al. [27] verified that the construction of smart cities has promoted industrial structure upgrading. Meanwhile, Zhang et al. [28] argued that smart cities have accelerated the upgrading of the manufacturing industry.
Green development is the foundation of smart cities, which is characterized by innovation-driven and environmental sustainability [24]. The definition of the smart city concept should not be limited to the information technology context, but should also include the more rational use of resources and lower emissions [29,30]. There is a nonlinear relationship between the level of urban intelligence and CO2 emissions, and the relationship does not change over time [31]. Shi [32] argued that the mechanisms of smart cities in reducing environmental pollution is more effective for large-scale cities. The impact of smart city construction on reducing urban environmental pollution has been gradually strengthened with the publication of the list of cities [33].
As the review of literature demonstrates, many studies have assessed the effects of smart city practices on economic or social development, which has laid an important foundation for this study. This paper contributes to the following aspects. Firstly, the literature is mostly focused on the evaluation of how smart city construction affects economic or social or environment development from a single aspect, while an evaluation index system for high-quality economic development is constructed in this paper, which comprehensively considers the role of smart city construction in promoting high-quality economic development in terms of the overall effectiveness, including economic, social and ecological environment factors. Secondly, the heterogeneity of smart city construction in high-quality economic development is investigated based on two aspects, the location and scale differences of cities, which pass the robustness test. Thirdly, this paper analyzes the impact mechanism of the smart city pilot policy on high-quality economic development from the perspective of the five development concepts, and we provide theoretical support for the pilot policies implemented to build a smart society in China.

3. Hypotheses

General Secretary Xi Jinping put forward the five development concepts at the Fifth Plenary Session of the 18th Central Committee, which are considered the core content of the theory of socialism with Chinese characteristics in the party constitution [34]. At the Fifth Plenary Session of the 19th Central Committee, Chinese leaders pointed out the new development concepts of innovation, coordination, greenness, openness and sharing, which should be strongly implemented during the 14th Five-Year Plan period, as well as being carried out throughout the development process and in all fields, so as to build a new development pattern and achieve the goal of higher-quality development [35]. Therefore, this paper attempts to explore the impact mechanism of the smart city pilot policy on high-quality economic development from five aspects: innovative, coordinated, green, open and shared development.
Recent advances in information and communication technologies (ICTs), such as the Internet of Things, cloud computing and big data, have contributed substantially to smart cities and accelerated the sharing of various types of information, as well as the diffusion of knowledge within the city to enhance the level of innovation development. Informatization can promote the improvement of the innovation level [36,37]. For enterprises, smart city construction is conducive to the application of the new information technology for big data analysis, which can fully excavate and quickly organize market information and facilitate enterprises to speed up the delivery and processing of the information they have obtained, thus accelerating product innovation, technological innovation, etc., and strongly promoting the improvement of enterprise R&D efficiency [38]. Information is conducive to R&D investment, product innovation and process innovation for enterprises [39]. For governments, the intelligent information system of a smart city allows government departments to obtain a comprehensive understanding of all information about city operations, which enables them to solve problems more openly and intelligently when performing functions such as providing services and supervision, breaking down the information barriers between the government and the public, as well as serving to improve its intelligent management and create a market environment that encourages open innovation [15]. Yuan et al. [40] verified that smart cities significantly promote urban innovation. In addition, a smart city optimizes the innovation environment, information integration and data sharing; breaks down various barriers that may be encountered in the process of information transmission; substantially reduces the cost required by each innovation subject in acquiring and sharing information; and facilitates the collaborative innovation of subjects and promotes urban innovation development. Thus, we propose our first hypothesis as follows.
Hypothesis 1 (H1). 
The smart city pilot policy promotes high-quality economic development through innovation development.
The smart city pilot policy’s promotion of high-quality economic development is also reflected in the benefit of regional coordinated development, which can accelerate industrial and urban–rural coordination. On the one hand, smart cities enhance the penetration and diffusion ability of a series of emerging technologies, such as cloud computing, data mining and sensing devices, in various traditional industries, which can accelerate the transformation of traditional industries into intelligent production and scientific management for cities, facilitate the optimization and adjustment of the industrial structure and contribute to the coordinated development of industries. Deng et al. [41] and Zhao [27] proved that smart city construction can promote industrial structure optimization. On the other hand, the investments in infrastructure and public services in smart cities are more in line with the requirements of agricultural modernization construction in terms of urban and rural planning, land use and spatial allocation, which promotes urbanization and narrows the gap between urban and rural areas, and it is conducive to the coordinated development of these areas. Thus, we propose the second hypothesis as follows.
Hypothesis 2 (H2). 
The smart city pilot policy promotes high-quality economic development through coordinated development.
A smart city promotes the application of new technologies, new energy and new materials, and it reduces energy consumption and pollution emissions, which promotes green development for urban areas. For traditional manufacturing industries, smart city construction is conducive to the effective utilization of information technology for the upgrading of products and production methods, and it greatly reduces energy consumption and waste emissions via technological innovation. Shi et al. [32] and Cui et al. [33] demonstrated that smart city construction significantly reduces environmental pollution. Meanwhile, it accelerates the development of new industries such as smart manufacturing and information services; promotes the development and utilization of new technologies, new energy and new materials; and realizes the effective utilization of urban resources. Zhang et al. [42] demonstrated that there is a significant promotion effect on the efficiency of green innovation for smart cities. In addition, the construction of infrastructure such as smart logistics networks and smart transportation networks can not only improve the operation speed of human, logistics and information flow in cities, but also greatly reduce the circulation costs of various resources, which is conducive to reducing the energy consumption and pollutant emissions in the city [43,44]. Thus, we propose the next hypothesis as follows.
Hypothesis 3 (H3). 
The smart city pilot policy promotes high-quality economic development through green development.
The perfect construction of hardware and software facilities in smart cities effectively reduces the operating costs of enterprises, which can attract more foreign-funded enterprises and capital inflows and promote the open development of cities. While strengthening the construction of infrastructure such as transportation in the city, smart cities also have a strong expansive impact on the density of railroads in the city as the core, which further enhances the convenience and ease of connection between smart cities and other cities, which is conducive to the reduction of various operating costs for foreign-funded enterprises, thus enhancing the attractiveness of smart cities to foreign investors. Nie [45] demonstrated that there is a significant effect on foreign investment expansion for smart cities. The service platforms, such as information and smart technology sharing, in smart cities remove various barriers, such as local protectionism and artificial barriers, which facilitates fair competition and full cooperation between foreign enterprises and local enterprises in an open and transparent market environment, and it can increase the willingness of foreign enterprises to invest in the city and enhance the openness of the city [46]. Thus, we propose the next hypothesis as follows.
Hypothesis 4 (H4). 
Smart city pilot policies promote high-quality economic development via open development.
Through the intellectualized reconstruction of infrastructure and public service sectors, smart cities provide efficient and personalized services to citizens and realize development achievements shared by the whole society. Smart transportation, broadband networks, smart grids, smart water services and smart buildings in smart cities benefit traveling, shopping, mobile payment, electricity and water use by making them more efficient and convenient for citizens. Li [47] demonstrated that smart cities can improve the quality of life and sense of acquisition for residents. At the same time, the information platform of social security, employment services, social assistance and medical services is promoted by the smart cities, and there are improvements in the government’s online services, people’s hotlines and government microblogs, which have improved the service ability of governments and greatly encouraged citizens to actively participate and engage in the smart city’s construction, as well as sharing in the achievements of the smart city’s construction [48]. Thus, we propose the next hypothesis as follows.
Hypothesis 5 (H5). 
The smart city pilot policy promotes high-quality economic development via shared development.

4. Methodology and Data

4.1. Model Setting

In 2012, the Ministry of Housing and Urban-Rural Development approved 90 prefectural or county-level cities as smart city pilots in China. The pilot policy can be seen as a quasi-natural experiment, and we assess its impact on high-quality economic development using the difference-in-difference (DID) model. The treated group is impacted by the smart city pilot policy, and the control group is not impacted by the policy. The model is established as follows:
yit = α0+ α1didit + α2Xit + μi + πt + εit
where the explained variable y is the high-quality economic development, i is the individual, t is the time, and did is the constructed difference-in-differences item—that is, if the city is included in the smart city pilot policy list for this year and subsequent years, then did = 1; otherwise, did = 0. The estimated coefficient α1 is the policy effect of the smart city pilot policy on high-quality economic development. Xit is the control variable, which changes with time and individual; μi is the individual fixed effect; πt is the time fixed effect; and εit is the model error term.
The previous analysis shows that the smart city pilot policy plays a significant role in promoting high-quality economic development through innovation, coordinated, green, open and shared development. To analyze the impact mechanisms, the following models are constructed:
innoit = α0+ α1didit + α2Xit + μi + πt + εit
coorit = α0+ α1didit + α2Xit + μi + πt + εit
greeit = α0 + α1didit + α2Xit + μi + πt + εit
openit = α0 + α1didit + α2Xit + μi + πt + εit
sharit = α0+ α1didit + α2Xit + μi + πt + εit
where inno is the innovation development level, coor is the coordinated development level, gree is the green development level, open is the open development level, and shar is the shared development level.

4.2. Data Use

High-quality economic development is a comprehensive index that includes economic, social and environmental multidimensions, and it is difficult to reflect its comprehensive and systematic nature if a single index is used for evaluation. Therefore, building upon the previous research [49], we propose an evaluation index system of high-quality economic development composed of several dimensions, which are detailed further in Table 1. They are economic growth, social progress and environmental friendliness, which follow the principles of scientificness, comparability and operability. The entropy method calculates the weights based on the objective data, which effectively avoids the subjectivity and randomness caused by artificial weighting [50]. Many scholars, such as Cai et al. [51] and Liu et al. [52], have used the method to calculate the weights in an economic development quality evaluation index system. Therefore, this research takes the entropy method to calculate the weights of the evaluation index system and the scores of each city to ensure the objectivity and reasonableness of the calculation results.
The number of patent applications granted can directly reflect the level of innovation output of smart cities [22,53]. In this work, we select the number of patent applications granted to measure the innovation development (inno). Coordinated development (coor) means that the development of smart cities is coordinated. The secondary and tertiary industries, developed synergistically, can reflect whether smart cities achieve coordinated development in terms of optimal resource allocation and output; therefore, we select the ratio of the output value of secondary and tertiary industries to measure it. Green development (gree) refers to the smart city’s reduction in energy and electricity consumption per unit of output value through the use of new energy, new materials and new technologies, so it can be measured via the electricity consumption per unit of GDP [44]. Open development (open) means that smart cities increase their attractiveness to foreign enterprises by improving the efficiency of market operation, so it can be measured by the proportion of foreign investment in GDP [45]. Shared development (shar) refers to the smart cities providing various convenient smart services to citizens by using the emerging communication technologies, so it can be measured by the percentage of Internet users [47].
According to the literature[42,44,45,47], this study selects the following variables as the control variables: urbanization (urba), measured by the proportion of the non-agricultural population among the total population; the level of fixed assets (asse), measured by the proportion of fixed asset investment in the GDP; infrastructure (infr), measured by the highway mileage per capita; human capital (huma), measured by the proportion of college students among the total population; fiscal expenditure (fisc), measured by the proportion of government fiscal expenditure in the GDP; industrial structure (indu), measured by the proportion of secondary industry output value in the GDP; the level of opening to the world (imex), measured by the proportion of the city’s total import and export value in the GDP.
The data described in this paper come from the China City Statistical Yearbook. The cities with a large number of missing variables are omitted, and the balanced panel data of a total of 4063 observations in 239 cities from 2003 to 2019 are obtained, of which the treated group comprises 33 pilot cities and the control group comprises 206 non-pilot cities. The statistics of the variables are shown in Table 2.

5. Results and Discussion

5.1. DID Result Analysis

Table 3 shows the fixed effect regression results of the DID method. Model 1 and Model 3 are the regression results without control variables, and Model 2 and Model 4 are the regression results with control variables. The results show that regardless of whether the control variables are added for regression, the significance and sign of did’s coefficients are consistent, which indicates that the smart city pilot policy has significantly improved the level of high-quality economic development. The results of Model 2 and Model 4 show that the estimated coefficients of did are 0.0369 and 0.034, respectively, after adding control variables and control time and individual effects, which indicates that, after the implementation of the policy, the logarithm of GDP in the treated group increased by 3.69% on average, and the level of high-quality economic development also increased by 3.4%, which has greatly contributed to the high-quality economic development of the smart cities.

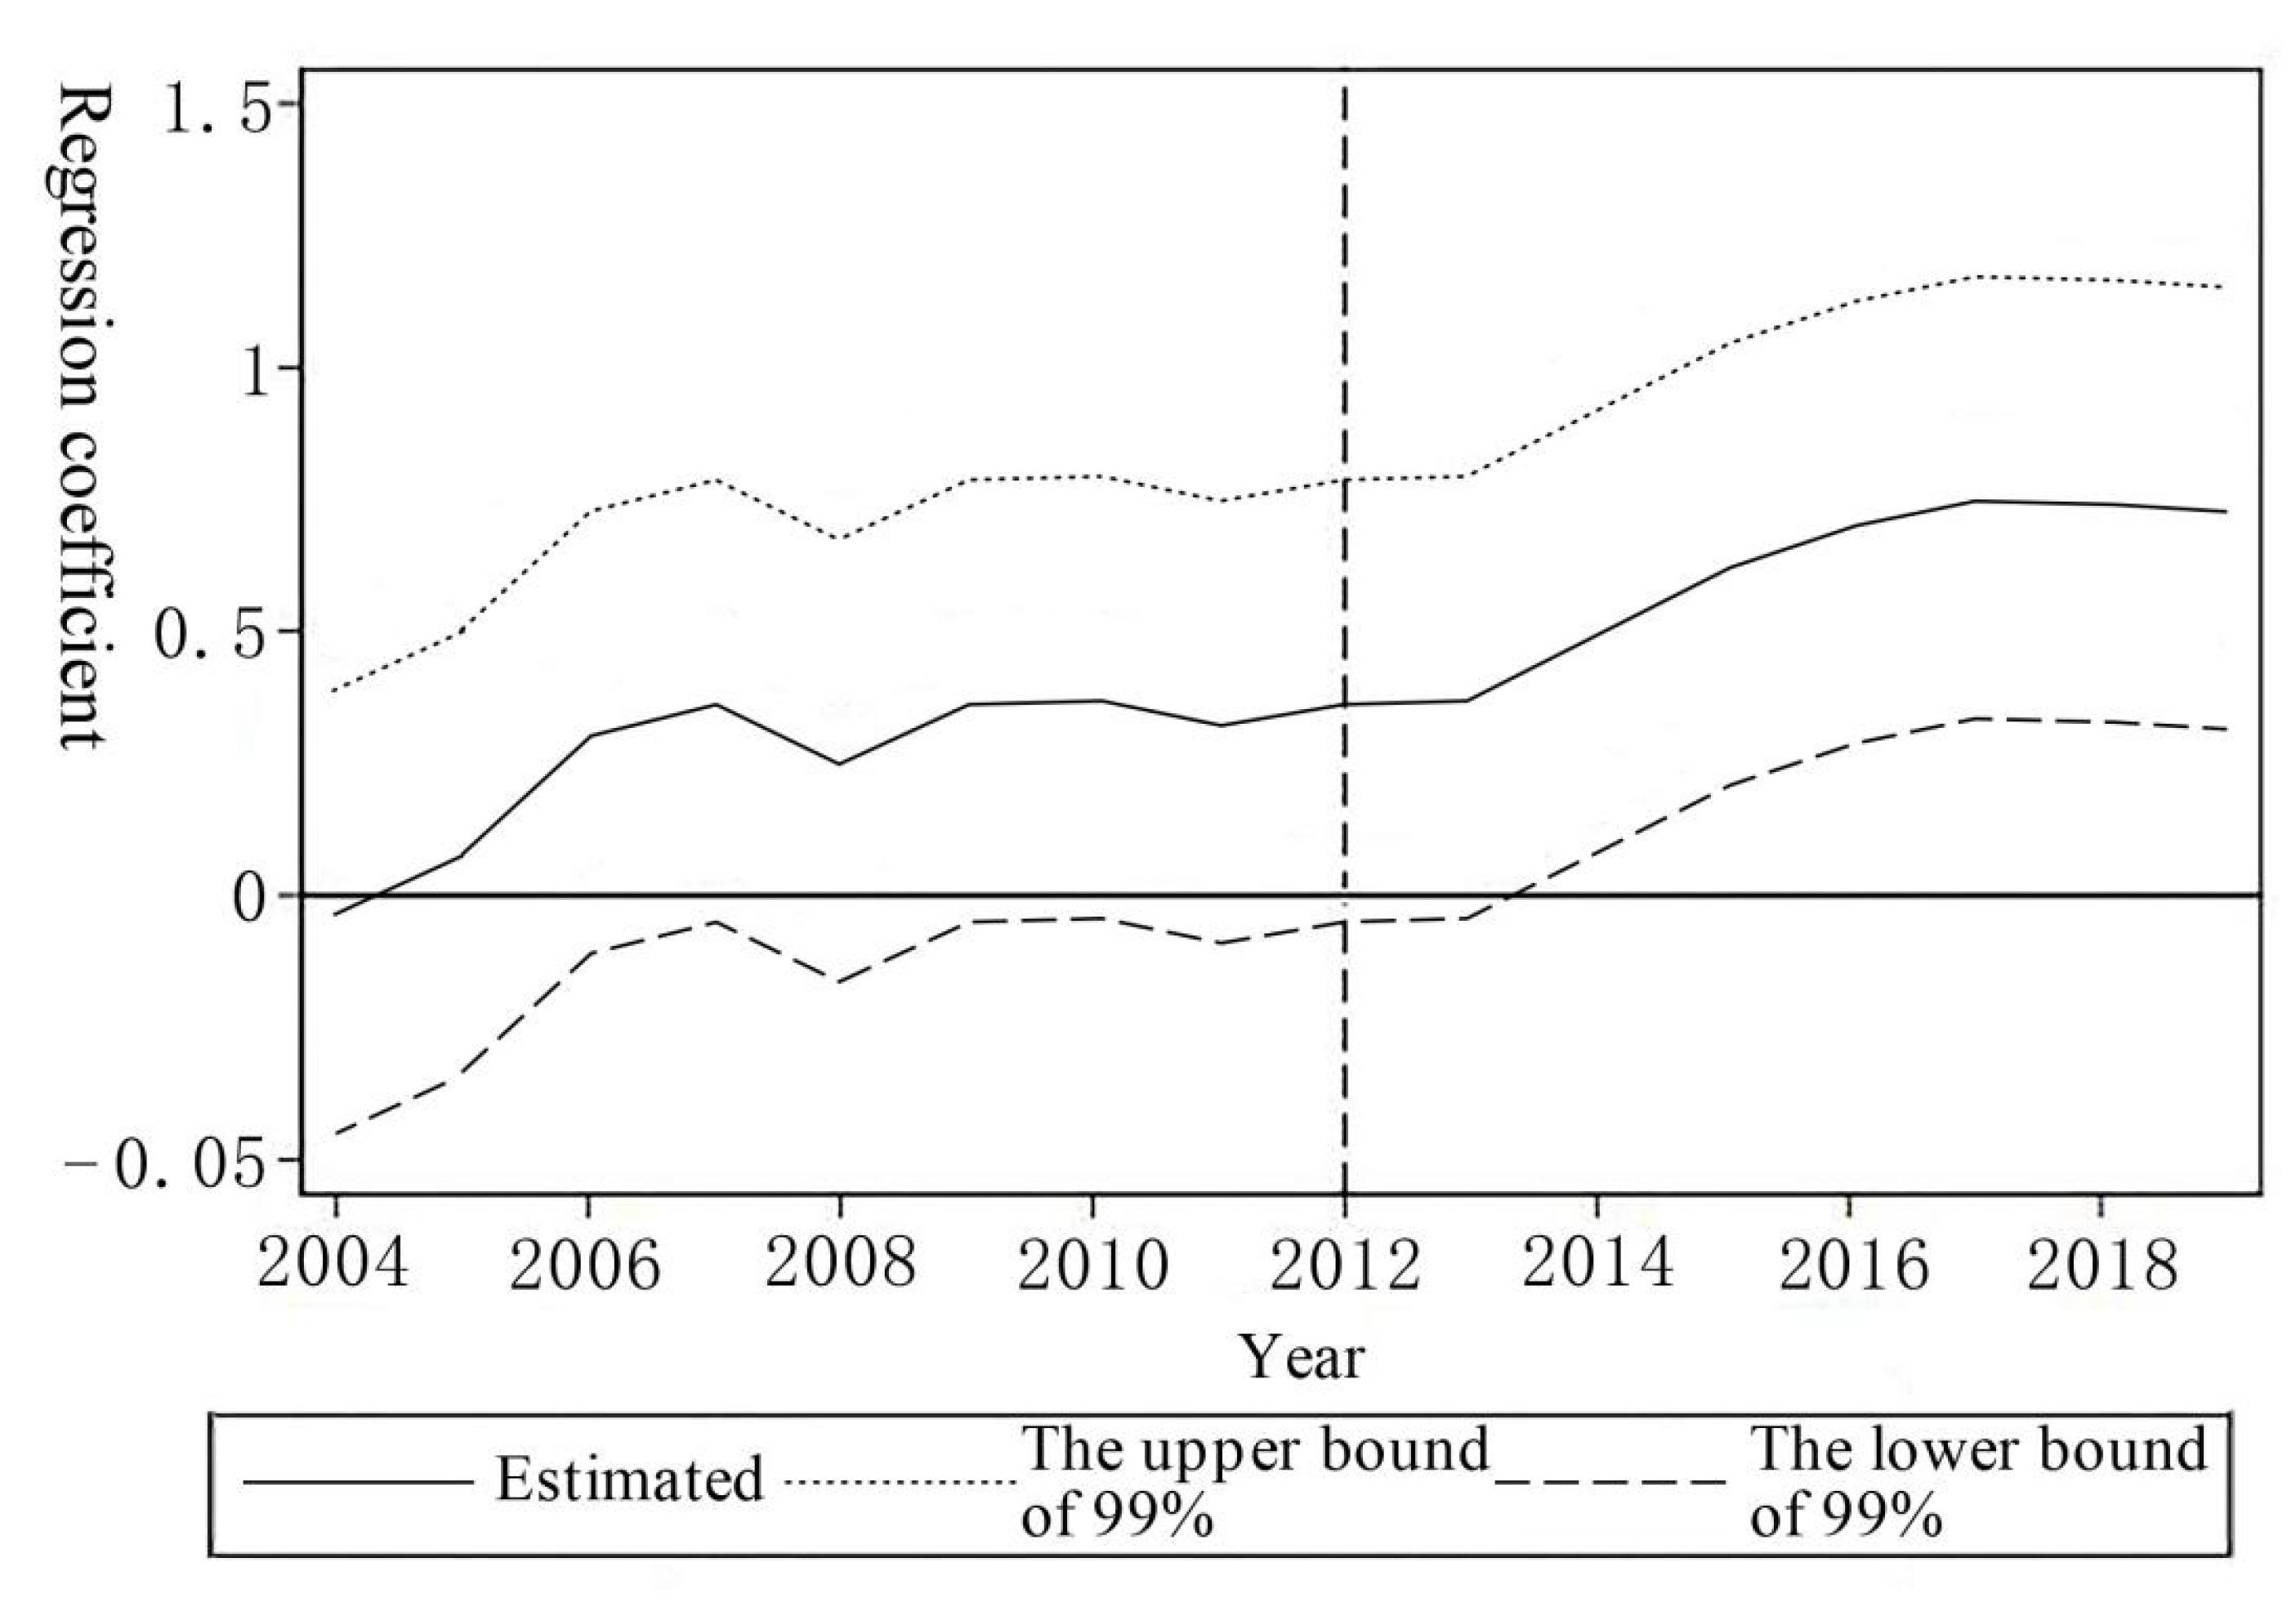
5.2. Parallel Trend Test

In order to verify that there is no significant difference between the treated group and the control group before the smart city pilot policy is implemented, or allows a certain difference between the groups, the prerequisite is that if there is no influence of the policy, the difference does not change with time. Thus, we adopt the event analysis method to study the dynamic effect of the pilot policy on high-quality economic development, we and construct the model as follows:
y i t = α 0 + k = 9 7 β k D i t k + α 2 X i t + μ i + π t + ε i t
D i t k is the smart city pilot policy; the value of k is between −9 and 7, indicating 9 years before and 7 years after the implementation of the policy. β k reflects the difference between the treated group and the control group in the level of high-quality economic development before or after the k year of the smart city pilot policy.
The results of the comparison of the variation trend of high-quality economic development before and after the implementation of the smart city pilot policy are shown in Figure 1. It indicates that there was no significant difference between the treated and the control group before the implementation of the smart city pilot policies, which means that the parallel trend test was passed. It can be seen that the impact of the pilot policy on high-quality economic development is not significant in the current year and the following year of the pilot policy, while the promotion effect continues to increase over time, which indicates that there is a buffer period and digestion period after the implementation of the smart city pilot policy, thus leading to a lag effect.

5.3. Robustness Test

5.3.1. PSM-DID Test

The basic idea of PSM-DID is to construct a control group with the same trend as the treated group by using the PSM method in the total control group—that is, the samples with the same or similar propensity scores as the treated group are selected as the actual control group of the treated group, so that the treated group and the control group satisfy the common trend hypothesis [54]. We draw upon the method of Bockerman et al. [55] and use the PSM-DID method to further analyze the impact of the smart city pilot policy on high-quality economic development and reduce the possible biases that the DID method may bring. It can be seen from Table 4 that the coefficients are 0.0327 and 0.0303, respectively, at the 1% level, which indicates that smart city construction has significantly promoted the growth of the GDP and high-quality economic development, and the estimated results are robust.

5.3.2. Lag Test of Control Variables

Considering the potential endogeneity of the model and to avoid the reverse effects of the selected variables on the core explanatory variables, we apply lag one-stage regression for the control variables, and the results are shown in Table 4. It can be seen that the coefficients are 0.0314 and 0.0312, respectively, at the 1% level. The estimated results are consistent with the results in Table 3, which indicates that smart city construction has significantly promoted high-quality economic development; thus, the estimated results described in this paper are robust.

5.3.3. Counterfactual Test
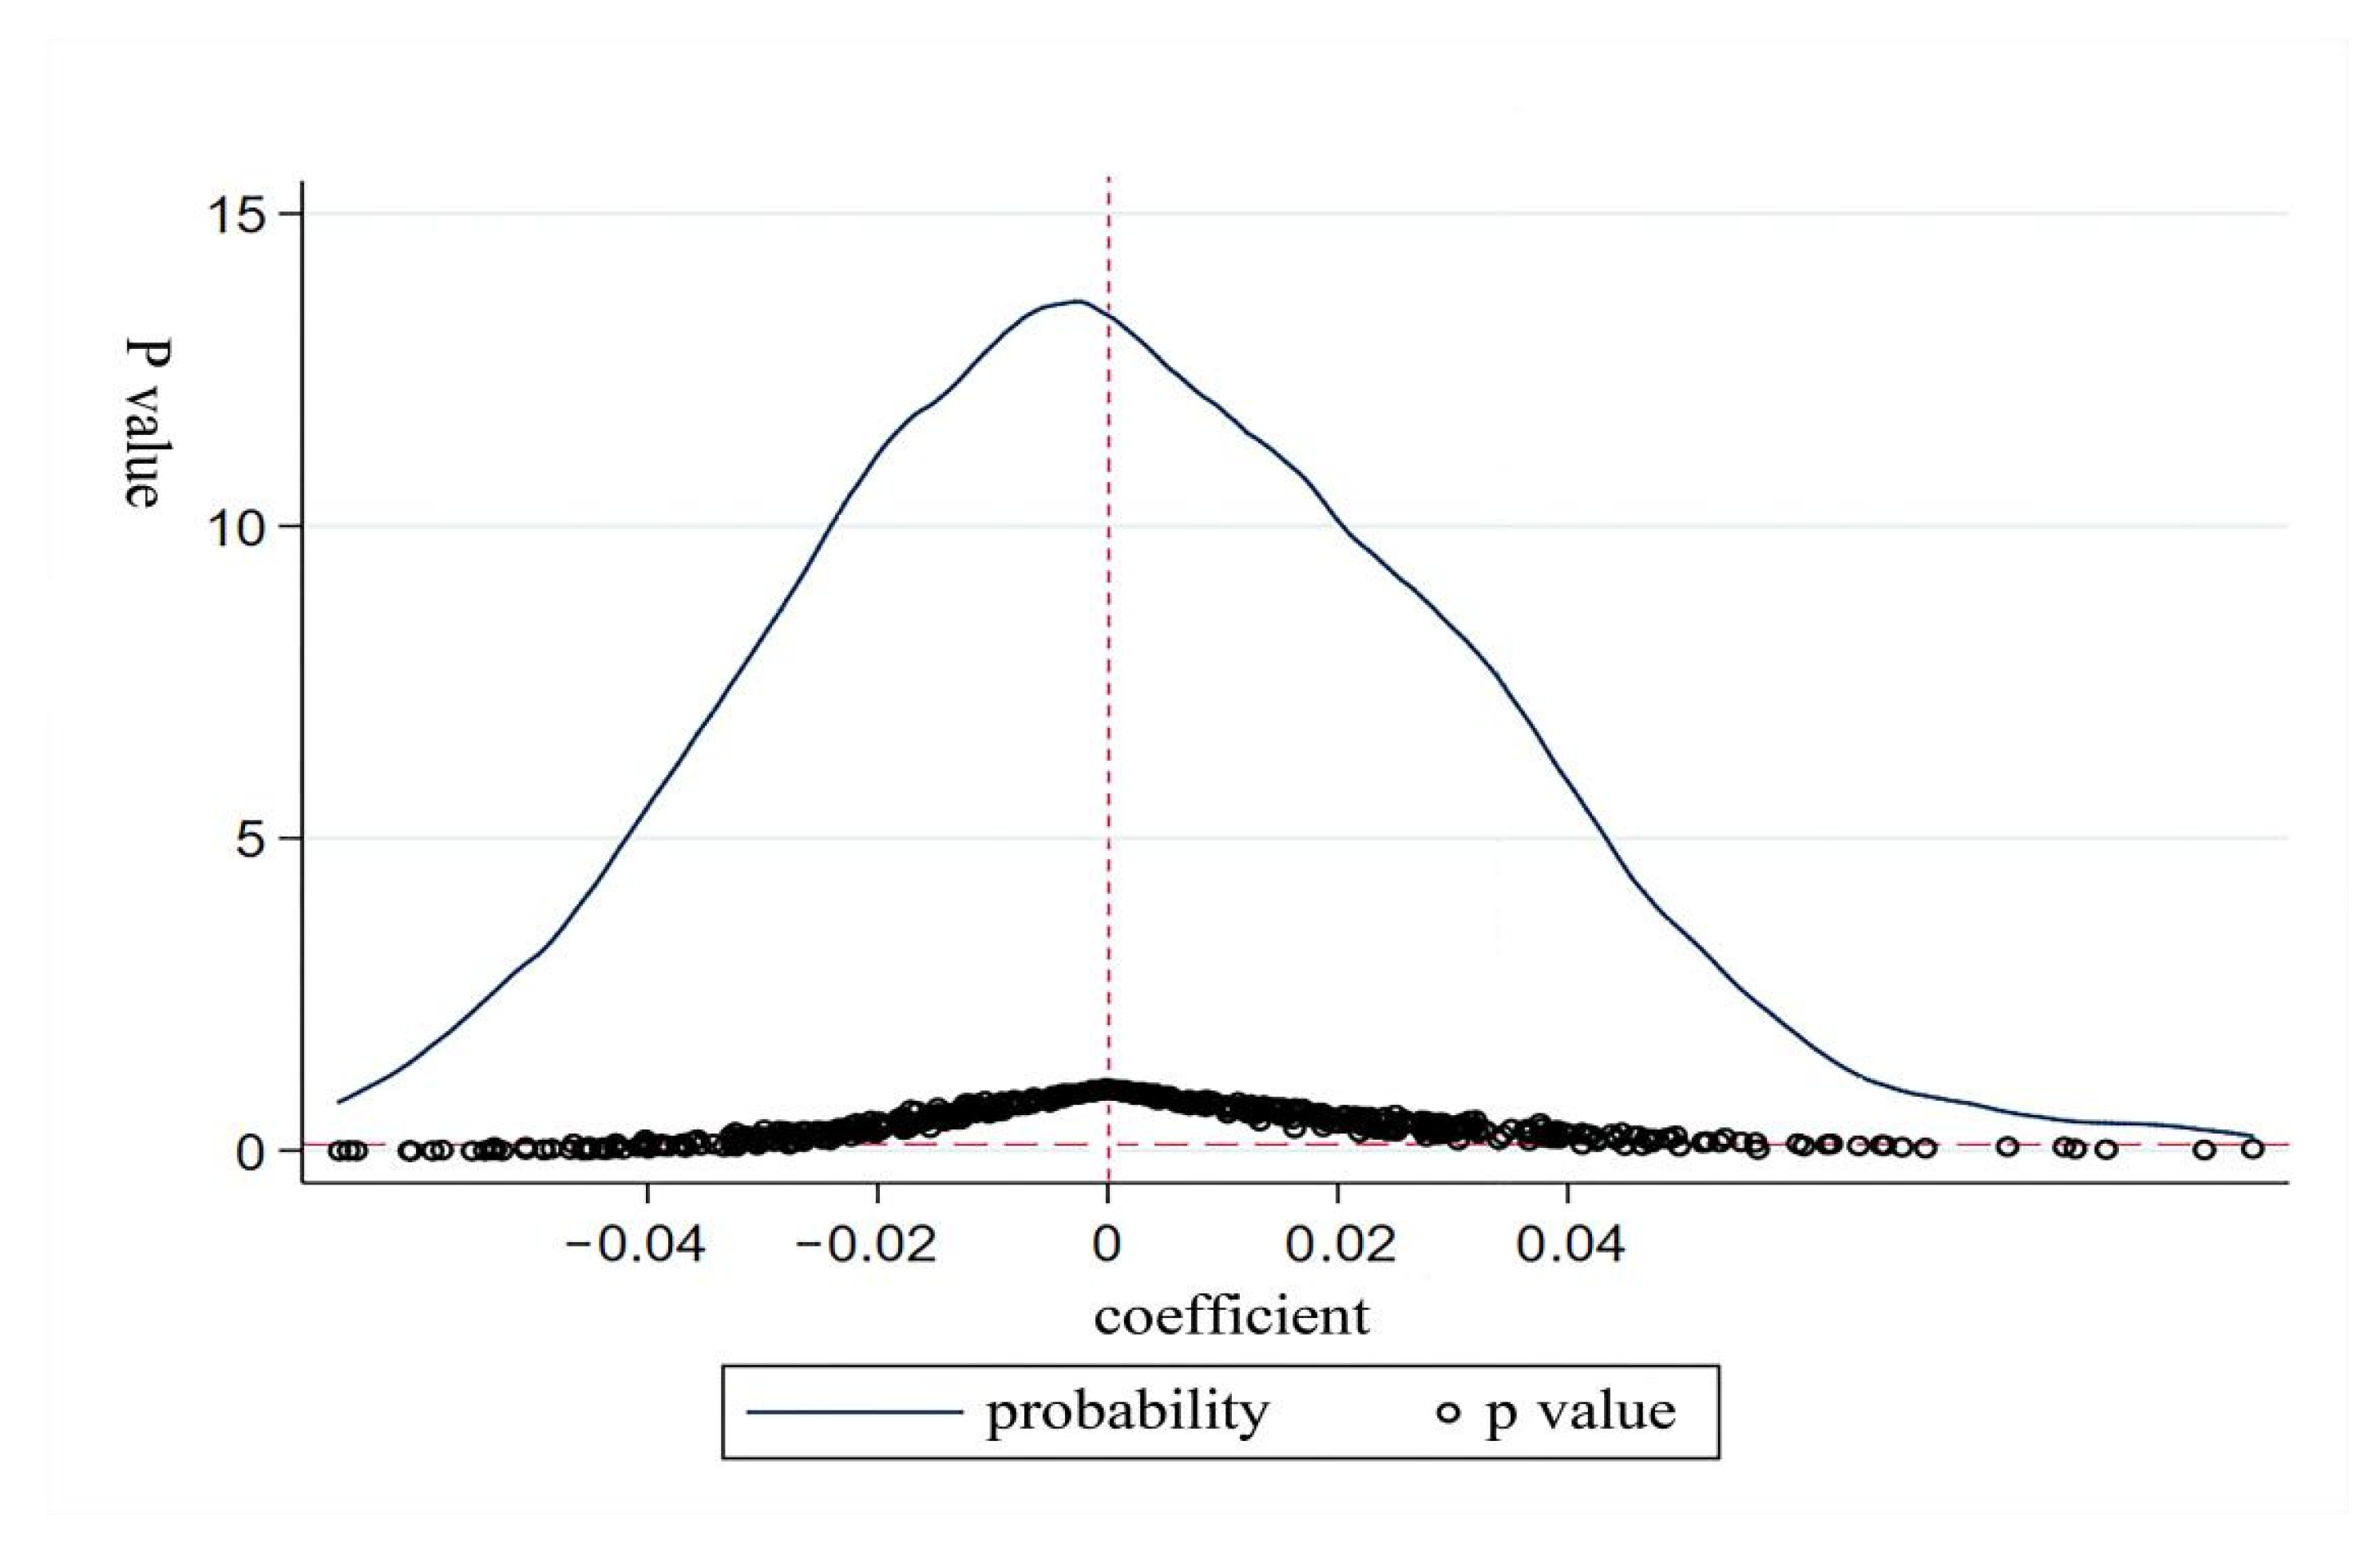
The previous analysis shows that the smart city pilot policy plays a significant role in promoting high-quality economic development, but this does not mean that it is the only policy implemented in the smart cities—the effects of other policies implemented should be excluded. Therefore, counterfactual methods are needed to test the reliability of the DID method’s estimation results. We assume the implementation of the smart city pilot policy by setting the virtual time to test the policy effect, and the results can be seen in Table 5. The results show that the estimated coefficients are not significant; this indicates that the control group is not affected by the policy, and the policy is mainly aimed at the smart city pilot policies, which indirectly indicates that the high-quality economic development of urban areas is affected by the smart city pilot policy, further demonstrating that the above estimation results are robust.

5.3.4. Placebo Test

Since the country will promulgate various policies to promote urban high-quality economic development in different years, this may also affect the level of economic development, which, in this work, could lead to an overestimation problem. To solve the problem of other policy impacts, we randomly select 33 smart cities as the treated group, and we construct the model as follows:
α 1 ^ = α 1 + γ c o v d i d i t , ε i t c o n t r o l v a r d i d i t c o n t r o l
where control denotes the control variables, and γ is the effect of other factors that may impact the explained variable. If the estimate of α1 is unbiased, it requires that γ = 0, while the result cannot be directly verified. We can use the method of computer simulation to confirm that didit has no impact on high-quality economic development; if this prerequisite is met, it can be concluded that α ^ 1 = 0 , and then γ = 0.
To ensure that the estimated results of the counterfactual test are reliable, we repeat the placebo test 500 times and obtain 500 estimated values of α ^ 1 (see Figure 2). It can be seen that the estimation results obey a normal distribution, which indicates that the effect of the smart city pilot policy on the randomly selected sample cities does not exist, and it indirectly indicates that the high-quality economic development of smart cities has been greatly improved by the smart city pilot policy, which further shows that the above estimation results are robust.

5.4. Analysis of Heterogeneity

Different cities have major differences in terms of location advantages and urban scale; these influencing factors are the necessary foundations for high-quality economic development, and they result in imbalanced development among cities. Thus, we considered whether there was heterogeneity in the impact of the smart city pilot policy on high-quality economic development due to the difference in urban location and scale? To this end, we further considered the factors and analyzed the impact of the smart city pilot policy in terms of the two aspects mentioned above.

5.4.1. Analysis of Regional Heterogeneity

According to the region, the cities can be divided into three groups, i.e., eastern cities, central cities and western cities, and the results of regional heterogeneity estimation are shown in Table 6. It can be seen that the impact of the smart city pilot policy on the high-quality economic development of each group is significantly positive, indicating that the pilot policies have significantly promoted economic development. However, the estimation coefficient of eastern cities is 0.0028, which is significantly smaller than the values of 0.0374 and 0.0555 obtained for the mid-western cities, indicating that the impact of the pilot policy on the high-quality economic development of the mid-western cities is much greater than that of the eastern cities, and the marginal effect of the policy gradually decreases for cities with different levels of economic development. The main reason is that, on the one hand, eastern cities were the main areas of implementation for the opening-up policy introduced earlier in China, and they have achieved a relatively perfect infrastructure and offer rich resources. The level of economic development of these cities is higher than that of mid-western cities; thus, the marginal effect is lower and the policy effect is obviously lower than that of mid-western cities. On the other hand, the capital and enterprises have been transferred from the eastern cities to the mid-western cities in recent years; as a result, the economy of mid-western cities has developed rapidly, and the smart city pilot policy further promotes the attraction of capital, technology and talent, which has significantly improved the level of high-quality economic development of these mid-western cities. In summary, the smart city pilot policy can not only promote high-quality economic development but also narrow the gap between the eastern cities and mid-western cities.

5.4.2. Analysis of Scale Heterogeneity

According to the Notice of The State Council on Adjusting the Standards for City Scale Division [56], the cities are divided into three groups of small-, medium- and large-scale cities based on the population being less than 3 million, 3 to 5 million and more than 5 million, and the results of scale heterogeneity estimation are shown in Table 6. It can be seen that the estimation coefficients of the small- and medium-sized city groups are 0.037 and 0.0222, respectively, which indicates that the smart city pilot policy significantly promotes the high-quality economic development of these cities. Meanwhile, the estimation coefficient of the large-scale city group is not significant, which indicates that the pilot policy does not significantly affect the level of high-quality economic development for large-scale cities, and the policy effect decreases with the increase in city scale. The main reason is that, on the one hand, the level of economic development for small- and medium-sized cities is lower. The cities fully utilize the pilot policy to speed up their economic development after the implementation of the smart city pilot policy; as a result, the policies have significantly promoted high-quality economic development for small- and medium-sized cities. On the other hand, the economic development has already reached a high level for large-scale cities, and it is difficult to stimulate the economic development to reach a higher level by relying on the smart city pilot policy only. Thus, the construction of a smart city is a good opportunity for small- and medium-sized cities to promote high-quality economic development, which can bring them closer to large cities.

5.5. Impact Mechanism Analysis

The previous analysis shows that the smart city pilot policies have significantly promoted urban high-quality economic development, but it does not indicate the ways in which the pilot policy affects the economic development. It is proposed in the hypotheses that the smart city pilot policy impacts high-quality economic development in terms of five aspects, namely innovative development, coordinated development, green development, open development and shared development. Therefore, to verify the impact mechanism, a model is established as follows:
yit = α0 + α1didit + α2Xit + μ1i + π1t + ε1it
Mit = γ0 + γ1didit + γ2Xit + μ2i + π2t + ε2it
yit = δ0 + δ1didit + ρMit + δ2Xit + μ3i + π3t + ε3it
where M is an intermediary variable, including inno, coor, gree, open and shar, and the other variables are similar to Formula (1). Formula (9) is used to test whether the smart city pilot policy can promote high-quality economic development; if α1 is positive and significant, it indicates that the economic development has been greatly improved by the smart city pilot policy, and the results are shown in Table 3. Formula (10) is used to test the relationship between the smart city pilot policy and intermediary variables; if α1, γ1, δ1 are positive after regression to Formula (11), and α1 is greater than δ1, it indicates the existence of an intermediary effect. The regression results are shown in Table 7.
Models 5 and 6 show that as an intermediary variable, innovation development promotes the impact of smart city construction on high-quality economic development. In Model 5, the estimation coefficient is 0.0579 and it is significant, indicating that smart city construction affects the level of urban innovation development. The main reason is that the construction of smart cities accelerates the application of new-generation information and communication technologies by various innovation subjects, which effectively improves the innovation efficiency. At the same time, the smart city pilot policy makes a significant contribution to intelligent management for governments, which creates an open and innovative market environment and stimulates more innovative behaviors and achievements. In Model 6, the estimation coefficient is 0.0535 and it is significant, indicating that innovation development is conducive to high-quality economic development. The main reason is that innovation development makes a significant contribution to the improvement of labor productivity and increases the GDP of urban areas, which encourages the government to increase its fiscal expenditures in improving the social and ecological environment, and this promotes high-quality economic development. Compared with Model 4, the estimated coefficient of did has decreased, with the value of 0.031 (in Model 4, the estimated coefficient is 0.034), which indicates that the impact of the pilot policy on high-quality economic development decreases significantly after adding the control variable of innovation development. Thus, innovation development is the most important pathway by which smart city pilot policies affect high-quality economic development, which means that H1 is supported.
Models 7 and 8 are used to test the mediation effect of coordinated development. In Model 7, the estimation coefficient is 0.0437 and it is significant, indicating that smart city construction affects the level of urban coordinated development. The reason is that, on the one hand, the smart city pilot policy accelerates the application of new-generation technologies in traditional industries and facilitates transformation and upgrading, which is conducive to the coordinated development of various industries. On the other hand, the construction of smart cities optimizes the allocation of urban and rural planning and land use, accelerates the construction of new urbanization and promotes the coordinated development of urban and rural areas. In Model 8, variables of smart city construction and coordinated development are added at the same time, and it shows that there is a positive correlation between coordinated development and high-quality economic development. The reason is that the industries’ coordination and urban–rural coordination make a significant contribution by increasing the urban GDP and narrowing the urban–rural gap, which promotes social progress and the improvement of the ecological environment. As a result, the quality of economic development is greatly improved. Compared with Model 4, the estimated coefficient of did has decreased, with the value of 0.0318, which indicates that the impact of the smart city pilot policy on high-quality economic development decreases significantly after adding the control variable of coordinated development. Thus, promoting coordinated development is an effective means to promote high-quality economic development for smart cities, which means that H2 is supported.
Models 9 and 10 are used to test the mediation effect of green development. In Model 9, the estimation coefficient is 0.0207 and it is significant, indicating that smart city construction affects the level of urban green development. The main reason is that the construction of smart cities promotes the application of new energy, new technology and new materials, which greatly reduces energy consumption and pollution emissions and accelerates urban green development. In Model 10, the estimation coefficient is 0.0296 and it is significant, indicating that green development is conducive to high-quality economic development. The reason is that green development is beneficial for the improvement of the ecological environment and the healthy operation of the smart city, thus speeding up the economic development. Compared with Model 4, the estimated coefficient of did has decreased, with the value of 0.0334, which indicates that there is a mediation effect for green development, and it is conducive to the high-quality economic development of smart cities by speeding up green development, which means that H3 is supported.
Models 11 and 12 are used to test the mediation effect of open development. In Model 11, the estimation coefficient is 0.0589 and it is significant, indicating that smart city construction affects the level of urban open development. The reason is that smart cities attract more foreign-funded enterprises and external capital inflows due to the perfect infrastructure construction and efficient smart management of government departments, which improve the level of urban open development. In Model 12, the estimation coefficient is 0.0445 and it is significant, indicating that open development is conducive to high-quality economic development. The main reason is that the open development of smart cities attracts more advanced technologies and enterprises, which is conducive to the growth of the urban GDP, social progress and environmental improvement, promoting high-quality economic development. Compared with Model 4, the estimated coefficient of did has decreased, with the value of 0.0327, which indicates that there is a mediation effect of open development, and it is conducive to the high-quality economic development of smart cities by speeding up open development, which means that H4 is supported.
Models 13 and 14 are used to test the mediation effect of shared development. In Model 13, the estimation coefficient is 0.0316 and it is significant, indicating that smart city construction is conducive to urban shared development. The main reason is that the intelligent infrastructure and convenient and efficient services provided by smart cities can be shared by the whole society. In Model 14, the estimation coefficient is 0.0625 and it is significant, indicating that shared development is conducive to high-quality economic development. The reason is that shared development improves the management of government departments and the operating efficiency of enterprises, thus improving the operating efficiency of society and promoting high-quality economic development. Compared with Model 4, the estimated coefficient of did has decreased, with the value of 0.032, which indicates that there is a mediation effect of shared development, and the promotion of shared development is conducive to the high-quality economic development of smart cities, which means that H5 is supported.

6. Discussion

As an important urban development policy, the smart city pilot policy is conducive to promoting high-quality economic development. In support of this hypothesis, we prove that the effects are driven by the five development concepts. Based on the analysis of the impact mechanism, we use the panel data of 239 cities in China and apply the difference-in-difference method. In contrast to previous studies that tend to group all smart cities together [28,44], we differentiate smart cities into three groups of eastern, central and western cities in terms of their location, and we differentiate smart cities into three groups of small-, medium- and large-scale cities in terms of their scale. Our findings show that there is little effect of the smart city pilot policy in the eastern cities and large-scale cities in China. This is different from the result of a previous study by Arie et al. [57], who showed that it contributed to improving the competitive position of the smart city of Tel Aviv-Yafo (TLA). They did not demonstrate the impact based on small- and medium-scale cities.
Unlike most prior studies focused on the evaluation of how smart city construction affects economic or social or environment development from a single aspect [58,59], we constructed an evaluation index system for high-quality economic development by including economic, social and ecological environment factors, and we analyzed the impact mechanism of the smart city pilot policy on high-quality economic development from the perspective of the five development concepts.

7. Conclusions

In this paper, we analyzed the impact of the smart city pilot policy on the high-quality economic development of 239 cities in China from 2003 to 2019 using the difference-in-difference method. The findings provide insights into smart city pilot policy formulation for urban policymakers and planners.
The smart city pilot policy has significantly promoted high-quality economic development [60]. We found that it increased by around 3% compared with non-smart cities, and the parallel trend test and robustness test showed that there is a lag effect for the pilot policies.
Analysis of heterogeneity shows that the smart city pilot policy is more conducive to high-quality economic development in the mid-western cities and small- and medium-sized cities, and it has little effect for the eastern cities and large-scale cities. The pilot policy is an opportunity to narrow the gap between cities, and the support of small- and medium-sized cities will give full play to the “advantage of backwardness” and promote the construction of smart cities and the high-quality economic development of these cities.
The impact mechanism test showed that the smart city pilot policy affects high-quality economic development through innovation development, coordinated development, green development, open development and shared development. The smart city pilot policy has the greatest impact on open development and innovation development, followed by coordinated development and shared development, and it has little impact on green development.
Since the smart city pilot policy affects high-quality economic development, our finding indicate that the government should focus on implementing the smart city pilot policy and expand the number of cities in which the policy is piloted in China. The pilot cities should seize the opportunities brought by the policies, accelerate the transformation from a traditional model of urban development to a smart city, increase the support for the construction of information infrastructure in the city, enhance the level of intelligent building, merge intelligent equipment into each subsystem of the city and finally promote high-quality economic development.
This study provides a certain reference for the promotion of high-quality economic development. Some limitations must be noted. Firstly, the empirical analysis only takes smart cities in China as the sample, and the model should be tested in other cities around the world. Moreover, the indicators used to test the five hypotheses should be added. Future research can consider using complex indicators to test the hypotheses and testing the mechanism in other smart cities around the world.

Author Contributions

S.L. and G.J. designed the study. S.L. and G.J. wrote the manuscript. L.C. and L.W. provided scientific comments on the manuscript. All authors have read and agreed to the published version of the manuscript.

Funding

This research was funded by the Project of Humanities and Social Sciences of Liaoning Province Education Department (grant number LJ2019JW004); Project of Young Talents Training Object of Philosophy and Social Sciences of Liaoning Province (grant number 2022lslwtkt-067); Project of Social Science Planning Fund of Liaoning Province (grant number L22AJY003); Project of Social Sciences in Fuxin of Liaoning Province (grant number 2021Fsllx146); Project of Social Sciences in Huludao of Liaoning Province (grant number HLDSKY2022030).

Institutional Review Board Statement

Not applicable.

Informed Consent Statement

Not applicable.

Data Availability Statement

Not applicable.

Conflicts of Interest

The authors declare no conflict of interest.

References

  1. UK Government. Smart Cities: Background Paper; UK Government: London, UK, 2013. [Google Scholar]
  2. Russell, P. Singapore Launches iN2015-Innovation, Integration and Internationalization. J. E-Gov. 2012, 35, 6–8. [Google Scholar]
  3. The White House. Fact Sheet: Administration Announces New “Smart Cities” Initiative to Help Communities Tackle Local Challenges and Improve City Services. Available online: https://obamawhitehouse.archives.gov/the-press-office/2015/09/14/fact-sheet-administration-announces-new-smart-cities-initiative-help (accessed on 2 September 2022).
  4. Ministry of Housing and Urban-Rural Development of the People’s Republic of China. Notice on the Pilot Work of Smart City. Available online: https://www.mohurd.gov.cn/gongkai/fdzdgknr/tzgg/201302/20130205_212789.html (accessed on 2 September 2022).
  5. Ministry of Housing and Urban-Rural Development of the People’s Republic of China. Notice on Publishing the List of Smart City Pilots in 2013. Available online: https://www.mohurd.gov.cn/gongkai/fdzdgknr/tzgg/201308/20130805_214634.html (accessed on 2 September 2022).
  6. Ministry of Housing and Urban-Rural Development of the People’s Republic of China. Notice on Publishing the List of Smart City Pilots in 2014. 2015. Available online: https://www.mohurd.gov.cn/gongkai/fdzdgknr/tzgg/201504/20150410_220653.html (accessed on 2 September 2022).
  7. The State Council. The Guidance on Promoting the Healthy Development of Smart Cities. Available online: http://www.gov.cn/gongbao/content/2015/content_2806019.htm (accessed on 2 September 2022).
  8. Xinhuanet; Xi, J. A Decisive Victory in Building a Moderately Prosperous Society in all Respects and Winning a Great Victory in So-Cialism with Chinese Characteristics for a New Era—A Report at the 19th National Congress of the Communist Party of China. Available online: http://www.xinhuanet.com//politics/19cpcnc/2017-10/27/c_1121867529.htm (accessed on 2 September 2022).
  9. Oberti, I.; Pavesi, A.S. The triumph of the smart city. TECHNE-J. Technol. Archit. Environ. 2013, 5, 117–122. [Google Scholar]
  10. Paskaleva, K.; Evans, J.; Martin, C.; Linjordet, T.; Yang, D.; Karvonen, A. Data Governance in the Sustainable Smart City. Informatics 2014, 4, 41. [Google Scholar] [CrossRef] [Green Version]
  11. Bibri, S.E.; Krogstie, J. On the social shaping dimensions of smart sustainable cities: A study in science, technology, and society. Sustain. Cities Soc. 2017, 29, 219–246. [Google Scholar] [CrossRef] [Green Version]
  12. Vanolo, A. Smartmentality: The smart city as disciplinary strategy. Urban Stud. 2013, 51, 883–898. [Google Scholar] [CrossRef]
  13. Abellá-García, A.; Ortiz-De-Urbina-Criado, M.; De-Pablos-Heredero, C. The ecosystem of services around smart cities: An exploratory analysis. Procedia Comput. Sci. 2015, 64, 1075–1080. [Google Scholar] [CrossRef] [Green Version]
  14. Yang, Z.H. Can smart city improve economic efficiency: Quasi natural experiment based on smart city construction. Sci. Tech. Mgt. Res. 2018, 10, 263–266. [Google Scholar]
  15. Zhou, X.M.; Li, L.Y. Can the smart city construction become the new momentum of economic growth? Econ. Surv. 2020, 37, 10–17. [Google Scholar]
  16. Zhao, C.J.; Wu, B.J. Does smart city construction promote the quality of urban development? Assessment based An evaluation of policy effect based on multiphase DID method. Econ. Surv. 2020, 37, 18–27. [Google Scholar]
  17. John, V.W. Why are smart cities growing? Who moves and who stays. J. Reg. Sci. 2011, 51, 253–270. [Google Scholar]
  18. Dameri, R.P. Searching for smart city definition: A comprehensive proposal. Int. J. Comp. Tech. 2013, 11, 2544–2551. [Google Scholar] [CrossRef]
  19. Kumar, T.V.; Dahiya, B. Smart Economy in Smart Cities; Springer: Singapore, 2016. [Google Scholar]
  20. Yang, X.F.; Wang, C. The technological innovation effect of smart city: Based on the data of Hangzhou. J. Hebei Univ. Econ. Bus. 2016, 372, 116–122. [Google Scholar]
  21. He, L.Y.; Ma, Q.S. Can smart city pilots promote level of urban innovation? Empirical evidence based on multi-period DID. Financ. Tra. Res. 2021, 3, 28–40. [Google Scholar]
  22. Chu, J.H.; Zhong, A.Y. Study on the impact of smart city construction on the improvement of urban innovation. E-Gov. 2021, 4, 16–29. [Google Scholar]
  23. Lee, J.H.; Hancock, M.G.; Hu, M.C. Towards an effective framework for building smart cities: Lessons from Seoul and San Francisco. Technol. Forecast. Soc. Chang. 2014, 89, 80–99. [Google Scholar] [CrossRef]
  24. Caragliu, A.; Del Bo, C.; Nijkamp, P. Smart cities in Europe. J. Urban Technol. 2011, 18, 65–82. [Google Scholar] [CrossRef]
  25. Wang, Z.D.; Zhang, L. Technology, Space, Capital and Human Beings: The core elements of smart city. J. Dial. Nat. 2016, 38, 99–104. [Google Scholar]
  26. Gu, S.Z.; Yang, J.W.; Liu, J.R. Problems in the development of smart city in China and their solution. China Soft Sci. 2013, 1, 6–12. [Google Scholar]
  27. Zhao, J.J.; Jia, X.J. Smart city, human capital and industrial structure transformation and upgrading. Price Theory Pract. 2019, 8, 161–164. [Google Scholar]
  28. Zhang, Y.Y.; Gao, Y. The effects of smart city construction on regional manufacturing upgrading. Soft Sci. 2019, 33, 46–52. [Google Scholar]
  29. Ferrara, R. The Smart city and the green economy in Europe: A critical approach. Energies 2015, 8, 4724–4734. [Google Scholar] [CrossRef] [Green Version]
  30. Fistola, R. Smart City: Thinking about urban Intelligence. Tema. J. Land Use Mobil. Environ. 2013, 6, 47–60. [Google Scholar]
  31. Yigitcanlar, T.; Kamruzzaman, M. Does smart city policy lead to sustainability of cities? Land Use Policy 2018, 73, 49–58. [Google Scholar] [CrossRef]
  32. Shi, D.Q.; Ding, H.; Wei, P.; Liu, J. Can smart city construction reduce environmental pollution. China Ind. Econ. 2018, 6, 117–135. [Google Scholar]
  33. Cui, L.Z.; Chen, Q.Y. Study on the environmental effects of smart city with progressive expansion policy. Shh. J. Econ. 2019, 4, 62–74. [Google Scholar]
  34. Wang, J.; Zhan, Y.Q. Elasticity analysis of Chinese economic growth quality in the view of Five Development Concepts. Soft Sci. 2018, 32, 26–29. [Google Scholar]
  35. The State Council. Communique of the Fifth Plenary Session of the 19th Central Committee of the Communist Party of China; The State Council: Beijing, China, 2015. [Google Scholar]
  36. Varian, H.R. Computer mediated transactions. Am. Econ. Rev. 2010, 100, 1–10. [Google Scholar] [CrossRef]
  37. Ke, X.; Chen, H.Q.; Hong, Y.M. Do China’s high-speed-rail projects promote local economy? New evidence from a panel data approach. China Econ. Rev. 2017, 44, 203–226. [Google Scholar] [CrossRef]
  38. Fu, P.; Liu, D.X. Research on the effect of technological innovation in smart cities: An empirical analysis based on panel data of 282 prefecture-level cities in China. Inq. Econ. Iss. 2019, 9, 72–81. [Google Scholar]
  39. Wang, L.N.; Zhang, G.P. Information technology, human capital and innovation of start-up firms: An empirical study based on enterprise-level data of China. Sci. Sci. Mgmt. S. T. 2018, 4, 111–122. [Google Scholar]
  40. Yuan, H.; Zhu, C.L. Do smart cities accelerate urban innovation? China Soft Sci. 2020, 12, 75–83. [Google Scholar]
  41. Deng, Y.J.; Zhang, Y. The role of smart city construction in promoting the transformation of China’s economic development path. E-Gov. 2013, 12, 2–8. [Google Scholar]
  42. Zhang, J.; Li, Q.H. The impact of smart city construction on the efficiency of urban green innovation. Sta. Dd. 2020, 19, 83–87. [Google Scholar]
  43. Chen, Y.; Wei, L. Railroad development, temporal-spatial externalities, and growth spillover: Theory and empirical evidence. J. Reg. Sci. 2018, 58, 980–1002. [Google Scholar] [CrossRef]
  44. Du, J.G.; Wang, Y.; Zhao, A.W. The effects and mechanism of smart city construction on urban green development. Soft Sci. 2020, 34, 59–64. [Google Scholar]
  45. Nie, F. The impact of China’s “smart cities” pilot on the “binary margin” expansion of FDI: Theoretical mechanism and empirical analysis. J. Int. Trade 2019, 10, 84–99. [Google Scholar]
  46. Fontagne, L.; Koenig, P.; Mayneris, F.; Poncet, S. Cluster policies and firm selection: Evidence from France. J. Reg. Sci. 2013, 53, 897–922. [Google Scholar] [CrossRef] [Green Version]
  47. Li, Y. Can smart city construction improve the sense of gain of residents? Heterogeneity analysis based on Chinese residents. Ji. Univ. J. Soc. Sci. Ed. 2019, 59, 107–109. [Google Scholar]
  48. Anna, V.; Kseniya, K. Assessment of the sharing economy in the context of smart cities: Social performance. Sustainability 2022, 14, 12200. [Google Scholar]
  49. Wang, X.H.; Feng, Y.C. Impacts of haze pollution on urban development quality in China. China Pop. Res. Env. 2019, 8, 1–11. [Google Scholar]
  50. Qiu, W.H. Management Decision Making and Applied Entropy Science; Machinery Industry Press: Beijing, China, 2002. [Google Scholar]
  51. Yusheng, C.; Jingwei, L. Evaluation of regional development quality in Beijing—Tianjin—Hebei region based on entropy method. J. Ind. Tech. Econ. 2018, 11, 67–75. [Google Scholar]
  52. Binglian, L.; Wenjin, Q. Spatial distribution and dynamic evolution of China’s high-quality economic development level. China Soft Sci. 2022, 1, 62–75. [Google Scholar]
  53. Caragliu, A.; Del Bo, C.F. The economics of smart city policies. Sci. Reg. 2018, 19, 81–104. [Google Scholar]
  54. Zhou, Y.L.; Li, S.S. Can the innovative-city-pilot policy promote urban innovation? An empirical analysis from China. J. Urban Aff. 2021. [Google Scholar] [CrossRef]
  55. Bockerman, P.; Ilmakunnas, P. Unemployment and self-assessed health: Evidence from panel data. Health Econ. 2009, 18, 161–179. [Google Scholar] [CrossRef] [Green Version]
  56. State Council of the PRC. The State Council on the Adjustment of the City Size Classification Standards Notice. Available online: http://www.gov.cn/zhengce/content/2014-11/20/content_9225.htm (accessed on 12 September 2022).
  57. Arie, H.; Gavriel, D.; Gil, C. Smart cities and tourism: The case of Tel Aviv-Yafo. Sustainability 2022, 14, 10968. [Google Scholar]
  58. Xiong, N.; Zang, H.; Lu, H.; Yu, R.; Wang, J.; Feng, Z. Performance analysis of smart city governance: Dynamic impact of Beijing 12345 Hotline on urban public problems. Sustainability 2022, 14, 9986. [Google Scholar] [CrossRef]
  59. Juliana, M.; Eva, C.M.; Santiago, Q. Analysis of the social capital in a technological system of a smart city using a PLS-SEM Model. Sustainability 2022, 14, 11238. [Google Scholar]
  60. Zhang, Z.D.; Zhao, B.W. The impact of smart city construction on the high-quality development of urban economy. Soft Sci. 2021, 35, 65–70. [Google Scholar]
Figure 1. Results of parallel trend test.
Sustainability 14 16005 g001
Figure 2. Result of placebo test.
Sustainability 14 16005 g002
Table 1. High-quality economic development evaluation index system.
First-Level IndicatorsSecond-Level IndicatorsThird-Level IndicatorsUnitAttribute
High-quality economic developmentEconomic growth GDP per capitayuan+
Number of employees at the end of the yearTen thousand people+
The income ratio of urban and rural residents%
Number of personnel in science and technology activitiesTen thousand people+
The proportion of science and technology expenditure in government fiscal expenditure%+
Social progress The unemployment rate of urban area%
The proportion of social security and employment expenditure in government fiscal expenditure%+
The proportion of education expenditure in government fiscal expenditure%+
Books per capitavolume+
The medical beds per thousand peoplesheet+
Environmental friendlinessThe green coverage rate of urban%+
The proportion of environmental protection expenditure in government fiscal expenditure%+
Comprehensive utilization rate of industrial solid waste%+
Sewage treatment rate%+
The proportion of the number of days meeting the air quality standards throughout the year%+
Note: The negative indicators are the income ratio of urban and rural residents and the unemployment rate of urban, denoted by “−“, and the rest are positive indicators, denoted by “+”.
Table 2. Results of descriptive statistics of variables.
VariableMeanSDMinMaxN Obs.
hqd1.16660.48580.30535.3294063
lngdp4.17481.01390.91057.57444063
inno6.21982.02420.693112.63184063
harm1.34780.72430.202710.60864063
gree6.11835.25250.344133.924063
open1.78771.93850.000111.53534063
shar0.4650.14550.00025.0744063
did0.0650.2465014063
urba0.49510.15380.177814063
asse0.69160.31890.0832.81994063
infr0.30580.18920.00561.56394063
huma1.39161.0130.002212.65484063
fisc15.67636.05090.904849.22184063
indu0.46890.11120.12080.90974063
imex0.18560.33880.00013.46744063
Table 3. Results of DID analysis.
Variablelngdplngdphqdhqd
Model 1Model 2Model 3Model 4
did0.1328 ***0.0369 ***0.0606 ***0.0340 ***
(0.013)(0.006)(0.016)(0.011)
urba 0.2240 *** 0.0865 ***
(0.042) (0.032)
asse 0.0769 *** 0.0779 **
(0.014) (0.025)
infr 0.1252 −0.2008 **
(0.049) (0.083)
huma 0.0071 *** 0.0272 ***
(0.002) (0.004)
fisc 0.0072 *** 0.0752 ***
(0.001) (0.001)
indu 0.5464 *** −0.0231 **
(0.021) (0.011)
imex −0.0274 ** 0.1646 ***
(0.012) (0.015)
_cons5.2280 ***3.9392 ***0.7492 ***0.8696 ***
(0.003)(0.020)(0.008)(0.037)
Time dummiesYesYesYesYes
City dummiesYesYesYesYes
N Obs.4063406340634063
Within R-squared0.78140.88690.71550.8335
Note: ** p < 0.05, *** p < 0.01.
Table 4. Results of PSM-DID and control variables lagged by one stage.
VariablePSM-DIDControl Variables Lagged by One Stage
(1)
lngdp
(2)
hqd
(3)
lngdp
(4)
hqd
did0.0327 ***0.0303 ***0.0314 ***0.0312 ***
(0.0099)(0.0083)(0.005)(0.011)
_cons3.2921 ***1.0289 ***3.0125 ***0.8280 ***
(0.0637)(0.1365)(0.020)(0.039)
Control variablesYesYesYesYes
N Obs.2923292338243824
Within R-squared0.99680.94460.89170.8469
Note: *** p < 0.01.
Table 5. Results of counterfactual test.
Simulation Time Point(1)
2010
(2)
2009
(3)
2008
(4)
2007
(5)
2006
(6)
2005
did0.01580.01910.02530.01810.01360.0226
(0.0113)(0.0118)(0.0162)(0.0121)(0.0104)(0.0148)
_cons1.0578 ***1.0169 ***0.8537 ***0.8086 ***0.7876 ***0.7492 ***
(0.0039)(0.0040)(0.0052)(0.0055)(0.0053)(0.0048)
Control variablesYesYesYesYesYesYes
N Obs.95611951195143414341434
Within R-squared0.88340.84060.86470.91810.85860.8617
Note: *** p < 0.01.
Table 6. Result of heterogeneity analysis.
VariableRegional HeterogeneityScale Heterogeneity
EasternCentralWesternSmallMediumLarge
did0.0028 ***0.0374 ***0.0555 ***0.0370 ***0.0222 ***0.0082
(0.0138)(0.0123)(0.0135)(0.0130)(0.0153)(0.0264)
_cons0.1407 ***0.4753 ***0.5434 ***0.5541 ***0.3335 ***0.0084 ***
(0.0584)(0.0528)(0.0552)(0.0494)(0.0419)(0.0931)
Control variablesYesYesYesYesYesYes
N Obs.129214451326172612681069
Within R-squared0.83280.82710.84140.87460.89380.8470
Note: *** p < 0.01.
Table 7. Results of impact mechanism test.
VariablesInnovation DevelopmentCoordinated Development Green DevelopmentOpen Development Shared Development
innohqdharmhqdgreehqdopenhqdsharhqd
Model 5Model 6Model 7Model 8Model 9Model 10Model 11Model 12Model 13Model 14
did0.0579 ***0.0310 ***0.0437 **0.0318 ***0.0207 **0.0334 ***0.0589 ***0.0327 ***0.0316 *0.0320 ***
(0.0219)(0.0103)(0.0219)(0.0105)(0.0104)(0.0106)(0.0141)(0.0106)(0.0185) (0.0105)
inno 0.0535 ***
(0.0035)
harm 0.0632 ***
(0.0078)
gree 0.0296 ***
(0.0045)
open 0.0445 ***
(0.0056)
shar 0.0625 ***
(0.0092)
_cons2.0896 ***0.8108 ***1.2519 ***0.9487 ***3.5611 ***0.8641 ***0.48130.8679 ***0.5111 ***0.8377 ***
(0.1689)(0.0365)(0.0774)(0.0383)(1.1128)(0.0377)(0.3874)(0.0373)(0.0652) (0.0374)
Time dummiesYesYesYesYesYesYesYesYesYesYes
City dummiesYesYesYesYesYesYesYesYesYesYes
Control variablesYesYesYesYesYesYesYesYesYesYes
N Obs.4063406340634063406340634063406340634063
Within R-squared0.94020.85120.90000.84900.79450.94820.68500.94830.87470.8488
Note: * p < 0.1, ** p < 0.05, *** p < 0.01.
Publisher’s Note: MDPI stays neutral with regard to jurisdictional claims in published maps and institutional affiliations.

