1. Introduction
Coronavirus disease 2019 (COVID-19) was first discovered in Wuhan, China, in December 2019 due to the responsible virus SARS-CoV-2 (severe acute respiratory syndrome coronavirus 2). Due to high attack rates of human transmission, the disease emerged to expand away from China to most continents and countries in less than a few months and formed a global pandemic [
1,
2]. Both social and individual aspects of human life were acutely affected by widespread changes in daily life due to the outbreak of the coronavirus. The emergence of the COVID-19 pandemic followed by social distancing measures to control the spread of the disease has led to an increase in plastic waste [
3]. Following different public health protection directives and measures, a substantial surge in the waste volume has been documented arising from the enhanced use of personal protective equipment (PPE), including face masks, hand gloves, rubber boots, white gowns, hand sanitizers, and other medically used gear such as syringes, test kits, plastic containers, bandages, tissues, etc. [
4,
5].
According to Reuters [
6], from Wuhan to New York, demand for face shields, gloves, takeaway food containers, and bubble wrap for online shopping has surged. China and other countries have seen a massive increment in hazardous waste generation. In response to high PPE demand among the public, healthcare workers, and service workers, single-use face mask production in China soared to 116 million per day in February to about 12 times the usual quantity [
7]. As the situation mandated people as well as those most infected to stay at home, the amount of generated hazardous waste which was expected daily from each infected person was 3.40 kg. With the outbreak of COVID-19, medical waste production in Wuhan, China boomed to 240 TPD (tons/day) from 40 TPD (about a 600% increase in Hubei province) [
8,
9]. To contain the spread of COVID-19, the World Health Organization projected a monthly global expenditure of 1.6 million plastic-based protective goggles, 76 million plastic-based examination masks, and 89 million plastic-based medical masks [
10].
All these plastics being used worldwide during the pandemic can be considered single-use plastic as people refrain from reusing or recycling them in any form to keep themselves safe [
11]. Efforts to reduce plastic pollution have been thwarted by the proliferation of single-use products and panic buying, which have increased production and consumption [
12]. To protect workers, several recycling facilities had to shut down or scale back, diverting their materials to landfills [
13]. There has been a return to single-use plastic along with the lifting of charges and prohibitions on plastic bags [
14]. As a result of oil prices plummeting, the manufacture of virgin plastics from fossil fuels became less expensive than recycling. This cost incentive, along with lifestyle changes that increase plastic use, has complicated the challenge of overcoming plastic pollution. With fewer international markets, the American recycling industry was already in danger, and the epidemic hastened the financial difficulties and closures.
Masks and other personal protective equipment (PPE) can potentially block the drainage facilities and, if used often, run the danger of becoming contaminated. In order to protect from the spread of COVID-19, single-use masks, gloves, and sanitizer bottles ended up on the streets, in the seas, and among wildlife. Publicly discarded PPE clogged sidewalk drains and got washed into waterways [
11]. Failure to effectively manage the waste generated from health facilities and households escalated the spread of COVID-19 via secondary transmission. The potential rampant dumping, open burning, and incineration potentially affect air quality and health outcomes due to exposure to toxins [
15]. As a result, treating atypical garbage sustainably by utilizing existing trash facilities while lowering air pollution, stopping the spread of secondary viruses, and minimizing potential health risks was a challenge [
5]. A large amount of these wastes was finding its way to landfills [
7]. Volume consumption is a great concern in conventional landfills. Volume constraint is worsened when the increased amount of waste, especially plastic waste, finds its way to landfills as plastic is not degradable and a large mass of plastics acts as a barrier in landfill disrupting leachate and gas movement and resulting in stability issues for landfill slopes.
A landfill simply closes off when it reaches its waste-retaining capacity, which means when all the volume of the landfill has been taken up and not because its overweight. For that reason, volume needs to be estimated to predict the lifetime of a landfill. Commonly, waste volume is measured by using large containers of known volume. Waste is filled up into the container; that way, the volume of the container is the volume of the waste filled inside. The volume estimate of a landfill depends mainly on the types and characteristics of the waste. The heterogeneity of waste plays a vital role during the design stage. Because of the COVID-19 pandemic, the characteristics of the generated waste varied to a great extent, which has a significant effect on the design life of a landfill [
16].
Although the increase in plastic waste in MSW has been reported many times during COVID-19, very few quantified test data are available to investigate the situation. In the present day, in 2022, COVID-19 has almost diminished, although many weak variants have still prevailed in the last 2 years. The discovery of the vaccine for this deadly disease and afterward widespread vaccination programs all over the world finally put an end to this havoc. However, it cannot be stated with confidence that something like this will not be visiting the world ever again as history has repeated itself many a time. If such an occurrence ever happens again, this study will be useful in predicting the amount of plastic waste volume that is expected to be generated during that pandemic situation and its possible impact on the volume consumption of landfills. Therefore, this study is an endeavor to quantify the increase in plastic waste in MSW during the most affected period of the pandemic and reflect the volume consumption of increased generation of plastic waste in landfills.
2. Materials and Methods
This study estimates the volume of the increased plastic waste in landfill during the COVID-19 pandemic. The study presents an experimental program that involves the characterization of MSW to evaluate the change in plastic waste percentage in the landfill waste stream and volume estimation of plastic and other wastes to indicate the consumption of landfill airspace. For this study, a total of 56 bags of MSW samples from the Irving Landfill in Texas, USA, were characterized, involving 7 sample collection attempts spreading over a timeline of 8 months. Moreover, moisture content and unit weight tests were performed on each bag of the collected waste to see if the results complied with the physical composition test.
Table 1 shows the details of the test scheme undertaken for the study.
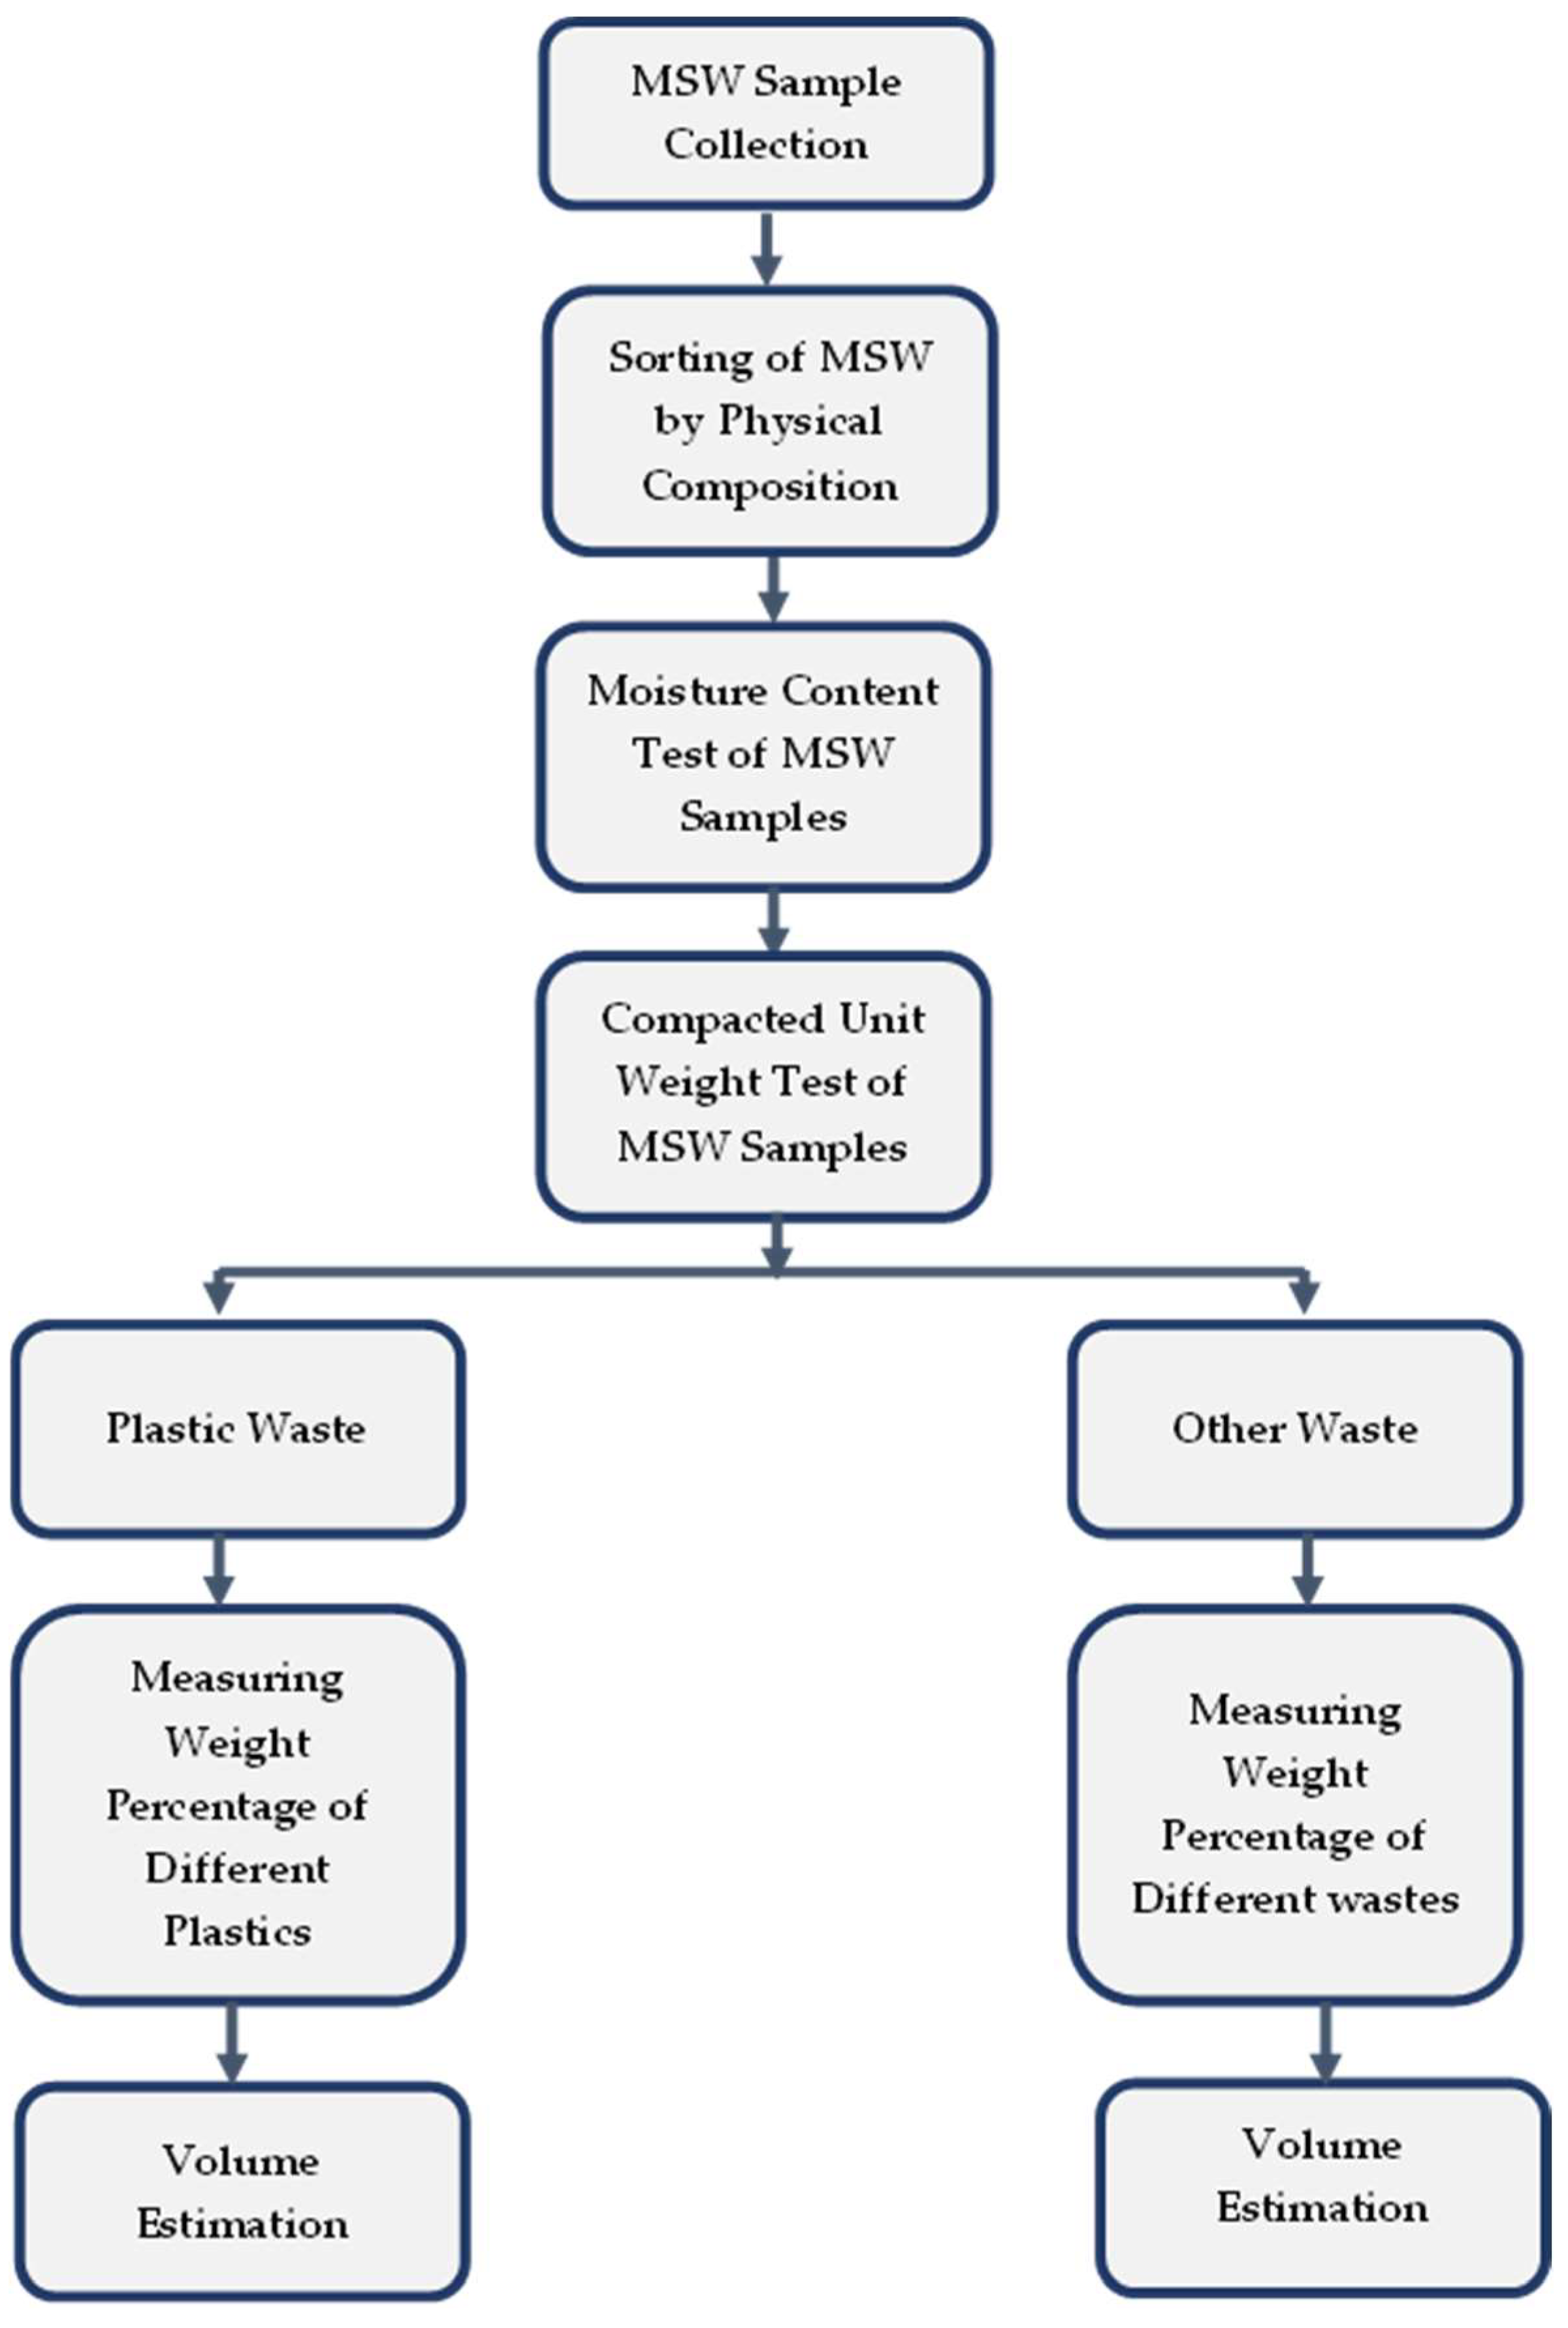
The results of the waste composition were compared with national records to quantify the increase in plastic waste due to COVID-19 pandemic. Hence, this study fills in the fundamental gaps that were left behind in the reports claiming the rise in plastic waste generation during the pandemic period and reflects the effect of the increased plastic waste on landfill volume consumption. A summary of the workflow is presented in
Figure 1.
The characterization of MSW and volume estimation were the two major components of the experimental program. When characterizing MSW, the physical composition of the collected waste sample was sorted first, and then tests for moisture content and compacted unit weight were conducted. The samples were again divided into two groups—plastic waste and other waste—for the volume estimation. The volume of the plastic waste was determined upon being weighed. Apart from the plastic, the remaining samples were classified as “other waste”. The volume of the other waste category was later calculated after having been weighed. The following subsections provide a detailed explanation of the workflow.
2.1. Sample Collection and Storage
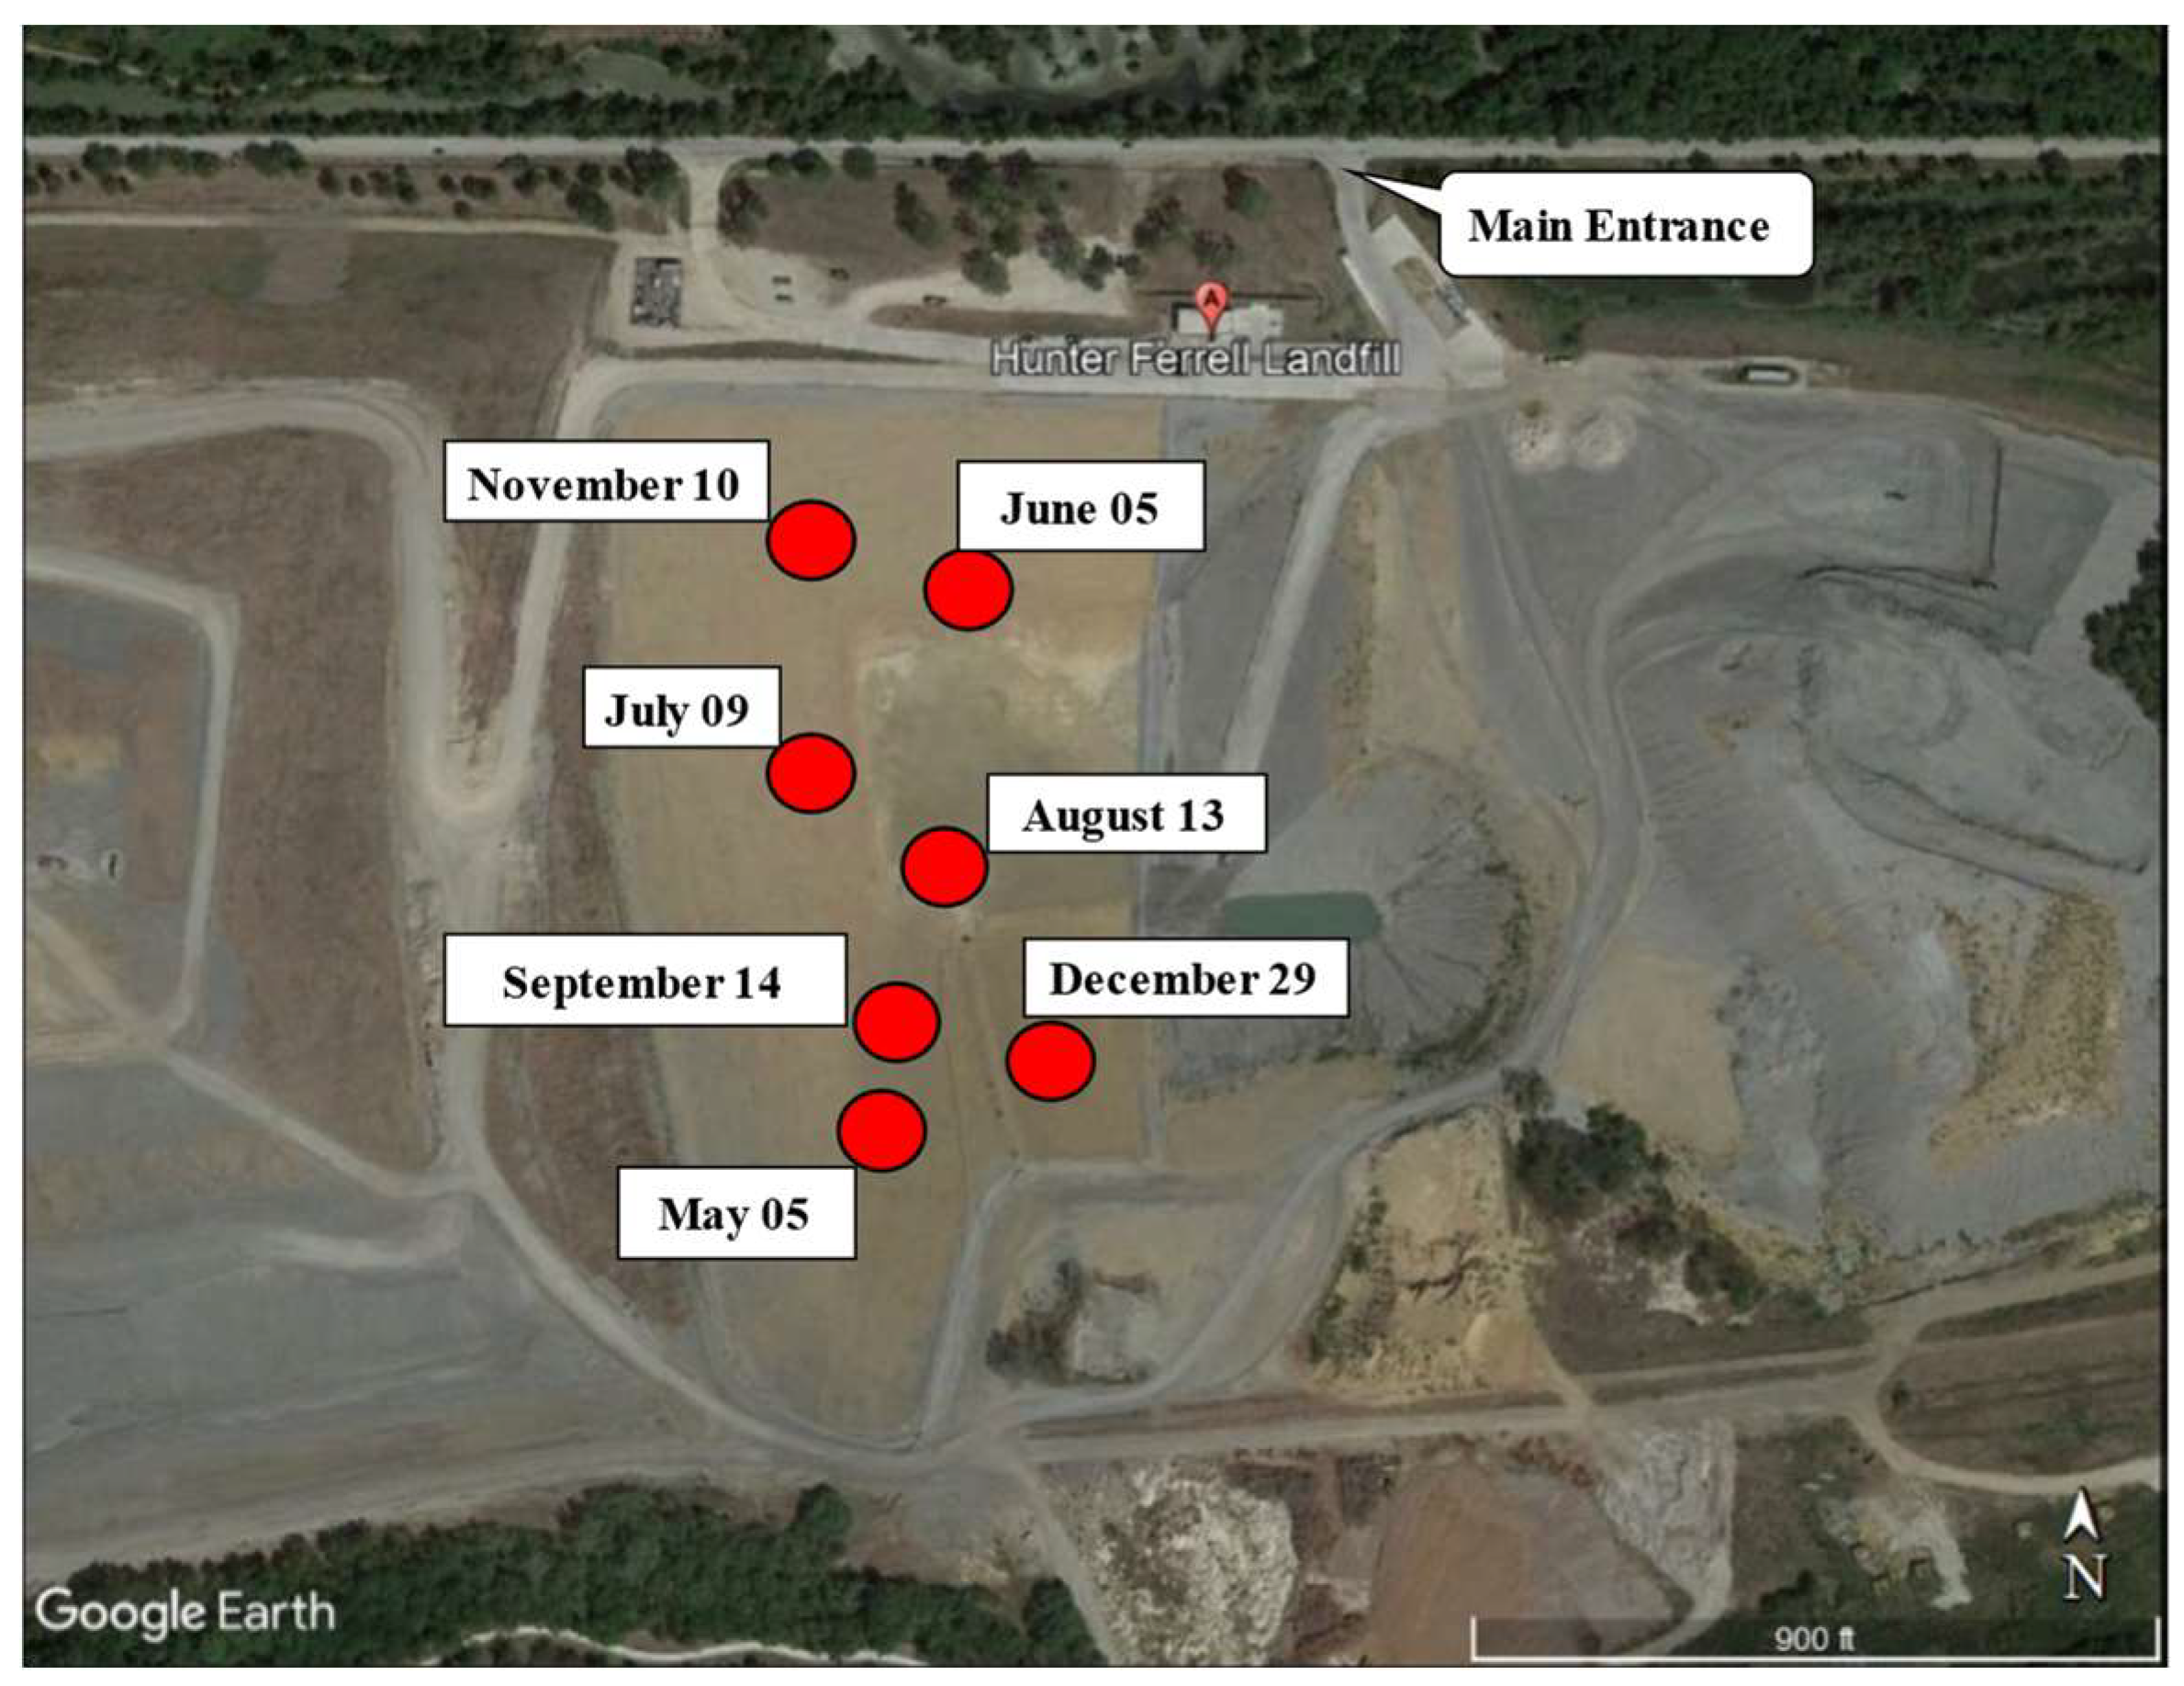
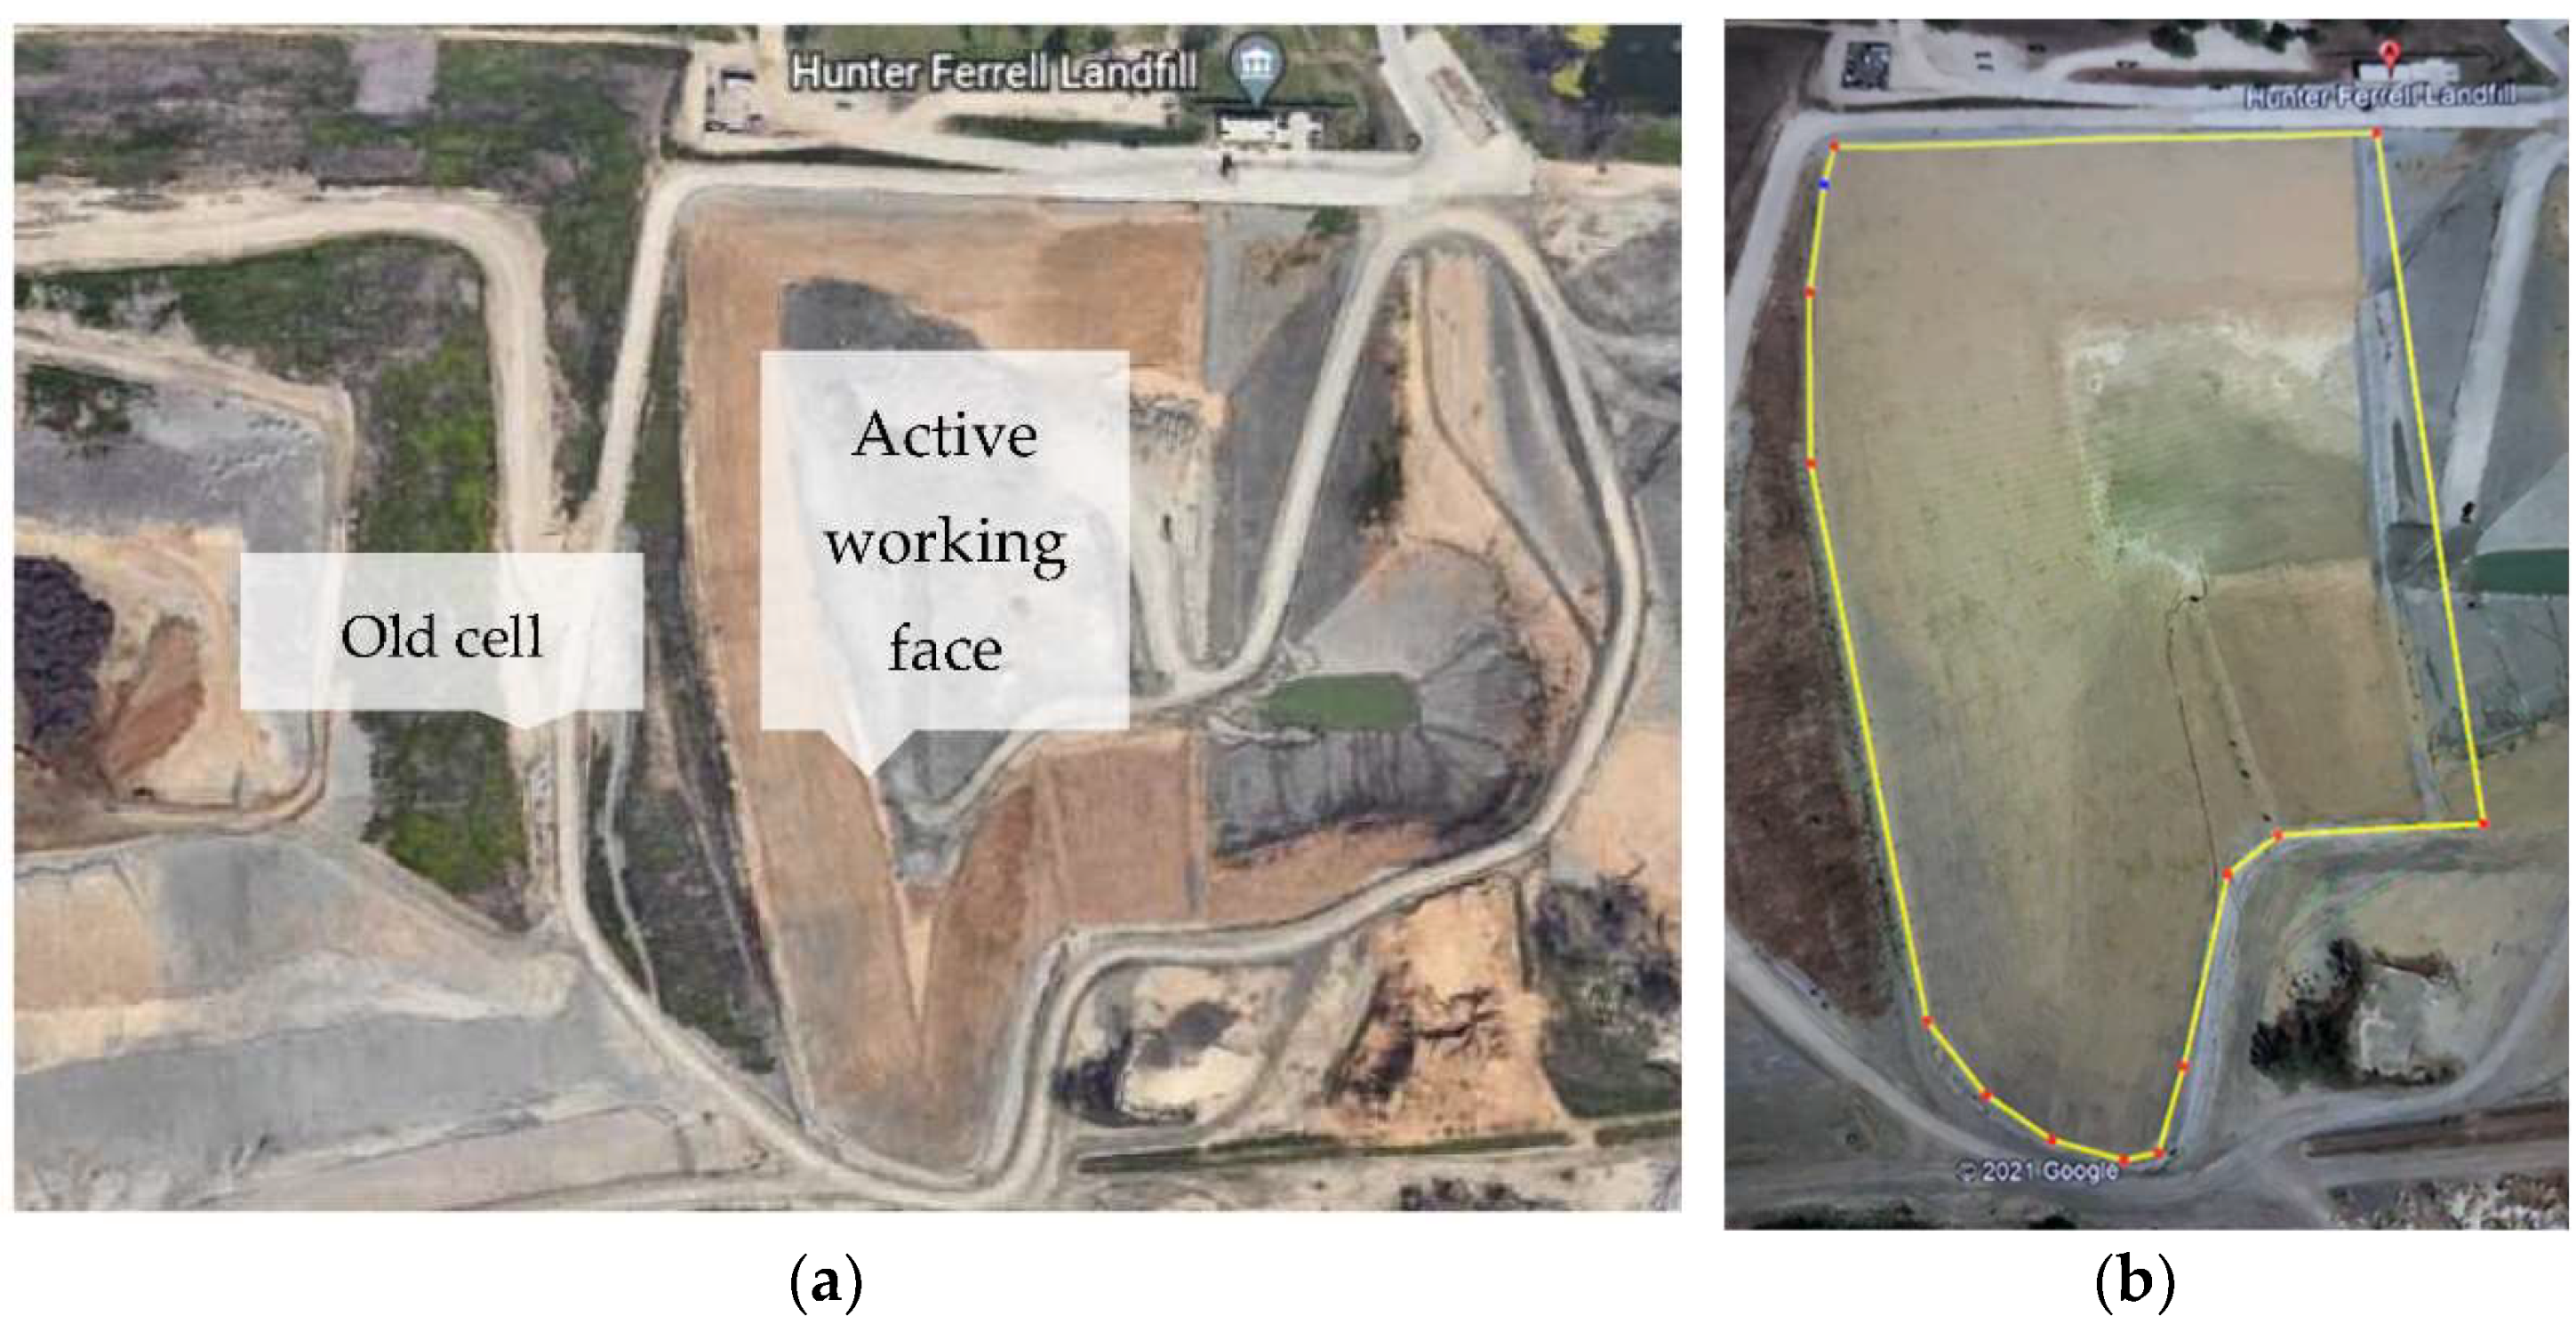
MSW sampling was performed on the working face of Hunter Ferrell Irving Landfill, Texas, USA.
Figure 2 shows the location of the sample collection. The precise locations of waste sample collection were marked by red dots. Waste was scooped from one chosen location, then mixed and quartered on another surface. Sample collection was done without any biases. This was mandatory for making the samples representative as municipal solid waste is composed of varied materials. A total of 8 bags of samples, based on literature recommended by Sharma and McBean [
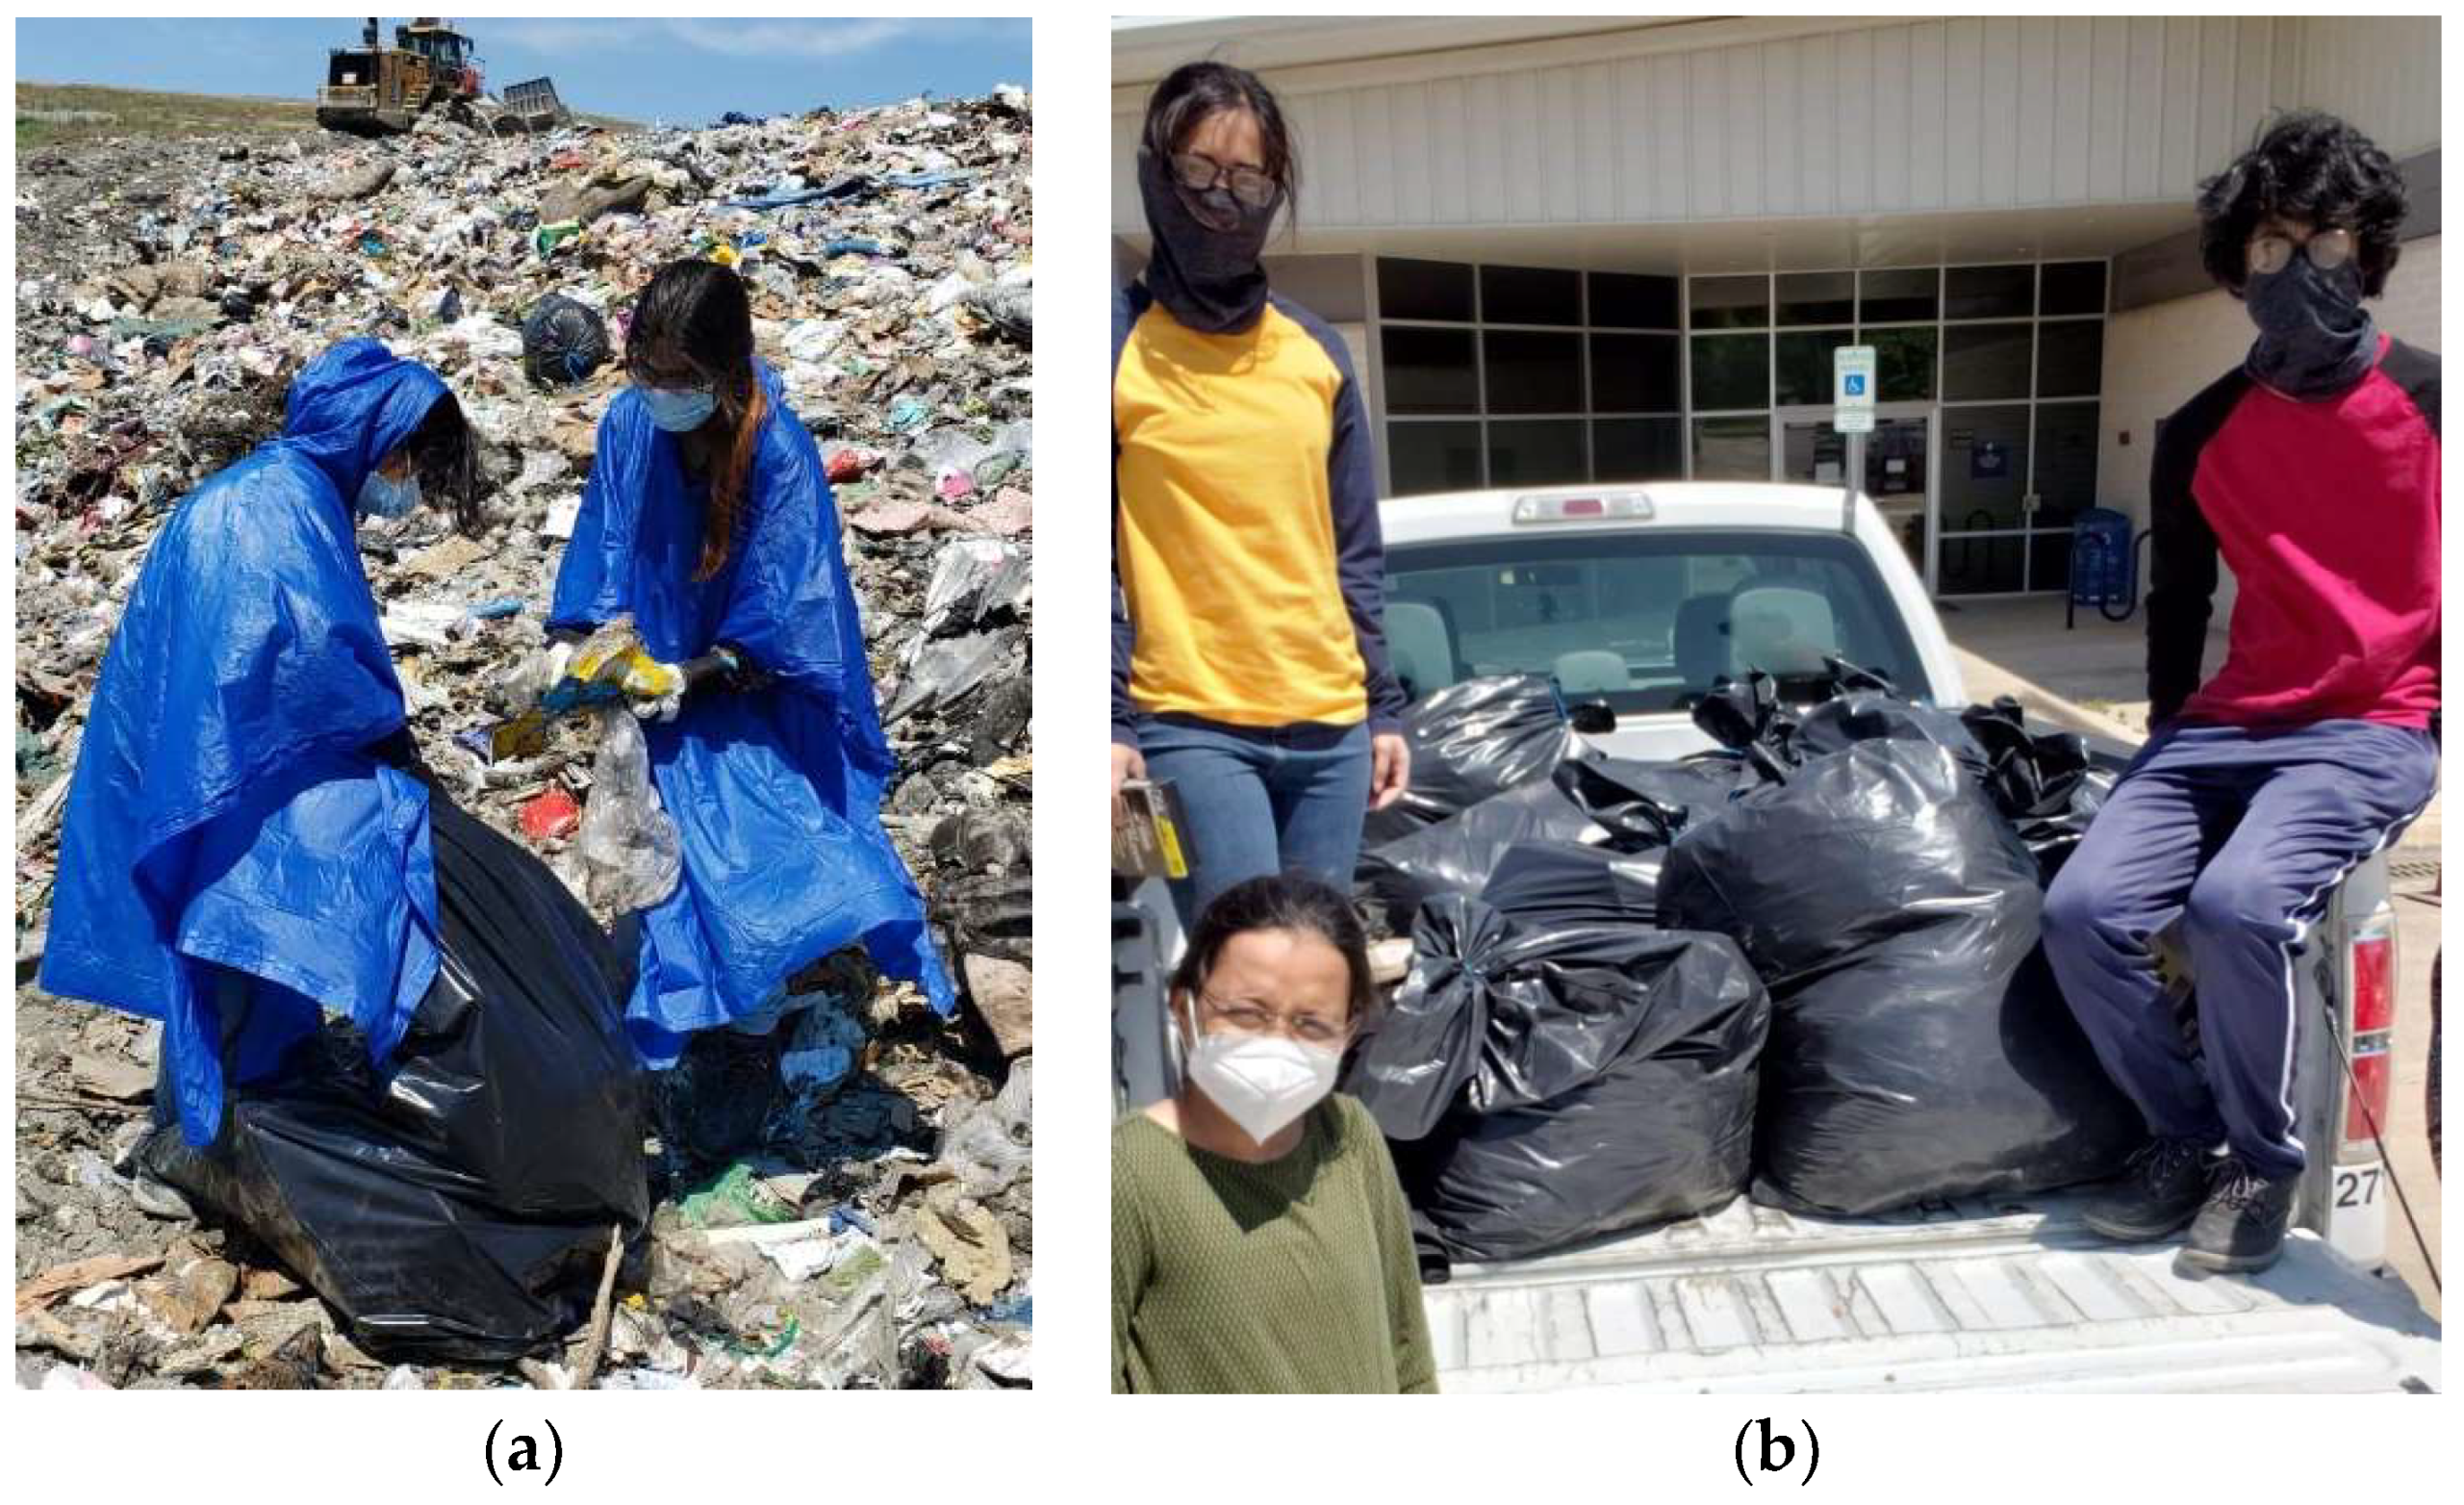
17], each weighing 20 to 25 lb., were collected from one of the randomly chosen quarters. Waste collection and sample bag size are shown in
Figure 3.
Figure 3a shows a real photo of waste collection in the landfill. Since samples were collected during the pandemic period, PPE was worn as a protection measure. After collection, the samples were carried back to the laboratory by the university truck.
Figure 3b shows the size of the sample bags. Social distancing being a mandate at that time, the safe distance was maintained while taking the photo and while handling the samples. The dates of the sample collection are as follows (
Table 2).
The collected samples were brought promptly to the laboratory in sealed plastic bags. All the samples were stored and preserved at approximately 38 °F (below 4 °C) in an environmental growth chamber for the conservation of moisture and other initial properties of the collected samples.
2.2. MSW Characterization
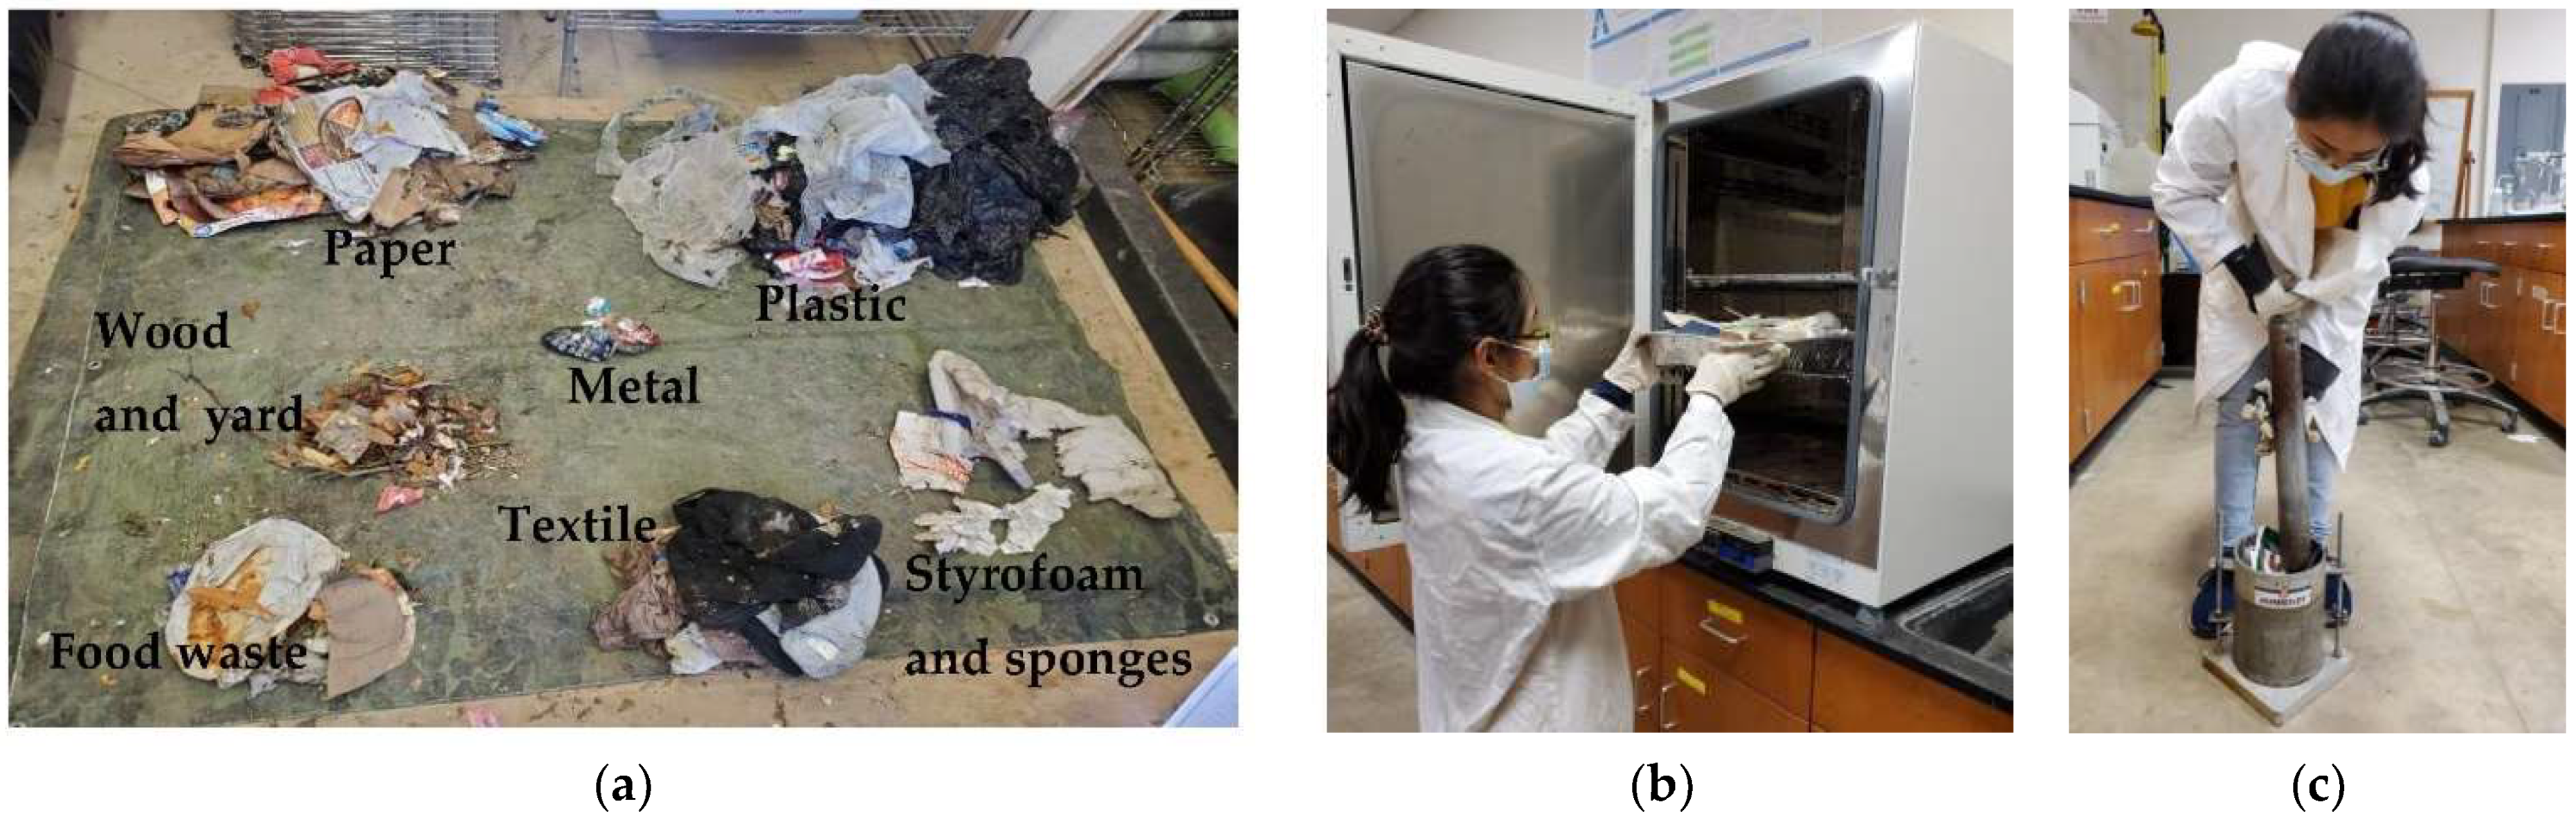
MSW characterization was conducted on each of the 56 bags by visual observation, and the samples were manually sorted in 10 sets according to waste type following ASTM D5231 (Standard Test Method for Determination of the Composition of Unprocessed Municipal Solid Waste). The categories were: paper, plastic, food waste, textiles, wood and yard waste, metals, glass, Styrofoam and sponge, construction and demolition debris, and others. The contents of each category are listed in
Table 3. Wet weight or natural moist weight was considered for physical composition. All the separated wastes were then weighted and represented in the percentage of total waste. MSW after sorting is depicted in
Figure 4a. The tests that are conducted after the sorting of waste are shown in
Figure 4b,c.
Figure 4b depicts the samples being dried in the oven for the moisture content test, and
Figure 4c depicts the process of compacting the samples for the compacted unit weight test.
2.3. Moisture Content Test
Moisture content testing was performed monthly on each bag of the collected sample following the ASTM standard method. Collected samples were stored in a cold room at a stable temperature of 4 °C for retaining the actual field moisture content. Representative samples were utilized for the test for a better representation of the original MSW since the samples showed a wide range of variation. In this study, a representative sample is one that keeps the same proportion of each component contained in the original sample bag. Results from MSW characterization were applied in this instance. About 2 lbs. of samples were used following the study conducted by Taufiq [
18]. The samples were dried at 105 °C in the oven for 24 h. The weight of the samples was recorded before and after this process. Weight loss is considered moisture loss during the process.
Moisture loss was presented in both wet and dry basis using the following Equations (1) and (2), respectively.
where M
w is the mass of water, M
t is the total wet mass of waste and M
s is the dry mass of waste after drying.
2.4. Compacted Unit Weight
Standard Proctor Test (ASTM D698) was performed on all the sample bags to determine the compacted unit weight of the MSW samples at their natural moisture content. The tests were conducted using representative samples that included the same amount of every component as in the original sample bag. A larger-sized compaction mold with a 6-inch inside diameter, 6.1-inch height, with a volume of 1/10 cubic feet with a detachable collar was used. Solid waste was put in three layers into the mold so that the waste fills up to the rim. A hammer of 5.5 lbs. with a face of 2 inches was dropped from a height of 12 inches, and 75 blows on each of the three layers of MSW were counted to attain the required compaction.
2.5. Separation of Plastic Wastes from Other Wastes
Following characterization, MSW samples were separated into two categories—plastic wastes and other wastes. All kinds of plastics—PETE, HDPE, PVC, LDPE, PP, PS, and others—were included in the plastic category, whereas anything other than plastic was considered as other waste. As a result, paper, food waste, textiles, wood and yard waste, metal, glass, Styrofoam, construction and demolition debris, and other wastes, including mixed small objects, all formed the other waste category. Different kinds of plastics and other wastes were later separately wrapped in cling wrap, providing two major benefits—forming a compacted, structured shape and size that is a better representation of the condition of waste in a landfill and making volume estimation using Archimedes’ principle more convenient.
Table 4 shows the experiments that were carried out on plastic waste and other waste.
2.6. Measuring Weight Percentage
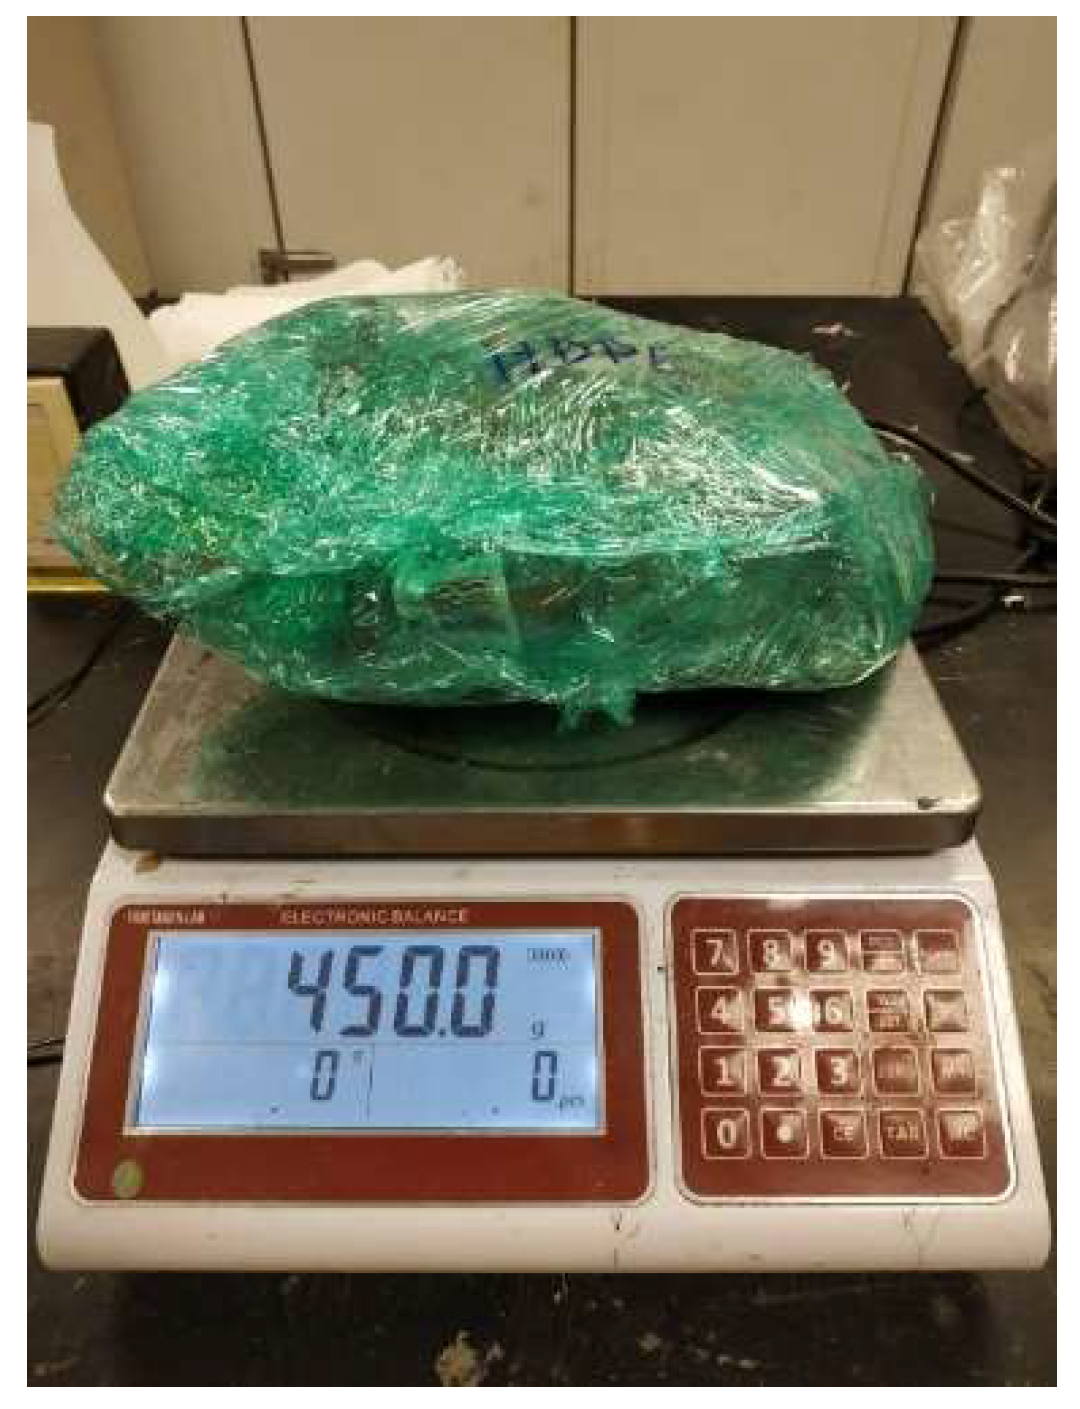
Wrapped plastics were marked according to their type and were weighed individually. The weight of each type of plastic was recorded using a weighing machine shown in
Figure 5. After measuring the weight of all plastic wastes, the weight percentage of each type was calculated. The weight percentage of other wastes was calculated using the percentage of all waste components apart from plastics found in the MSW characterization step.
2.7. Volume Estimation
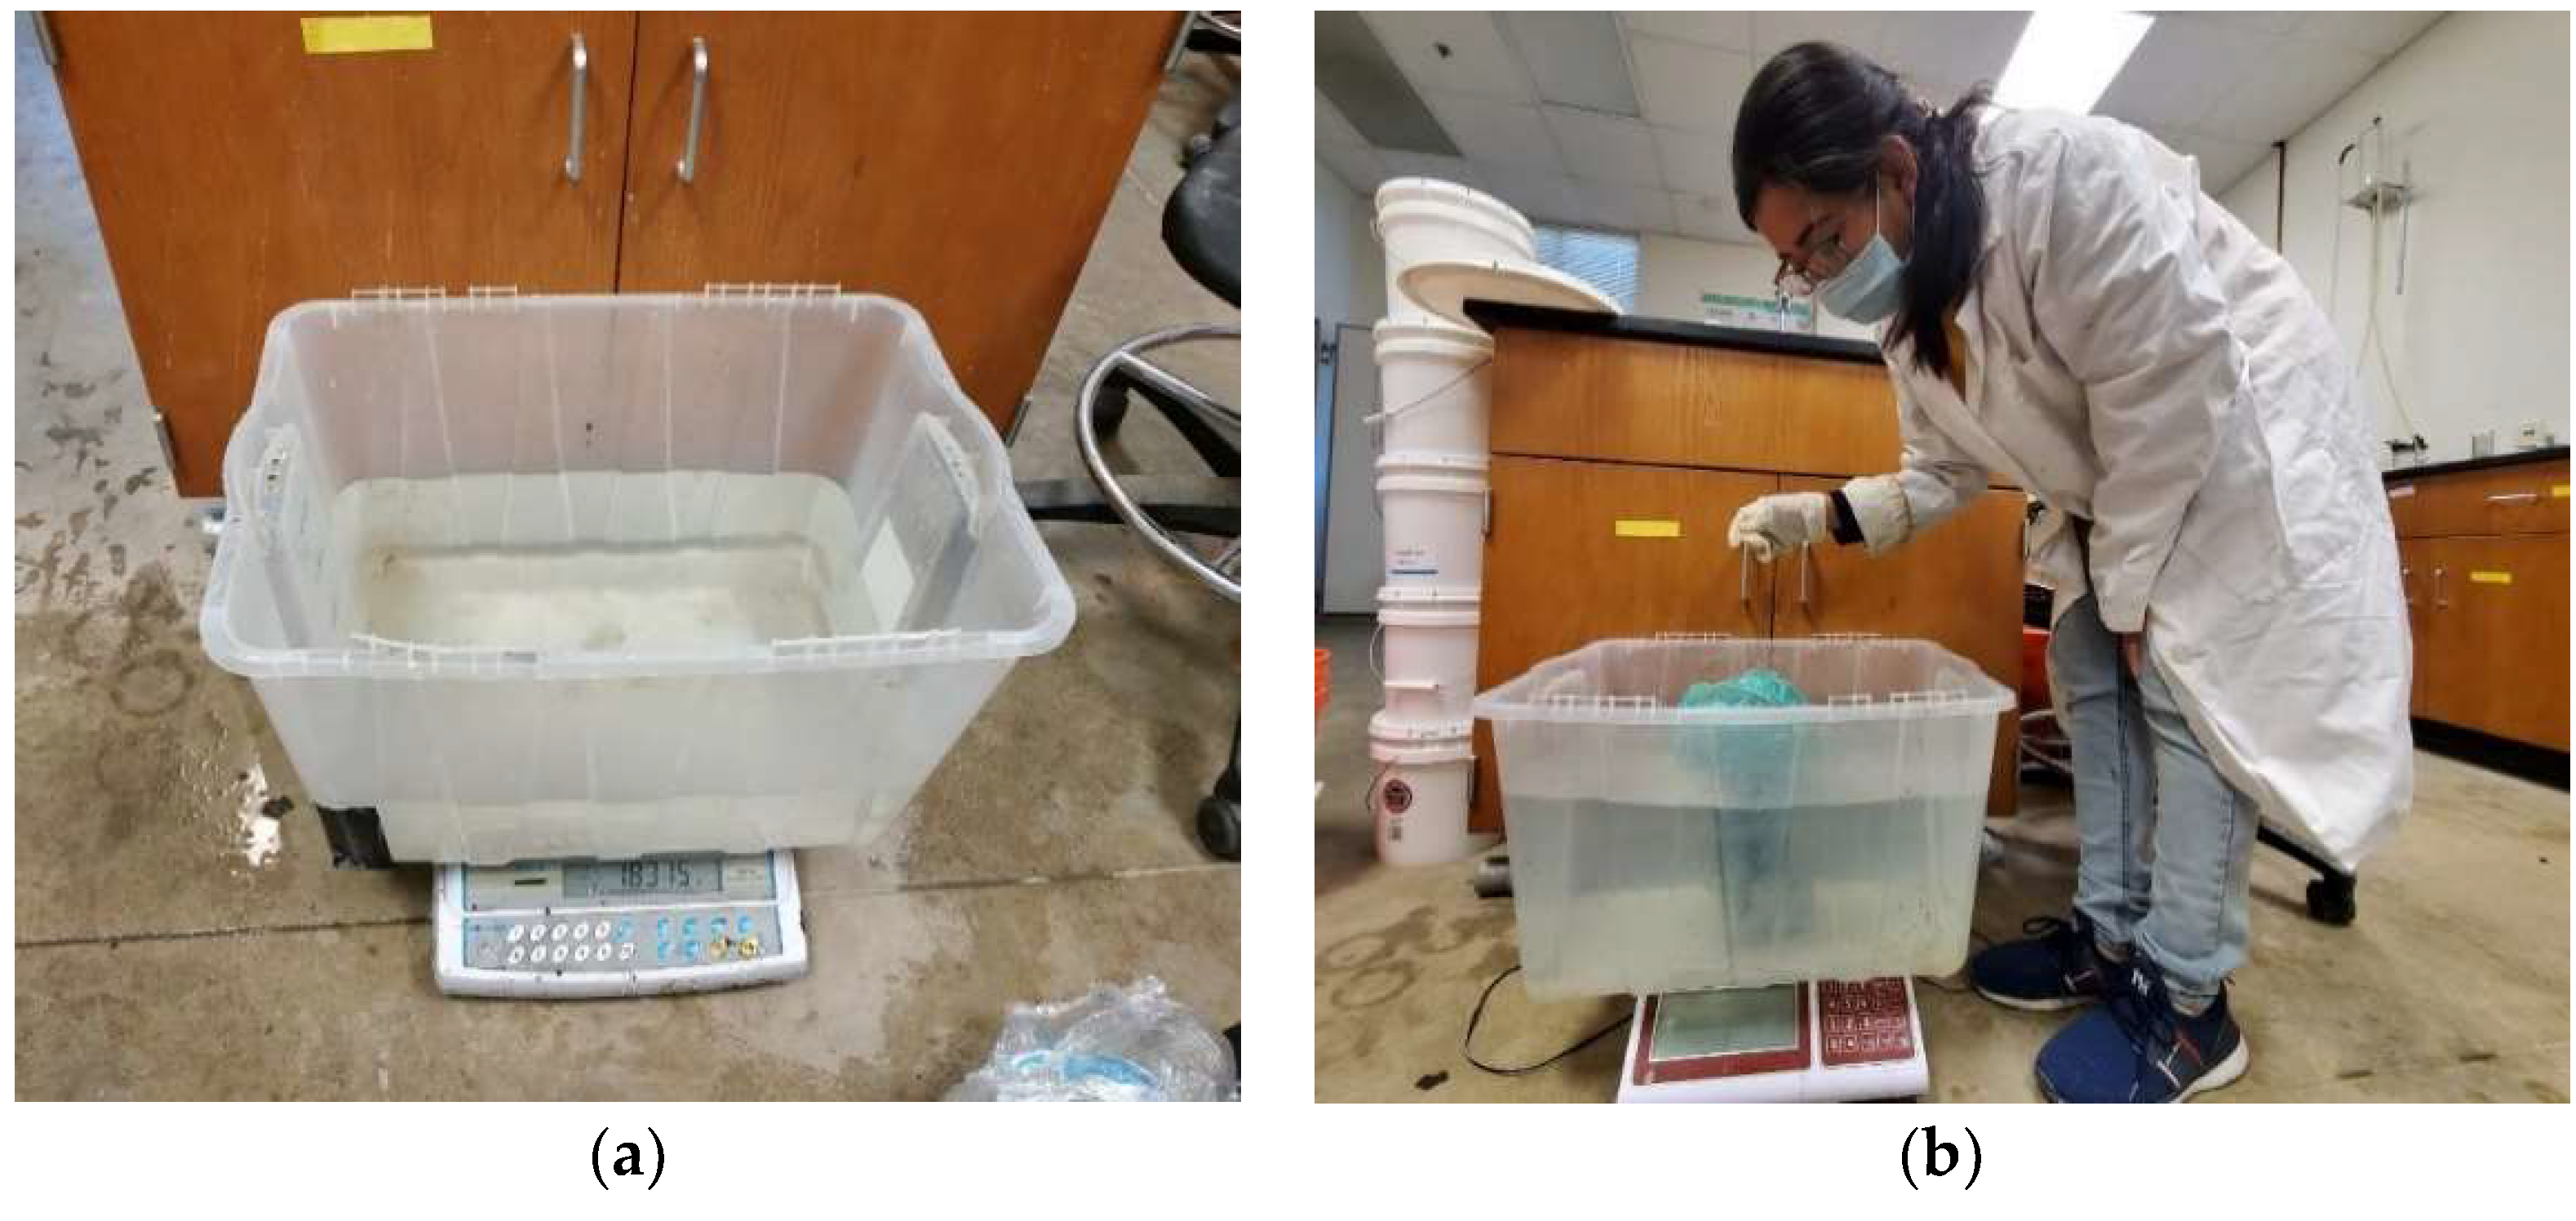
Different types of plastics and other wastes wrapped separately were submerged in water to measure volume by applying the Archimedes’ principle. Individual packages were submerged in water using sufficient weight attached to them as the density of most plastic wastes was lighter than the density of water.
Figure 6 demonstrates the method followed to estimate plastic volume in the laboratory following Archimedes’ principle.
3. Results
3.1. MSW Characterization
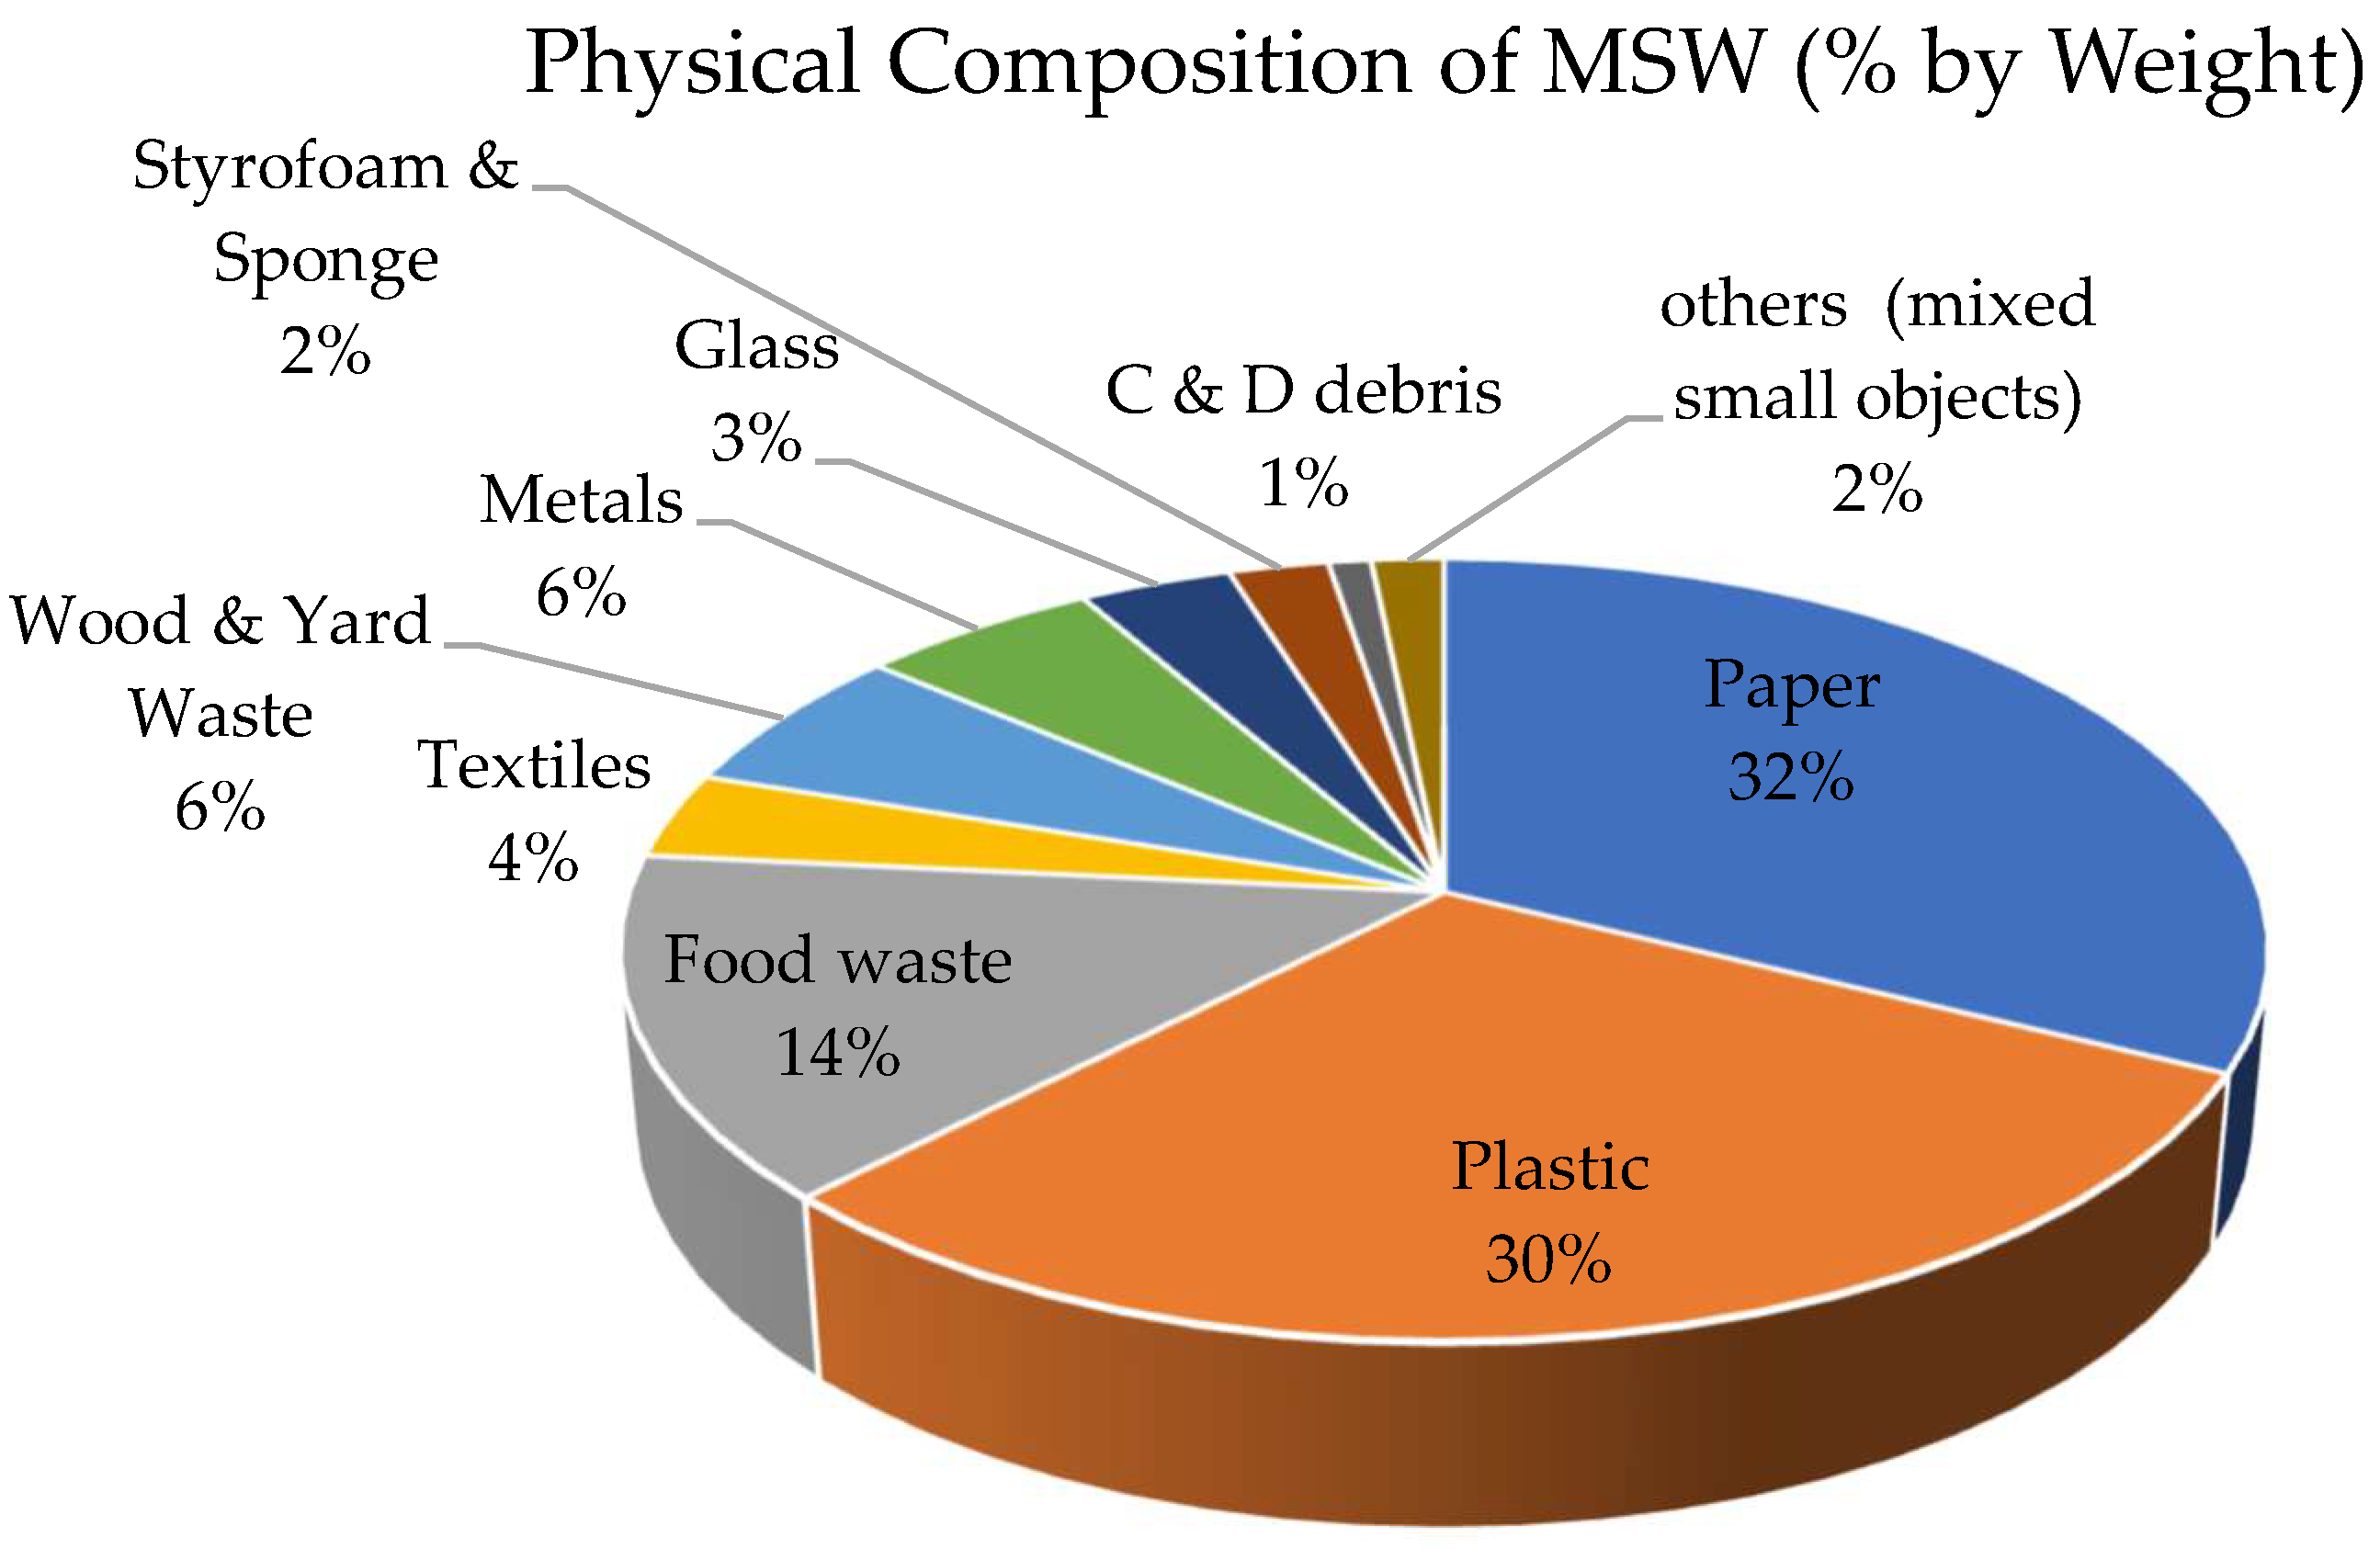
To investigate the potential increase in plastic waste during the COVID-19 pandemic, the physical composition of MSW was assessed. In this scope, the average physical composition of MSW samples is exhibited in
Figure 7. Paper and plastic, 32% and 30% respectively, were the main constituents and comprised 62% of the total waste collected for the study. Food waste comprised 14%, whereas textiles (4%), wood and yard wastes (6%), metals (6%), glass (3%), Styrofoam and sponge (2%), construction and demolition debris (1%), and others (2%) comprised the remaining percentage of collected MSW. Due to higher moisture-carrying capacity, a larger percentage of paper results in a higher weight percentage than plastic. Since paper is decomposable and contributes to gas generation in landfills, paper is less important from a landfill volume consumption perspective. On the other hand, plastic products are nondegradable and remain in a landfill for about 500–1000 years. Therefore, an increased amount of plastic implies a great concern in the volume consumption of landfills. The waste components had a standard deviation of 6.72%, 5.46%, 9.03%, 3.58%, 4.26%, 2.32%, 3.93%, 0.38%, 1.21%, and 1.79%, respectively, for paper, plastic, food waste, textiles, wood and yard waste, metal, glass, Styrofoam and sponge, construction and demolition debris, and other waste collected over the whole study period.
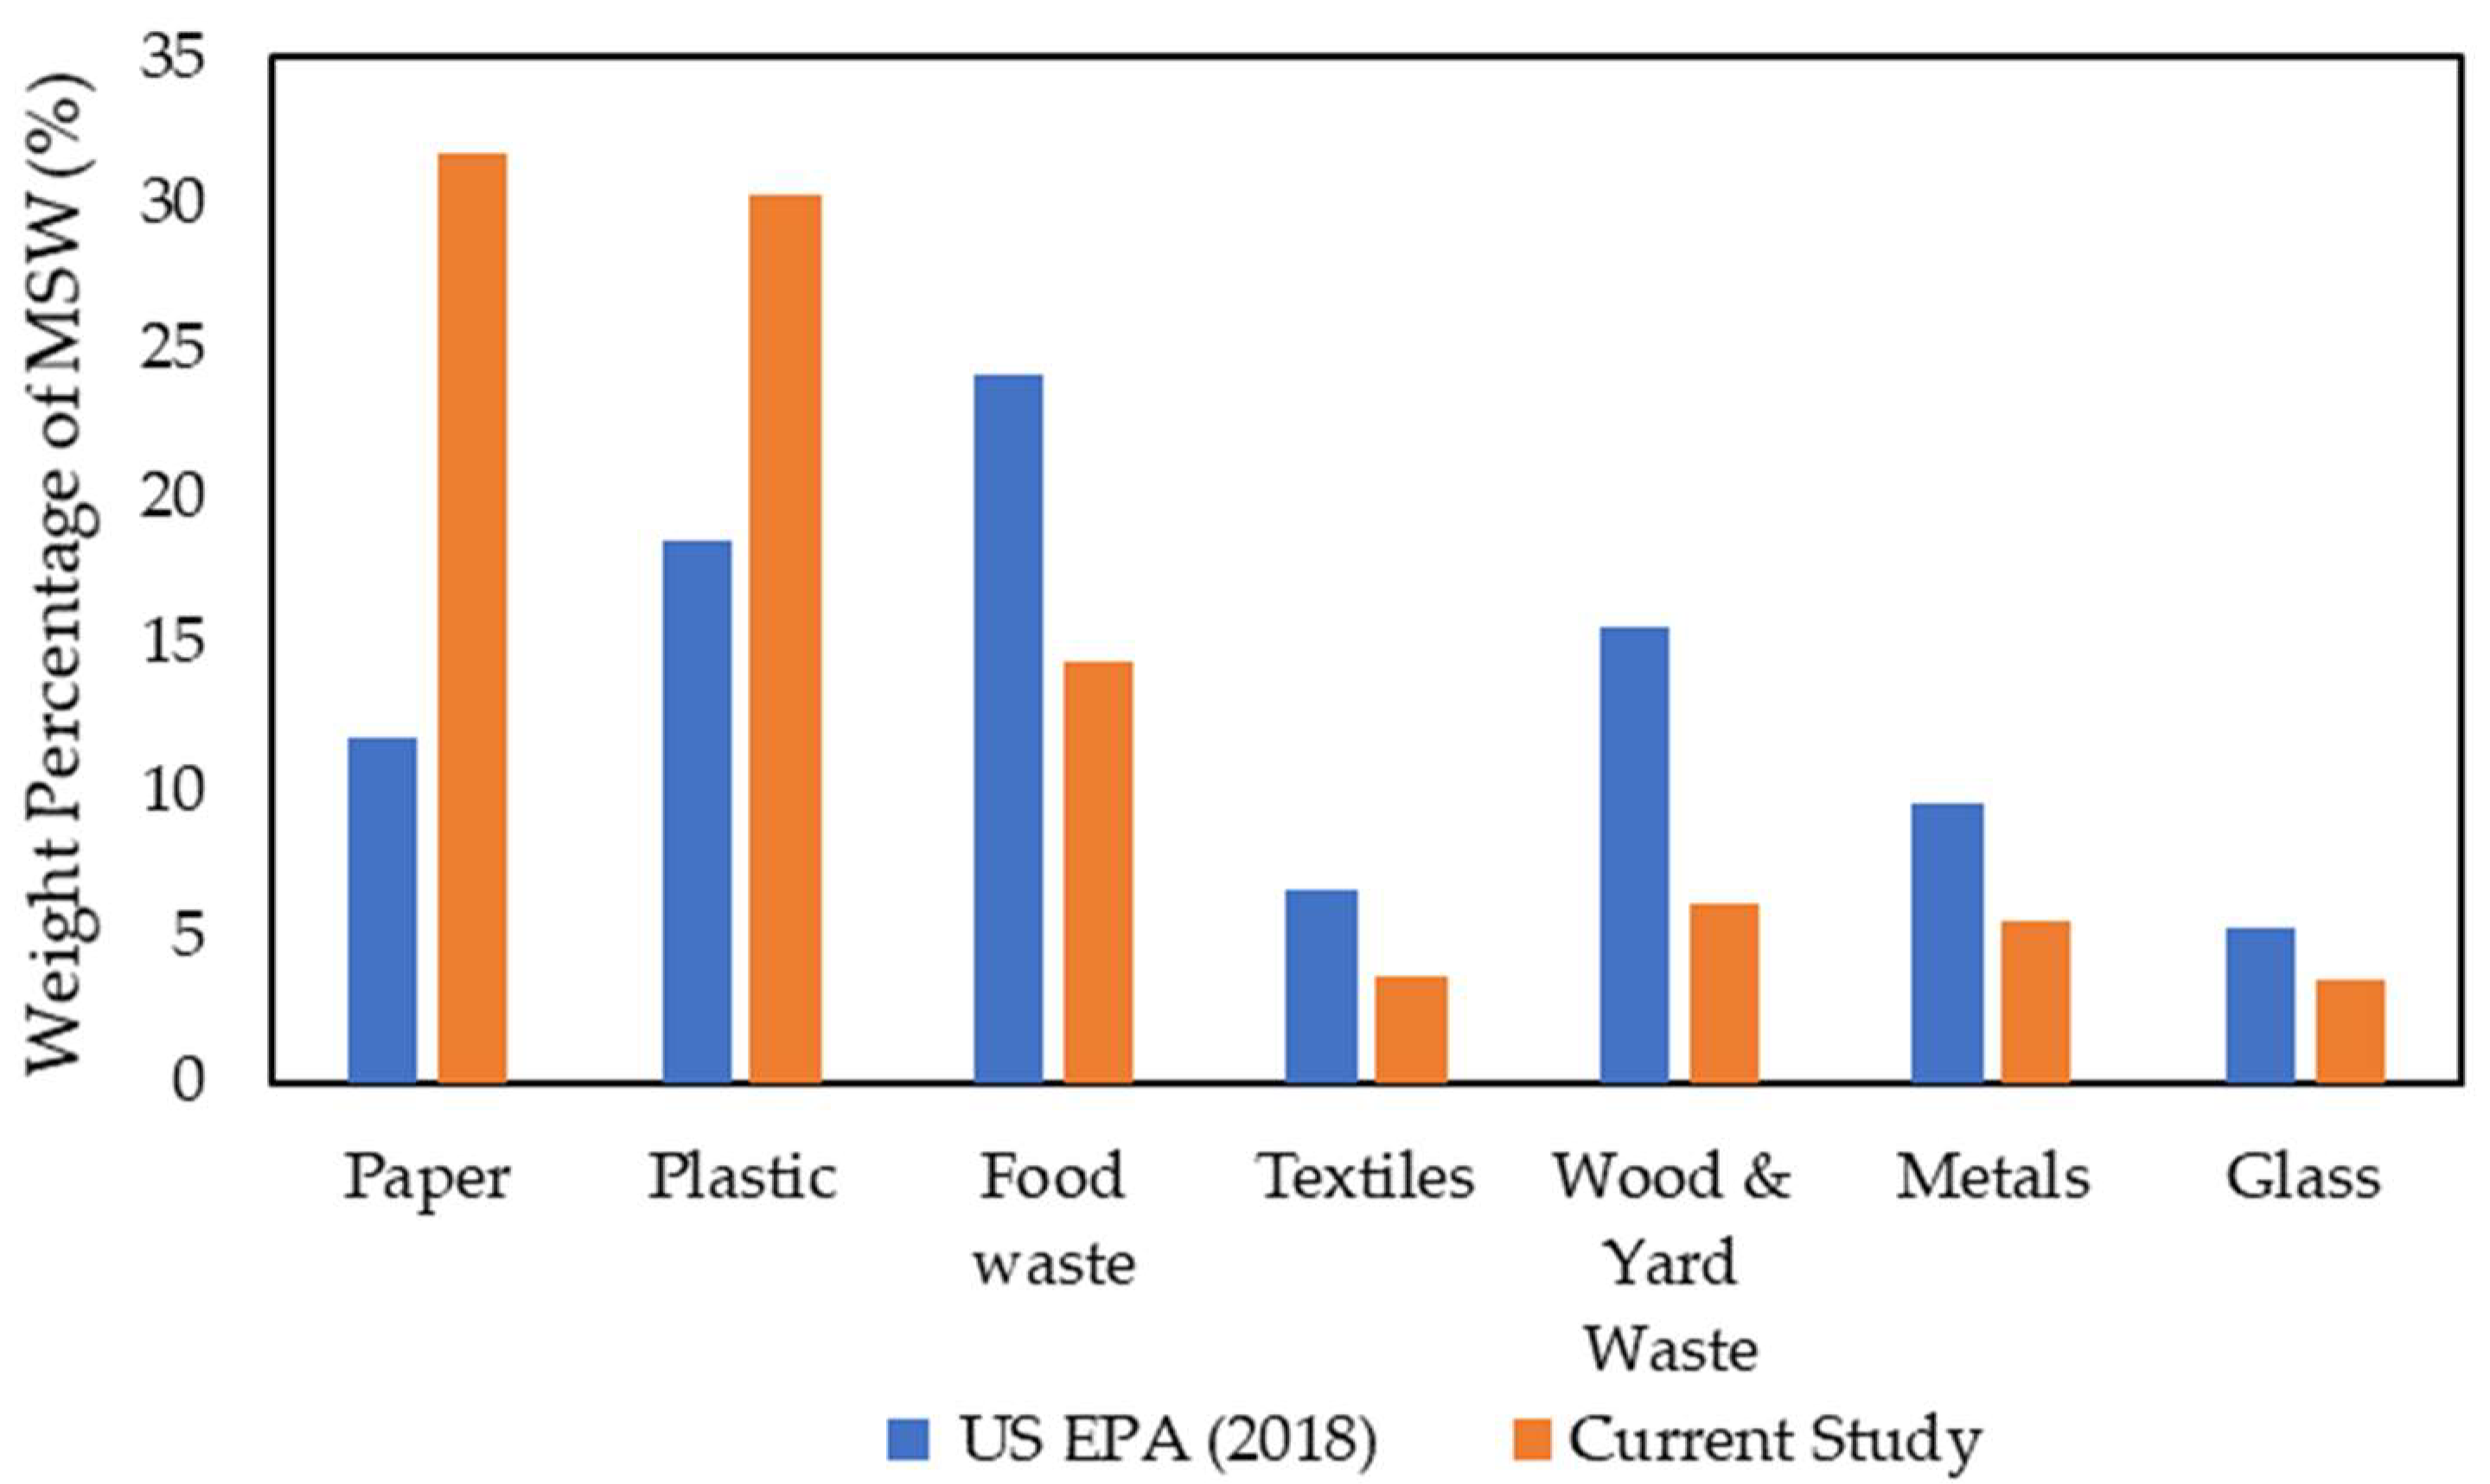
The percentages of different waste components in the current study were compared with the percentage of different components of MSW deposited in a landfill in the calendar year 2018 reported by the U.S. Environmental Protection Agency (USEPA) [
19]. USEPA is a national organization that publishes reports on the generation and management of MSW in the United States of America. This result of the comparison is shown in
Figure 8. The comparison shows a significant increase of 12% in plastic waste generation during the COVID-19 pandemic period, which is almost twice what the US EPA records (18.5%). The weight percentage of paper increased by almost threefold, whereas textiles, metals, food waste, and wood and yard waste percentages decreased. Food waste and wood and yard waste both experienced large percentage declines to 10%. Glass and textile weight percentages differed from US EPA records by around 3% and 2%, respectively.
The conclusion drawn from the comparative analysis based on the weight percentage of MSW components is that the percentage of plastic waste in the current study was much greater than the most recent national statistics. The waste samples collected for the study were indicative of landfilled MSW produced during the COVID-19-infected period because the study was done during the peak of the pandemic scenario. Therefore, it can be said that the COVID-19 epidemic caused a high percentage rise in plastic waste of 12%.
3.1.1. Moisture Content Test
The moisture content of the collected samples was found to be in the range of 19–40% with an average of 24.7% on a wet basis, whereas it ranged from 19% to 62% with an average of 31.0% based on a dry basis for the collected samples. The result of the current study was compared with some of the reported moisture content of MSW from similar studies. The comparison is summarized in
Table 5.
Moisture contents of MSW suggested by different researchers vary within a wide range. Most of the moisture content recorded in this context ranges from 20% to 38%. The moisture content of the current study falls in the lower range, especially when comparing results with similar geographic and socio-economic regions. Islam [
24] conducted a study in Irving, Texas, and Taufiq [
18] conducted a study in Denton, Texas, where they found the plastic content to be 24.63% and 17.65% respectively. However, the moisture content of the present study was observed to be 21% less than the result of Islam [
24] and 34% less than the result of Taufiq [
18]. The result implies an abundant presence of waste components possessing lower moisture-carrying capacity in the current study. Looking at the characterization, plastic could be the only component that could make this major difference in the result since plastic waste has a low moisture-carrying capacity and is a dominant component in the waste stream. In other words, it can be reasonably suggested that lower moisture content has resulted from the presence of an increased amount of plastic waste.
3.1.2. Unit Weight Test
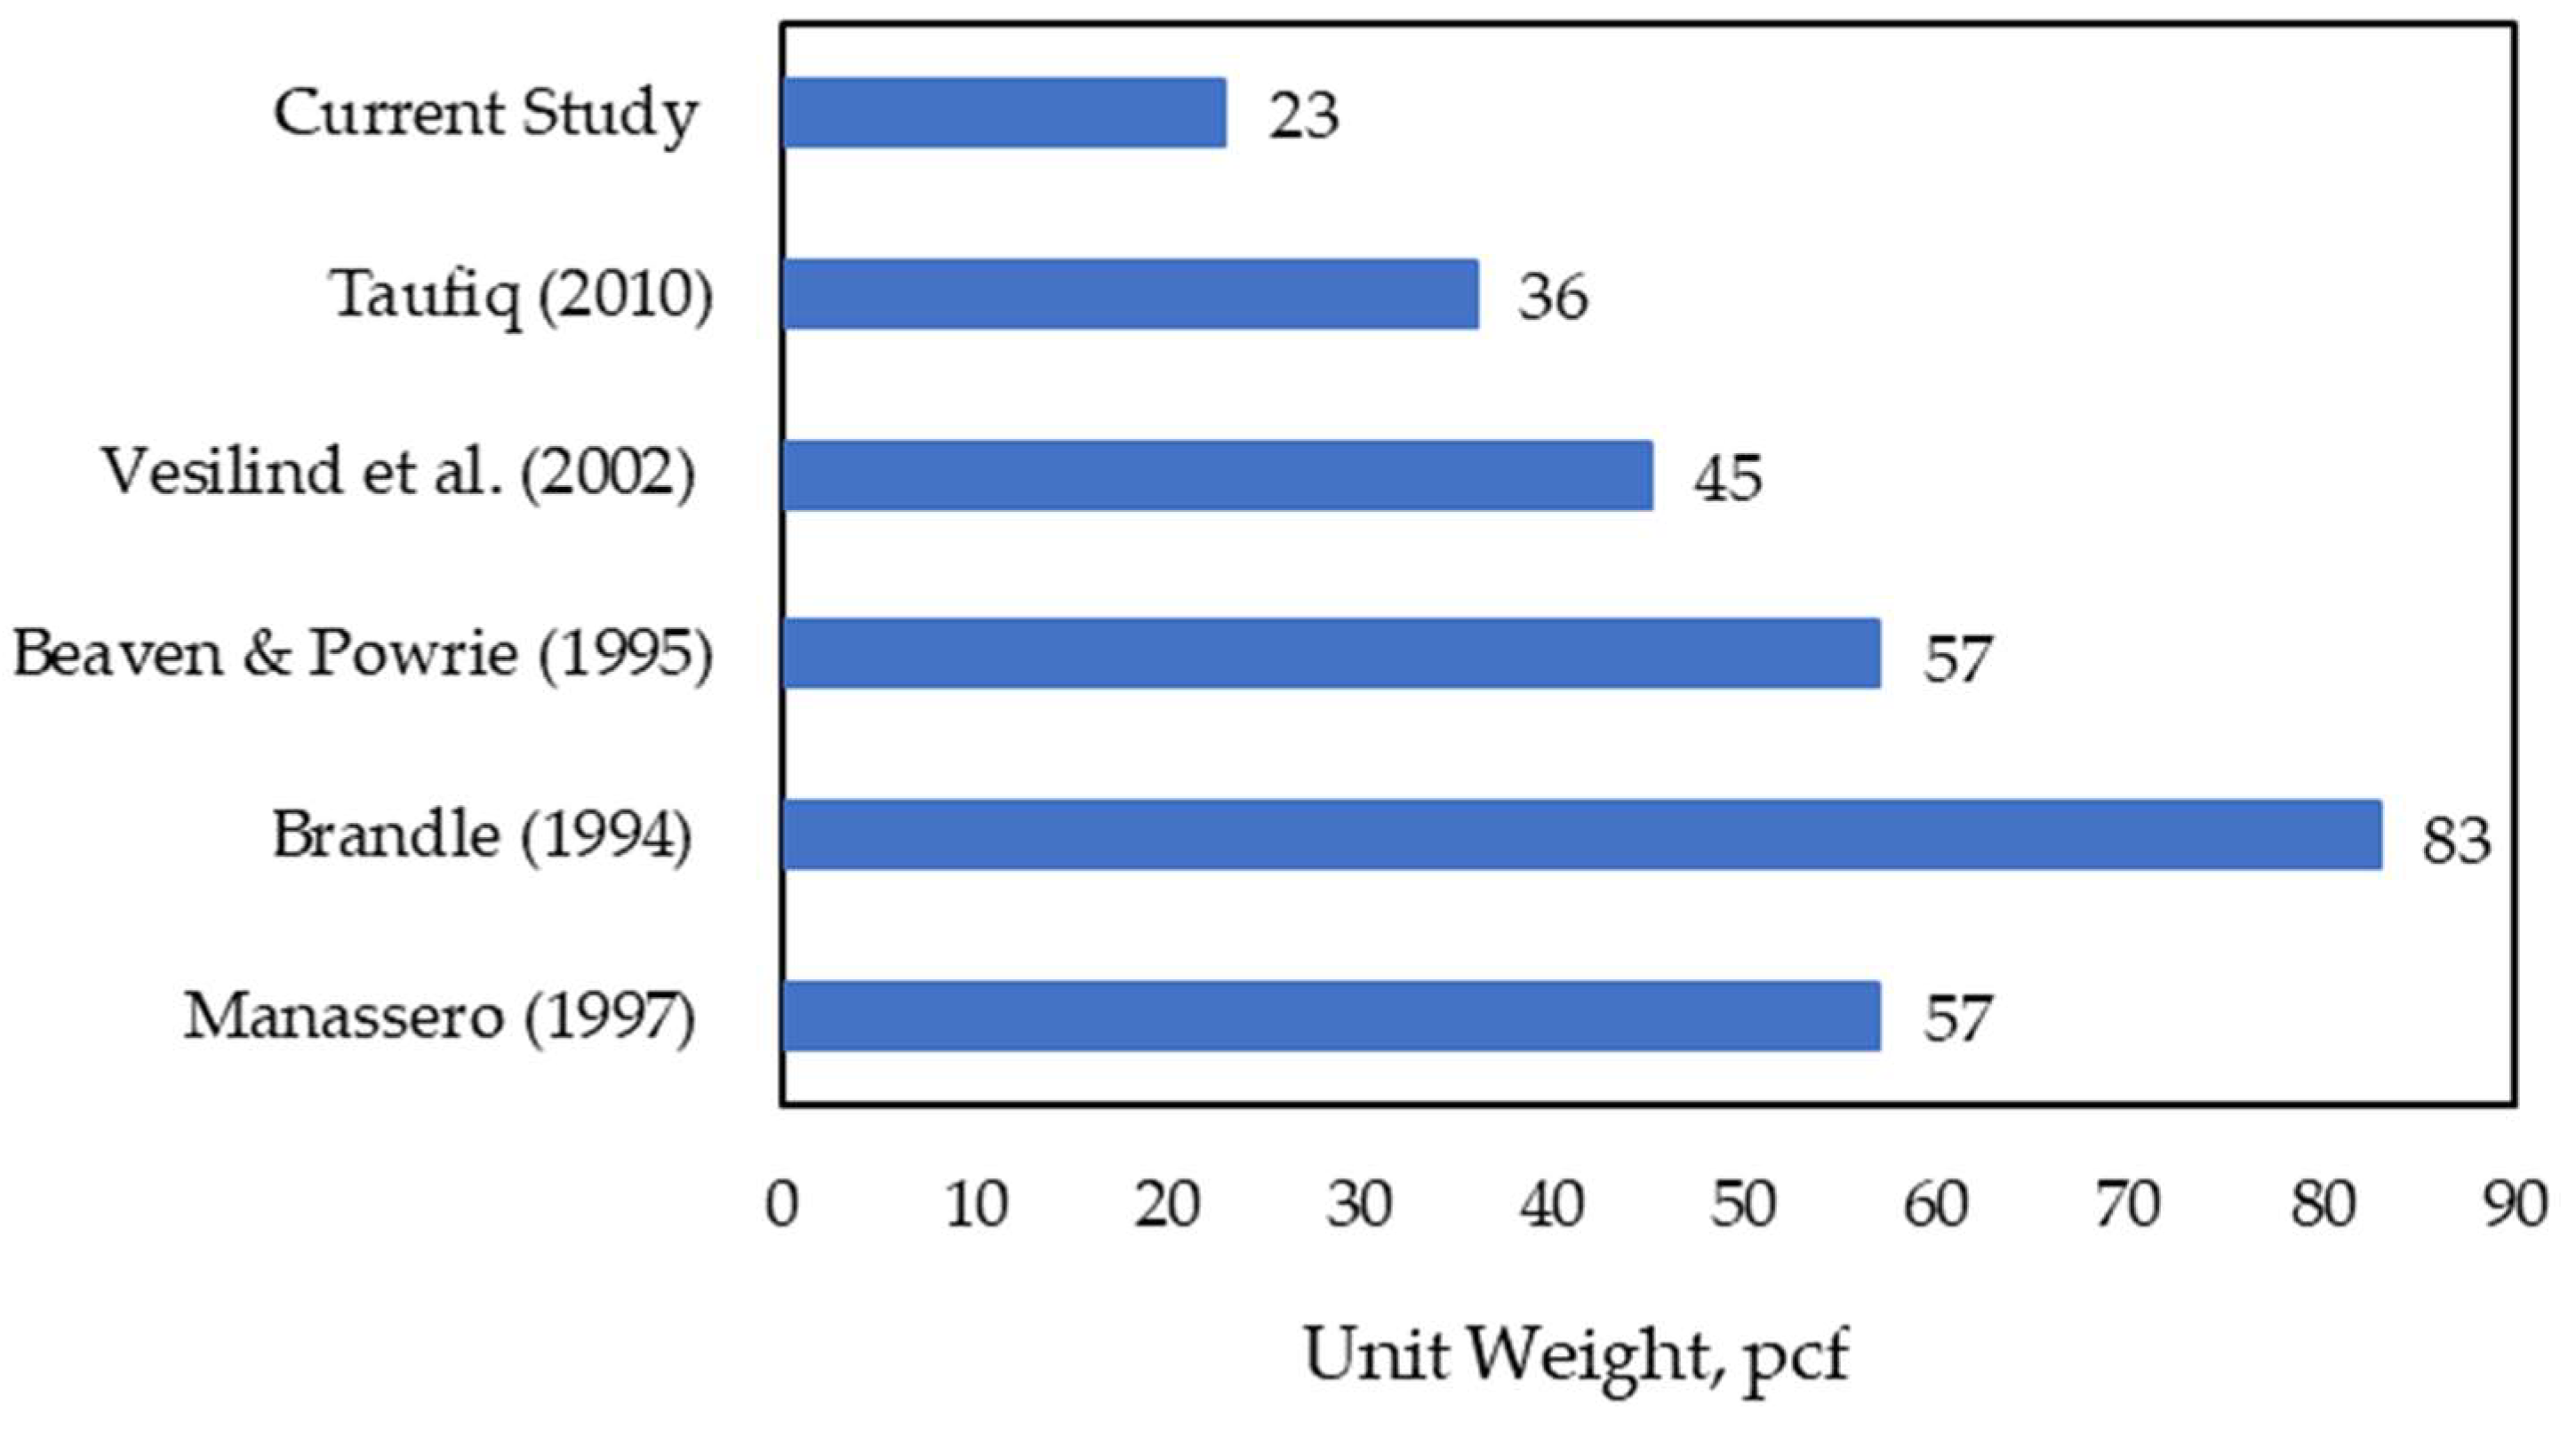
The unit weight of MSW in the current study ranged from 17 to 29 pcf with a standard deviation of 2.63. The average unit weights of some significant studies are listed here for comparison with the current study. A comparison of the Unit Weight of MSW with previous studies is shown in
Figure 9.
According to previous studies, the unit weight of MSW can vary in a wide range depending on compaction effort. The range of unit weight for most of the study was found in the range of 35 to 60 pcf. The maximum unit weight was observed in the study of Brandle (1994) [
25], with an average unit weight of 83 pcf, indicating heavy compaction of waste. The unit weight in the current study was found to be in the lower range suggesting the presence of lightweight material in higher quantity. Even comparing results involving similar sources, i.e., landfilled waste (Vesilind et al. [
21], and Taufiq, [
18]), and similar compaction efforts (Taufiq, [
18]), the result fell in a lower range than expected. The unit weight of waste in the current study was 49% less than Vesilind et al. [
21] and 36% less than Taufiq, [
18] (plastic waste percentage of 17.65%). The outcome of the current investigation verifies the presence of a substantial amount of plastic waste because plastic is a lightweight material that requires more effort to compact. The finding, therefore, confirms that there is more plastic waste present, which may lead to a lower range of unit weight in the waste stream. The MSW having less unit weight occupies more space in the landfill. The COVID-19 epidemic consequently has a detrimental effect on the lifetime of landfills.
Figure 9.
Comparison of unit weight of MSW with previous studies [
18], [
21], [
26], [
25], [
20].
Figure 9.
Comparison of unit weight of MSW with previous studies [
18], [
21], [
26], [
25], [
20].
3.2. Volume Estimation
To determine the impact of the increased amount of plastic waste on the consumption of landfill space during the COVID-19 pandemic, the volume of plastic waste was estimated and compared to the volume of all other wastes combined. In order to determine the overall unit weight of the MSW, the total volume of the waste samples was calculated by adding the volume of plastic waste and other waste. This method of calculating unit weight almost exactly matched the results obtained from the tests on compacted unit weight, validating the volume estimation.
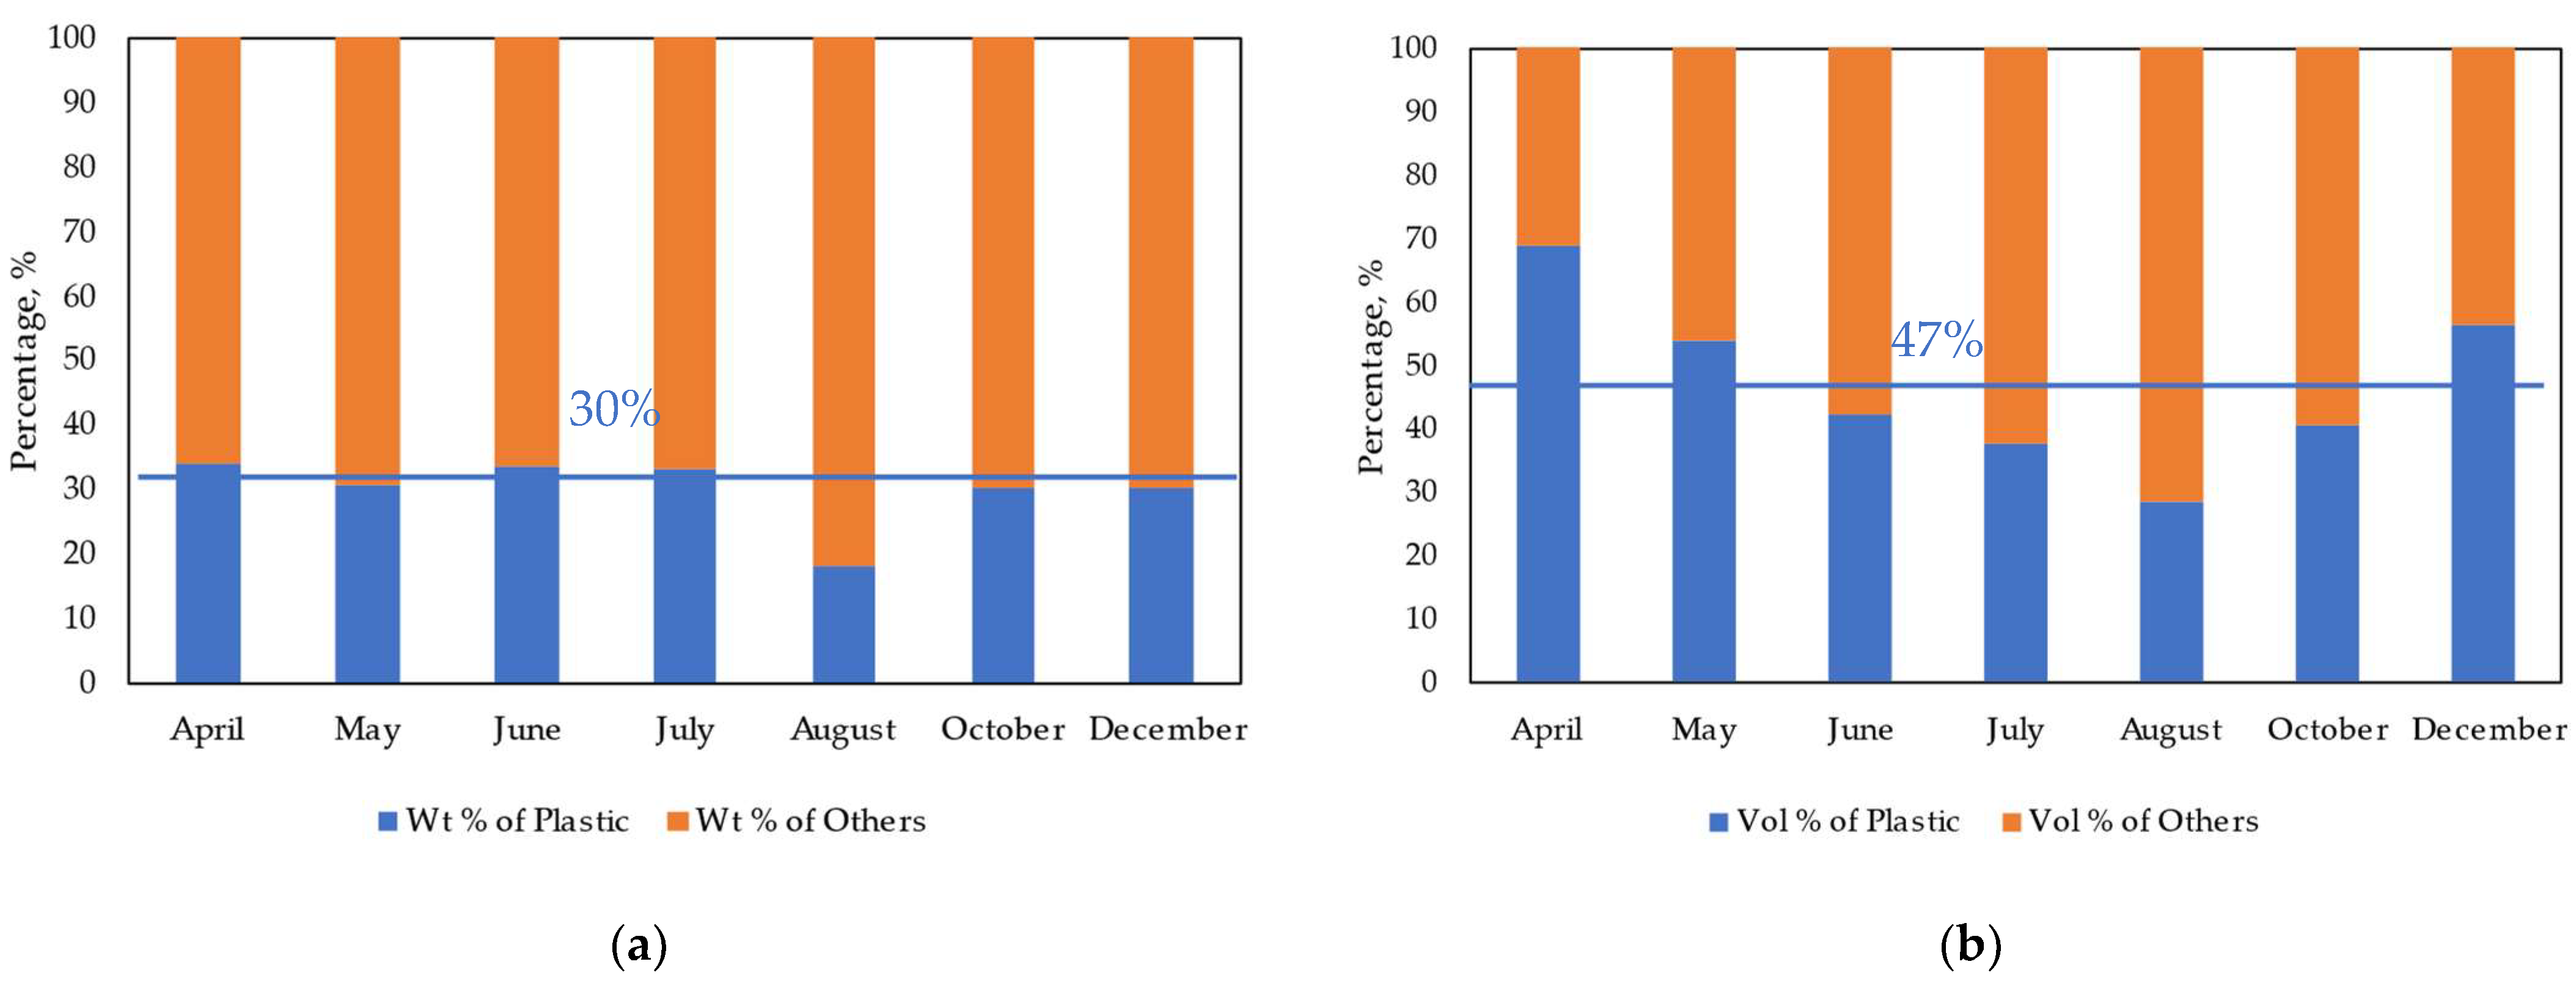
Figure 10 shows the monthly variation in the weight percentage of plastic waste relative to the weight percentages of other wastes and the volume percentage of plastic waste relative to the volume percentages of other wastes.
Figure 10a shows that, on average, 30% of the total weight of MSW was composed of plastic waste. On the other hand,
Figure 10b reveals that 47% of the MSW’s overall volume was comprised of plastic waste. Plastic constituted approximately half of the waste volume while comprising only a modest percentage of the sample’s total weight. The results simply suggest that plastic, being a lightweight material, takes up more space in a landfill than other wastes.
The graphs also suggest that plastic volume fluctuated over a broader range than its weight. The entire variance in plastic volume was greater than its weight because different plastics have varying unit weights and waste samples are highly heterogeneous. To put it simply, if plastic and other waste of the same weight are compared, plastic takes up significantly more volume and that may vary in a wider range. This outcome is crucial in estimating the volume consumption in the landfill.
Due to the landfills’ current practice of accepting waste based on weight rather than volume, not considering the volume of waste will cause the landfill to fill up sooner. The waste that was immediately collected from the working face was solely recorded for its weight. This indicates that the landfill estimates that only 30% of the total volume of MSW is occupied by plastic. However, it is evident from the volume analysis that the same amount of MSW during COVID-19 consumes 57% more volume due to the change in the physical composition due to the pandemic. As plastic has less unit weight, the presence of more plastic in the waste stream results in decreasing the unit weight of the MSW. To quantify the effect of the increased amount of plastic in MSW volume, it is necessary to develop a correlation between the plastic weight and the volume that the plastic occupies in the landfill.
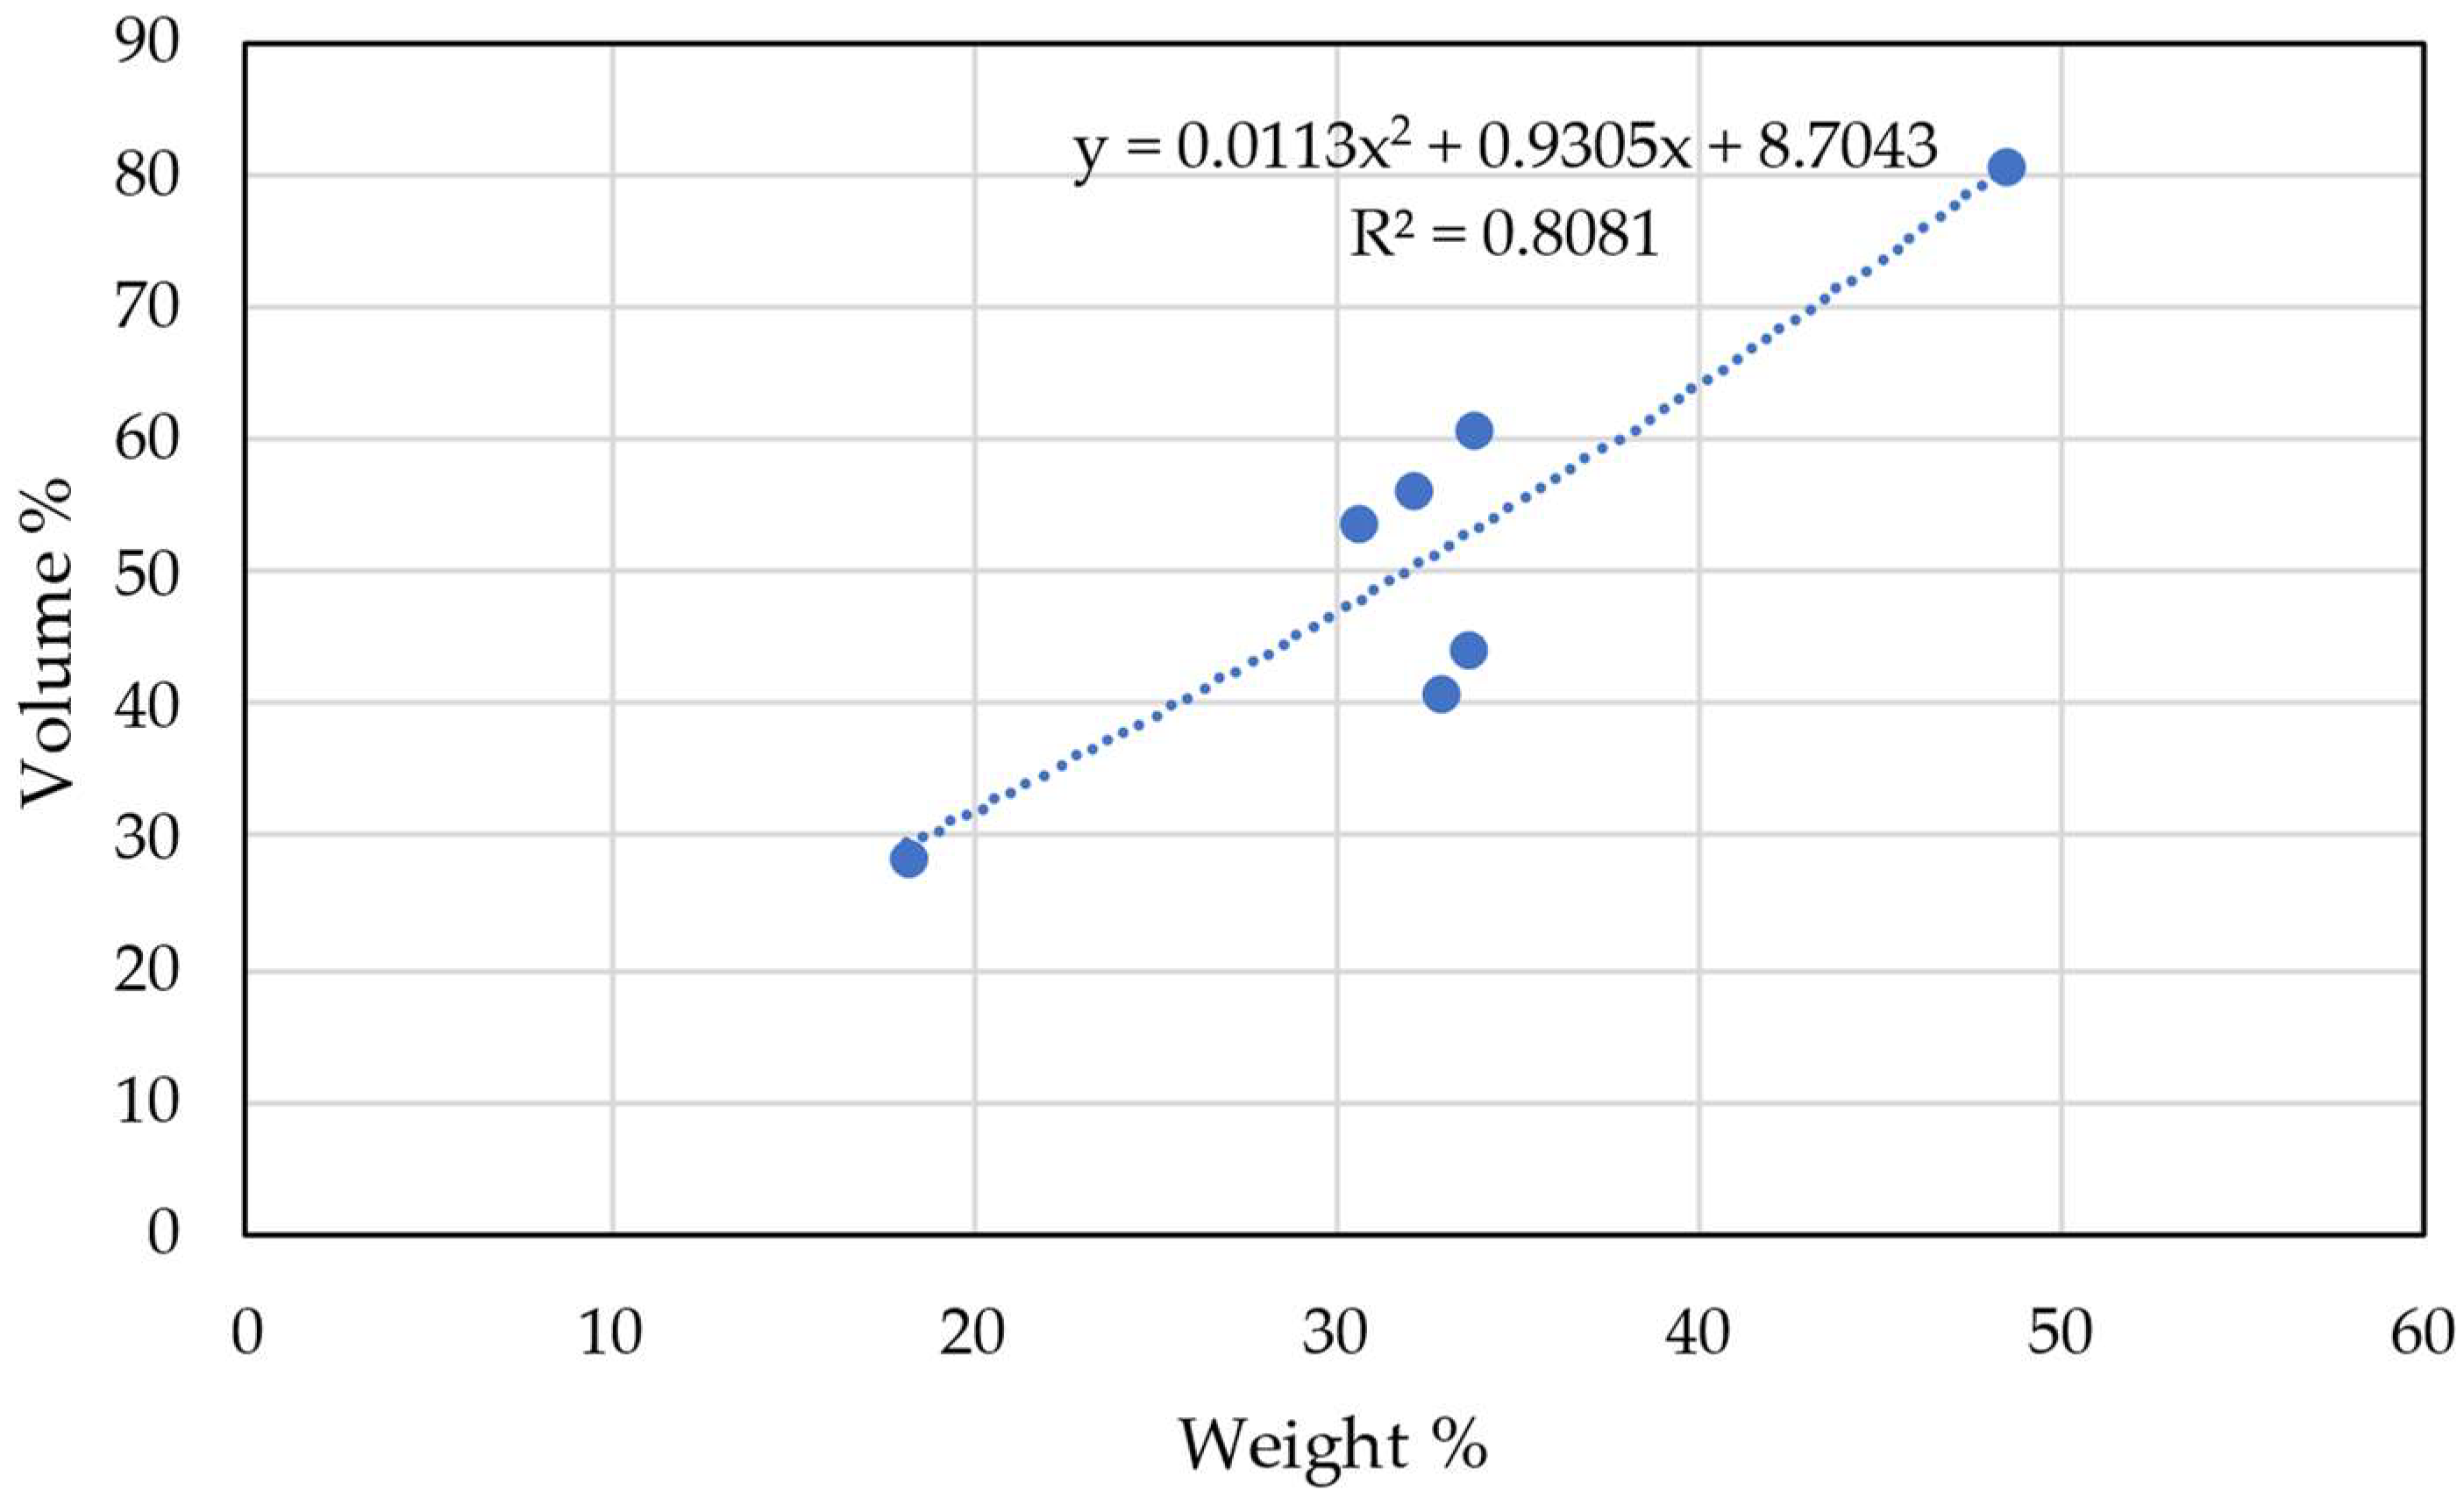
Based on the findings of the experiment, a correlation between plastic weight percentage and plastic volume percentage was found. To determine the relationship between plastic volume and weight, the average volume percentage of each month was plotted against the average weight percentage of each month. To aid in further analysis of the volume of plastic in the landfill, an equation was developed from the correlation. The correlation is established in
Figure 11. The correlation can be expressed in the form of an equation:
From a particular weight percentage, this correlation could be utilized to determine the volume percentage of plastics. Therefore, it was utilized to calculate the volume % of plastic waste from the weight percentage stated in the US EPA report in 2018, which was before the COVID-19 issue.
Table 6 shows the volume percentage of plastic waste before and during the COVID-19 pandemic corresponding to their weight percentage.
3.3. Implication of Increased Plastic Waste on Landfill Volume Consumption
Volume is the primary determinant of a landfill’s capacity, and earlier sections demonstrated that plastic waste accounted for the major portion of the waste in landfills during the COVID-19 epidemic. The volume percentage of earlier experiments was estimated from known weight percentage using the correlation between the weight percentage and volume percentage of plastic.
Table 6 compares the volume percentage of plastic waste generated before and during the COVID-19 pandemic corresponding to its weight percentage.
The active working face of the Irving landfill was taken into consideration for assessing the impact of increased plastic waste on landfill volume consumption. The operating face of the landfill, from where the waste was collected throughout the study period, has an area of 19.9 acres, or 96,316 yd
2, according to information gathered from landfill employees and Google Earth, and the soil is high plastic clay (CH) [
27]. The working face area is depicted in
Figure 12. Considering a total height of 180 feet above and below ground, the cell’s volume capacity came to be 17.34 million yd
3.
With a population growth rate of 1.55% [
28], the City of Irving had 2.40 thousand residents in 2020 [
29]. The weight of waste entering the landfill was computed using a waste generation rate of 4.9 lb/person/day [
30] and a recycling rate of 8.52% [
31,
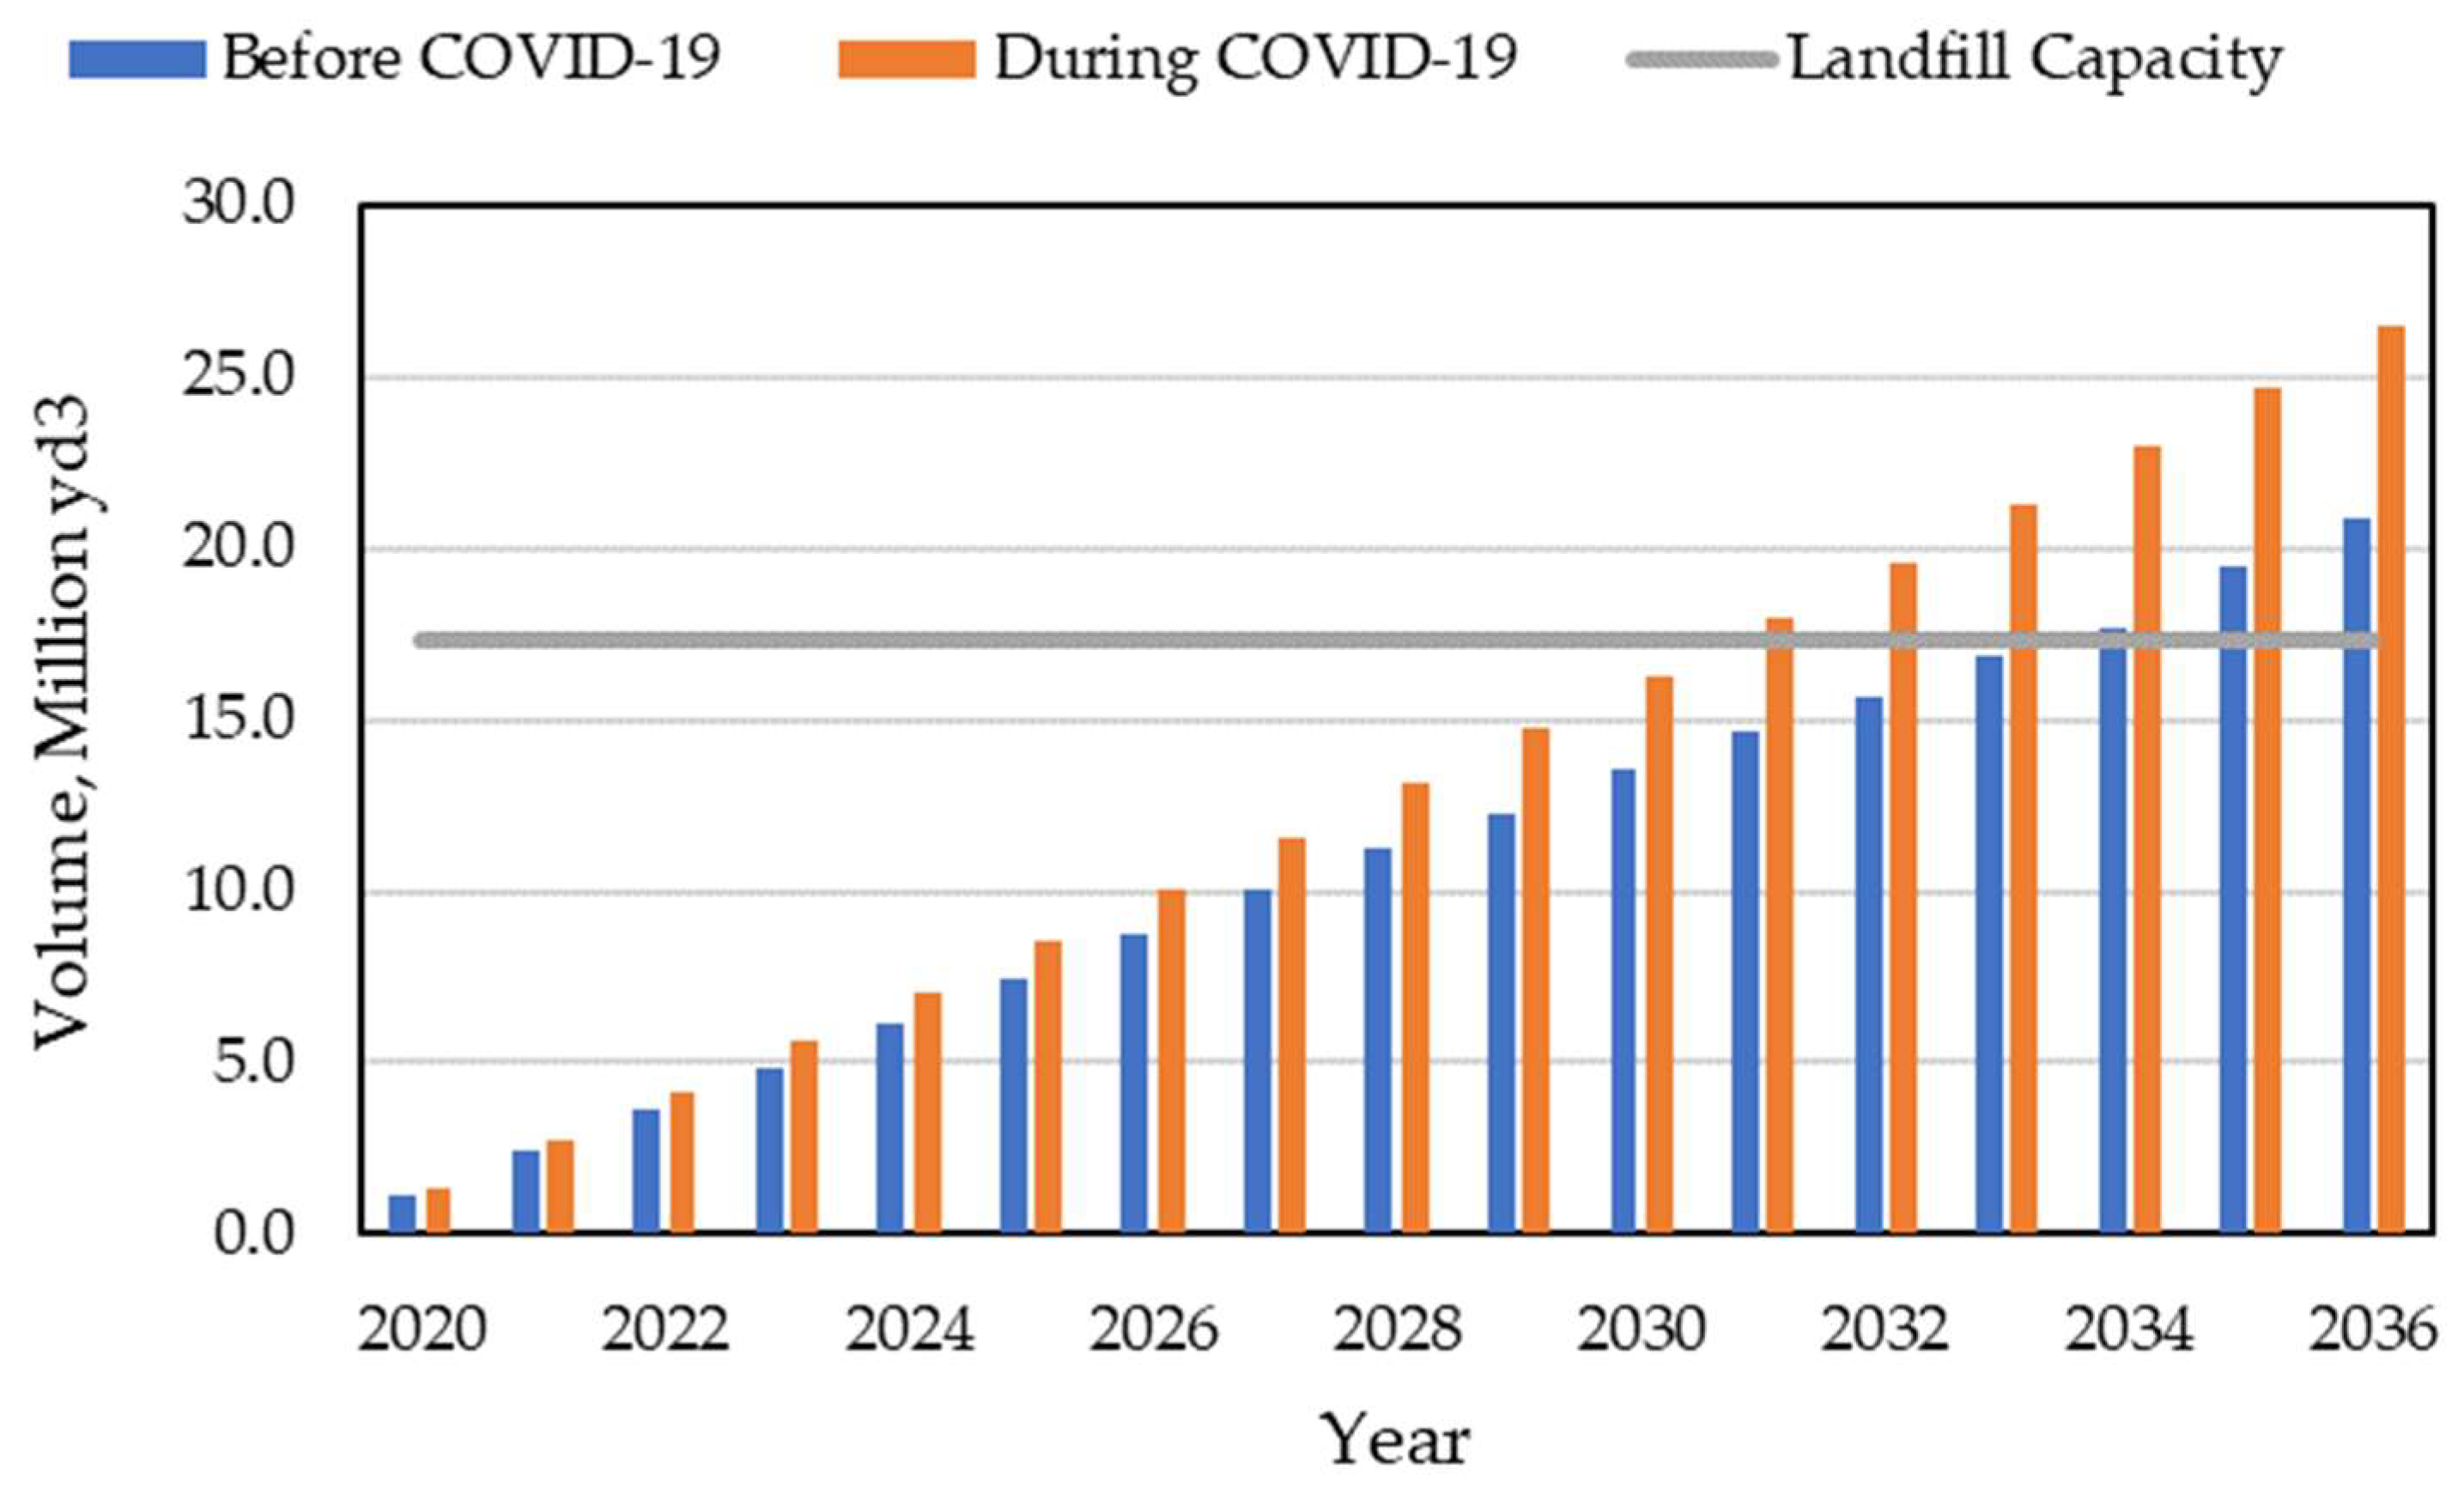
32]. The waste volume accumulated in the working face before and during the COVID-19 pandemic was calculated over time using the volume percentage of wastes corresponding to their weight percentage. As plastic is non-degradable and the presence of plastic in a high percentage increases the non-degradable percentage of waste, degradability was also considered. Plastic volume percentage was the sole variable taken into consideration when performing the computation, and that was the basis of the calculations. The estimation results are shown in
Figure 13.
Figure 13 demonstrates that even if the rate of waste generation remained the same, and waste accumulation continues at the pace it has been throughout the COVID-19 pandemic, the cell should be able to accept waste for 10 years before closing. As a result of the increased production of plastic waste during the pandemic, the landfill will lose 20% of its space. As a result, the landfill lifetime is reduced by more than 2.5 years.
3.4. Plastic Volume Generation Trend
A trend can be identified with the increase in plastic waste generation during the pandemic period and the number of COVID-19 transmission cases [
33]. The plastic waste generation timeline and confirmed COVID-19 cases were compared to identify the trend of change in the volume of plastic waste present in MSW with confirmed COVID cases. This provides clear evidence for the assertion that the pandemic impacted plastic waste generation, thus impacting the volume consumption varying over the severity of the situation. The volume of generated plastic waste was taken into consideration while comparing with the number of COVID case records published by the CDC in 2021 [
34], and it was found that the volume of plastic waste generation increased noticeably over the pandemic period. MSW is highly heterogenous and region-specific, so the characteristics may vary with other landfills located in a different region.
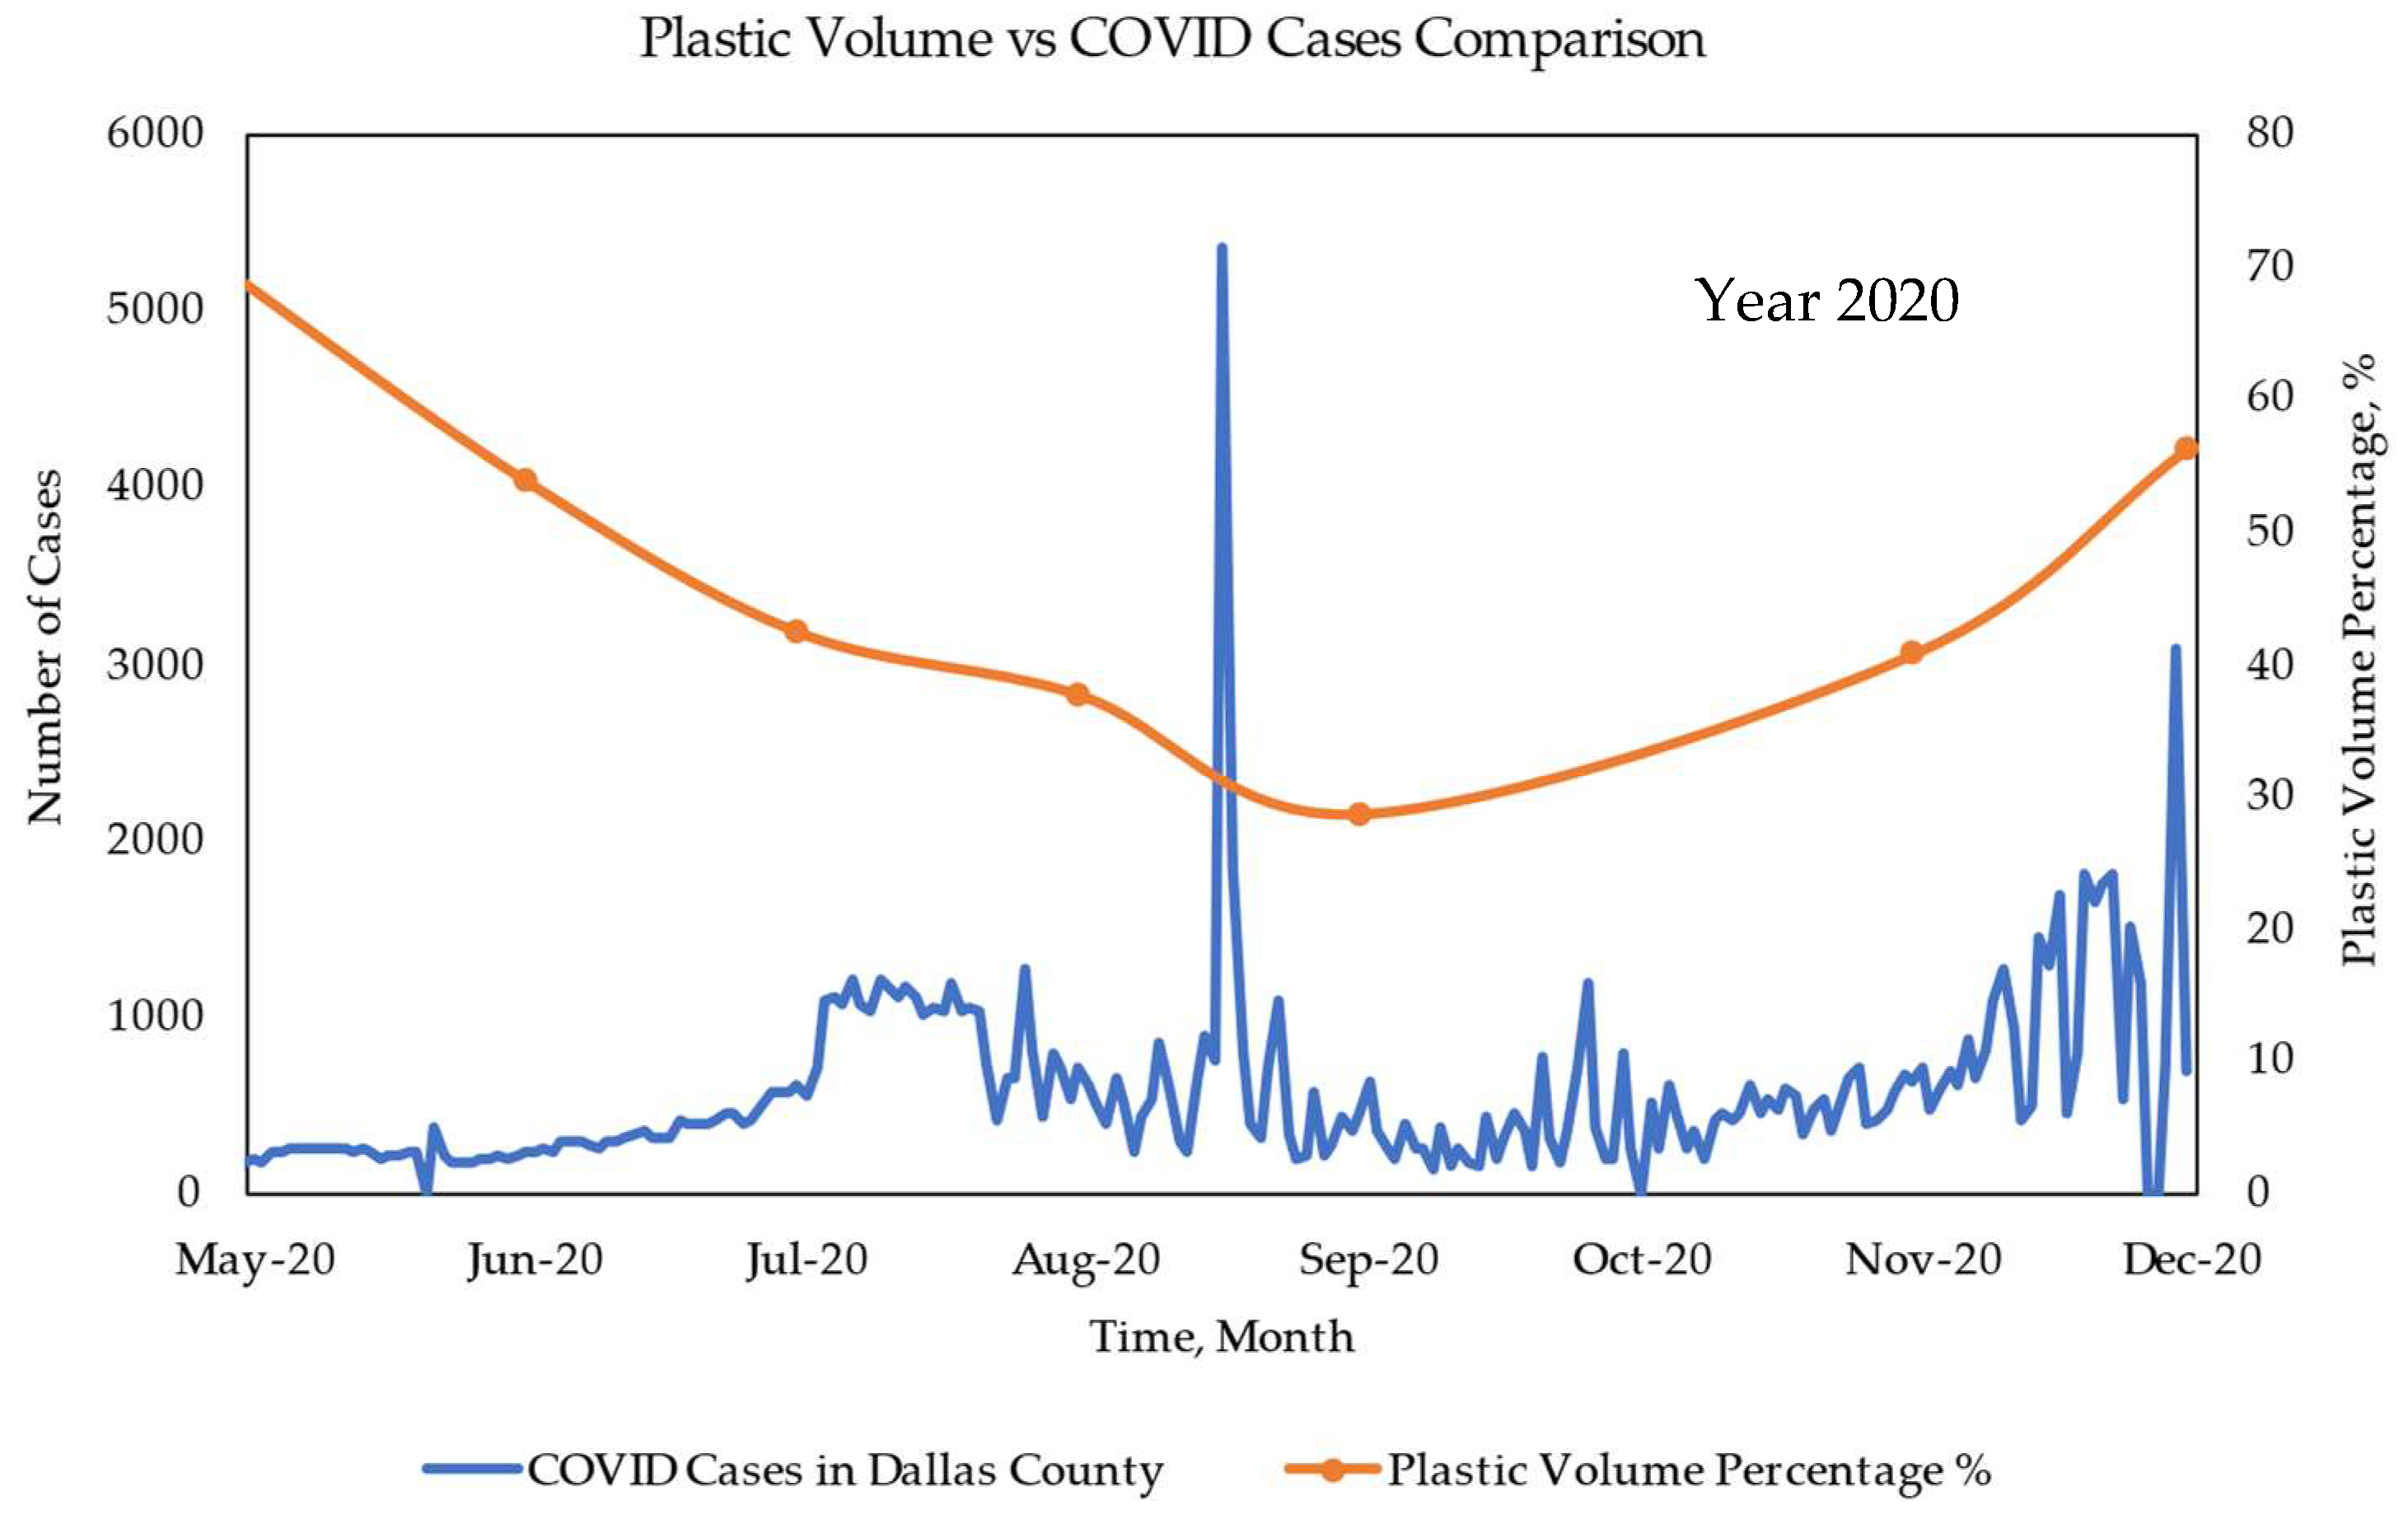
Figure 14 compares the amount of plastic volume produced in Dallas County to the number of COVID-19 cases.
The development of COVID cases in Dallas County and the growth of plastic waste volume followed a similar trend. In the initial stages of the pandemic, COVID cases were gradually rising. People started stockpiling things and went into lockdown mode as the fear the pandemic instilled in them. As a result, compared to the number of patients, the initial generation of plastic waste was considerably high. The first 3 months of observation show this effect. Following June, a similar pattern was discovered in the waste generation and COVID case count. Beginning in July, both the number of cases and the plastic volume percent in MSW increased. The percentage of plastic waste then surged in August, the same month that COVID instances peaked on the trendline. Beginning in October, the number of cases began to increase once more, and the trendline got much steeper. Up to the final month of the experiment, plastic volume likewise rose sharply.
The trend established in
Figure 14 can be useful in predicting the volume of plastic waste if a pandemic like COVID-19 ever occurs again. This trend links up the outcome of the extensive experimental program of the study, which is the volume of plastic waste, to the number of infected patients. If the number of patients is known, this trend can give an idea of the volume percentage of plastic expected to be generated. The establishment of this trend can be considered a secondary outcome of the study.


