Article

Effect of Sludge Content on the Decomposition of Different Types of Food Waste

by
Mumtahina Binte Latif
1,
Md Azijul Islam
2,3,*,
Md Sahadat Hossain
2 and
Sehneela Sara Aurpa
2
1
Atwell, LLC, 9001 Airport Fwy Suite 660, North Richland Hills, TX 76180, USA
2
Department of Civil Engineering, The University of Texas at Arlington, 701 W Nedderman Dr., Arlington, TX 76019, USA
3
Department of Civil Engineering, Bangladesh University of Engineering and Technology, Dhaka 1000, Bangladesh
*
Author to whom correspondence should be addressed.
Sustainability 2023, 15(3), 2782; https://doi.org/10.3390/su15032782
Submission received: 26 October 2022 / Revised: 23 January 2023 / Accepted: 1 February 2023 / Published: 3 February 2023
(This article belongs to the Special Issue Sustainable Solid Waste Management: Landfill Operation and Management)

Abstract

:
Food waste, which is the second largest component in landfills, generates excessive amounts of leachate and greenhouse gas. As a result, it has recently become a severe concern, mostly in the developing countries for its adverse impact on the environment. The addition of nutrients to organic waste limits the accumulation of volatile fatty acid (VFA) and accelerates the production of energy from food waste. The objective of the current study is to find out the effects of sludge addition on the decomposition and gas generation of separate components of food waste. This study was conducted for four combinations of reactors: two pairs containing meat and grain with the addition of a sludge content of 20% and 30%, respectively, as inoculum; another two pairs of reactors containing fruits and vegetables with a sludge content of 20% and 30%, respectively. Over the operation period, pH, volume, COD, and VFA tests were conducted for leachate while composition and volume measurements were done for the generated gas. Based on the results, it is observed that addition of sludge accelerated the decomposition of fruit and vegetable waste due to limited VFA accumulation compared to meat and grain. The maximum methane production was found in fruits and vegetable reactors at a rate of 6.7 L of methane per pound of food waste. For fruit and vegetable reactors, the CH4:CO2 ratio increased to as high as 8.5. On the other hand, for the meat and grain reactors, the increase in CH4:CO2 ratio was insignificant as they were in the lag phase.

1. Introduction

Food waste has become a serious issue which has increased with the world’s expanding population [1]. According to the Food and Agriculture Organization (FAO) [1], food waste is the edible part of the produced consumables that, instead of being consumed, is either discarded, lost, degraded, or affected by pests. Globally, around one-third of the edible parts of food produced for human consumption is lost or wasted, which is about 1.3 billion tons per year [1]. Food waste is reported to be the second-largest component (14–21%) of the waste stream in the USA [2,3]. According to the US Food and Drug Administration, food waste is estimated at between 30–40 percent of the food supply in the United States [4]. The regional per capita food loss is as high as 650 lbs per capita per year in North America & Oceania, and the lowest amount is 276 lbs per capita per year in South & Southeast Asia [1].
In medium- and high-income countries, food is wasted to a great extent. Significant food loss occurs early in the food supply chain. In low-income countries, food is mainly lost during the early and middle stages of the food supply chain; much less food is wasted at the consumer level. In developing countries, these food wastes are the largest portion of municipal solid waste, which is approximately 70% of the waste stream [5].
Food waste is becoming a major concern in all sectors, especially from the economic and health perspective. The biggest challenge that remains in reducing food waste is to identify and quantify the point(s) where food loss occurs in the food system. However, reducing food waste is not easy and requires immense planning and implementation. Hence, food waste finds its way into landfills before being diverted as animal feed, composting, incineration, and anaerobic digestion (AD). Incineration is not very popular for food waste diversion because of its extremely high moisture content. The presence of excessive moisture demands higher energy for incineration.
Food waste harms the environment through excessive methane generation and leachate production. Besides, food loss accounts for significant economic loss in both developed and developing countries. However, food waste can be used for composting or converted to energy if diverted from the main waste stream. Many US states have already begun food waste diversion and using this organic waste in composting or in anaerobic digesters for energy production.
Anaerobic digestion (AD) is a microbiological process whereby organic matter is decomposed in the absence of oxygen via enzymatic and bacterial activities which produce biogas that could be used as a renewable energy source [6,7]. This process is common in many natural environments such as swamps or stomachs of ruminants. In order to produce biogas using an engineered approach and controlled design, the AD process is applied to process organic biodegradable matter in airproof reactor tanks, commonly named digesters. The anaerobic digestion of food waste transforms this organic waste material into valuable energy resources while, at the same time, reducing solid waste volumes and, thus, waste disposal costs. Biogas as a renewable energy source not only improves the energy balance of a country but also contributes to the preservation of natural resources and environmental protection by reducing waste pollution and the usage of fossil fuels [8].
In developing countries, more than 70% of the MSW is food waste which contains a significant amount of moisture (70~90%) [9]. Developing countries do not have a well-built infrastructure for the proper collection and disposal of waste. Most of this food waste ends up in open dumps due to a lack of proper collection and disposal of waste. This uncontrolled dumping of food waste leads to the contamination of water sources and contributes to greenhouse gas emissions, having high methane generation potential [9].
Being the wettest portion of the waste stream as well as having a high amount of volatile solids, this food waste can be utilized as a potential energy source and reduce the consumption of non-renewable energy sources. Moreover, anaerobic digestion of this food waste can reduce extreme environmental hazards related to landfilling, which is the least preferred option. Therefore, the anaerobic digestion of food waste has substantial potential to be exploited as a sustainable waste management technique alongside being a considerable replacement for fossil fuel as an energy resource.
Approximately 90% of rural households in developing countries are still dependent on natural biomass fuels for cooking and heating (wood, dung, and crop residues), which are typically burnt in ineffectively functioning stoves or open fires indoors [9]. In the presence of poor ventilation, this combustion process is fragmented in most cases, which results in significant emissions and produces very high levels of indoor pollution [10,11]. Women’s exposure to emissions is much higher than men’s, as cooking, customarily, has become a primary involvement for women in developing countries [12,13]. The exposure to benzo[a]pyrene, which emits from stoves for cooking, for around three hours a day can be compared to smoking two packets of cigarettes daily [11].
Thus, biogas produced from an anaerobic digester designed to fulfill the cooking demand of a household can significantly eliminate these adverse effects on the environment and human health. Besides, it can be a great source of renewable energy and can reduce dependency on fossil fuels and related expenditures. However, one of the major problems of organic waste is its high C:N ratio, since it is very acidic in nature [14]. Therefore, the mono digestion of food waste can lead to the inhibition of microbial activities and thus impede biogas production. Furthermore, finding an acceptable, economical, and readily-available inoculum in developing countries is also a vital step. Though human feces have significant potential for use as inoculum, the usage of biogas produced from it was refused in Dar es Salaam, Tanzania [7]. Moreover, some enzymes have the exclusive ability to break down lignin; however, they can never be used because of their high expense. The anaerobic co-digestion of sewage sludge and other organic waste is an attractive method for both waste treatment and biogas production [15].
Excessive volatile fatty acid (VFA) accumulation takes place at the early stage of food waste decomposition and creates a lag phase for methane production (Shao et al., 2005). Wang et al. (1997) successfully reduced this lag phase for pure food waste by using a high percentage of inoculum. However, no prior research has been conducted to identify the individual components of food waste responsible for this early lag phase of decomposition. Furthermore, limited studies are available for evaluating the effect of sludge on gas generation along with different food wastes. Therefore, in this study, various combinations of individual food waste components were considered to detect the components responsible for the early lag phase. In addition, the percentage of sludge as inoculum in these combinations was also varied to obtain the most effective combination of food waste and sludge. Thus, this study aims to propose an effective combination of food waste and sludge so that it can be implemented in developing countries with locally-produced food waste. An extensive experimental program was prepared to evaluate the results collected from gas and leachate generation data.
The successful design of a household or community-level anaerobic digester will help to significantly reduce the harmful effects of food waste on human health and the environment, and will ensure a renewable energy source and curtail the need for fossil fuel. The outcomes of this research will provide some good productive data for constructing an efficient and cost-effective underground AD for rural households in developing countries.

2. Materials and Methods

The main objective of this study is to investigate the effect of different percentages of sludge content on the degradation of different types of food waste through the laboratory simulation of an anaerobic digester operation. This study is aimed at determining the most suitable combination for maximum gas generation from food waste AD.
An experimental program was undertaken to simulate eight laboratory-scale food waste ADs with two different percentages of sludge and four types of food waste. The reactors were monitored daily, and the leachate and gas generated from the reactors were collected and tested periodically. Volatile solids, total solids, Volatile Fatty Acid, and COD tests were also conducted to observe the stage of biodegradation in the laboratory. The following subsections discuss the experimental design and test procedure for the reactor operations.

2.1. Experimental Design

2.1.1. Inoculum Percentage

Food waste itself does not have a considerable number of microorganisms in it. Thus, to ensure microbial population, sludge was chosen as inoculum. Two different percentages of sludge were used for four pairs of the reactor. For the first two pairs, sludge was 20% and, for the last two pairs of the reactor, sludge percentage was 30%. This percentage was chosen based on availability and applicability in both developed and developing countries [9].

2.1.2. Waste Composition

Observing the food waste scenario of south Asian countries, the waste composition was determined. Generally, fruits and vegetables are also produced in significant amounts in developing countries followed by dairy products, meats, and fish. Considering this production scenario, two combinations of food waste were decided on for use in the bioreactor: grain-meat and fruit-vegetables. Food waste was collected from the UTA connection café and UTA compost center.

2.1.3. Bioreactor Combinations

Laboratory-scale simulated food waste ADs were built to analyze the effect of sludge on food waste decomposition and gas generation. Sludge was added to all sets of ADs as a source of microorganisms. A total of four pairs of ADs were built, of which two pairs were made of meat and grain, with sludge contents of 20% and 30%, respectively. Another two pairs were fruits and vegetables, with 20% and 30% of sludge, respectively. All the ADs were filled with about three and a half pounds of food waste mixture. Table 1 shows the combinations of the reactors.
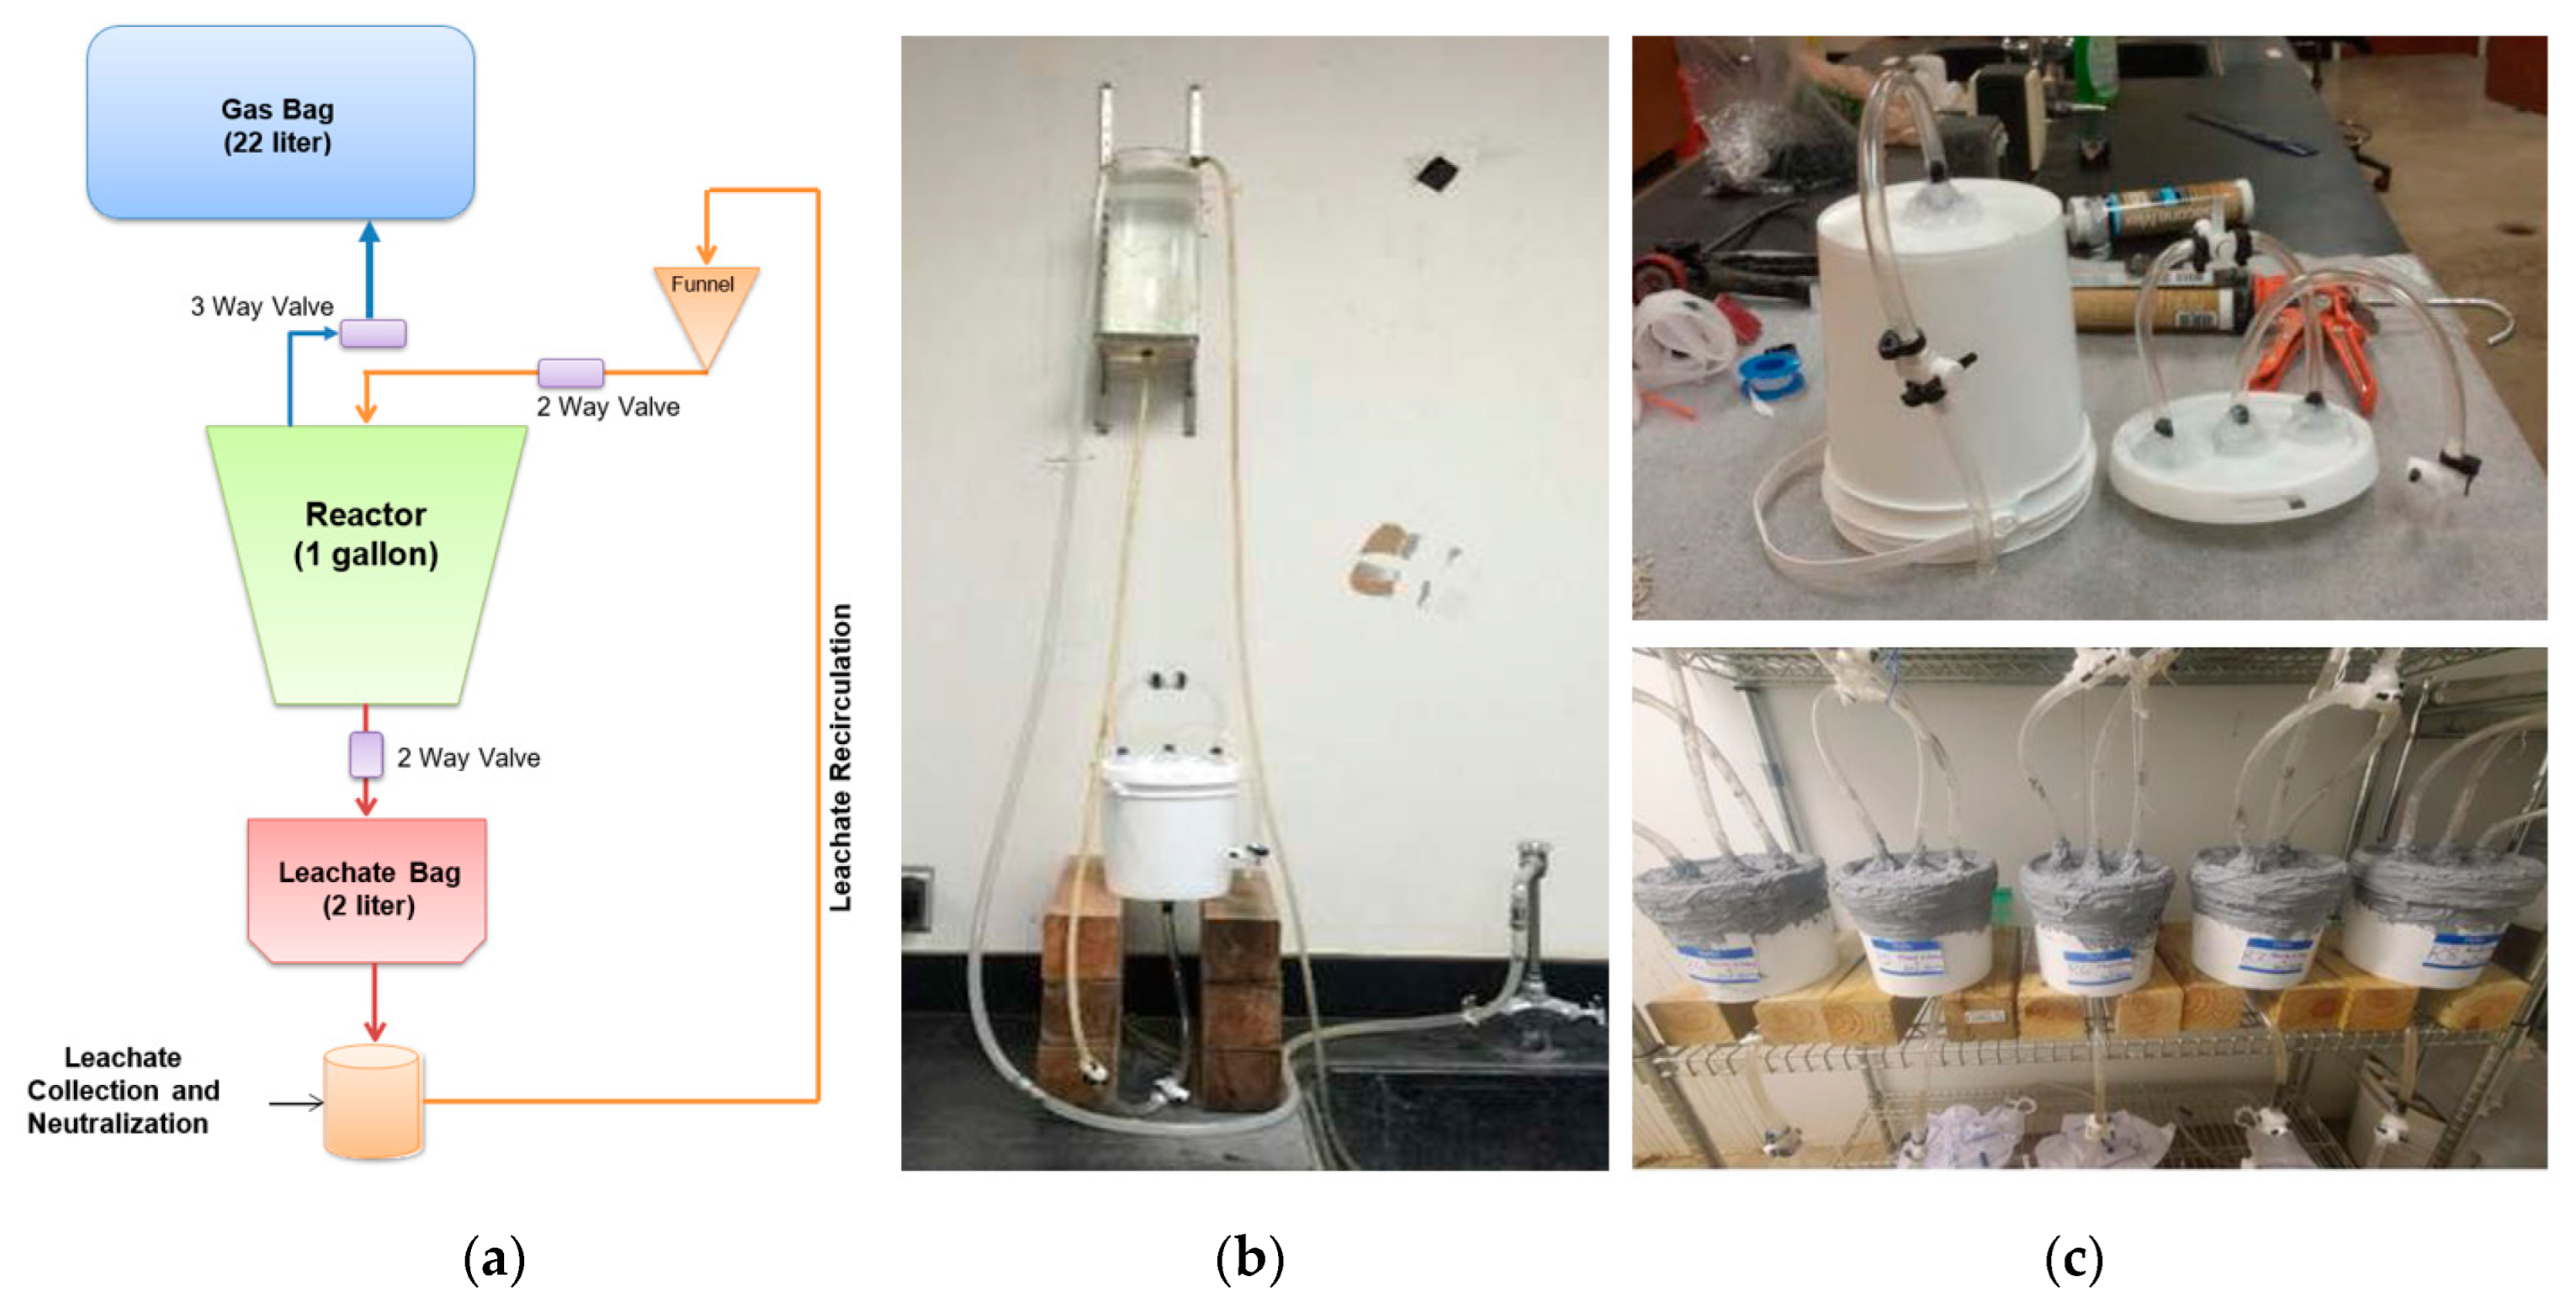
It was necessary to operate the reactors in anaerobic environmental conditions and, at the same time, provide a proper leachate collection and recirculation system and gas collection system. For this reason, an appropriate reactor setup was designed as shown in Figure 1.
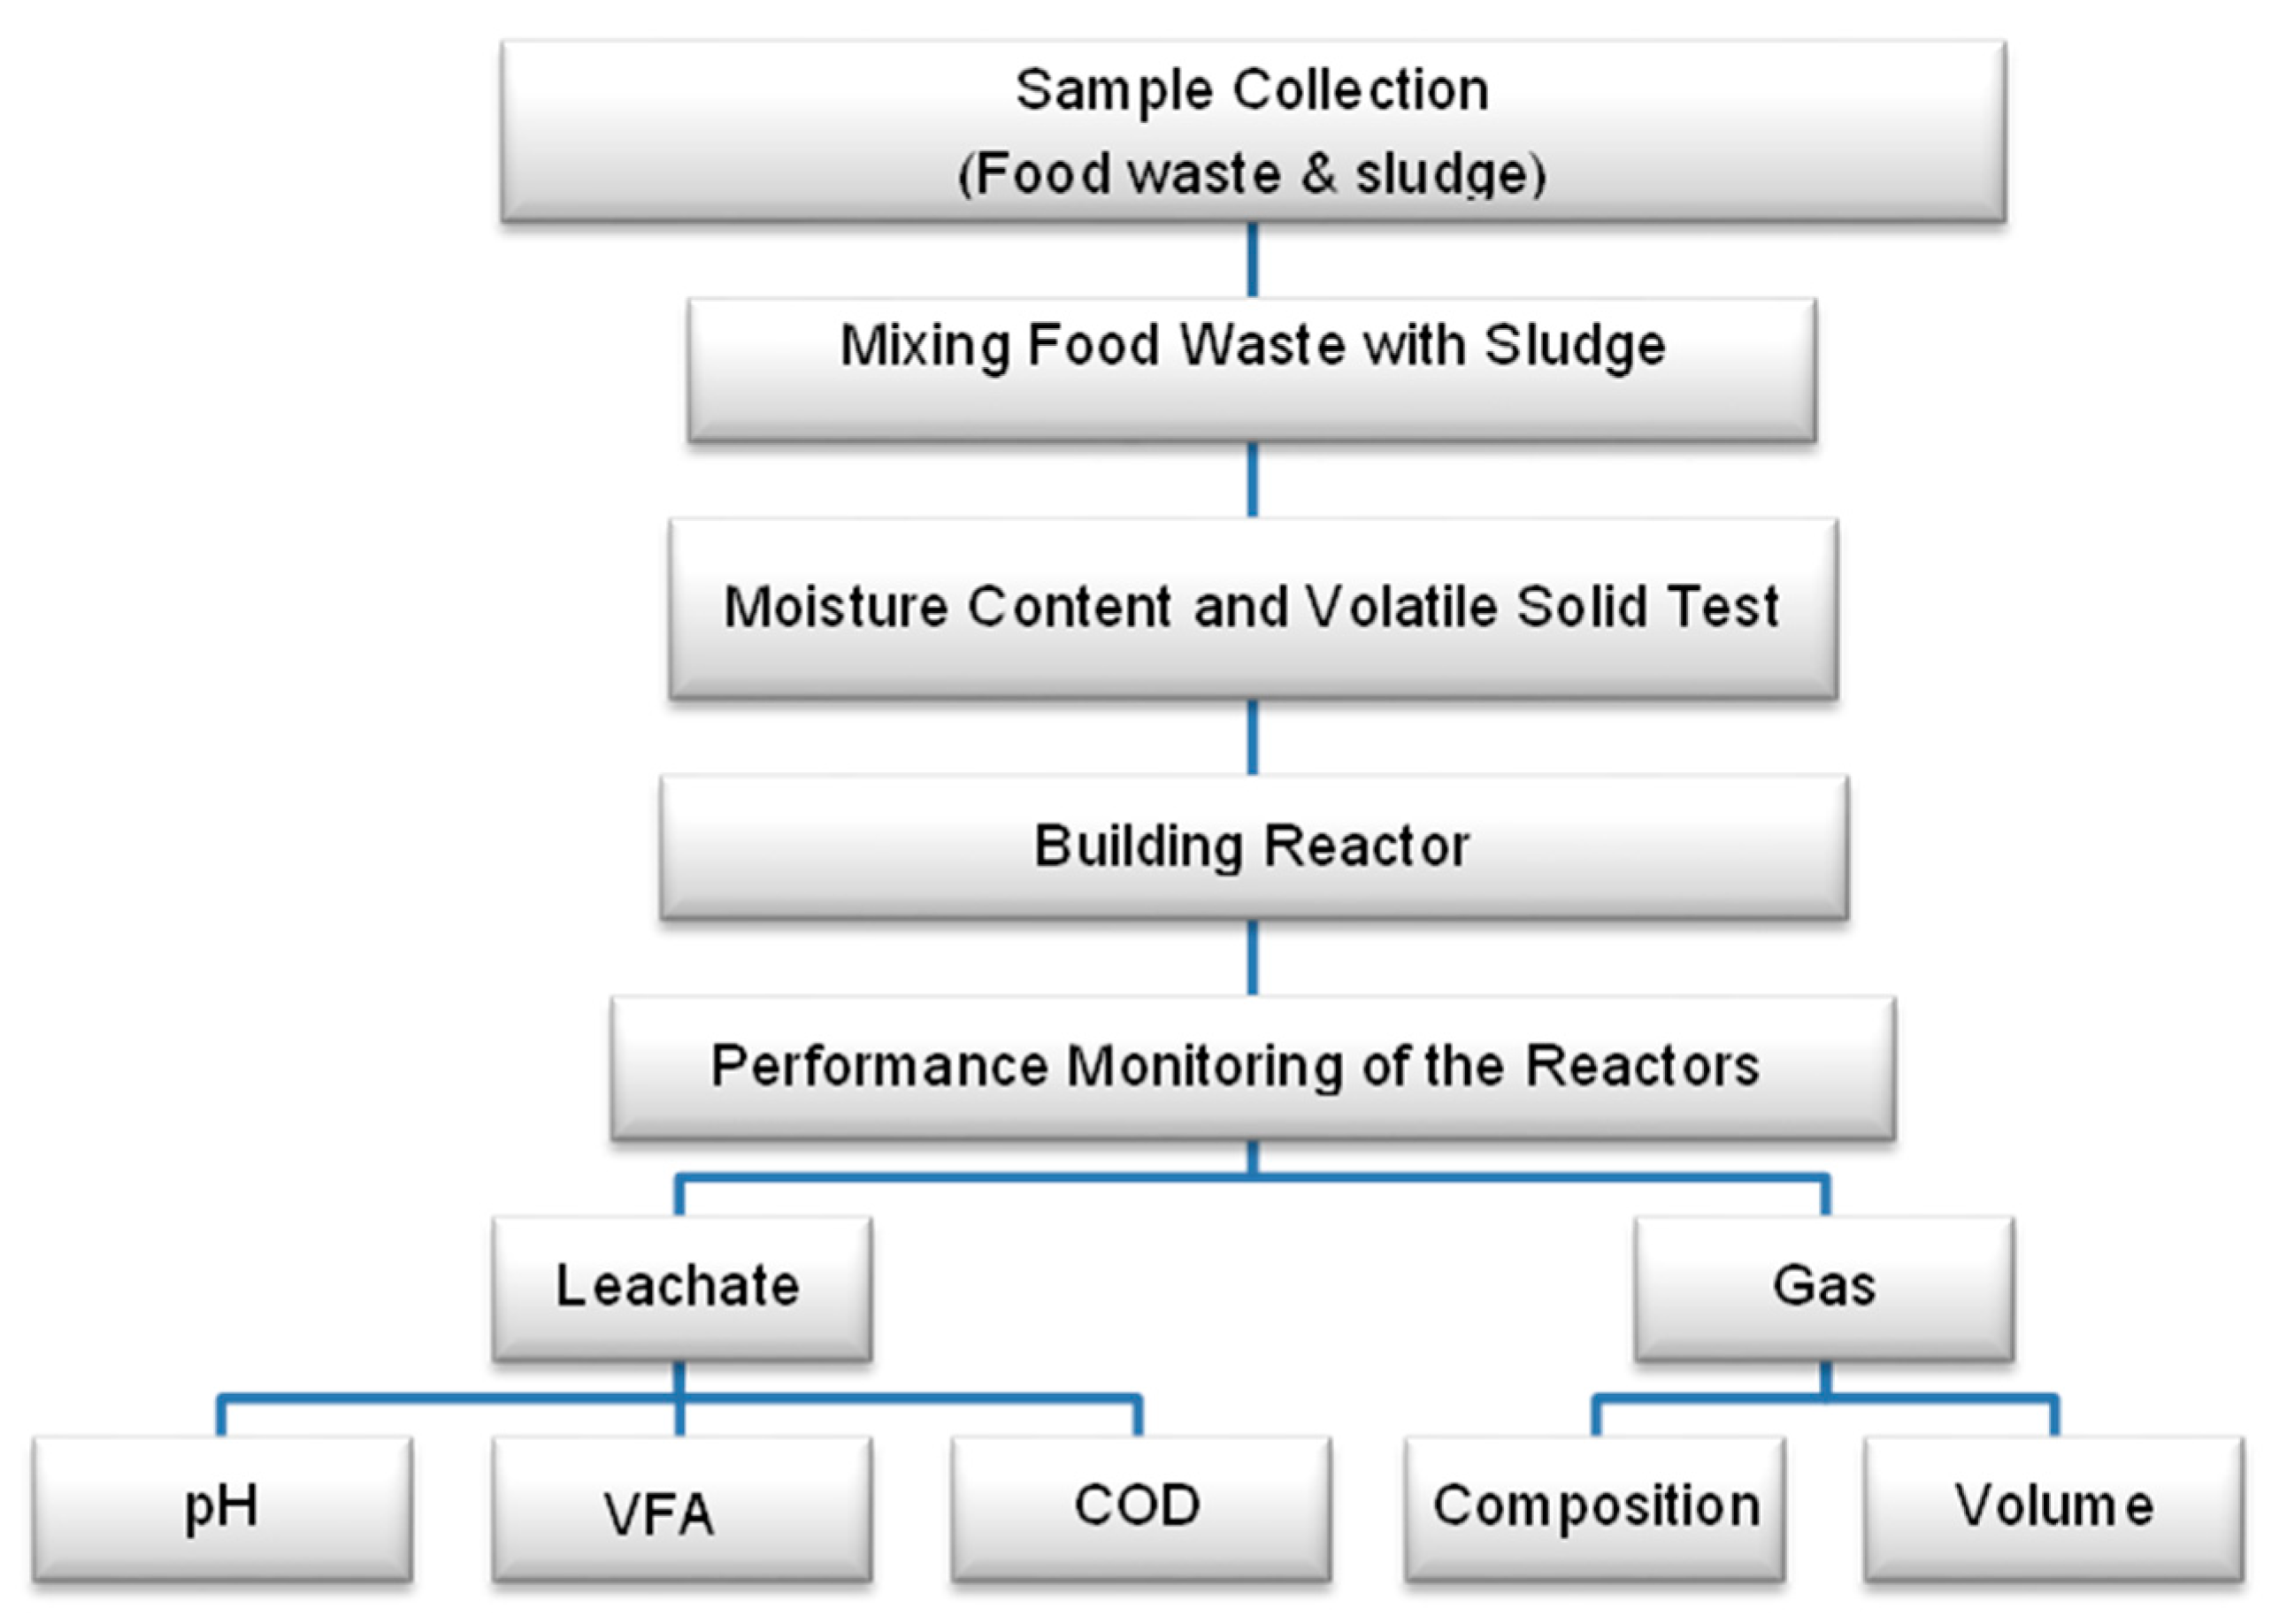
ADs were kept in an environmental control chamber at a temperature of 37 ± 1 °C for faster degradation of the food waste. For evaluating the leachate quality, pH, VFA, and Chemical Oxygen Demand (COD) were measured regularly. Depending on the gas generation, gas composition and gas volume were measured. A summary of the experimental workflow is presented in Figure 2.

2.2. Sample Collection & Storage

Food waste was collected from two sources:
  • Fruits and vegetables were collected from the University of Texas at Arlington (UTA) Compost Center.
  • The meat and grains from the lunch buffet in the University Center dining area (Connection Café) at the UTA.
Approximately 20 pounds of food waste was collected from the café, which contained meat and grain products (rice, noodles, pasta, bread, etc.). The collected samples were brought to the laboratory and stored at 4 °C in the environmental growth chamber to preserve their original properties before building the reactors. Sludge was collected from Village Creek Water Reclamation Facility, Fort Worth, Texas, and was added to the reactors as a micro-organism source.

2.3. Laboratory Scale Simulated AD Setup & Monitoring

2.3.1. Preparation of Laboratory Scale AD

Laboratory scale ADs were built in one gallon smart-seal, leak-tight HDPE buckets (United States Plastic Corporation, Lima, OH, USA), modified (according to design) for gas and leachate collection and leachate recirculation. A total of eight reactors were prepared in pairs of four combinations.
Leak tests were conducted to make sure that there were no leaks present in the AD (Figure 1b). The lids were sealed with silicon sealant and filled with water from the overhead tank through the base of the AD. All valves at the top plate were kept closed. The pressure was developed inside the bucket due to the head difference in water from the overhead container. The leak tests confirmed there were no leaks on the AD, since the water level in the manometer showed no significant changes. Once the AD passed the leak test, the reactors were filled with food waste. Sludge was added to the waste as nutrients. Since the food waste had high moisture (more than 70%), rather than adding water at the beginning of the operation, it was allowed to drain excess moisture for the first couple of days.
Waste was filled up to a level to allow sufficient space (1.5 inches from the top) for gas to freely escape to the gas bag through the gas outlets. After being filled with food waste, the lids of the reactors were closed and sealed with silicone sealant to make them airtight and leakproof. Once the sealing was done, the gas collection and leachate collection bags were connected to each AD and placed in the environmental growth chamber at 37 °C (Figure 1c).

2.3.2. Properties of Food Waste

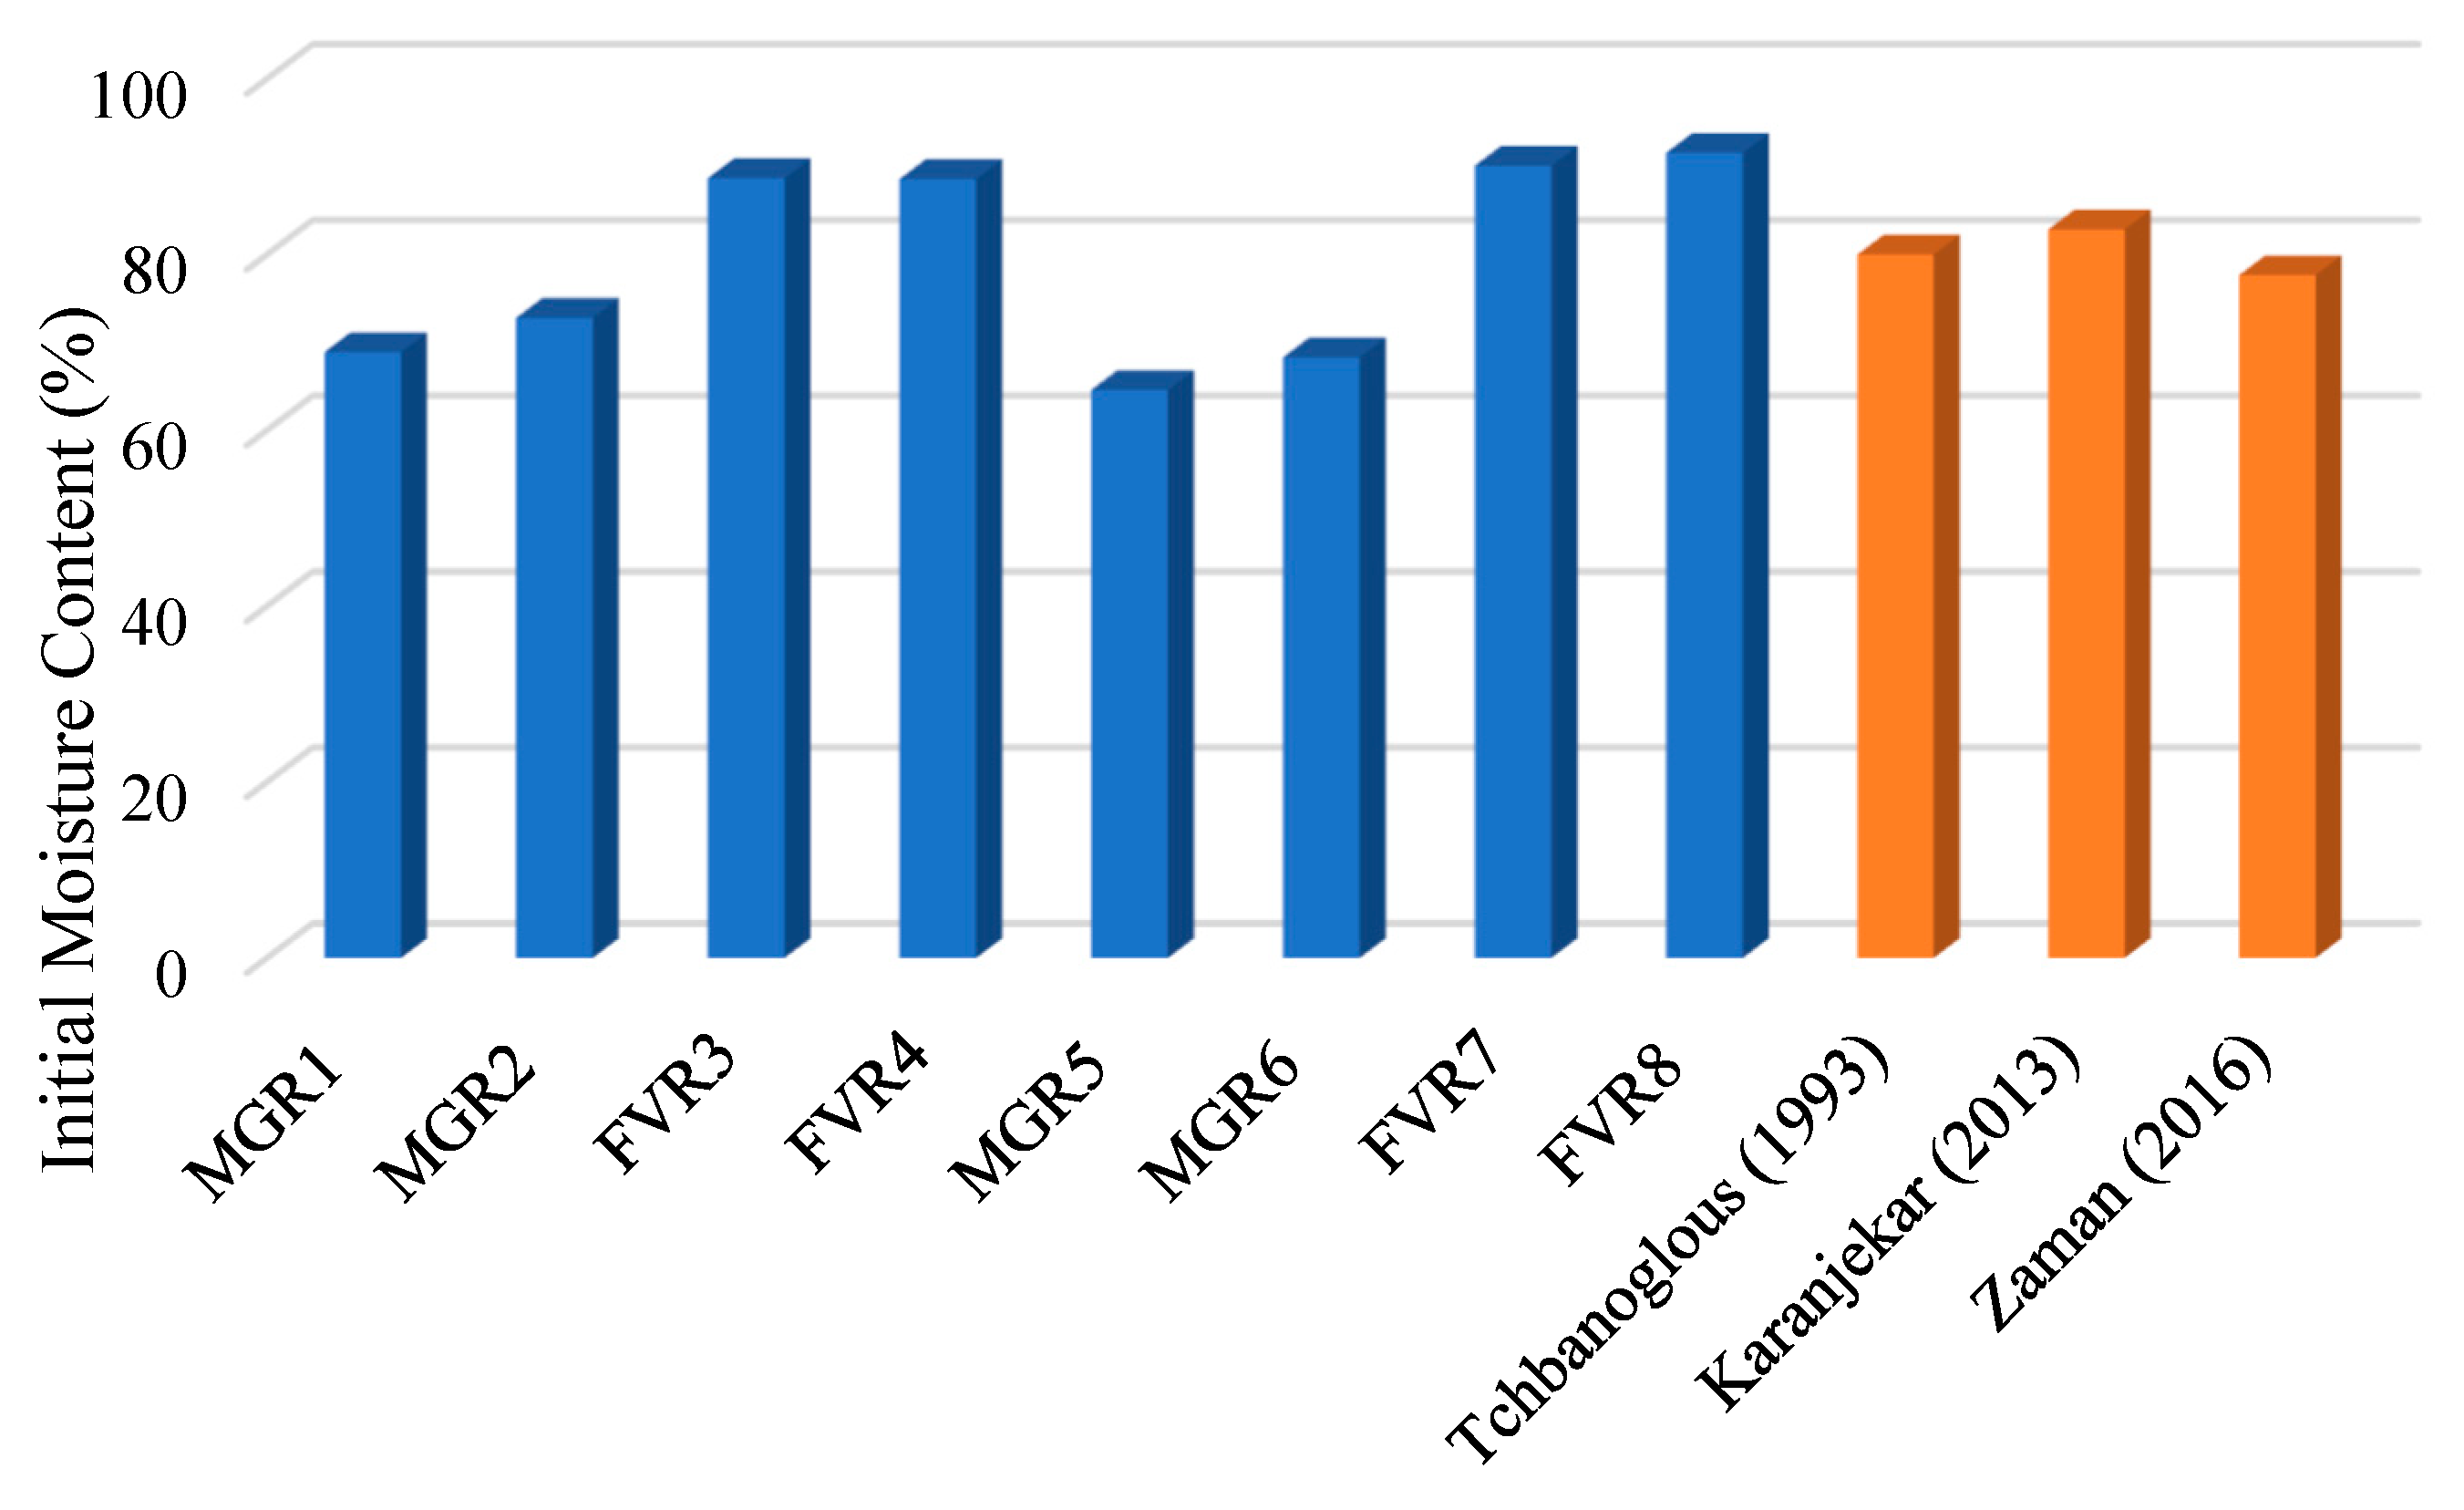
The moisture content of the food waste samples was measured on a wet-weight basis. Approximately 900 gm of samples were collected from each pair of AD. The samples were dried for 5 to 7 days until a constant weight was achieved at 65 °C (±5 °C) in the oven and were measured for moisture loss. Extra care was required to find the moisture content of the waste (food waste), as it was reported that organic matter from food waste volatilizes at high temperatures (105 °C for MSW) [16].
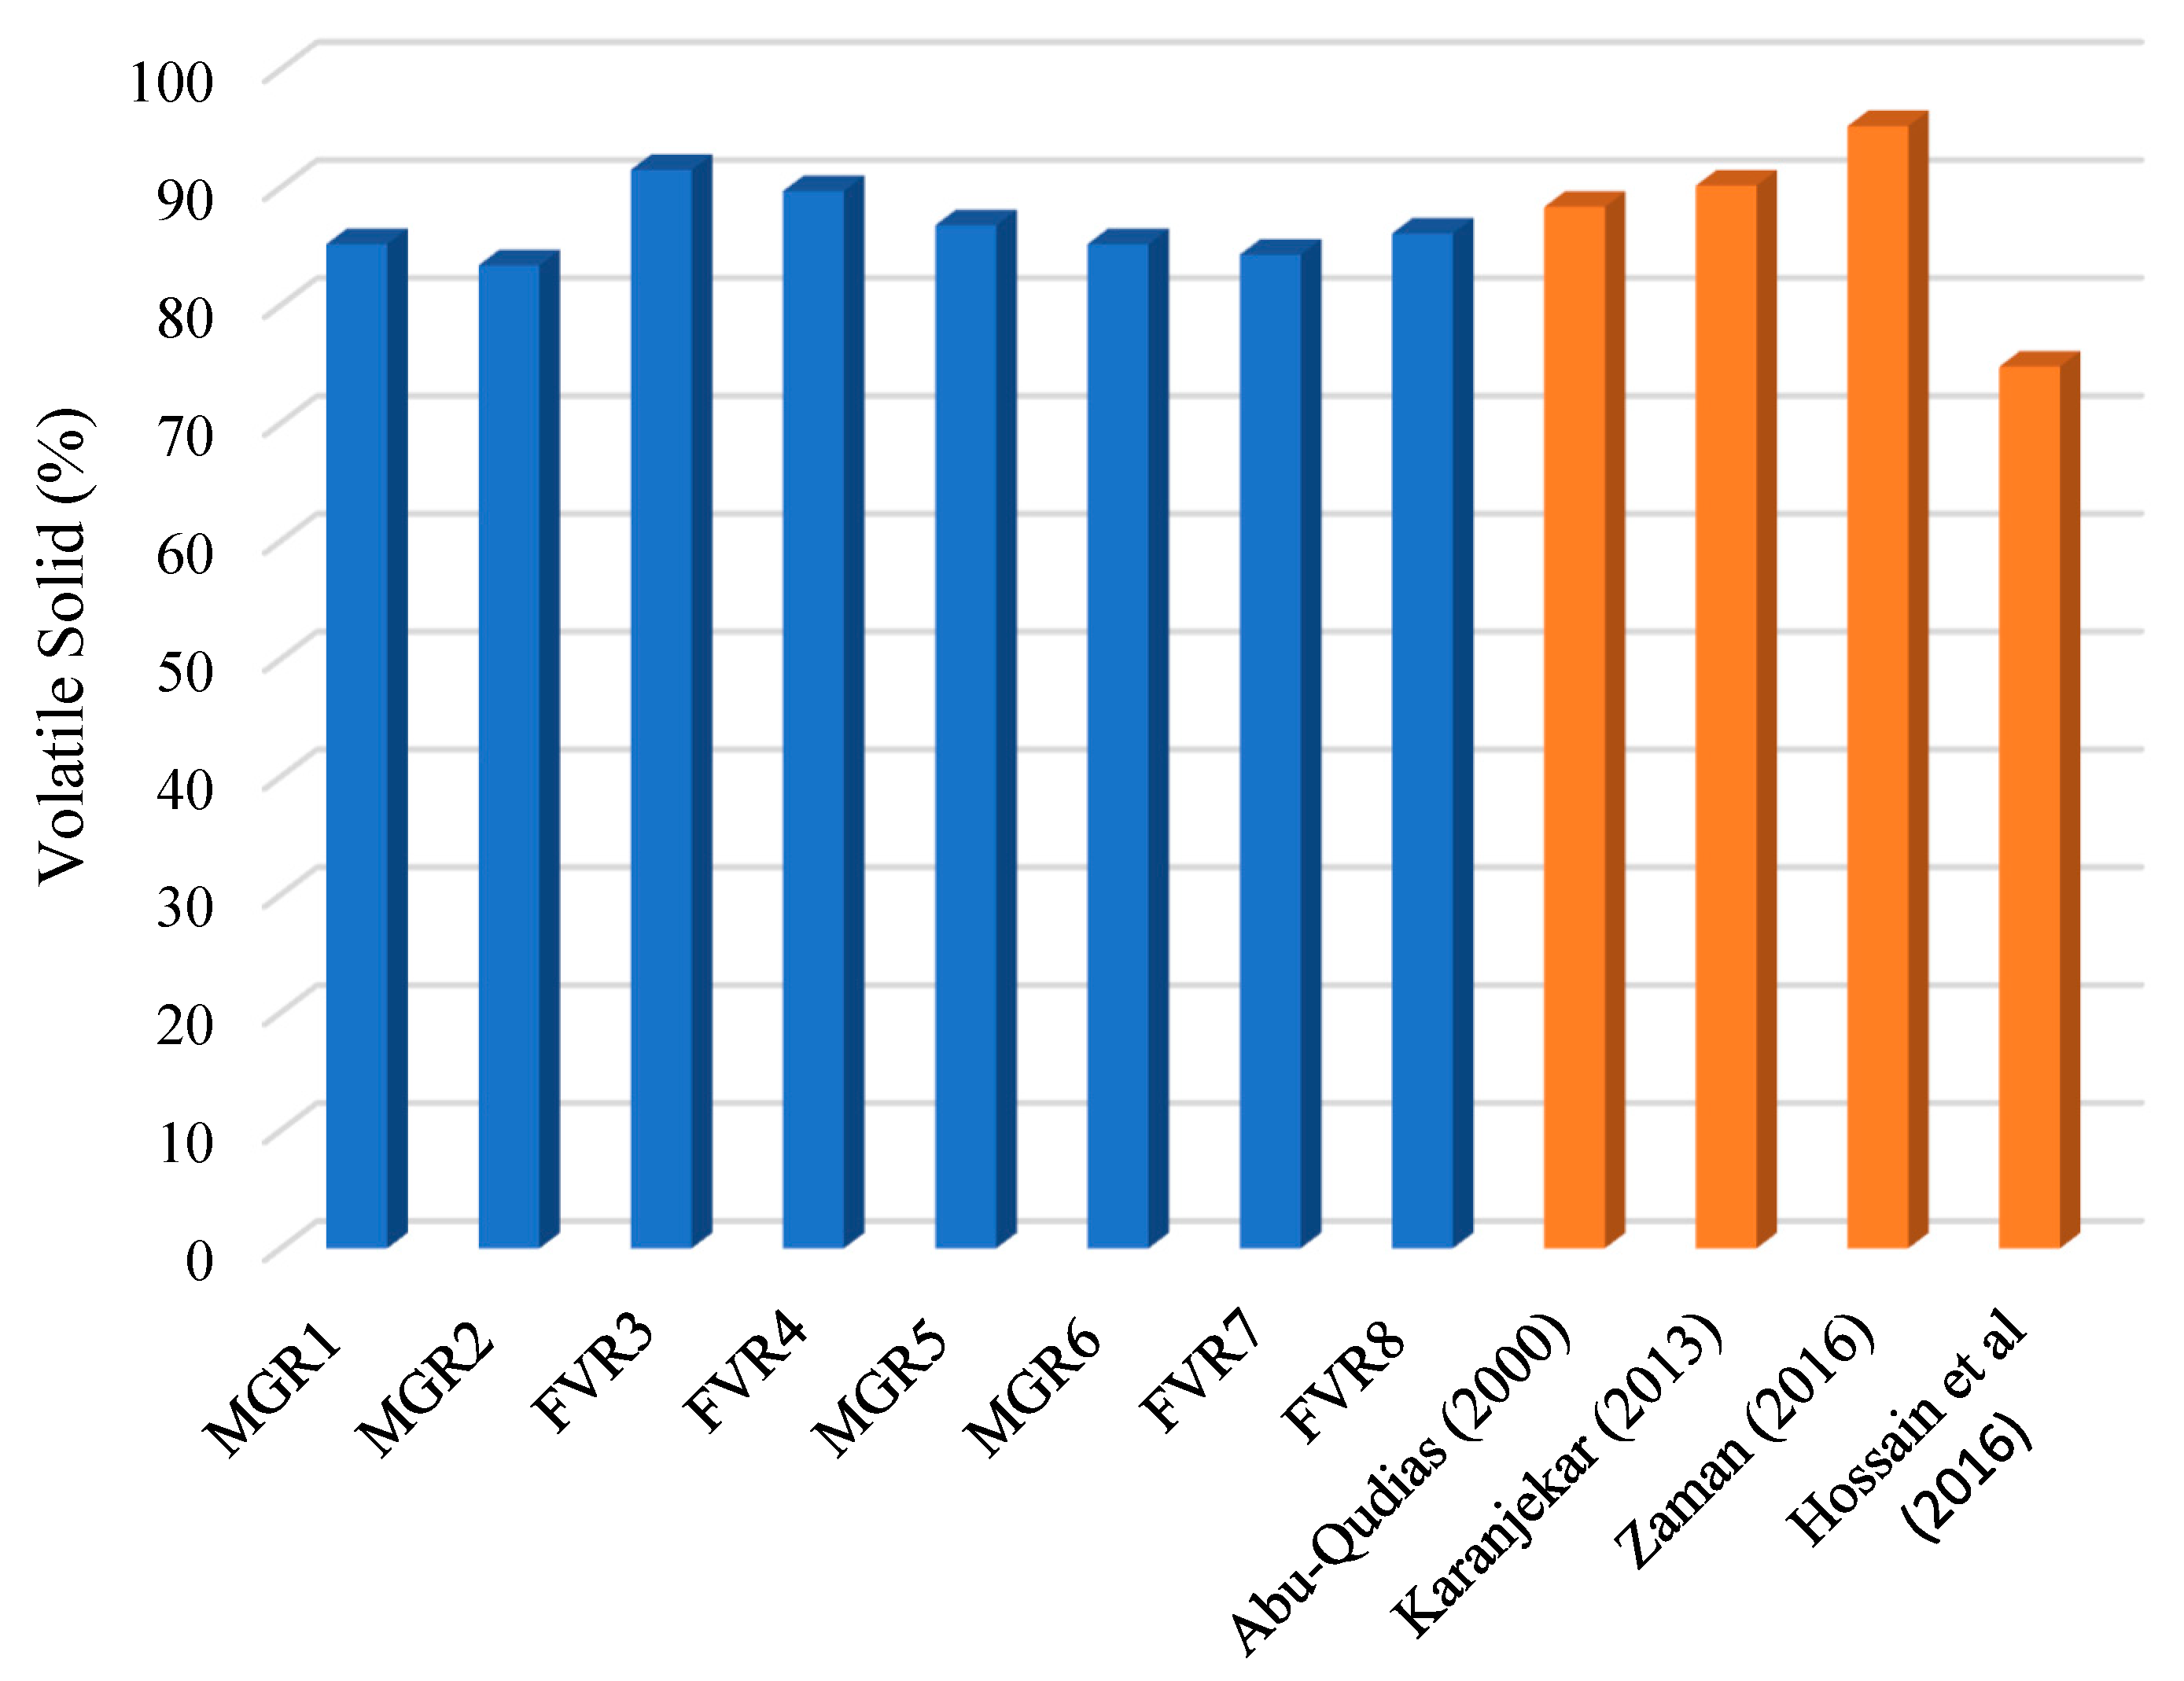
The volatile solids (VS) measurement followed a modified version of Standard Methods, the APHA Method 2440-E. For vs. determination, the first samples were oven-dried at a temperature of 65 °C (±5 °C). Dried samples were then cut into smaller pieces. About 50 g of sample were measured in a porcelain crucible. The sample was placed in the muffle furnace at 550 ± 10 °C for about two hours and burnt completely to ashes. The volatile organic content was determined from the percentage of weight loss.

2.4. Operation and Monitoring of Reactors

A routine operation and monitoring of the AD included collection and recirculation of leachate and collection and measurement of the gas generated. Food waste has a high moisture content (almost 70 percent or more). Hence, after setting up the AD, no moisture was added for a couple of days; instead, the digesters were allowed to drain excess moisture as leachate. During the operation, in the beginning, collected leachate was recirculated in the respective reactors every day. A graduated conical flask was used to measure the leachate’s volume before recirculation. KOH buffer was used as needed to neutralize (pH ≈ 7) the leachate to be recycled.
During the AD operation, generated gas was collected in Cali-5-BondTM 22-L gas bags. Gas was collected and measured regularly whenever a considerable amount of gas accumulated in the bag. Landtec GEM 2000 PLUS with an infrared analyzer was used for measuring the concentration of methane (%CH4), carbon dioxide (%CO2), oxygen (%O2), and other gases (%BAL) in the gas bags. To measure volume, gas was pumped out of the bag using a standard SKC grab air sampler (SKC Aircheck sampler model 224-44XR) connected to a calibrator (Bios Defender 510) which gives a fixed flow rate. Using a stopwatch, the time for emptying the gas bag was measured and the total volume was found.
The pH of the generated leachate was measured with the help of a bench-top Oakton pH meter. To ensure precise pH reading, the pH probe was calibrated by a three-point calibration method (pH 4.00 ± 0.01, 7.00 ± 0.01, and 10.00 ± 0.01) using buffer solutions. In between taking pH readings, the probe was washed under flowing water and rinsed with deionized water. It was necessary to keep the probe always dipped in a buffer solution of pH 7.0. Leachate was neutralized to pH 7.0 before recirculation using a KOH buffer solution.
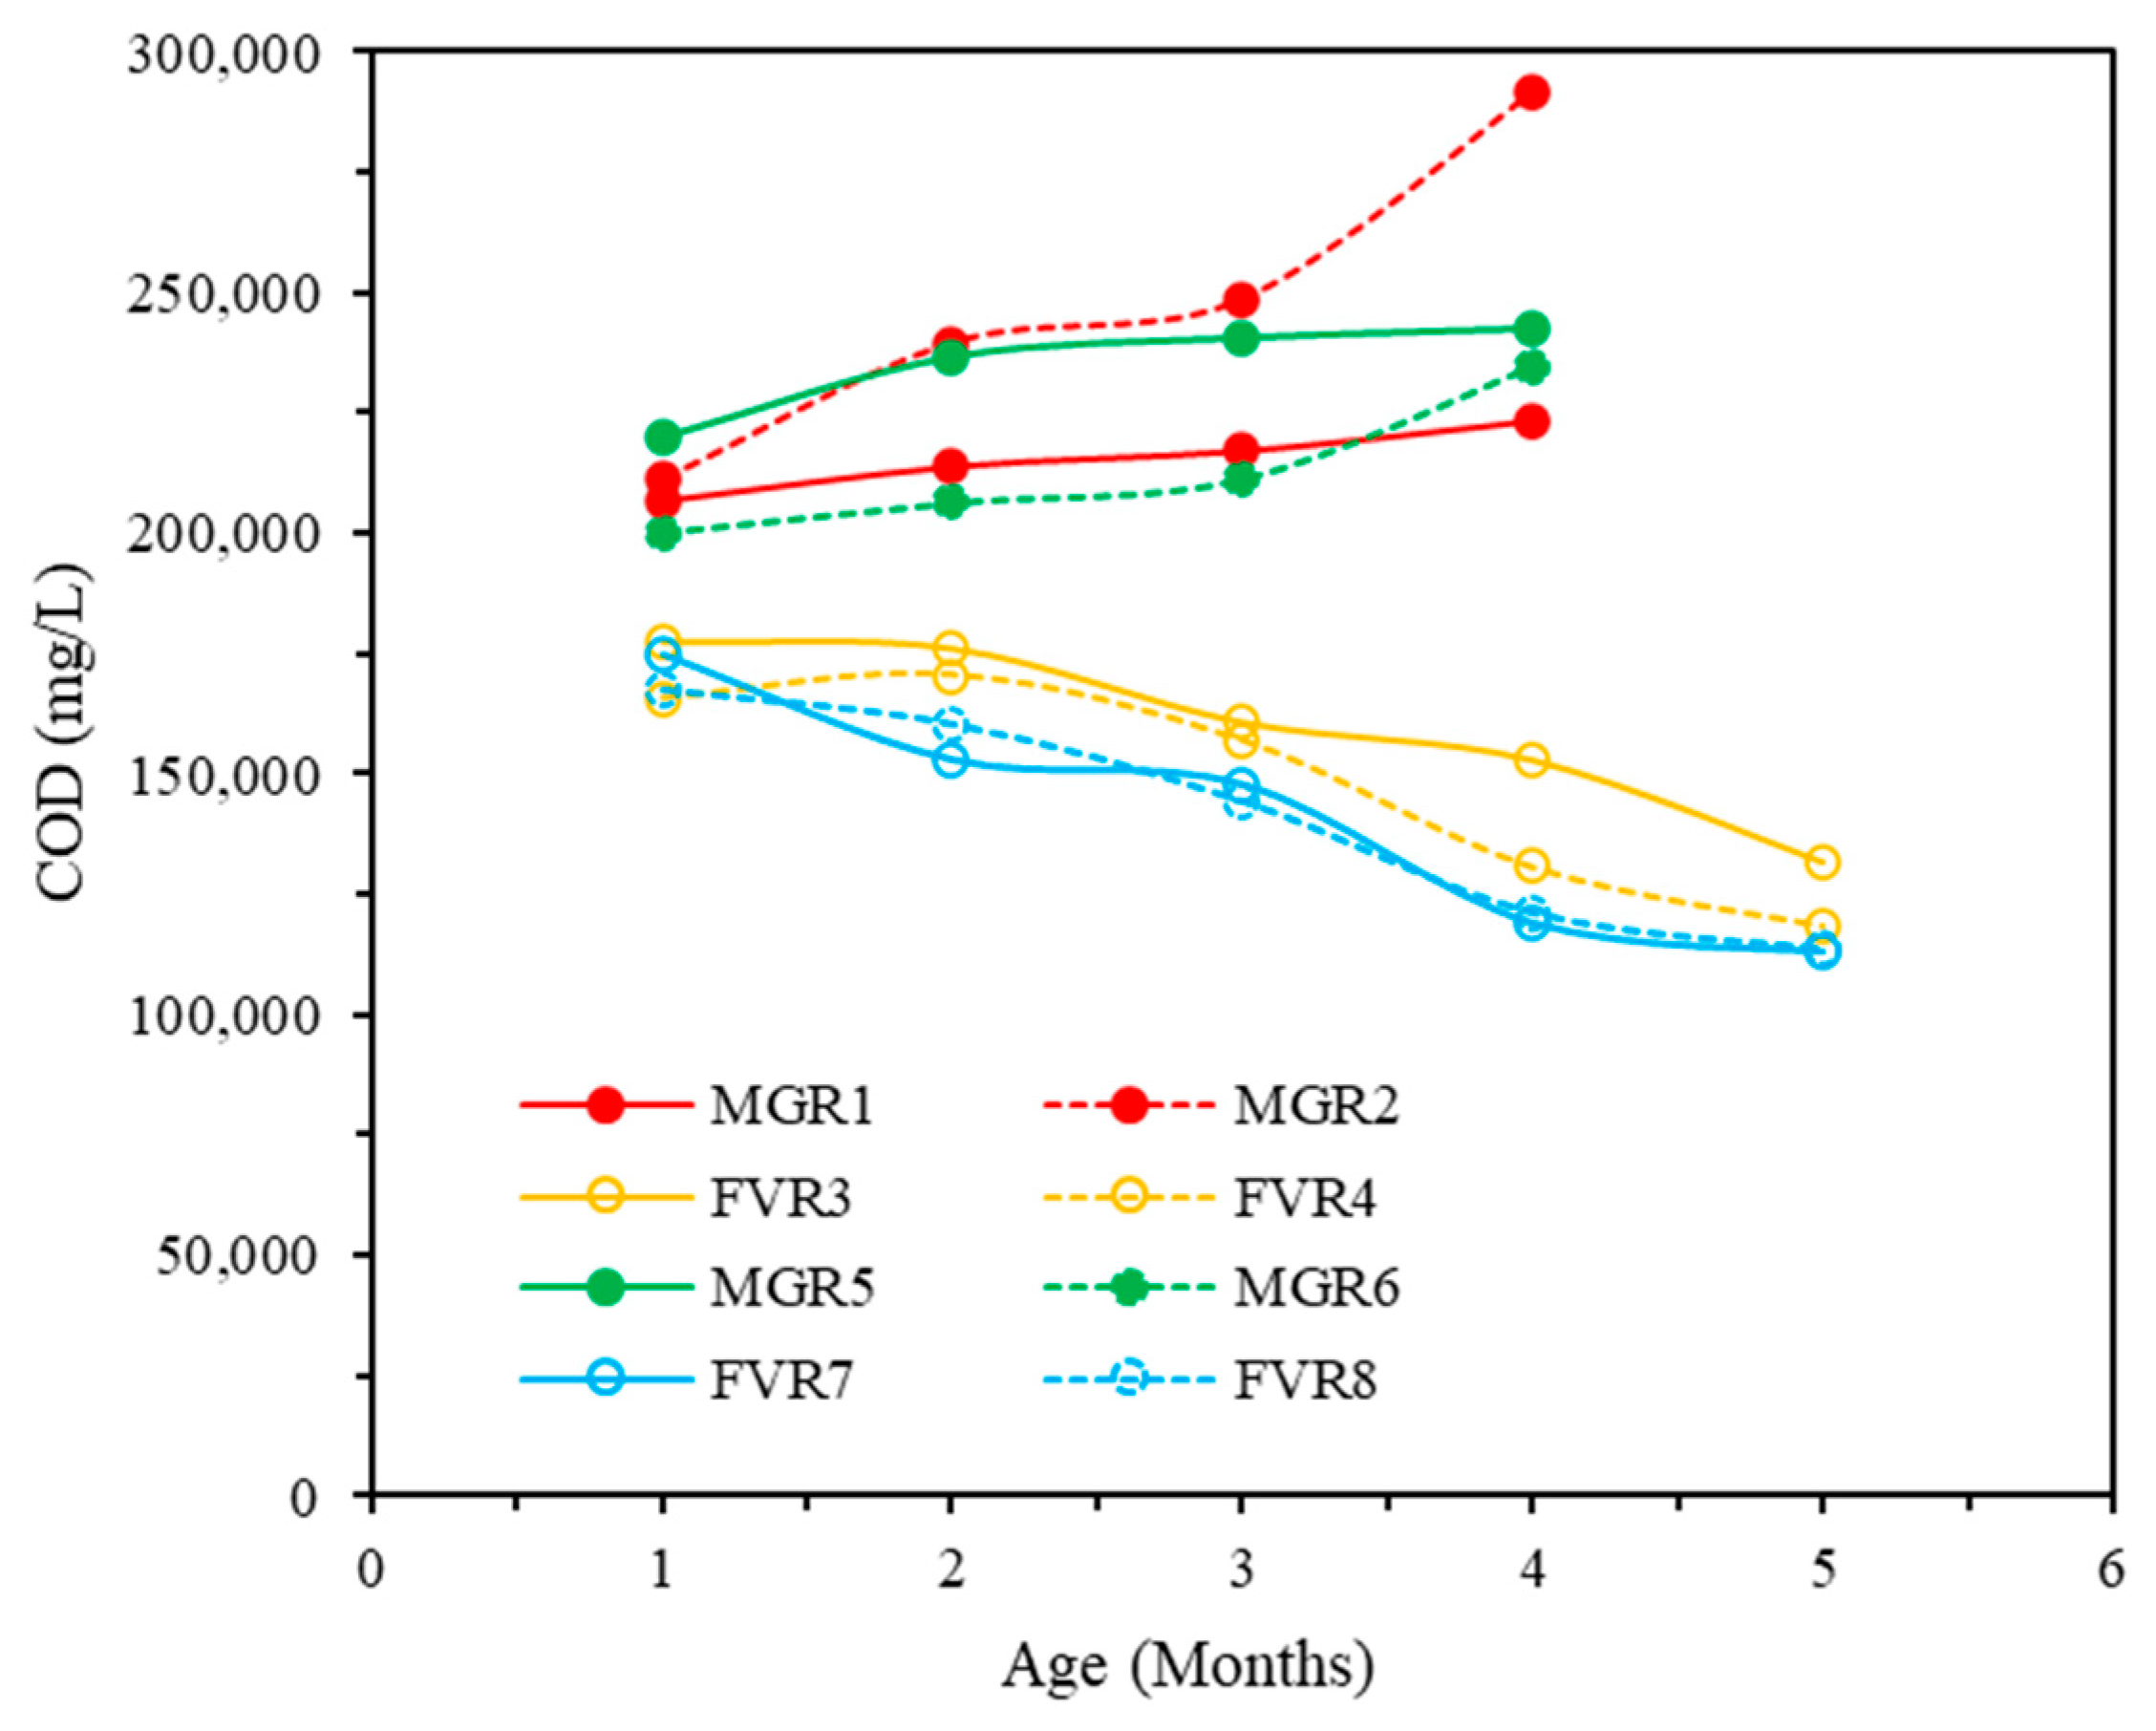
Chemical Oxygen Demand (COD) tests were performed on a monthly basis. For each reactor, two tests were conducted by diluting the leachate in a 1:100 ratio. Samples were prepared by pouring 2.5 mL of diluted leachate into COD vials and placing them in the digester which was previously heated to a temperature of 150 °C and keeping them in the digester for two hours. After digestion, the vials were kept outside the digester to cool them down to room temperature. The vials were then placed inside a spectrophotometer (Spectronic 200+; Thermo Fisher Scientific Inc., Waltham, MA, USA) which determines the absorbance of light and displays an absorbance value.
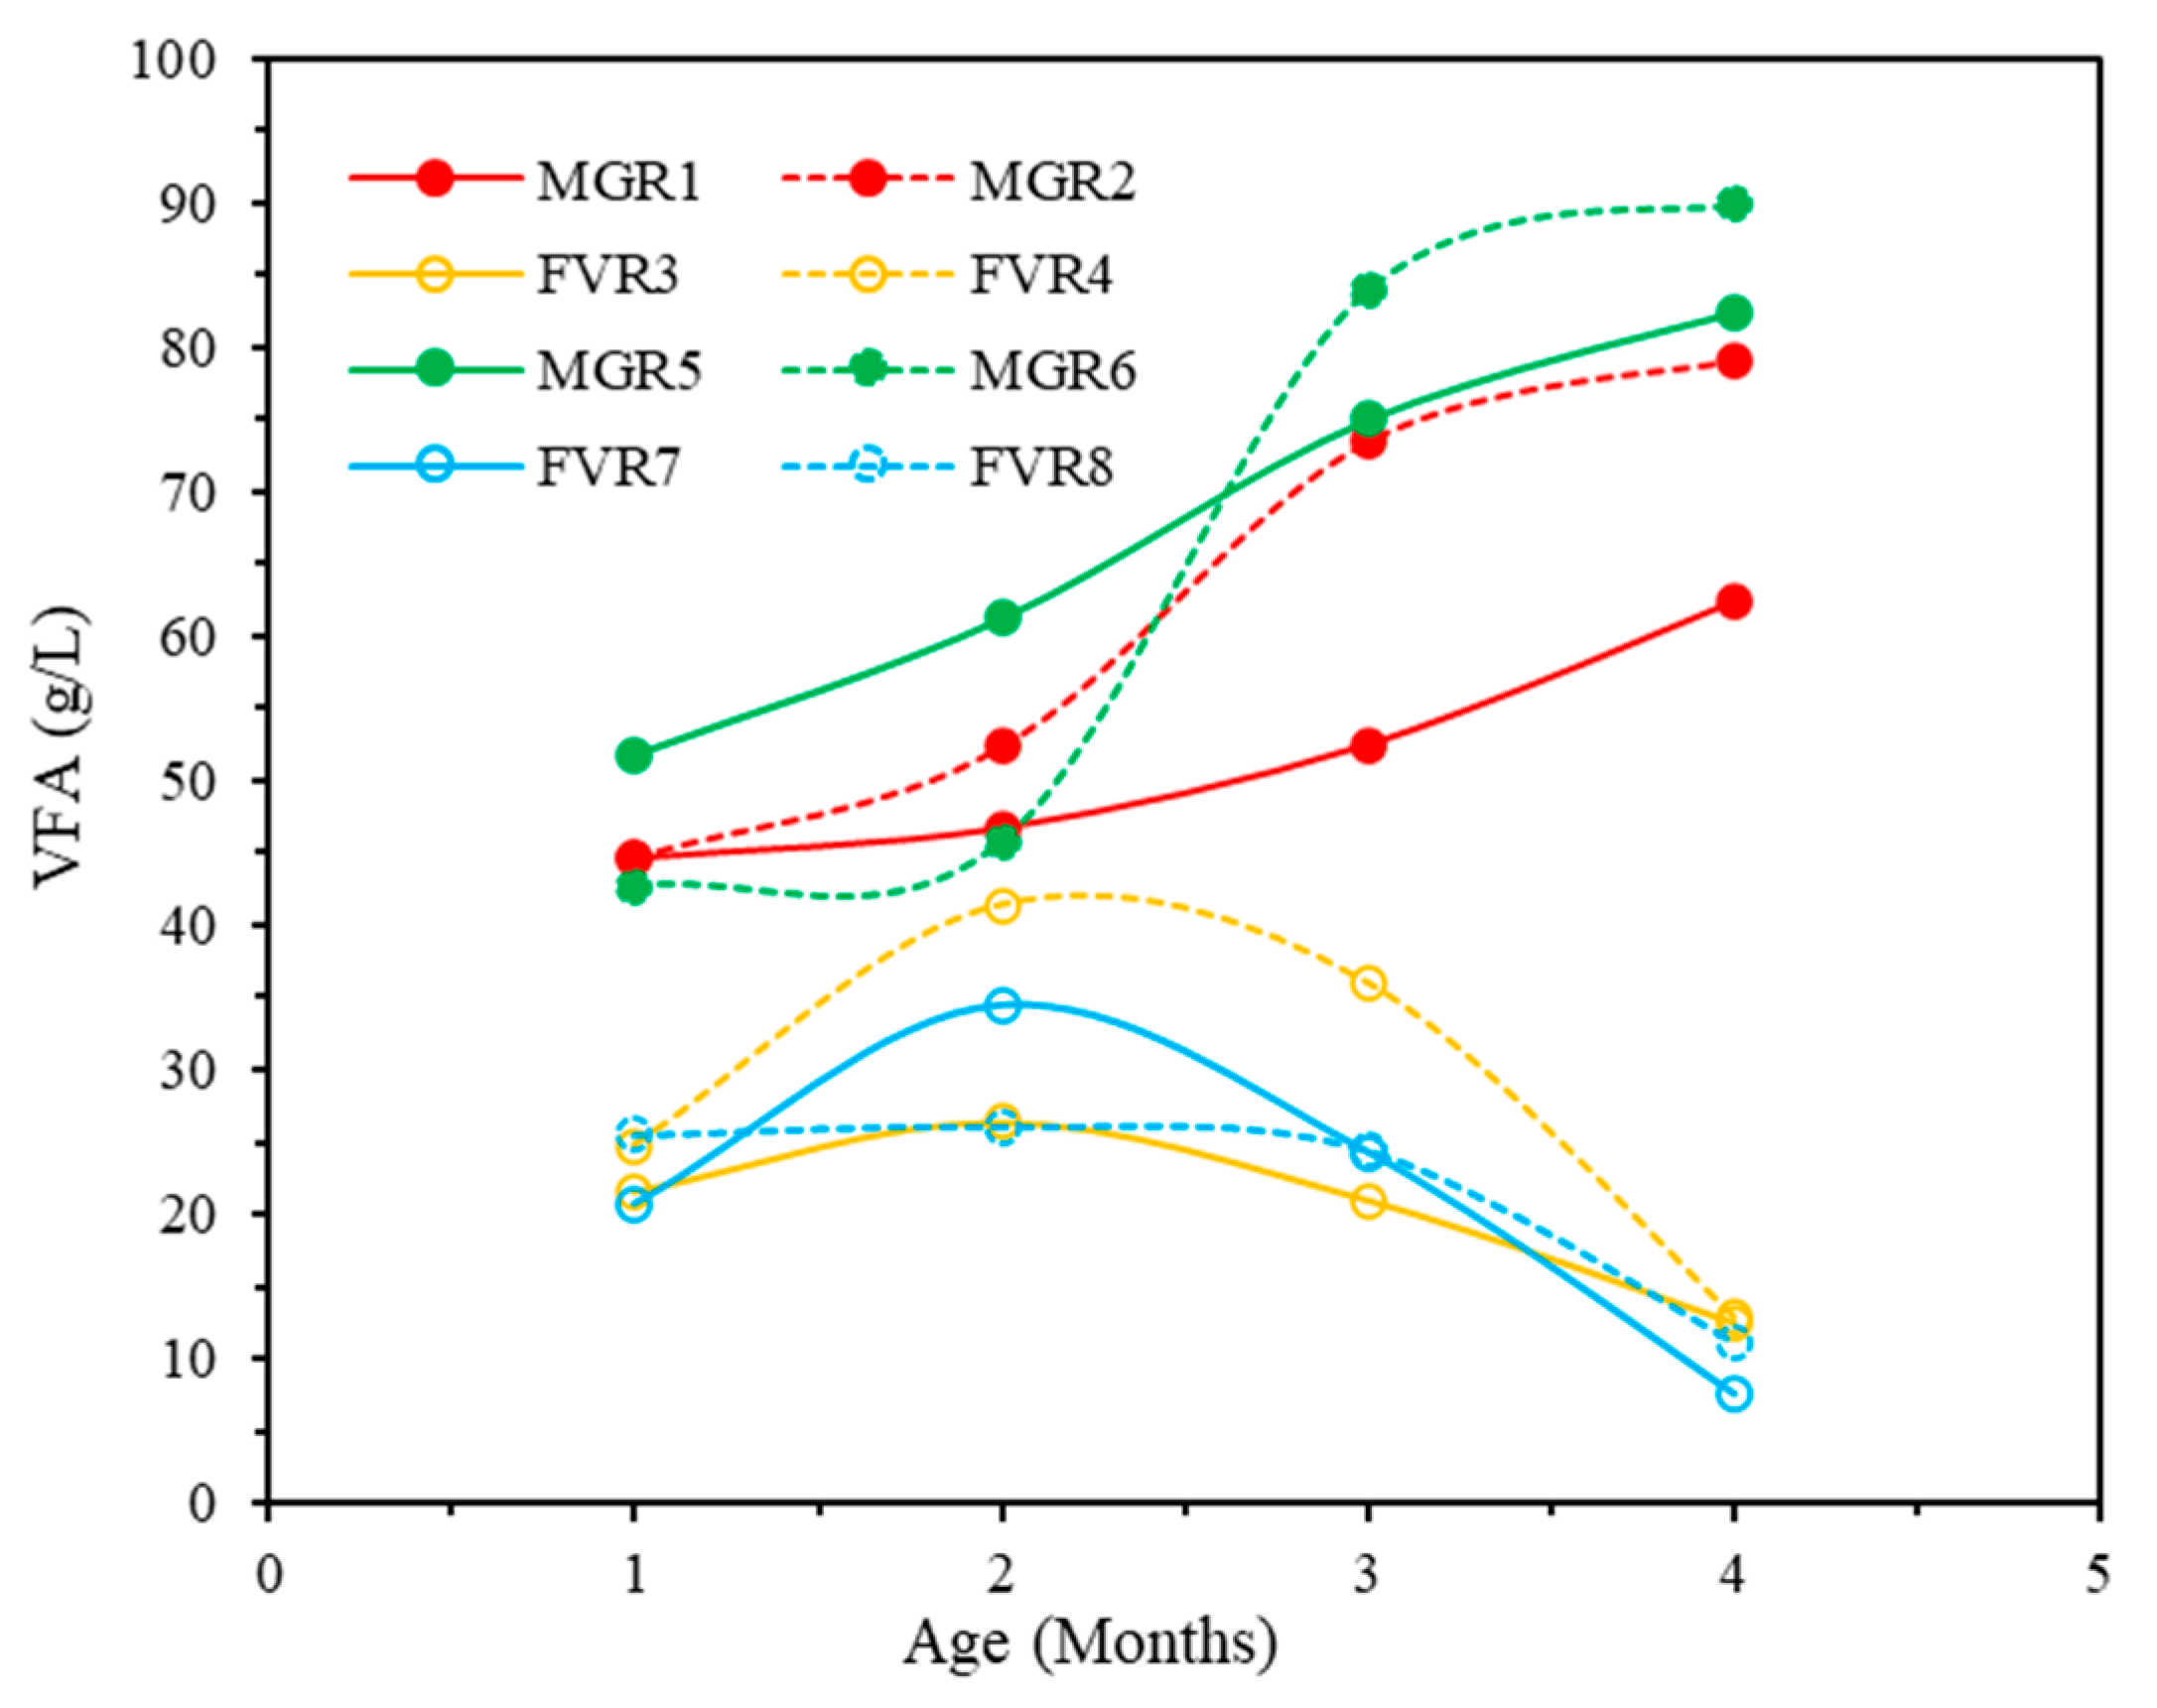
Volatile Fatty Acid (VFA) tests were performed on a monthly basis. For each reactor, tests were conducted by diluting the leachate in a 1:100 ratio. The pH-based titration method [17] was used to measure VFA. Initially, the pH of the 50-mL filtered sample was measured. Then, the pH of the sample was made to be 3.3–3.5 using H2SO4. Then, the sample was allowed to boil for 3 min. After cooling, the pH of the sample was adjusted to 4 and the amount of NaOH consumed for making the pH 7 was measured.

3. Results

The results obtained from the laboratory-simulated food waste bioreactors were evaluated to understand the effect of sludge on food waste decomposition and gas generation. Fresh food waste samples were collected from different sources and mixed to a synthetic ratio to keep the combination inside the similar reactors as identical as possible. A total of eight reactors were built with two pairs of reactors for meat and grain and two pairs of reactors for fruit and vegetable.
The results of the initial waste characteristics (moisture content, composition, and volatile solids), inoculum properties, leachate and gas volume, and composition during monitoring are discussed in the following sub-sections.

3.1. Characteristics of Food Waste

3.1.1. Initial Moisture Content of Food Waste for Reactors

Moisture content tests for both collected samples (UTA connection café and compost center) were conducted in triplicate. Food waste collected from the compost center had high moisture content compared to food waste from the UC connection café. Since fruits and vegetables were collected from composting facilities, they had a typically high water content (e.g., water content in pineapple, orange, apricot, apple, etc. 84~87%; strawberry, grapefruit contains >90%; banana 81%; cucumber, lettuce, eggplant, etc. >90%; green peas, potato 79%; and so on). However, mostly grain-based products were found in the connection café food waste, resulting in low moisture content.
After combining food waste samples with sludge, samples were taken for each pair of ADs to assess the properties of the waste at the beginning of the operation. Therefore, the moisture content found will be referred to as the initial moisture content of the waste inside the reactor. The initial moisture contents of waste for each pair of reactors were found to be almost similar for eight reactors (Figure 3). The moisture content found for the mixed food waste in this study was compared to the reported values found in the literature, as shown in Figure 3. The moisture content values found in this study are in close agreement with the previous studies [18,19,20].

3.1.2. Initial Volatile Solids

Volatile solids (VS) are one of the determining factors of waste decomposition and gas production. Before putting the waste inside the reactors, the volatile solids for each pair of reactor waste were determined and, hereafter, will be referred to as initial volatile solids. Figure 4 shows the average volatile solids content for different reactors. Significant variation in volatile solids was observed, due to variation in and non-uniformity of the waste properties. The volatile solid results were compared to the vs. from the literature [19,20,21,22] as shown in Figure 4. The volatile solids determined for the current research were found to be comparable to the results from previous studies. The vs. for food waste, compared to fresh waste (MSW), is significantly higher.

3.1.3. Characteristics of Inoculum

Microorganisms help the waste decompose faster. Especially in food waste or organic waste, the microbial population is very low and requires inoculum from an external source to facilitate the decomposition of waste and gas generation as a byproduct. An increase in inoculum percentage increases gas production. Previous studies found some successful results by adding sludge in amounts from 20% to 80% [6,19,23]. However, for field applications, a high percentage of inoculum is not feasible. In this study, sludge as inoculum was added to the different combinations of food waste to observe the effect of sludge on individual food waste components.
Typically, sludge contains a high microbial population and, as sludge is digested anaerobically, it has a good number of anaerobic bacteria in it. Sludge usually has high pH because of being digested anaerobically which might help to dilute the initial acidic environment generated in the food waste. The pH, moisture content, and volatile solid content of the sludge are presented in Table 2.

3.2. Leachate Monitoring

Leachate monitoring, which included monitoring of the pH, volume, chemical oxygen demand (COD), and volatile fatty acid (VFA), is discussed in the following subsection.

3.2.1. pH Monitoring

Variation in the pH of the food waste reactors depends on the waste degradation stage inside the AD. To monitor the pH of the AD, leachate was collected, and pH was measured using an Oakton benchtop pH meter. According to previous researchers [19,24], food waste experiences a pH drop due to VFA accumulation, resulting in frequent recirculation. A similar scenario was observed in the current study. Due to the low pH in the initial phase, frequent recirculation was necessary, which was done by neutralizing the pH.
Meat and grain ADs were the first to show a stable increase rather than the high fluctuation noticed at the beginning of the operation, followed by the AD of fruit and vegetable reactors. For the first 90 days, pH was measured more frequently compared to the rest of the operational times of the ADs. The pH variation over time for all of the reactors is graphically presented in Figure 5.
At the beginning of the operation, the pH of the reactors dropped rapidly due to the acidogenic phase and excessive volatile fatty acid (VFA) accumulation in the food waste [24]. This resulted in lower pH for a longer period than typical solid waste reactors. Therefore, to avoid excessive acid accumulation, leachate was collected to monitor the pH level and potassium hydroxide (KOH) was added to neutralize the leachate before recirculation whenever it was found to be below 7.0. At the beginning of the operation, the pH for all of the reactors was acidic (pH 5 or below) and leachate was recirculated on a regular basis for pH neutralization. pH gradually became stable, between 6 and 7, after 20 days (about three weeks) of recirculation for the reactors with meat and grain (MGR1, MGR2, MGR5 & MGR6) and 60 days (about two months) after recirculation for the fruit and vegetable reactors (FVR3, FVR4, FVR7, and FVR8). After that, the pH of the leachate gradually started to increase, and KOH neutralization was carried out whenever the pH seemed to drop.
The pH started increasing faster for reactor MGR1, MGR2, MGR5, and MGR6, which had meat and grain. All of these reactors crossed pH 7.0 before 20 days (about three weeks). This was because protein degradation releases ammonia which increases the pH faster. MGR1, MGR2, MGR5, and MGR6 contained meat and meat is a source of a high amount of protein which leads to a faster increment of pH. However, after crossing pH 7.0, the pH did not increase significantly. For MGR1 and MGR2, the pH increased up to 7.67 and 7.76, respectively, and then it started decreasing. For MGR5 and MGR6, the peak pH was 7.67 and 7.84, respectively, and then the pH started decreasing gradually. Once the pH started decreasing, the reactor operations in MGR1 and MGR2 were stopped after 96 days and 100 days of operation, respectively. The same happened to reactors MGR5 and MGR6 after 108 days of operation.
A comparatively longer period of time was required to increase the pH for the reactors FVR3, FVR4, FVR7, and FVR8, which contained fruit and vegetable. They were in an acidic phase (>60 days) for a longer period than the meat and grain reactors. Fruit and vegetable wastes are hydrolyzed quickly due to low TS and high VS, which leads to acidification and a rapid decrease in the pH [25]. Therefore, a longer time was needed to increase the pH for FVR3, FVR4, FVR7, and FVR8.
In the case of reactors FVR7 and FVR8, which had 30% sludge mixed with fruit and vegetable, the pH was below 7.0 for 63 days. After 63 days of lag period, the pH in reactors FVR7 and FVR8 started going above 7.0 and increased up to 9.09 and 8.95 for reactors FVR7 and FVR8, respectively. The gas generation from reactors FVR7 and FVR8 also significantly increased during this period due to reaching the methanogenic phase of degradation.
For reactors FVR3 and FVR4, which havd fruit, vegetable, and 20% sludge, the lag phase was a bit longer than for reactors FVR7 and FVR8, which had fruit, vegetable, and 30% sludge. For reactor FVR3, the pH was below 7.0 for 76 days and, for reactor FVR4 which is a duplicate of reactor FVR3, it was 93 days. After 76 days of lag phase, the pH increased up to 8.55 and 8.98 for reactors FVR3 and FVR4, respectively. The gas generation significantly increased during this period as well, due to the optimum environment for methanogenic bacteria.
A study was done by Wang et al. [23] on food waste reactors and showed a similar trend in pH variation, except the initial pH was higher than the current study and the lag phase was shorter. This was because the authors used a high percentage of inoculum (up to 70%), as the lower percentage (30%) failed in their case. The use of higher inoculum diluted the acidic environment and helped in reducing lag time.

3.2.2. Leachate Volume

The purpose of leachate recirculation in landfills is to maintain the moisture content of waste to accelerate degradation. However, if the waste is organic or food waste, it contains a very high level of moisture (>70%) and there is no need for maintaining moisture through the recirculation of leachate in the initial stage. Instead, the recirculation of leachate (mixed with neutralizer, i.e., KOH) becomes necessary to neutralize the extremely acidic environment created by the acid accumulation in the acidogenic phase. In this research, all the reactors contained waste that was 100% food waste. To neutralize the reactor environment, leachate was recirculated every day for one month, then, it was done every alternate day, and, afterward, the frequency of recirculation was reduced. The generated leachate volume measurement data are shown in Figure 6.
From the leachate generation data, it was observed that, in the initial stage, the generation of leachate was almost the same for all of the reactors and the volume was increasing. Gradually, the volume of leachate started decreasing in the reactors with meat and grain, that is MGR1, MGR2, MGR5, and MGR6, after 20 days. On the other hand, the leachate volume for the reactor with fruit and vegetable was increasing day by day. It can be observed that, when the leachate volume was the highest, the generation of gas and methane was also at the peak for those reactors because moisture accelerates the degradation process.

3.2.3. Chemical Oxygen Demand (COD)

The variation in chemical oxygen demand (COD) for the reactors is shown in Figure 7. The test for COD was done monthly on the collected leachate. For all of the reactors, high values of COD were observed.
The relation between COD and waste degradation is that COD decreases with time as the waste decomposes. In this study, the initial COD values for all of the reactors were high and the COD values for reactors with meat and grain were comparatively higher than the reactors with fruit and vegetable. This is because the reactors were in the lag phase, which is the acidogenic phase, and almost no degradation occurred.
In the case of the reactors MGR1, MGR2, MGR5, and MGR6, the COD value was increased from the beginning. The initial values of COD of the reactors MGR1 and MGR2 were 206,904.7 mg/L and 211,034.9 mg/L, respectively, and gradually increased to 223,303.1 mg/L and 291,392.5 mg/L, respectively, at the end of the fourth month. The increasing value of COD indicates that the degradation did not take place properly in the reactors with meat and grain due to VFA accumulation, which stopped the operation in the reactors as well.
In the case of the reactors FVR3, FVR4, FVR7, and FVR8, as soon as the acidogenic phase ended and the degradation took place, and started to go into the methanogenic phase, the COD started to drop. The initial COD for the reactors FVR3 and FVR4 were 177,381.4 mg/L and 165,739.6 mg/L, respectively, which reduced to 131,995.1 mg/L and 118,614.3 mg/L, respectively, at the end of the fifth month. Similarly, the COD values for the reactors FVR7 and FVR8 reduced to 113,144.8 mg/L and 113,437.8 mg/L, respectively, from 174,544.3 mg/L and 167,696.2 mg/L.
Wang et. al. [23] showed that, when the reactor reached the methanogenic phase, the COD dropped significantly. The results of the present study varied significantly from Wang et. al. [23], since they used around 70% degraded waste as inoculum while, in the present study, the inoculum percentages were only 20% and 30%. As a result, their lag phase was significantly reduced and reached the methanogenic phase rapidly compared to the current study.

3.2.4. Volatile Fatty Acid (VFA)

The variation in VFA for the reactors is shown in Figure 8. The test for VFA was done monthly on the collected leachate. In this study, a high value of VFA accumulation was observed for all of the ADs.
It was observed that VFA accumulation was comparatively higher for the reactors MGR1, MGR2, MGR5, and MGR6, which contains meat and grain, at the beginning. On the other hand, VFA accumulation was comparatively lower at the beginning for the reactors with fruit and vegetable. Then, the VFA accumulation started to increase for all of the reactors in the second month. After the second month, the VFA accumulation for the reactors with fruit and vegetable started decreasing gradually, while the VFA accumulation for the reactors with meat and grain was still increasing.
In the case of the reactors MGR1 and MGR2, the VFA accumulation was 44.55 g/L and 44.7 g/L, respectively, in the first month. Then, the VFA accumulation was increasing for these two reactors every month and became 62.5 g/L and 79.2 g/L, respectively, in the fourth month when the operation was stopped. Similarly, for the reactors MGR5 and MGR6, the VFA accumulation was 51.7 g/L and 42.7 g/L at the beginning, and gradually increased to 82.5 g/L and 90 g/L in the fourth month. Because of the continuous increase in VFA in these reactors, their methane generation was negligible, and their operation was stopped early.
Again, for the reactors FVR3 and FVR4, the VFA accumulation was 21.6 g/L and 24.7 g/L, respectively, in the first month. Then, it increased to 26.4 g/L and 41.4 g/L, respectively, in the second month. After the second month, the VFA accumulation started decreasing and became 7.3 g/L and 9.8 g/L, respectively, in the fifth month. From a study done by Viéitez et. al. (2000) [26], it has been found that, if VFA accumulation is greater than 13 g/L, it will create an inhibitory environment for methane production. The VFA accumulation for the reactors FVR3 and FVR4 went below 13 g/L in the fourth month, and then they started showing a great amount of methane production throughout the fifth month.
For the reactors FVR7 and FVR8, the VFA was 20.7 g/L and 25.5 g/L in the first month, and then it increased in the second month. Finally, the VFA accumulation reduced to 7.3 g/L and 9.8 g/L, respectively, in the fifth month. For the reactor FVR7, VFA accumulation crossed 13 g/L after almost three and half months, and the same happened for reactor FVR8 just before four months. When their VFA accumulation was less than 13 mg/L, the reactors showed a good percentage and volume of methane generation, as in the reactors FVR3 and FVR4.
A similar study was conducted by Jiang et. al. [27], which showed that VFAs were produced in the acidogenesis and acetogenesis steps. Under all of the pH conditions, the concentration increased rapidly at first and then was relatively stable and changed little. The maximum VFA concentrations at pH uncontrolled, 5.0, 6.0, and 7.0 were 3.94, 17.08, 39.46, and 37.09 g/L, respectively, indicating that the greatest VFA production had occurred at pH 6.0. The same happened for the reactors with fruit and vegetable. Their VFA accumulation was at its peak when the pH was around 7.0, and it started decreasing as soon as the pH was around 7.0.

3.3. Monitoring of Gas Generation

3.3.1. Gas Composition

The reactors were operated at 37 °C inside an environmental growth chamber. Gas data were collected whenever there was gas inside the gas bags. Figure 9 shows a graphical representation of the gas composition data for all of the reactors. All of the compositions are shown in percentages (%). Typically, the anaerobic decomposition of waste occurs in four phases: (i) aerobic phase, (ii) acidogenic (acid formation) phase, (iii) methanogenic (methane generation) phase, and (iv) methane depleting phase. From the gas composition data, it can be seen that the initial percentage of oxygen in the reactors was a bit high, and depleted rapidly. This was the aerobic phase, where the gas mainly consisted of carbon dioxide in high percentages and other gases (e.g., H2S, nitrogen compounds, etc.). In this stage, all of the reactors had a negligible amount of methane content.
In the acidogenic phase, the pH started dropping for all of the rectors. It was reported by Shao et al. [24] that, if the waste stream has a high percentage of food waste, a sudden drop in pH occurs due to the accumulation of excessive volatile fatty acid. Reactors in the current study had pure organic waste, which was composed of different types of food waste. As a result, the environment inside the reactors kept becoming acidic, which was neutralized frequently through the addition of KOH with leachate. Excessive acid accumulation tends to inhibit bacterial activity which, in turn, affects the gas production, creating a lag phase before the decomposition enters the methanogenic phase. In the current study, a similar phenomenon occurred due to VFA accumulation, and there was a long lag phase found for all of the reactors, which can be seen in Figure 9, which shows time percentage of gas components going down due to little to no gas production. Apart from the reactors FVR3, FVR4, FVR7, and FVR8 (which had fruit and vegetable in addition to sludge), all of the other reactors containing meat and grain were still in the lag phase. The reactors FVR7 and FVR8 entered the methanogenic phase earlier than the reactors FVR3 and FVR4.
In the methanogenic phase, typically, the dominating components in the gas are methane and carbon dioxide. In this stage, the methane percentage goes as high as 60~65% and the pH of the leachate varies between 6.0 and 8.5 [19]. In the current study, the reactors were monitored for about five months and, until that time, the reactors FVR3, FVR4, FVR7, and FVR8 were found to have reached the methanogenic phase. The pH of these reactors went as high as 8.55, 8.98, 8.95, and 9.09, respectively, while the methane content showed a much higher value than in previous studies. The methane content for the reactors FVR3 and FVR4 was found to be stabilized around 68~72%. The remaining 20~28% were found to be composed mainly of carbon dioxide and a negligible amount of other gases. Similarly, the methane contents for the reactors FVR7 and FVR8 were stabilized between 51~52%. The oxygen content in these reactors was near zero during this time, as the reactors were operated in anaerobic conditions.
The initial carbon dioxide levels were higher due to the breakdown of organic compounds into simpler compounds, which produced carbon dioxide. Over time, the carbon dioxide percentage decreased and the methane percentage increased. Until the reactors reached the methanogenic phase, the methane to carbon dioxide ratio was below 1.0. The scenario of increasing methane and decreasing carbon dioxide can be shown by CH4:CO2 vs. the time graph in Figure 10. For the reactors FVR3 and FVR4, the ratio increased to as high as 8.5 and 6.6, respectively, and, for FVR7 and FVR8, it increased to 5 and 5.9, respectively. The remaining reactors were still in the lag phase and no gas was produced during that time.

3.3.2. Gas Volume

The total gas generated from all of the ADs over time is shown in Figure 11a. It was observed that the reactors MGR1, MGR2, MGR5, and MGR6 were producing the highest amount of gas from the beginning, and the gas generation rate was a bit less for the reactors FVR3, FVR4, FVR7, and FVR8. This means that the reactors with meat, grain, and sludge were producing more gas in the beginning than the reactors with fruit, vegetable, and sludge. However, after around 20 days, the gas generation rate started decreasing for the reactors with meat and grain. The reactors with meat and grain were producing a huge amount of CO2 during the acidic phase, which bumped up the gas generation in the early stage. On the other hand, the reactors with fruit and vegetable were producing less gas at the beginning. However, the gas generation rate increased significantly after 60 days, when pH reached 7. Again, when the VFA went below the inhibitory amount, which is 13 g/L, the gas generation rate increased exponentially for the reactors with fruit and vegetables.
As can be seen from observing the scenario of cumulative methane generation, the methane generated in the initial phase was almost negligible. Due to the excessive VFA accumulation, all of the reactors were in the acidogenic phase, which inhibited bacterial activities, resulting in little to no gas production for a long time. Figure 11b shows the cumulative methane generation over time. It can be observed that all of the reactors containing meat and grain produced a negligible amount of methane until they stopped gas production. In the case of the reactors FVR7 and FVR8, they started producing a considerable amount of methane after around 75 days of lag period and rapidly went into the methanogenic phase. Similarly, the reactors FVR3 and FVR4 started producing a good amount of methane after around 100 days as their methanogenic phase started. The reactor FVR3 produced a total of about 6.7 L of methane per pound of food waste on a wet-weight basis until day 160 of the observation period, and it was still producing a considerable amount afterwards.
In the case of the reactor FVR4, which had the same configuration as reactor FVR3, the cumulative methane generation curve showed a similar trend. However, the lag period was 88 days, which was somewhat longer than for the reactor FVR3. The reactor FVR4 produced a total of about 4 L of methane per pound of food waste on a wet-weight basis until day 160 of the observation period, and it was just introduced into the methanogenic phase at that time.
The acidogenic phase continued to be longer for reactors with meat and grain even after 160 days of operation, and the amount of methane generation was almost negligible. Therefore, it can be said that sludge was found to be a better source of inoculum for fruit and vegetable waste decomposition and methane generation compared to meat and grain waste.
All of the reactors were monitored for around 160 days. In Figure 12, the methane percentages for all of the reactors are presented. For the first 8–10 days, the CH4 percentage was very low for all of the reactors. Then, methane production started for the reactors FVR3, FVR4, FVR7, and FVR8, which contain fruit and vegetable, and their methane percentage started increasing. However, for the reactors MGR1, MGR2, MGR5, and MGR6, there was no significant percentage of methane, and it was almost negligible. The highest methane percentages were found in the reactors FVR3 and FVR4, which were 72.5% and 68%, respectively. Then, the second highest percentages of methane were found in the reactors FVR7 and FVR8, which were 52% and 51%, respectively.
The total daily gas generation rate or gas yield graph and methane yield graph for the reactors show a similar trend (Figure 13), except for initially, as the methane percentage was extremely low. Therefore, in the methane yield graph, the initial values are almost close to zero. From the total gas generation rate plot (Figure 13a), it can be observed that, at the beginning, there was a greater gas yield followed by a lag phase. In the beginning, the reactors with meat, grain, and sludge were producing a huge amount of gas every day. The reactors FVR3, FVR4, FVR7, and FVR8 produced a good amount of gas in the beginning, then the lag phase was introduced. The lag period continued for 40~60 days for the reactors FVR3, FVR4, FVR7, and FVR8, which then started producing gas and gradually entered the methanogenic phase (Figure 13b).
In the methanogenic phase, the methane yield was found to be as high as 343 mL per pound per day for the reactor FVR3, and for the reactor FVR4, the value was 307 mL per pound per day on a wet-weight basis. The gas yield graph, as well as the methane yield graph, shows multiple peaks because of the non-homogeneity of the waste, and because all of the waste components did not start decomposing at the same time.

3.3.3. Comparison with Previous Studies

Reactors with food waste usually have a long lag phase due to VFA generation, as observed so far in the current study. Similar observations were reported in a study done by Wang et al. [23], where the addition of 30% seed in food waste was not enough and the reactors failed due to excessive acid accumulation. However, when the seed percentage was increased to 70%, due to the dilution effect, the reactors became successful. In the current study, the total amounts of seed added were 20% and 30%. Although the percentage was low compared to the previous study, it was successful for a pair of reactors where the included seed was sludge. Another study by Karanjekar [19] showed that an addition of 20% sludge as the seed to the food waste reactor produced a satisfactory result; however, there was a lag period of more than 50 days, and a peak methane yield of around 550 mL per kg per day or 250 mL per pound per day.

4. Conclusions

The primary focus of the research was the sustainable management of organic waste by proposing an effective combination of food waste and sludge. Thus, it could be implemented in developing countries with locally produced food waste as well as for energy retrieval from organic waste, as organic waste poses several problems in the traditional landfill.
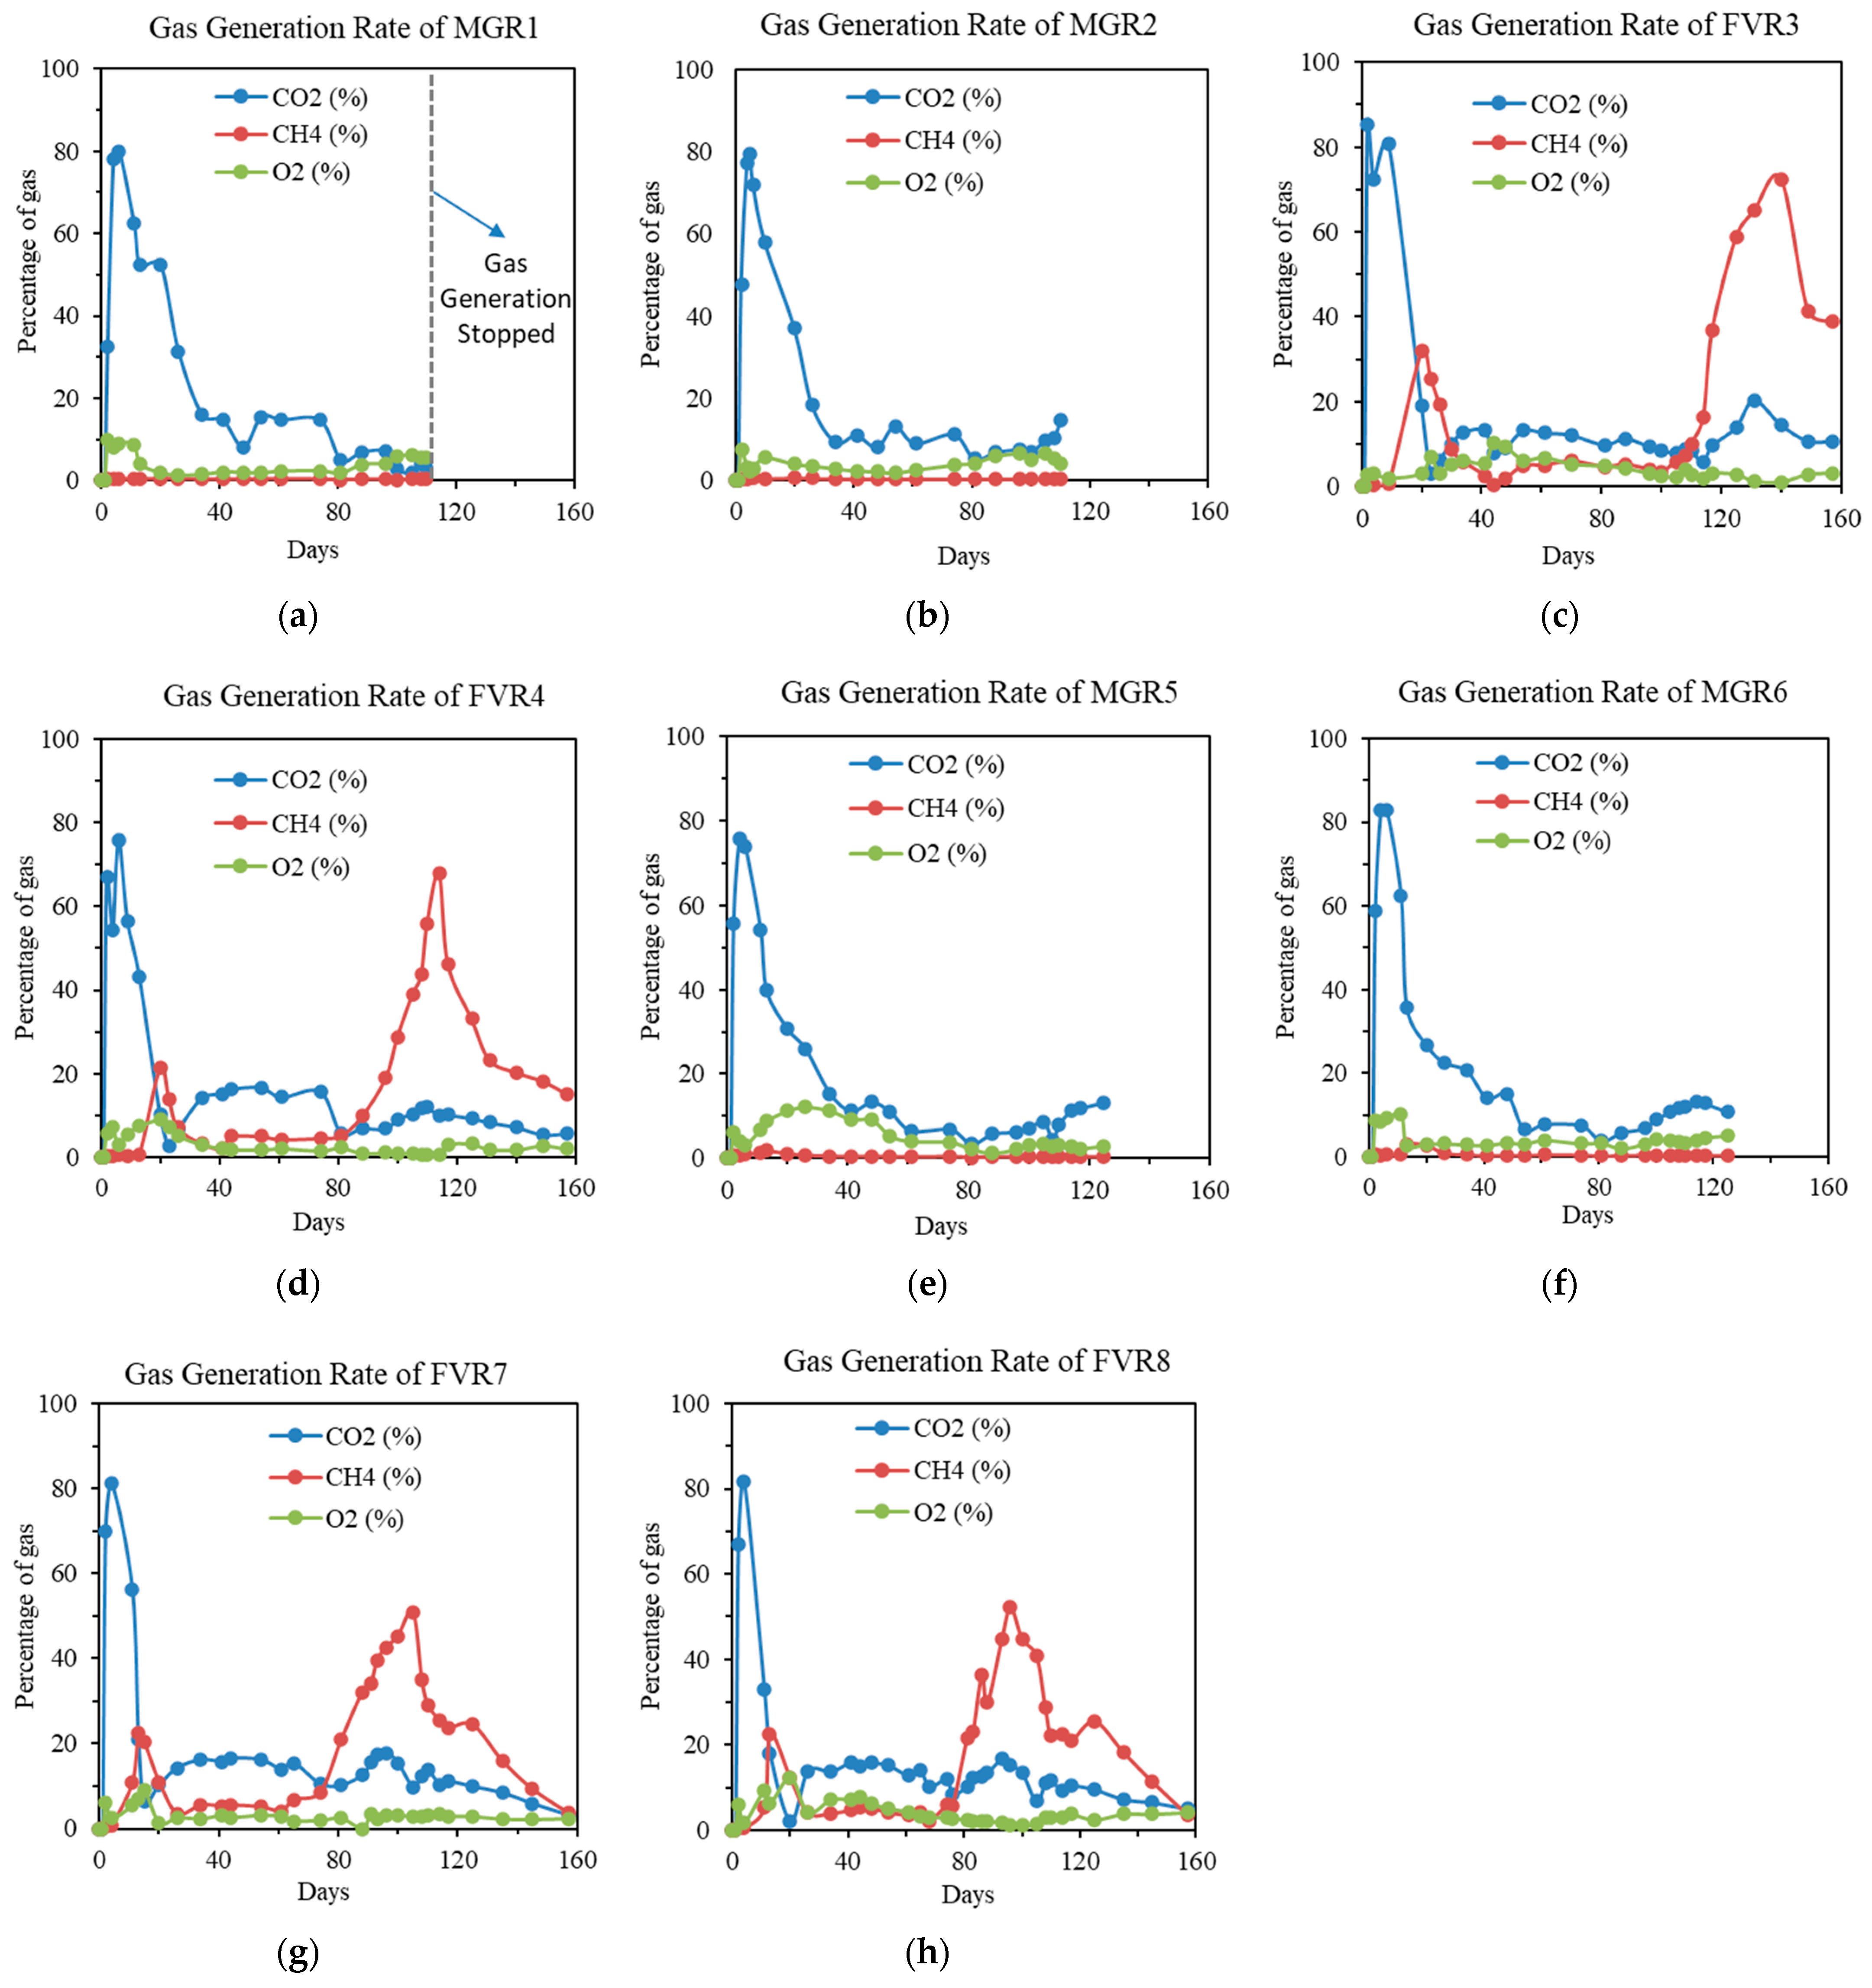
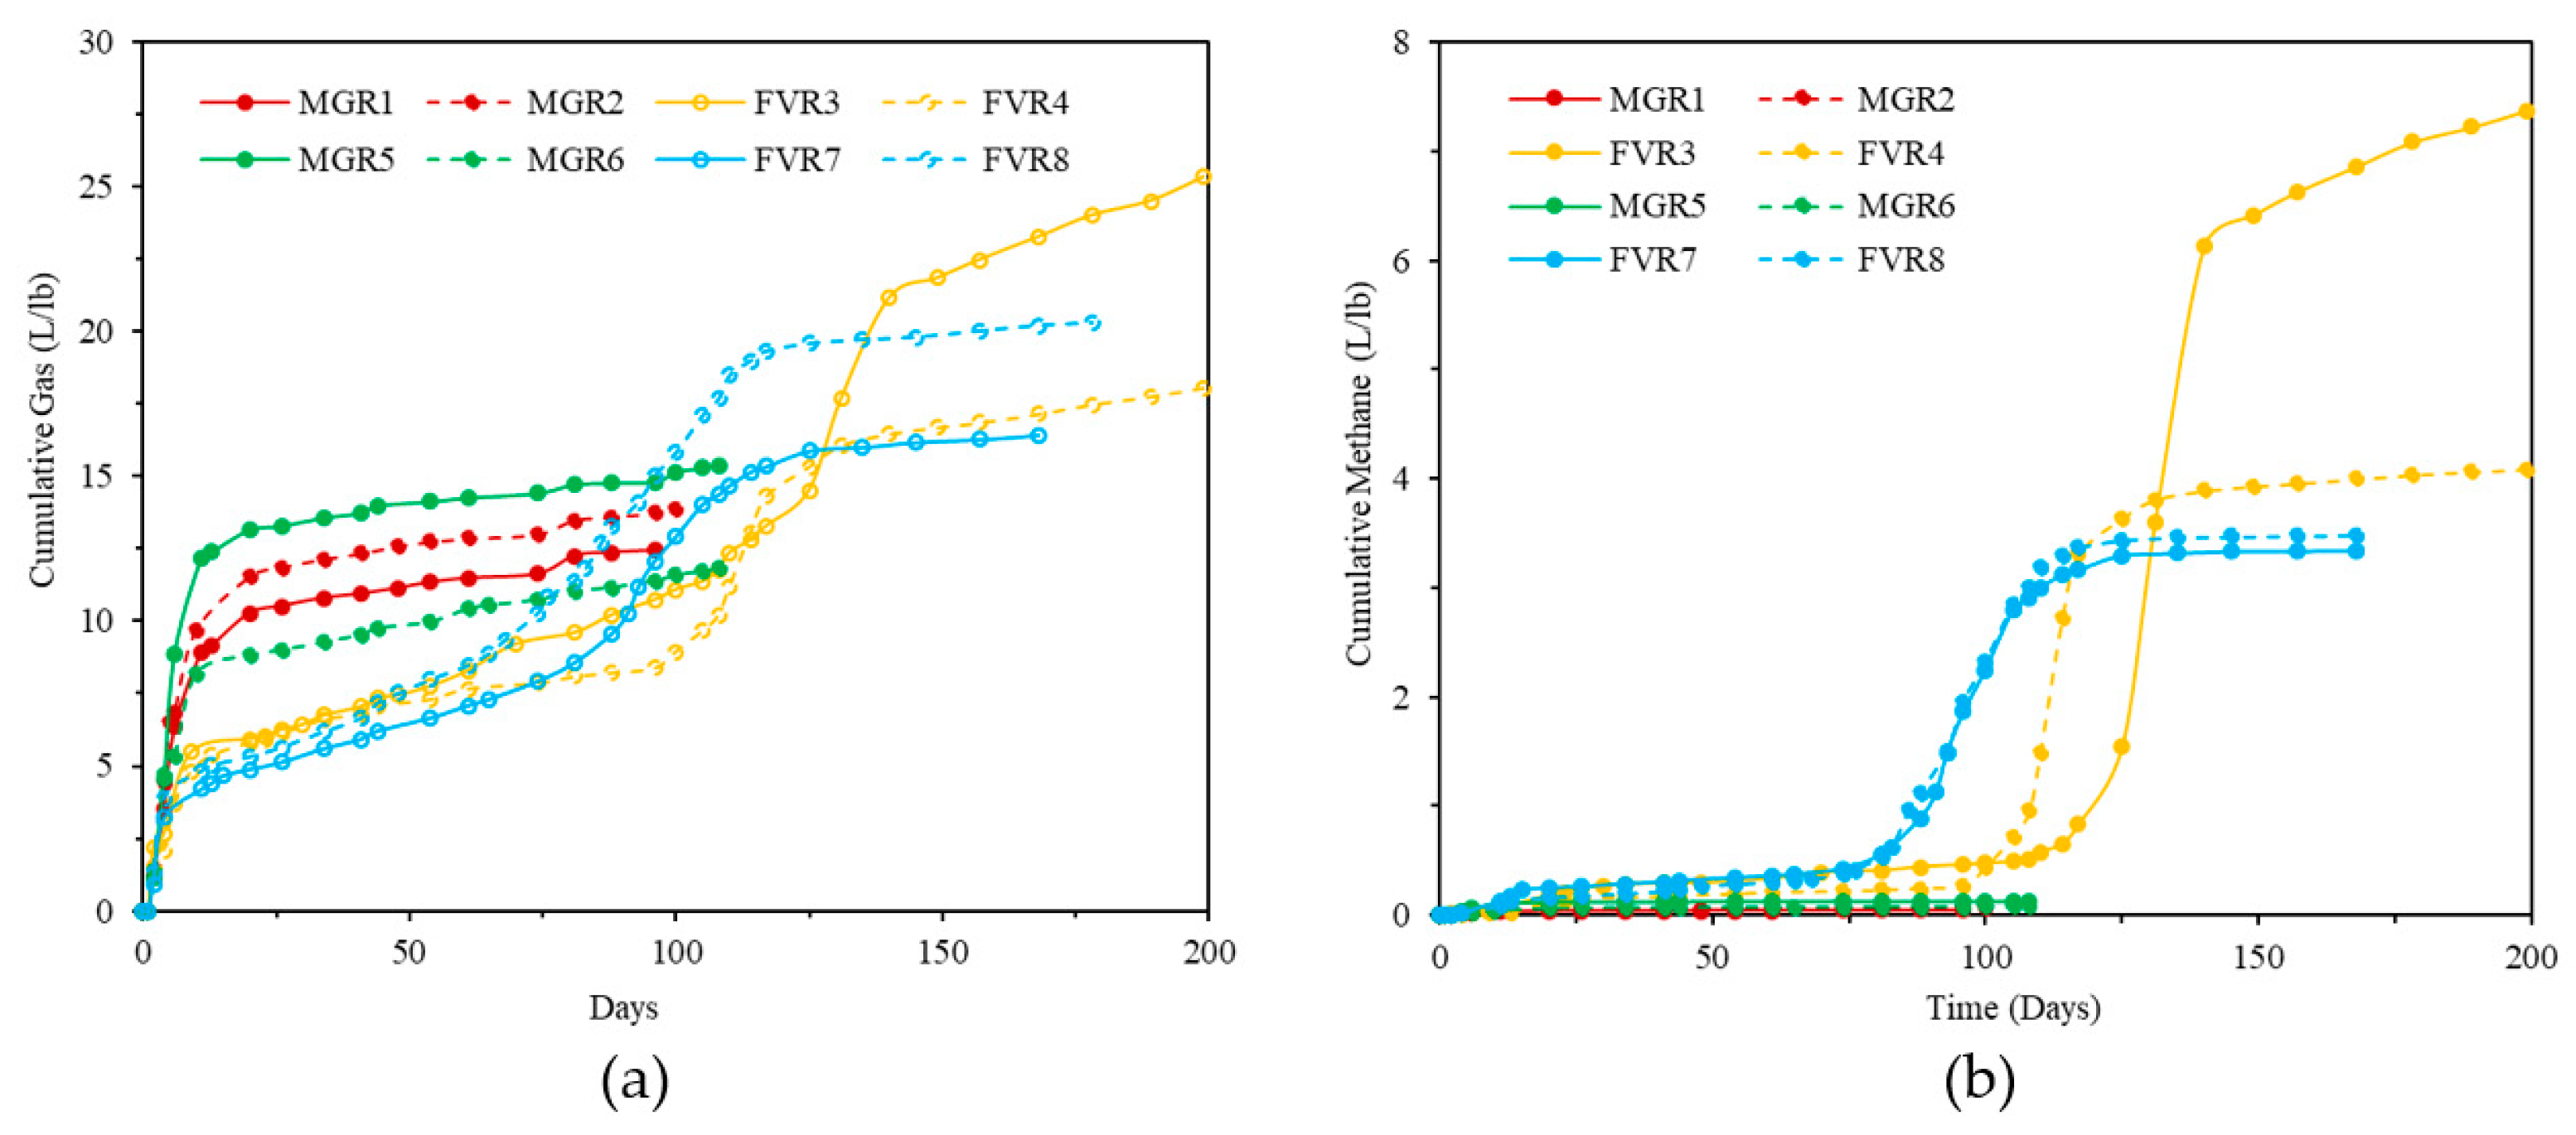
  • Based on the monitoring results for 160 days, fruit and vegetable showed faster decomposition compared to meat and grain. Additionally, they produced a considerable amount of gas, since VFA accumulation was much higher for the reactors that contained meat and grain. The VFA accumulation started to increase for all of the reactors in the second month.
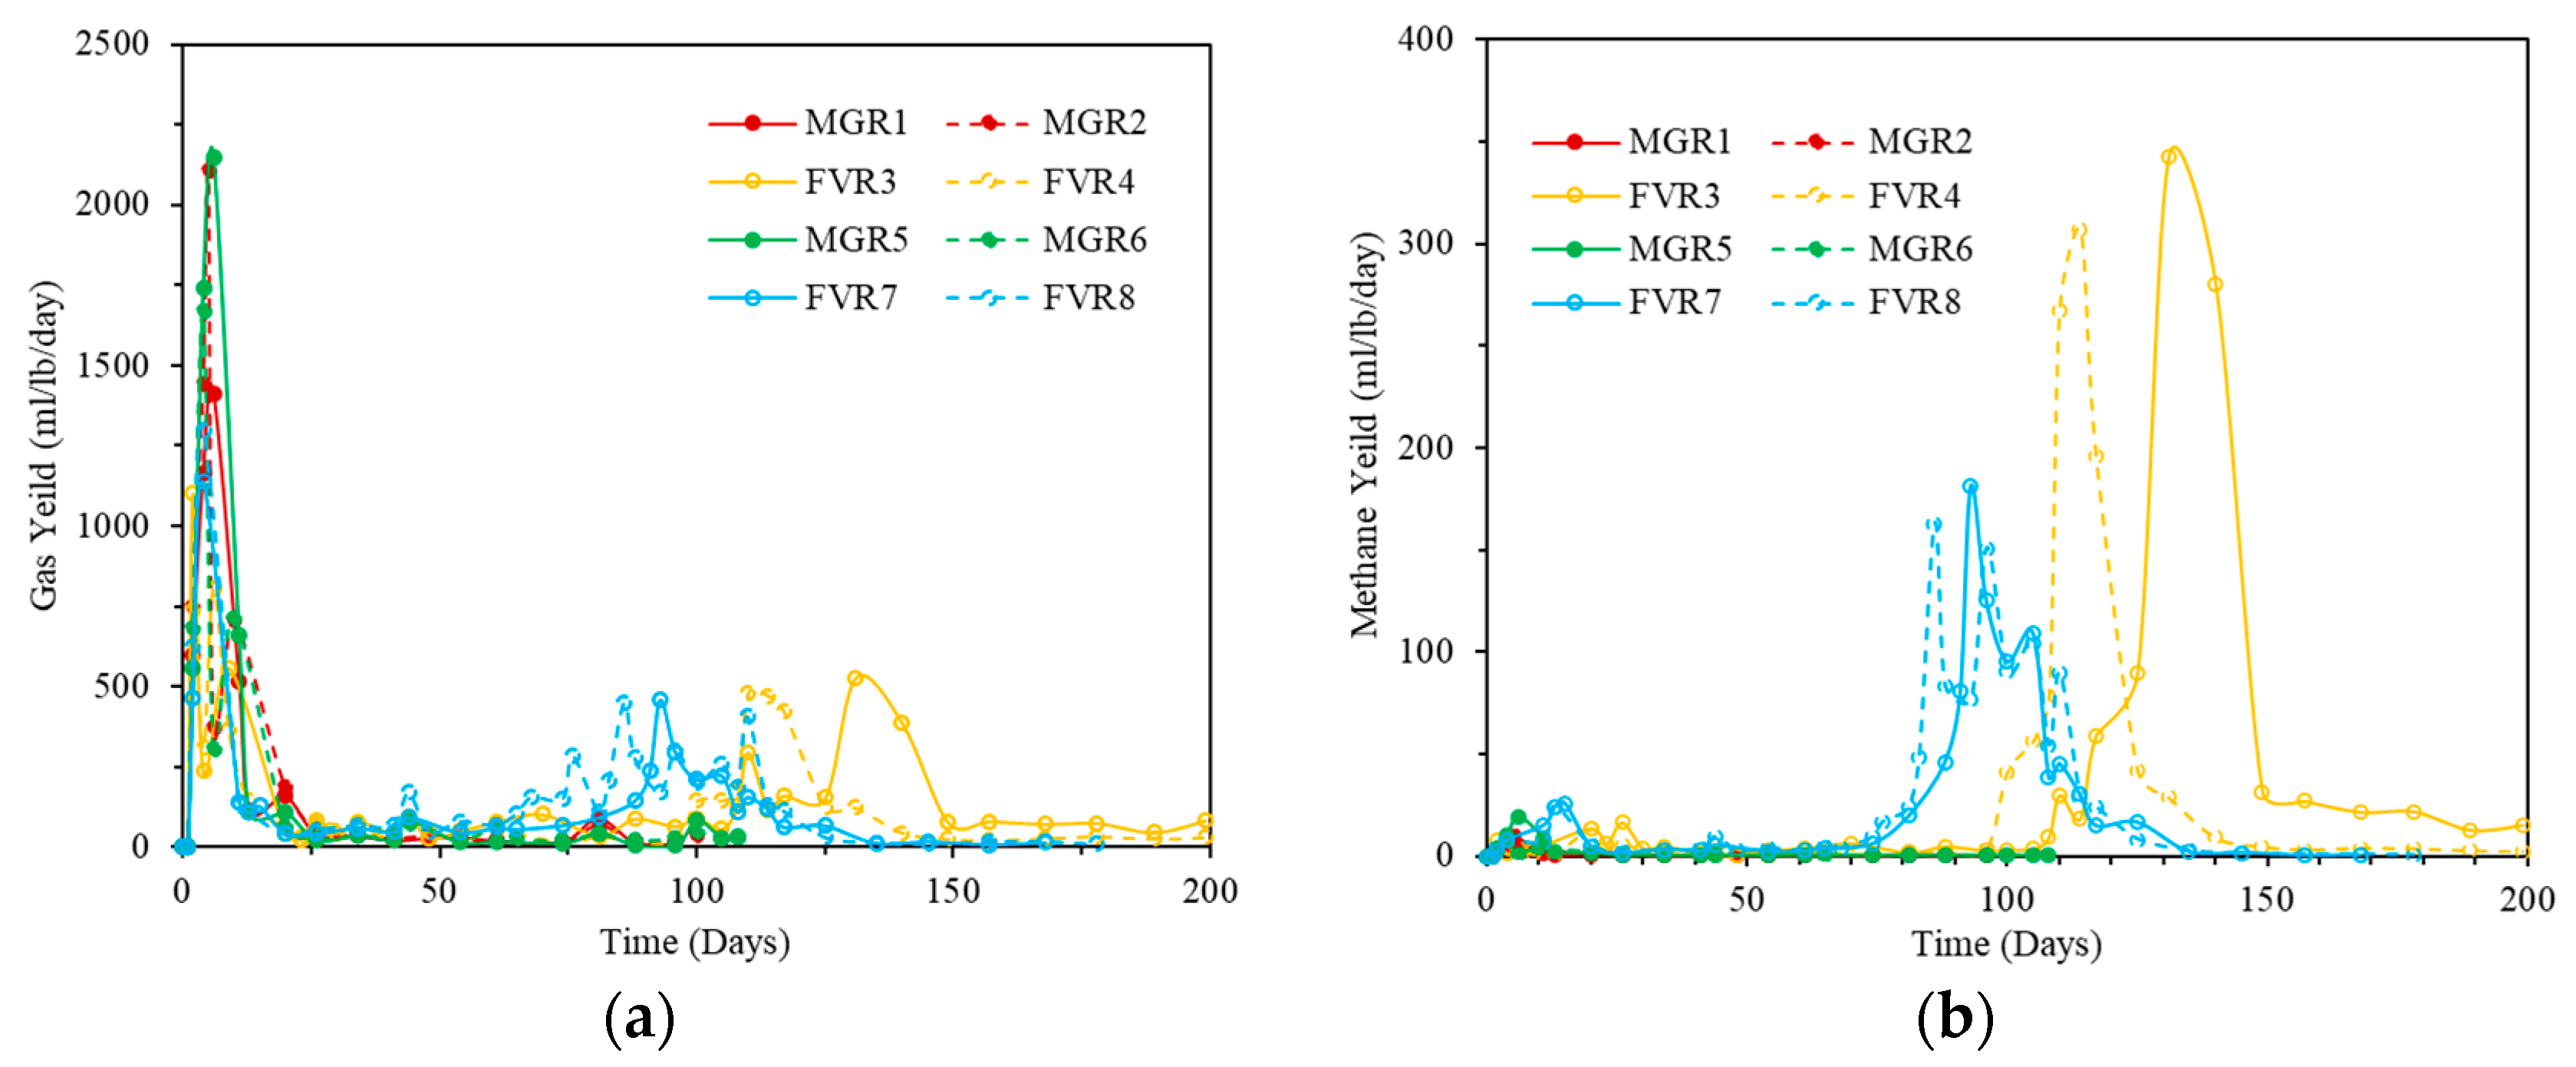
  • The reactors FVR7 and FVR8 started showing a good amount of methane generation from the fourth month, as well as the reactors FVR3 and FVR4, which did the same throughout the fifth month because their VFA reduced below 13 g/L. The maximum methane production was found in the reactors FVR3 and FVR4, at 6.7 L and 4 L of methane per pound of food waste, respectively.
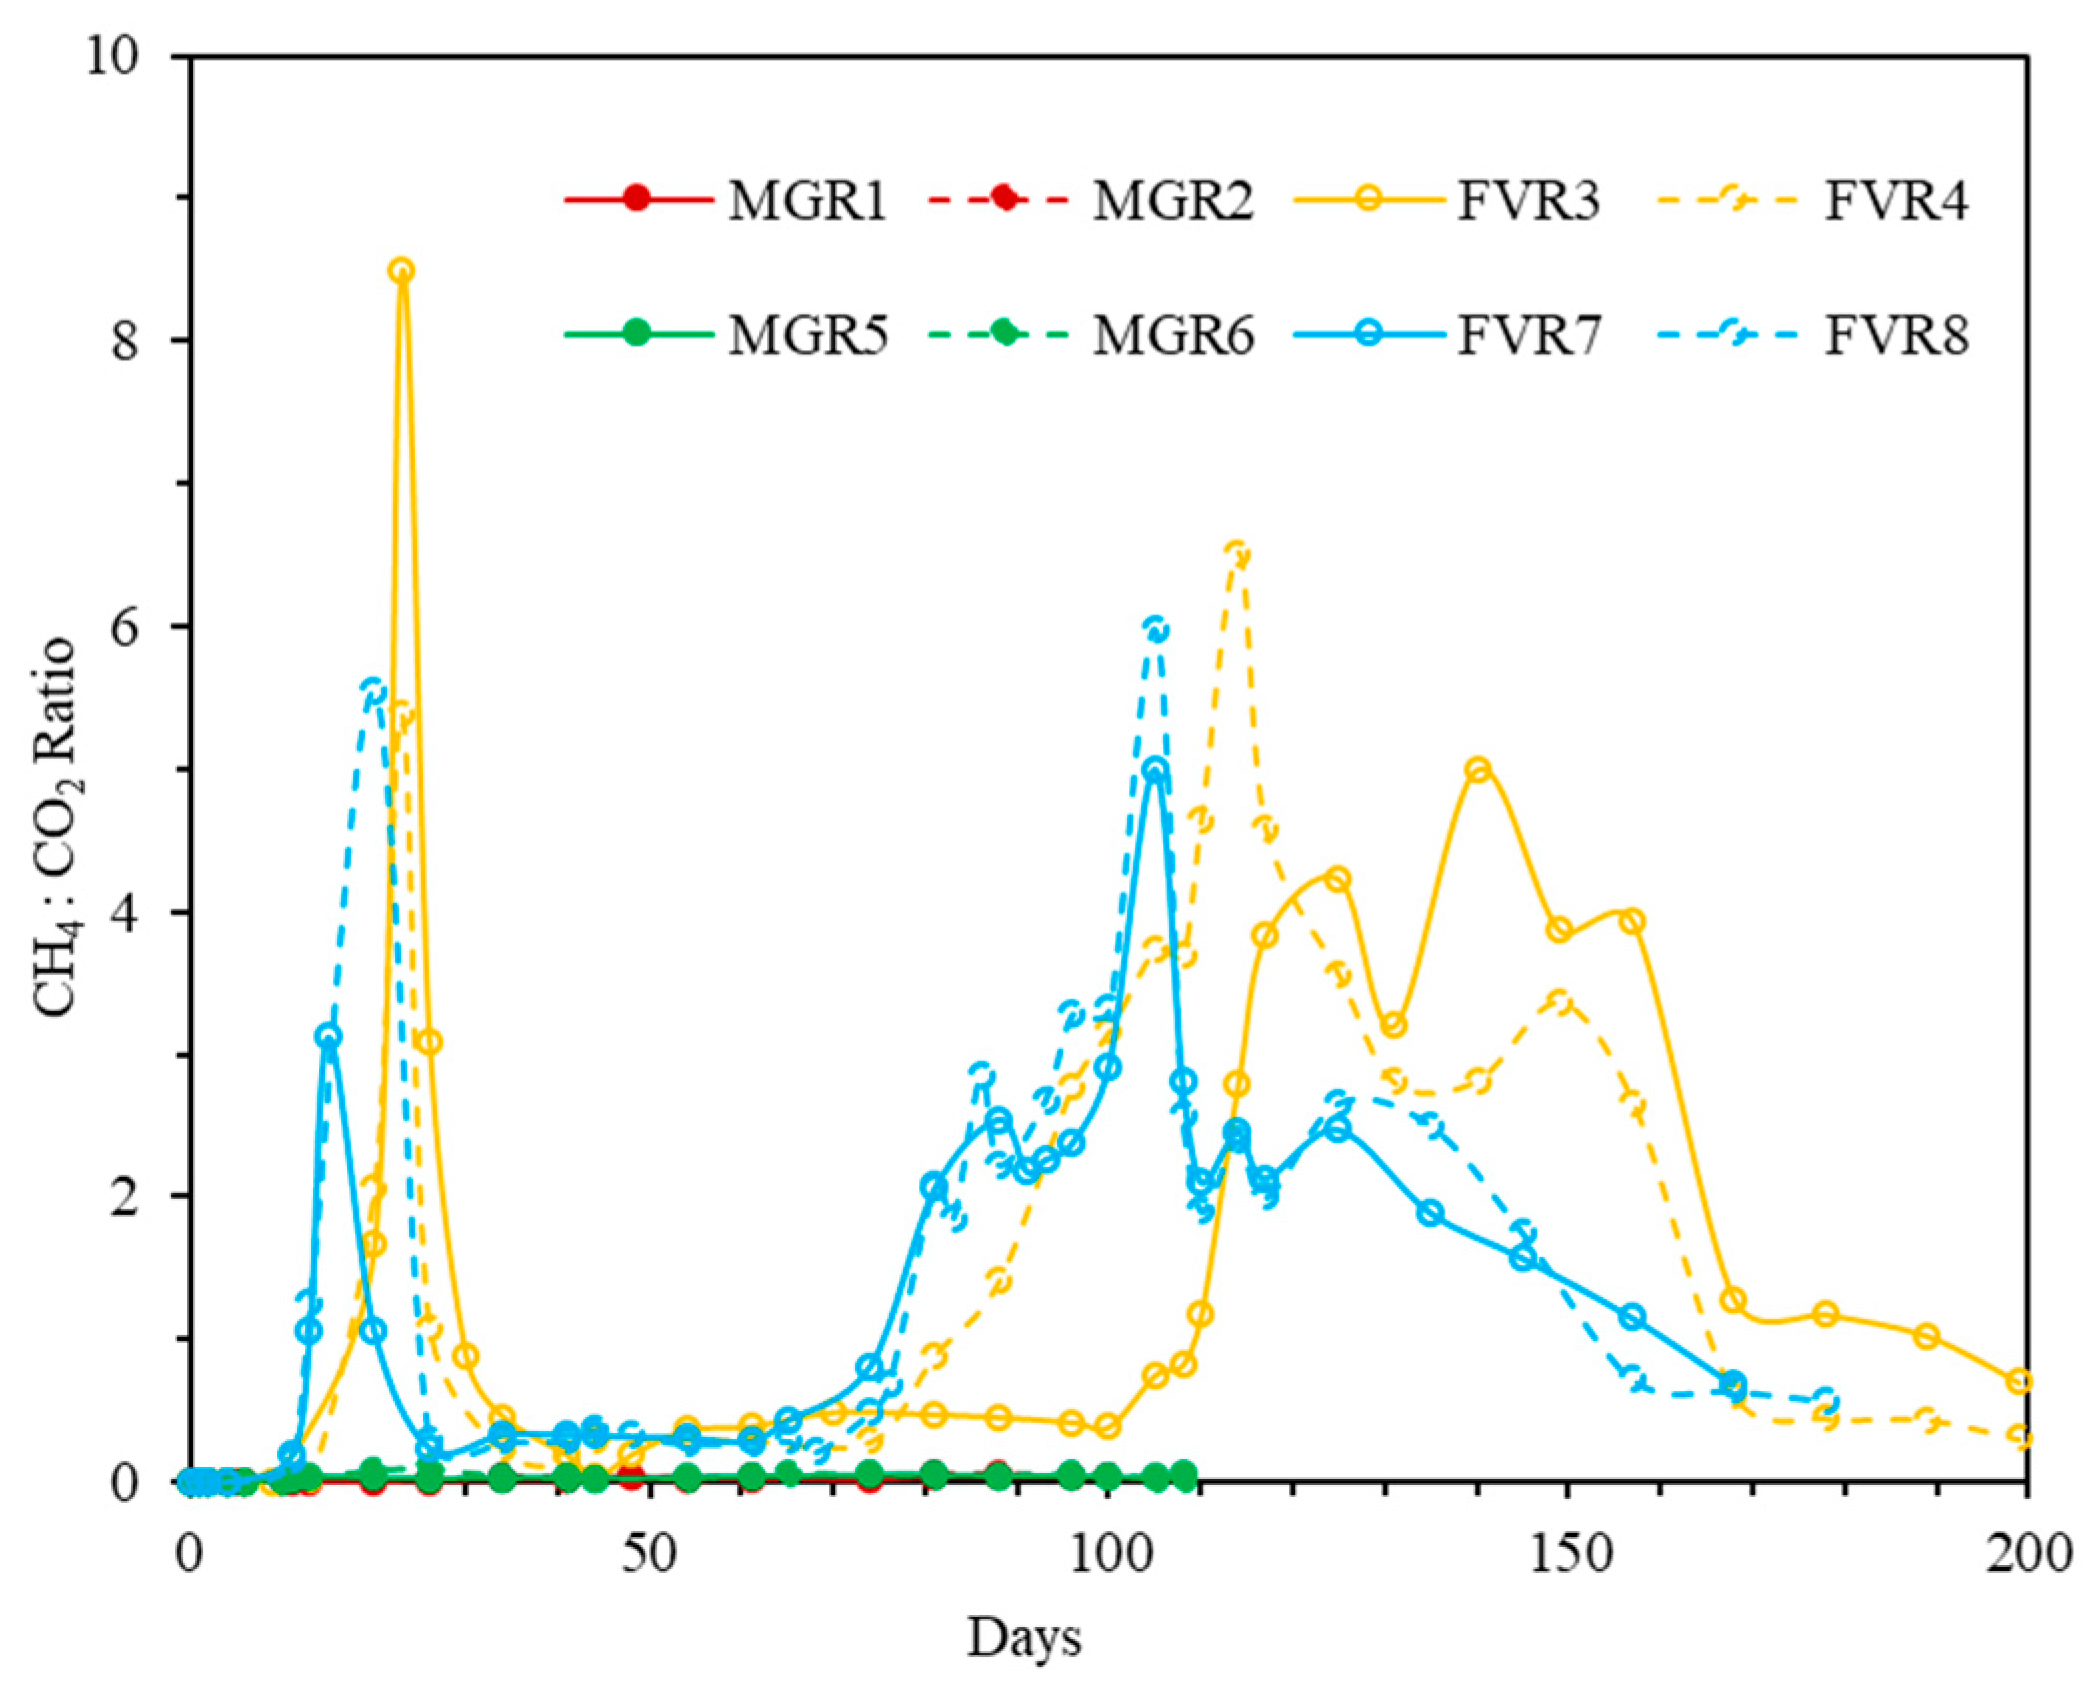
  • For the reactors FVR3 and FVR4, the CH4:CO2 ratios increased to as high as 8.5 and 6.6, respectively, and, for FVR7 and FVR8, they increased to 5 and 5.9, respectively. For the other reactors, the CH4:CO2 ratio did not increase, as they were in the lag phase. On the other hand, the concentration of oxygen depleted rapidly and remained negligible as the ADs were operated in anaerobic conditions.
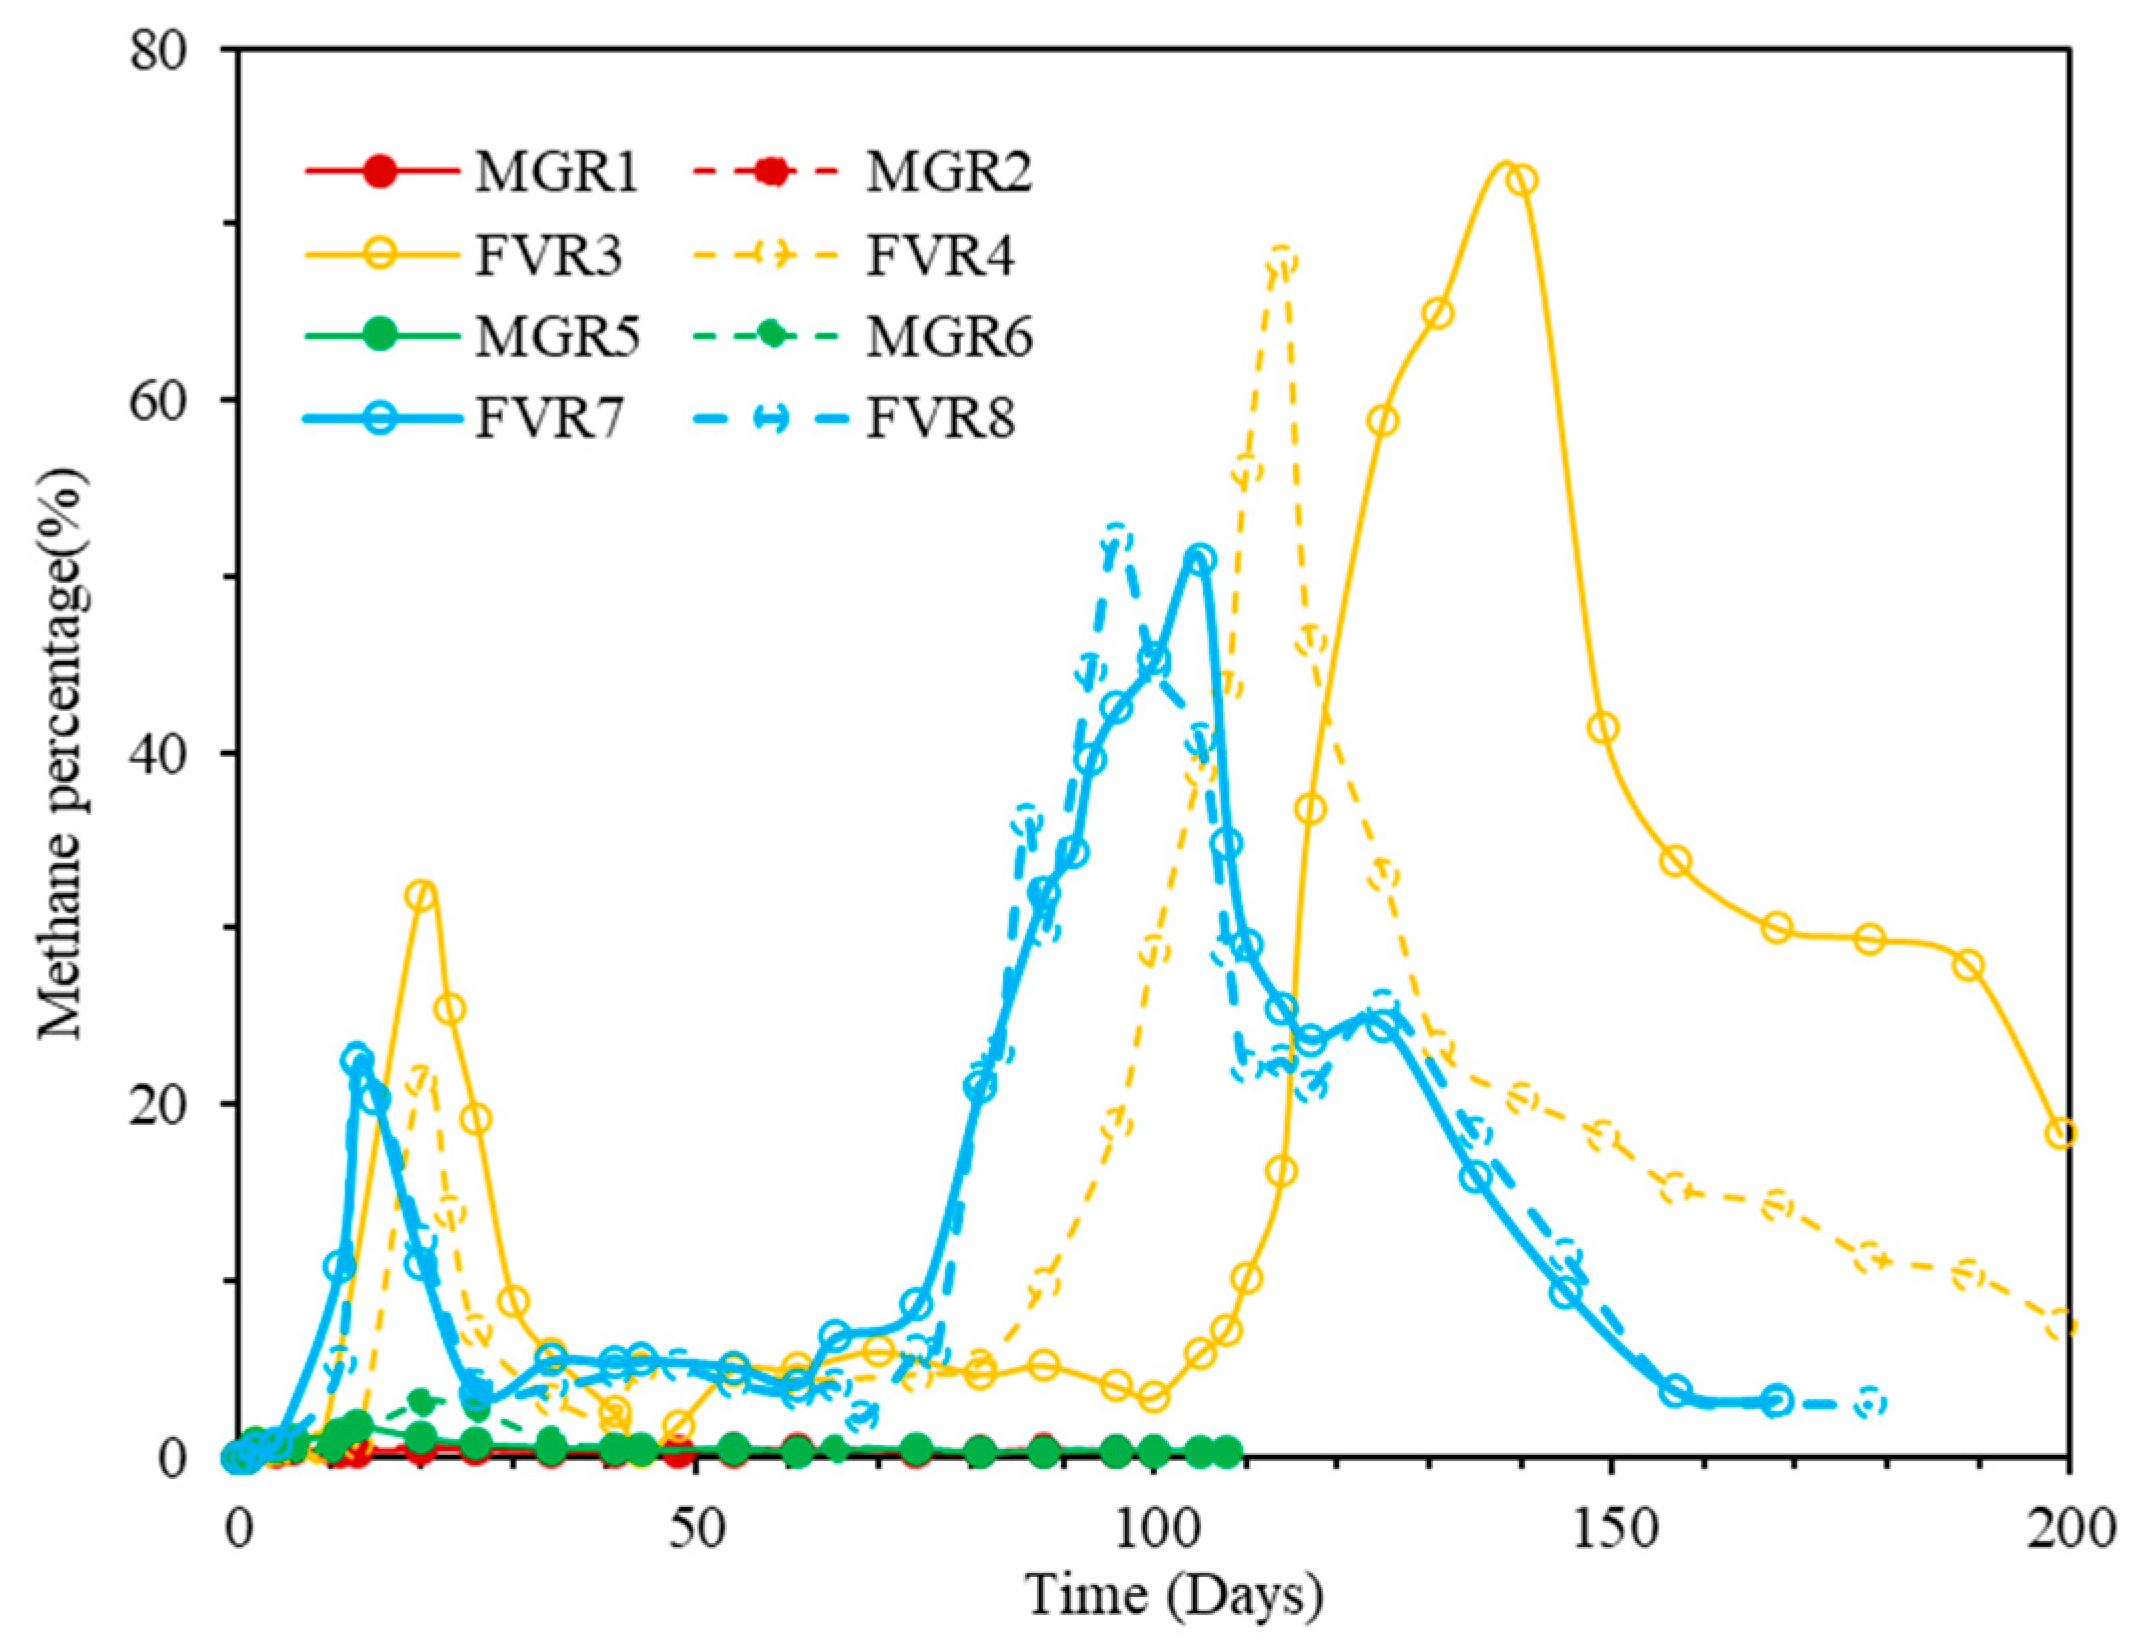
  • The initial gas generation rate was high for all of the reactors before they went into the lag phase. Only the reactors FVR3, FVR4, FVR7, and FVR8 crossed the lag phase and started producing considerable amounts of methane, as high as 72.5%, 68%, 52.1%, and 51% by composition, respectively.
Based on the obtained results, the use of sludge with fruit and vegetable waste might be advantageous compared to meat and grain waste for accelerated decomposition. The result of this parametric study will help decide on the combination of food waste and inoculum for future implementation of household-level ADs in developing countries. However, the results might differ from the present study since the types of food waste and sludge can vary significantly based on the location and collection methods.
Additional types of food waste combinations with different sludge percentages need to be studied in the future. As ADs with 30% sludge produced better results compared to ADs with 20% sludge, further studies can be done to determine the optimum percentage of sludge by varying their percentage in a broader range. Also, sludge having a higher pH value can be used in the future to observe whether it affects the VFA accumulation rate and time.

Author Contributions

Conceptualization, M.S.H. and M.B.L.; methodology, M.B.L. and M.S.H.; formal analysis and investigation, M.B.L. and M.A.I.; writing—original draft preparation, M.B.L. and M.A.I.; writing—review and editing, M.A.I. and S.S.A.; supervision, M.S.H. All authors have read and agreed to the published version of the manuscript.

Funding

This research received no external funding.

Institutional Review Board Statement

Not applicable.

Informed Consent Statement

Not applicable.

Data Availability Statement

The primary data, models, and code generated or presented in this study appear within the article. The detailed data are available on request from the corresponding author.

Acknowledgments

This study is a part of an MSc thesis entitled “Effect of Sludge Content on Different Types of Food Waste Degradation in Anaerobic Digester”, The University of Texas at Arlington.

Conflicts of Interest

The authors declare no conflict of interest.

References

  1. Food and Agriculture Organization (FAO). Global Food Losses And Food Waste—Extent, Causes, and Prevention; FAO: Rome, Italy, 2011. [Google Scholar]
  2. United States Environmental Protection Agency (US EPA). Municipal Solid Waste Generation, Recycling, And Disposal In The United States: Facts and Figures; United States Environmental Protection Agency: Washington, DC, USA, 2008. [Google Scholar]
  3. Aamir, M.; Ahmad, H.; Javaid, Q.; Hasan, S.M. Waste not, want not: A case study on food waste in restaurants of Lahore, Pakistan. J. Food Prod. Mark. 2018, 24, 591–610. [Google Scholar] [CrossRef]
  4. Price, A.L. Food Loss Waste in the United States Food Supply Chain: An Analysis of Its Functions, Oversight, and Recent Impacts from the Coronavirus Pandemic. DttP 2020, 48, 28. [Google Scholar] [CrossRef]
  5. Ferronato, N.; Torretta, V. Waste mismanagement in developing countries: A review of global issues. Int. J. Environ. Res. Public Health 2019, 16, 1060. [Google Scholar] [CrossRef] [PubMed]
  6. Liu, G.; Zhang, R.; El-Mashad, H.M.; Dong, R. Effect of feed to inoculum ratios on biogas yields of food and green wastes. Bioresour. Technol. 2009, 100, 5103–5108. [Google Scholar] [CrossRef] [PubMed]
  7. Vögeli, Y.; Lohri, C.R.; Gallardo, A.; Diener, S.; Zurbrügg, C. Anaerobic Digestion of Biowaste in Developing Countries; Eawag: Dübendorf, Switzerland, 2014. [Google Scholar]
  8. Al Seadi, T. Biogas Handbook; Syddansk Universitet: Odense, Denmark, 2008. [Google Scholar]
  9. Latif, M.B. Effect of Sludge Content on Different Types of Food Waste Degradation in Anaerobic Digester. Master’s Thesis, The University of Texas at Arlington, Arlington, TX, USA, 2021. [Google Scholar]
  10. World Health Organization. Air quality guidelines for Europe. In Copenhagen; World Health Organization Regional Office for Europe: København, Denmark, 2000. [Google Scholar]
  11. Bruce, N.; Perez-Padilla, R.; Albalak, R. Indoor air pollution in developing countries: A major environmental and public health challenge. Bull. World Health Organ. 2000, 78, 1078–1092. [Google Scholar] [PubMed]
  12. Behera, D.; Dash, S.; Malik, S.K. Blood carboxyhaemoglobin levels following acute exposure to smoke of biomass fuel. Indian J. Med. Res. 1988, 88, 522. [Google Scholar] [PubMed]
  13. Albalak, R. Cultural Practices and Exposure to Particulate Pollution from Indoor Biomass Cooking: Effects on Respiratory Health and Nutritional Status Among the Aymara Indians Of The Bolivian Highlands. Ph.D. Thesis, University of Michigan, Ann Arbor, MI, USA, 1997. [Google Scholar]
  14. Bujoczek, G.; Oleszkiewicz, J.A.; Danesh, S.; Sparling, R.R. Co-processing of organic fraction of municipal solid waste and primary sludge–stabilization and disinfection. Environ. Technol. 2002, 23, 227–241. [Google Scholar] [CrossRef] [PubMed]
  15. Ahn, Y.; Lee, W.; Kang, S.; Kim, S.H. Enhancement of sewage sludge digestion by co-digestion with food waste and swine waste. Waste Biomass Valoriz. 2020, 11, 2421–2430. [Google Scholar] [CrossRef]
  16. Angelidaki, I.; Alves, M.; Bolzonella, D.; Borzacconi, L.; Campos, J.L.; Guwy, A.J.; Van Lier, J.B. Defining the biomethane potential (BMP) of solid organic wastes and energy crops: A proposed protocol for batch assays. Water Sci. Technol. 2009, 59, 927–934. [Google Scholar] [CrossRef] [PubMed]
  17. DiLallo, R.; Albertson, O.E. Volatile acids by direct titration. Water Pollut. Control. Fed. 1961, 33, 356–365. [Google Scholar]
  18. Tchobanoglous, G.; Theisen, H.; Vigil, S. Integrated Solid Waste Management: Engineering Principles And Management Issues; McGraw-Hill, Inc.: New York, NY, USA, 1993. [Google Scholar]
  19. Karanjekar, R.V. An Improved Model for Predicting Methane Emissions from Landfills Based On Rainfall, Ambient Temperature, and Waste Composition. Ph.D. Thesis, University of Texas at Arlington, Arlington, TX, USA, 2013. [Google Scholar]
  20. Zaman, M.N.B. Effect of Manures on Food Waste Degradation in Biocell. Master’s Thesis, The University of Texas at Arlington, Arlington, TX, USA, 2016. [Google Scholar]
  21. Abu-Qudais, M.D.; Abu-Qdais, H.A. Energy content of municipal solid waste in Jordan and its potential utilization. Energy Convers. Manag. 2000, 41, 983–991. [Google Scholar] [CrossRef]
  22. Hossain, M.S.; Sivanesan, Y.S.; Samir, S.; Mikolajczyk, L. Effect of Saline Water on Decomposition and Landfill Gas Generation of Municipal Solid Waste. J. Hazard. Toxic Radioact. Waste 2014, 18, 04014002. [Google Scholar] [CrossRef]
  23. Wang, Y.S.; Odle, W.S.; Eleazer, W.E.; Bariaz, M.A. Methane potential of food waste and anaerobic toxicity of leachate produced during food waste decomposition. Waste Manag. Res. 1997, 15, 149–167. [Google Scholar] [CrossRef]
  24. Shao, L.; He, P.J.; Hua, Z.; Yu, X.; Li-Guo, J. Methanogenesis acceleration of fresh landfilled waste by micraeration. J. Environ. Sci. 2005, 17, 371–374. [Google Scholar]
  25. Ji, C.; Kong, C.X.; Mei, Z.L.; Li, J. A review of the anaerobic digestion of fruit and vegetable waste. Appl. Biochem. Biotechnol. 2017, 183, 906–922. [Google Scholar] [CrossRef] [PubMed]
  26. Vieitez, E.R.; Mosquera, J.; Ghosh, S. Kinetics of accelerated solid-state fermentation of organic-rich municipal solid waste. Water Sci. Technol. 2000, 41, 231–238. [Google Scholar] [CrossRef] [PubMed]
  27. Jiang, J.; Zhang, Y.; Li, K.; Wang, Q.; Gong, C.; Li, M. Volatile fatty acids production from food waste: Effects of pH, temperature, and organic loading rate. Bioresour. Technol. 2013, 143, 525–530. [Google Scholar] [CrossRef] [PubMed]
Figure 1. (a) Design of laboratory-simulated AD setup; (b) leak test of reactors; (c) finished AD inside the environmental growth chamber.
Sustainability 15 02782 g001
Figure 2. Flow chart of the experimental work program.
Sustainability 15 02782 g002
Figure 3. Comparison of food waste moisture content found in previous studies [18,19,20].
Sustainability 15 02782 g003
Figure 4. Comparison of volatile solids found for food waste with previous studies [19,20,21,22].
Sustainability 15 02782 g004
Figure 5. Change in pH over the time of the leachate collected.
Sustainability 15 02782 g005
Figure 6. Volume of leachate generated from the reactors.
Sustainability 15 02782 g006
Figure 7. Change in COD with time for the reactors.
Sustainability 15 02782 g007
Figure 8. Variation in VFA over time for all of the reactors.
Sustainability 15 02782 g008
Figure 9. Gas composition data for all AD: (a) MGR1; (b) MGR2; (c) FVR3; (d) FVR4; (e) MGR5; (f) MGR6; (g) FVR7; (h) FVR8.
Sustainability 15 02782 g009
Figure 10. Variation in methane to carbon dioxide ratio over time (days).
Sustainability 15 02782 g010
Figure 11. (a) Cumulative gas generated by reactors over time; (b) cumulative methane generation over time for all reactors.
Sustainability 15 02782 g011
Figure 12. Variation in methane percentages over time.
Sustainability 15 02782 g012
Figure 13. (a) Comparison of total gas generation rate over time; (b) comparison of methane generation rate over time.
Sustainability 15 02782 g013
Table 1. Waste combinations in laboratory-scale simulated bioreactors.
ReactorsFood WasteSludge
MGR1, MGR240% Meat + 40% Grain20%
FVR3, FVR440% Fruit + 40%Vegetable20%
MGR5, MGR635% Meat + 35% Grain30%
FVR7, FVR835% Fruit + 35%Vegetable30%
Table 2. Test results for sludge.
Name of the TestResult
pH7.21
Moisture Content98.36%
Volatile Solid86.2%
Disclaimer/Publisher’s Note: The statements, opinions and data contained in all publications are solely those of the individual author(s) and contributor(s) and not of MDPI and/or the editor(s). MDPI and/or the editor(s) disclaim responsibility for any injury to people or property resulting from any ideas, methods, instructions or products referred to in the content.

