1. Introduction
Aviation carbon neutrality is a relatively new topic. There are several methods of achieving the goal. Some of them require a significant technological change and may take decades to get into operation. However, we believe that it would be possible to change the impact of aviation on climate by focusing on contrail formation reduction.
There are two research questions which we are trying to answer. They focus on different aspects of contrail mitigation, but they can be answered with the same data that we obtained from a camera and ADS-B systems. The primary research question is to estimate what percentage of contrail coverage is made of persistent contrails with longer lifetime. The answer to this question will determine the future approach to contrail impact mitigation. The secondary research question is about the average flight level in Europe. The answer to this research question should suggest if there are any flight levels where contrails tend to occur with a higher frequency and probability, to show us how difficult it would be to mitigate the contrails. The idea behind this research question is that most aircraft fly at or near their maximal operational flight level, and therefore it might be difficult to find a suitable flight level to reduce contrails because any lower flight level than the maximal one will lead to increased fuel consumption.
A contrail is an artificial cloud composed of ice crystals usually formed behind jet aircraft in the upper troposphere and lower stratosphere, which initially looks like a white strip. It may dissipate very quickly, but it may also spread and persist for minutes or even a couple of hours. The formation is caused by increased relative humidity in the engine exhaust plume due to mixing of hot and moist exhaust gases with cool ambient air [
1]. Burning of kerosene, which is primarily composed of hydrocarbons, produces mainly carbon dioxide and water vapor. The reaction of complete combustion of any hydrocarbon is given by Equation (1).
The kerosene water vapor emission index, which expresses how many kilograms of water vapor are produced by combustion of one kilogram of kerosene, is 1.223. The consequence of the emission index is high content of water vapor in aircraft exhaust gases, which has a major impact on contrail formation. Besides water vapor and carbon dioxide, aircraft engines emit small amounts of nitrogen oxides, hydrocarbons, carbon monoxide, sulfuric oxides, some organic material, chemi-ions, soot and possibly small metal particles. Particle emissions play a secondary role in contrail formation [
1,
2].
If the temperature of ambient air is low enough, the moisture in the engine plume may cause water vapor supersaturation. In that case molecules of water tend to go from gaseous to liquid state (condensation) and solid state (deposition), respectively. Water vapor and ice crystal formation ensures achievement of an equilibrium state, which means that the air goes from the supersaturated back to the saturated state. The water vapor condenses mainly on ambient and exhaust aerosols called condensation nuclei, especially on soot particles which are present due to incomplete combustion. Because the ambient temperature is low, water droplets freeze and form icy crystals. These crystals then grow via deposition, if the humidity with respect to ice is above the saturation point [
1,
3].
According to the Schmidt–Appleman criterion [
4,
5], contrail forms if the humidity reaches liquid saturation. Saturation with respect to ice is not sufficient for contrail formation. When the air is supersaturated with respect to liquid water, the water vapor starts to condense. The Schmidt–Appleman criterion is met when the ambient temperature is below the threshold temperature:
where
is the liquid saturation partial pressure at temperature
,
is the relative humidity with respect to liquid water,
is the liquid water saturation partial pressure at temperature
,
is a parameter given by Equation (4) (see below) and
is the temperature given by the following equation:
where
is a parameter which represents the ratio between changes in water vapor pressure and temperature during mixing. It can be calculated as:
where
is the water vapor emission index,
is the ambient air pressure,
is the isobaric heat capacity of air (1004 J kg
−1 K
−1),
is the ratio of molecular weight of water vapor and air (0.622),
is the specific combustion heat (43.2 MJ kg
−1) and
is the overall efficiency. The overall efficiency is the ratio between the work rate and the amount of chemical energy:
where
is the thrust,
is the true air speed,
is the fuel mass flow rate and
is the specific combustion heat [
6].
To sum up, the threshold temperature which allows the contrail development process depends on the overall engine efficiency, which is also dependent on fuel consumption and on the state of the atmosphere in terms of relative humidity and ambient pressure. All other quantities may be considered constant. Ambient pressure and overall efficiency can be determined based on the data transmitted by aircraft. The temperature of ambient air, which is necessary for comparison with the threshold temperature, can be easily calculated too. The only unknown, but also necessary, quantity is the relative humidity. Since it is not possible to get the exact relative humidity at the specific location of the aircraft, we have selected a different approach to contrail formation assessment as described in the next section.
The substances (gases and particles) emitted by aircraft change greenhouse gas concentrations; they may trigger contrail formation, increase cirrus coverage and change other cloud properties, and hence they may contribute to climate change [
7]. The increase in cloud coverage has a negative impact on the climate because it changes the radiation balance of the Earth–atmosphere system. Contrails reflect part of the incoming solar (short-wave) radiation, which would otherwise warm the system, and trap part of the outgoing infrared (long-wave) radiation, which, on the contrary, cools the system [
8,
9]. The overall contrail impact on the radiation balance can be either positive or negative. It depends on several properties [
10] such as lifetime, optical thickness, daytime, contrail-background contrast etc. Contrails mainly affect the long-wave radiation, and therefore contrails and contrail-induced cloudiness mostly cause positive radiative forcing, which tends to warm the atmosphere [
11,
12]. The largest coverage of persistent contrails and contrail-induced cloudiness has been found in regions with high volume of air traffic, i.e., central Europe, east coast of the United States of America and east coast of Southeast Asia. This finding is consistent with those areas in which the highest contrail radiative forcing has been estimated [
13,
14,
15].
There are several studies focused on contrail avoidance strategies. The mitigation strategies include fuel additives and alternative fuels, technical measures and also operational measures [
16].
An alternative fuel for jet engines could be a cryogenic fuel, namely liquid hydrogen or methane. The use of these fuels increases frequency of contrail formation because engines powered by fuel with high hydrogen content emit much more water vapor mass. On the other hand, the climate impact of contrails might not be much different because of a cleaner exhaust. The contrails would also be optically thinner. Moreover, in the case of hydrogen, emissions would be carbon dioxide free [
17,
18].
Fuel additives could change the thermodynamic conditions necessary for contrail formation. They could make contrail formation more difficult than with standard kerosene. It might be possible that fuel additives act to hamper water uptake on the soot particles (with the help of certain coating of soot particles). Then, higher supersaturation for contrail formation would be required. However, it seems that fuel additives are not a viable mitigation option [
19].
From the technical point of view, a modification to the current design of jet engines has been suggested. One of the technical measures is a fan equipped with variable guide vanes. This system would temporarily increase exhaust gases temperature, and hence reduce the threshold temperature for contrail formation [
20]. Another technological option is a novel engine concept that would reduce the water vapor emission index. The exhaust air would be cooled with an additional heat exchange, so the water vapor could condense in this unit and subsequently be stored or poured away [
21].
Finally, it would be possible to use some operational measures. For example, one solution is shifting flight schedules to daylight hours because contrails formed during the night always cause positive radiative forcing [
22]. It would also be possible to fly constantly at lower altitudes where the probability of contrail formation is smaller [
23]. Another strategy, a better one, would be selective flight level change [
24] or even a 4D trajectory, which would combine changes in heading and altitude [
25,
26]. Aircraft would change their flight path (flight level and/or heading) only when flying through ice supersaturated air masses. To implement such a technique, it would be necessary to predict contrail formation based on ambient temperature and humidity at individual flight levels and locations. However, such meteorological data are not produced with the required precision and detail [
27].
In this paper, we illustrate that based on observation, most contrails have a very short lifetime. On the other hand, the small percentage of persistent or long-lived contrails have a similar coverage of skies as the high percentage of short-lived contrails. Therefore, it would be possible to achieve a significant reduction in the effect of contrails just by focusing on the small percentage of persistent contrails. There is no need for a global change in operational procedures, and only locally targeted changes can achieve a significant improvement. Because the most logical way to avoid contrails is a change in flight level (FL), we focused on statistics of the most used flight levels in defined areas to determine if an operational change in used flight levels may be applied. From an air traffic management (ATM) point of view, it is impossible to decrease flight levels globally because it would mean increased fuel consumption. Therefore, the net output of such a change would be negative rather than positive.
2. Materials and Methods
To answer the two main research questions that are the subject of this work, we have collected and processed data regarding contrails, their properties, and aircraft which caused contrail formation. We used two main sources to collect the necessary data—a camera system for contrail observation and measurement, and 1090 MHz receivers to obtain flight data in the form of SSR (Secondary Surveillance Radar) transponder Mode S messages.
The method we used can be divided into three basic steps: the first step is contrail observation; the next one is flight data processing; and the last one is contrail-aircraft pairing.
2.1. Contrail Observation
For the purpose of contrail observation, we have chosen a ground-based system consisting of three common video cameras pointing up to the sky and allowing individual contrails measurement. The cameras have been installed on the top of the CTU (Czech Technical University in Prague) building in the city of Děčín, located in the northwest part of the Czech Republic. The coordinates of the system position are 50°46′44.364″ N 014°12′57.672″ E. The devices were installed in this place due to the advantageous position far from areas where aircraft climb or descend. Hence, most of the flights cruise over this location at the cruise flight level, and for its position in the proximity of several ATS (Air Traffic Service) routes. However, since February 2021, Czech airspace has become a free route airspace from FL 95 to FL 660. Therefore, nowadays there are no ATS routes above the cameras. Nevertheless, it is still possible to measure contrails in the monitored area. Because of this change, we were also able to validate that there was no significant change in the average flight level following the free route airspace implementation.
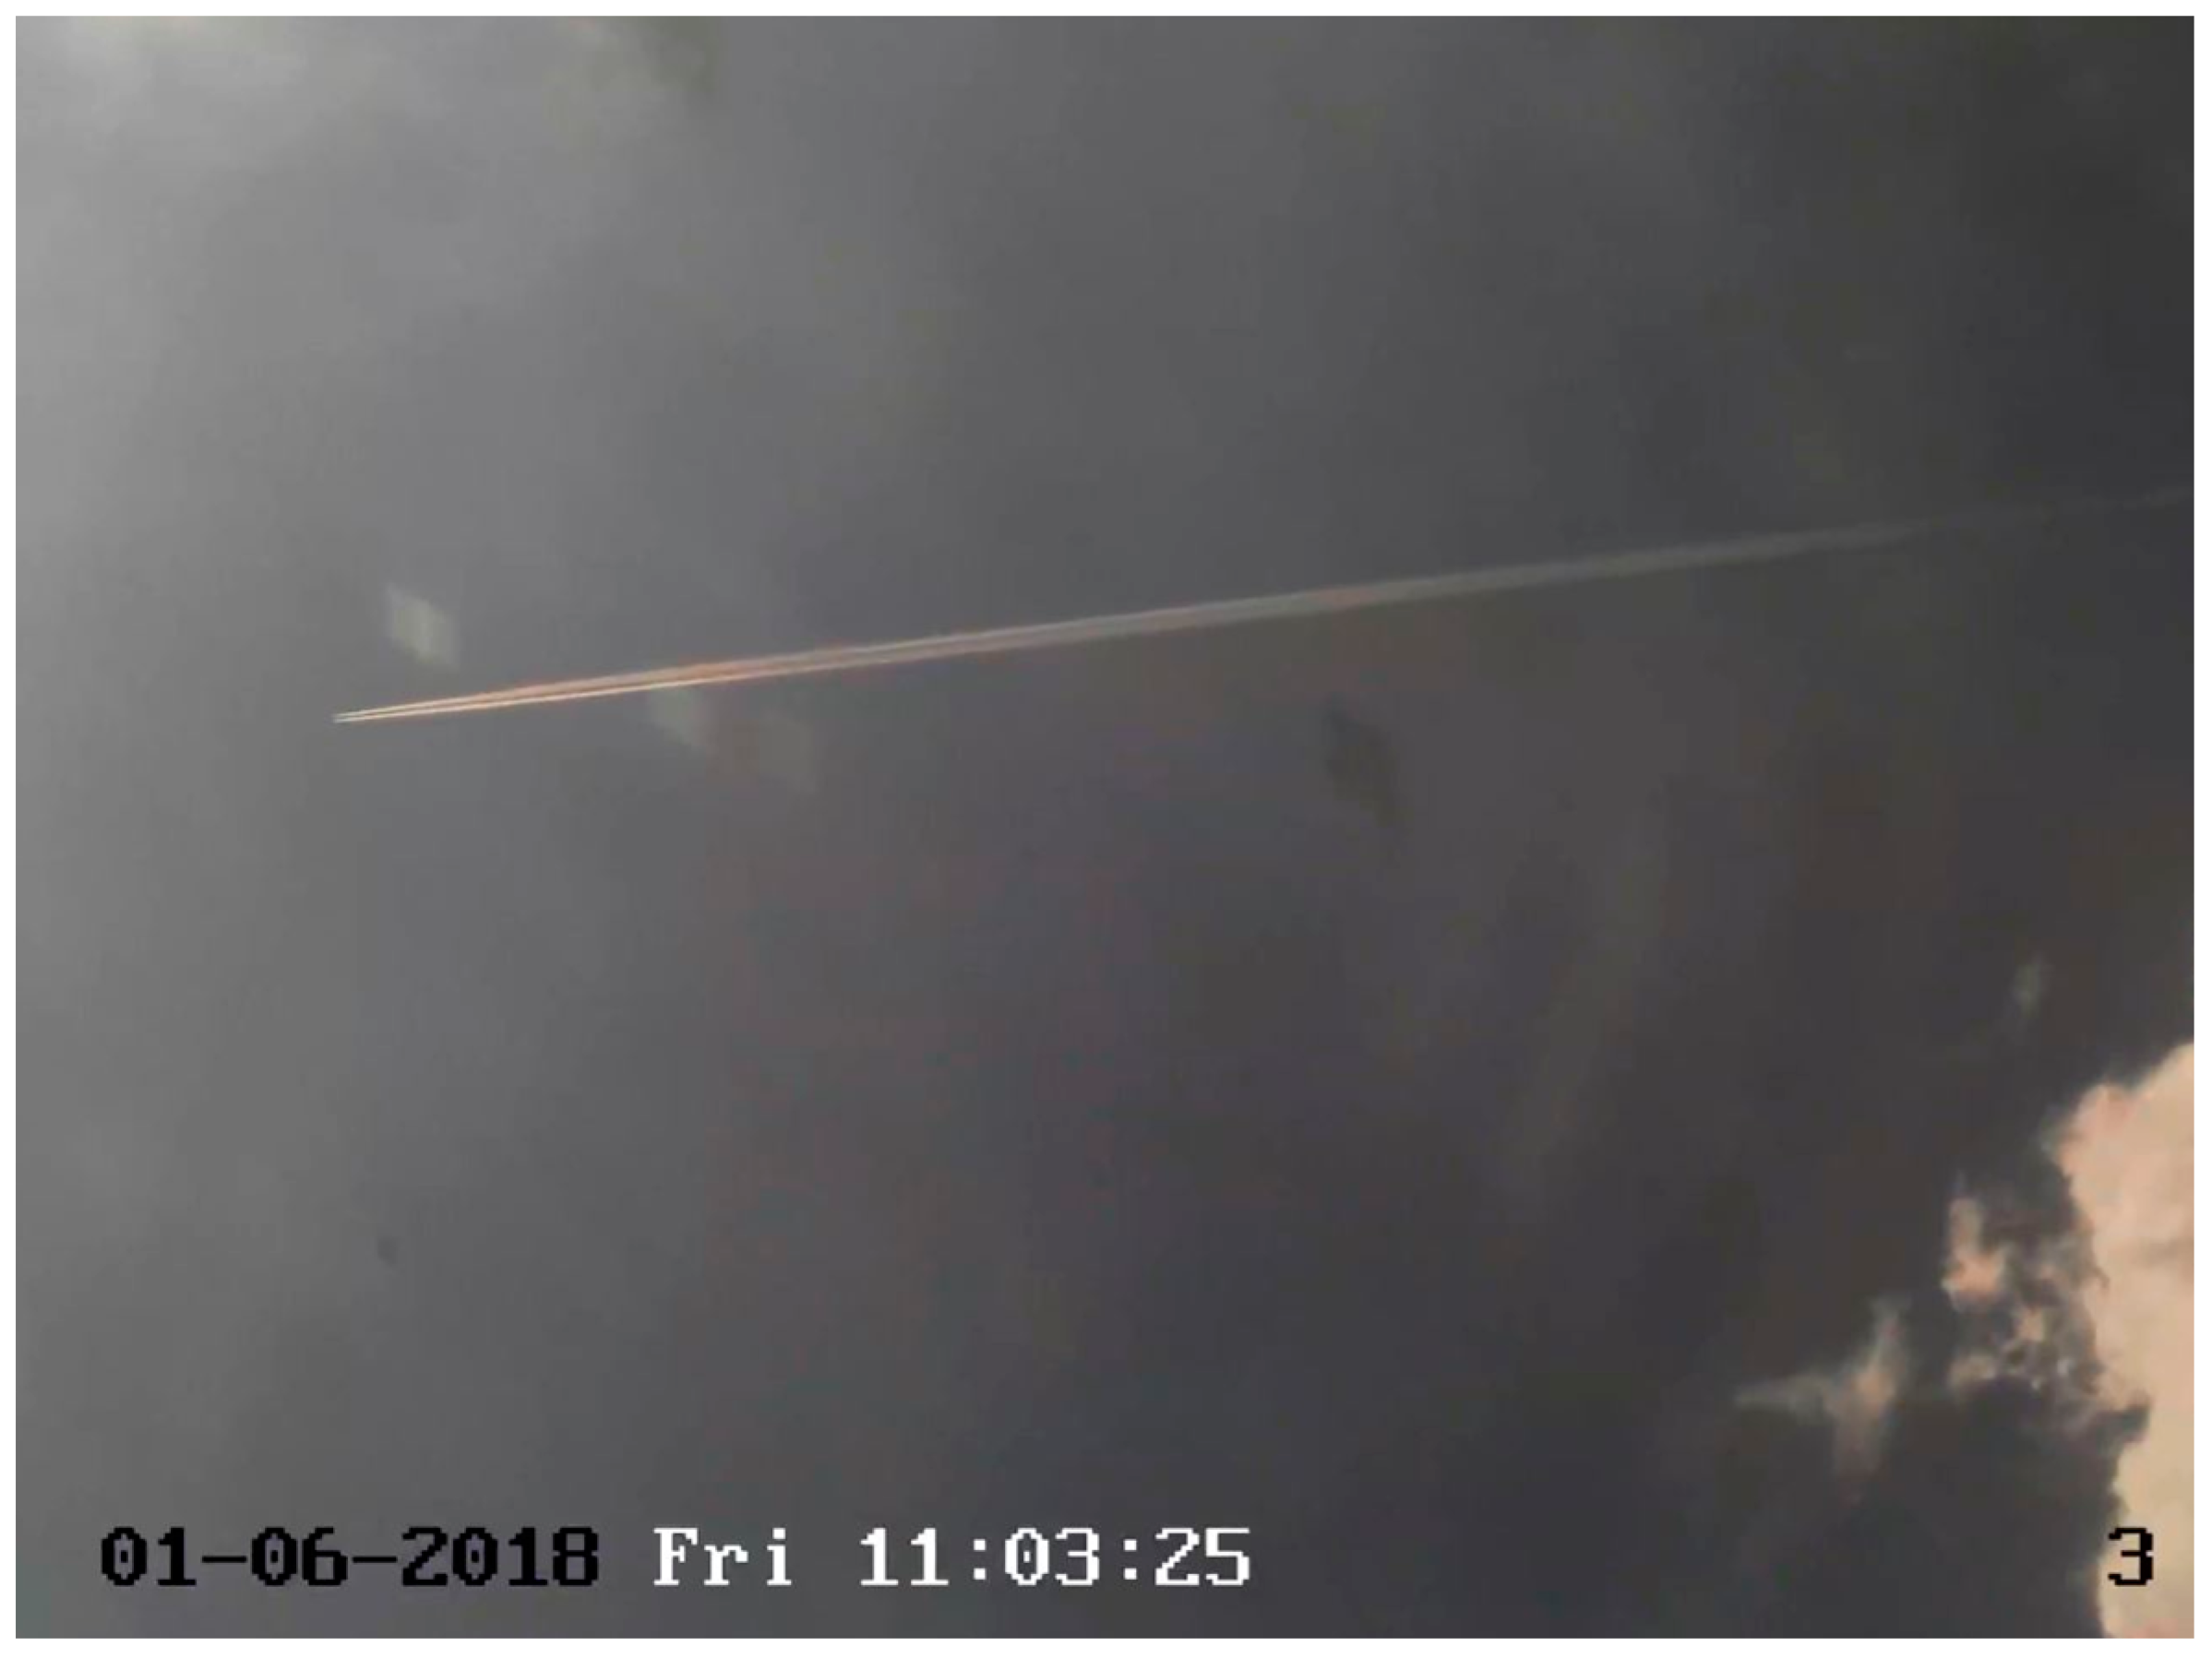
The camera system automatically records and saves videos daily from 04:15 UTC until 16:00 UTC. The saved records are then filtered and analyzed. Videos taken during cloudy days are not processed further, because contrails formed during such days are not observable in the visible spectrum as they are formed above the natural cloudiness which covers them. Suitable days for contrail observation are days with clear skies. Each discovered contrail (see
Figure 1) is tracked down, together with the time of contrail formation, contrail lifetime, and eventually a note when contrail dissipation cannot be observed; in other words, when it is not possible to measure the exact contrail lifetime. This happens when a contrail, usually a long-lived one, is covered by natural cloudiness or drifted by the wind out of the picture. All records are time-stamped. The cone of visibility of all cameras combined covers about 50 percent of the sky over the camera position. We have recordings of more than 10,000 flights between 2017 and 2021. However, this paper’s results are based on a set of 1778 recordings.
2.2. Flight Data Processing
The next step consists of curation, filtering, and decoding of flight data obtained to add detailed information about the aircraft that flew through the monitored airspace and behind which a contrail was observed, and for flight level usage assessment. Mode S messages received by four Radarcape receivers operated by the Czech Technical University in Prague were used as a source of flight data. These devices can receive any data transmitted on 1090 MHz frequency in their range, i.e., they provide ADS-B (Automatic Dependent Surveillance-Broadcast) messages and other replies to the interrogation of Mode S SSR. According to the Commission (EU) implementing regulation [
28], ADS-B equipment is compulsory for IFR flights in FIR Praha. ADS-B is a surveillance technology which provides real-time aircraft positions based on GNSS (Global Navigation Satellite System) and other information such as the ground speed and callsign. These data are automatically broadcast by aircraft (without any interrogation), so other aircraft equipped with an ADS-B In system or ground stations in its range can receive the data, enabling the aircraft to be tracked [
29]. The carriage and operation of Mode S transponders with EHS (Enhanced Surveillance) functionality are mandatory in FIR Praha for fixed-wing aircraft operating IFR flights with a maximum approved take-off mass exceeding 5700 kg, or with a maximum true airspeed exceeding 250 kt [
30].
The receivers are located in the region of Prague, and their range is approximately 200 nautical miles. The data are collected via an Ethernet interface and saved into twenty-minute datasets containing all Mode S messages received by Radarcape receivers. The datasets include system time, receiver identification, hexadecimal time stamp, and hexadecimal message with a size of 112 bits. The message may contain different information depending on the type of message in the sense of ADS-B message or reply to Mode S EHS addressed surveillance. Of course, the aircraft must be equipped with an appropriate Mode S transponder with EHS and ADS-B 1090 MHz extended squitter, as mentioned above [
31,
32].
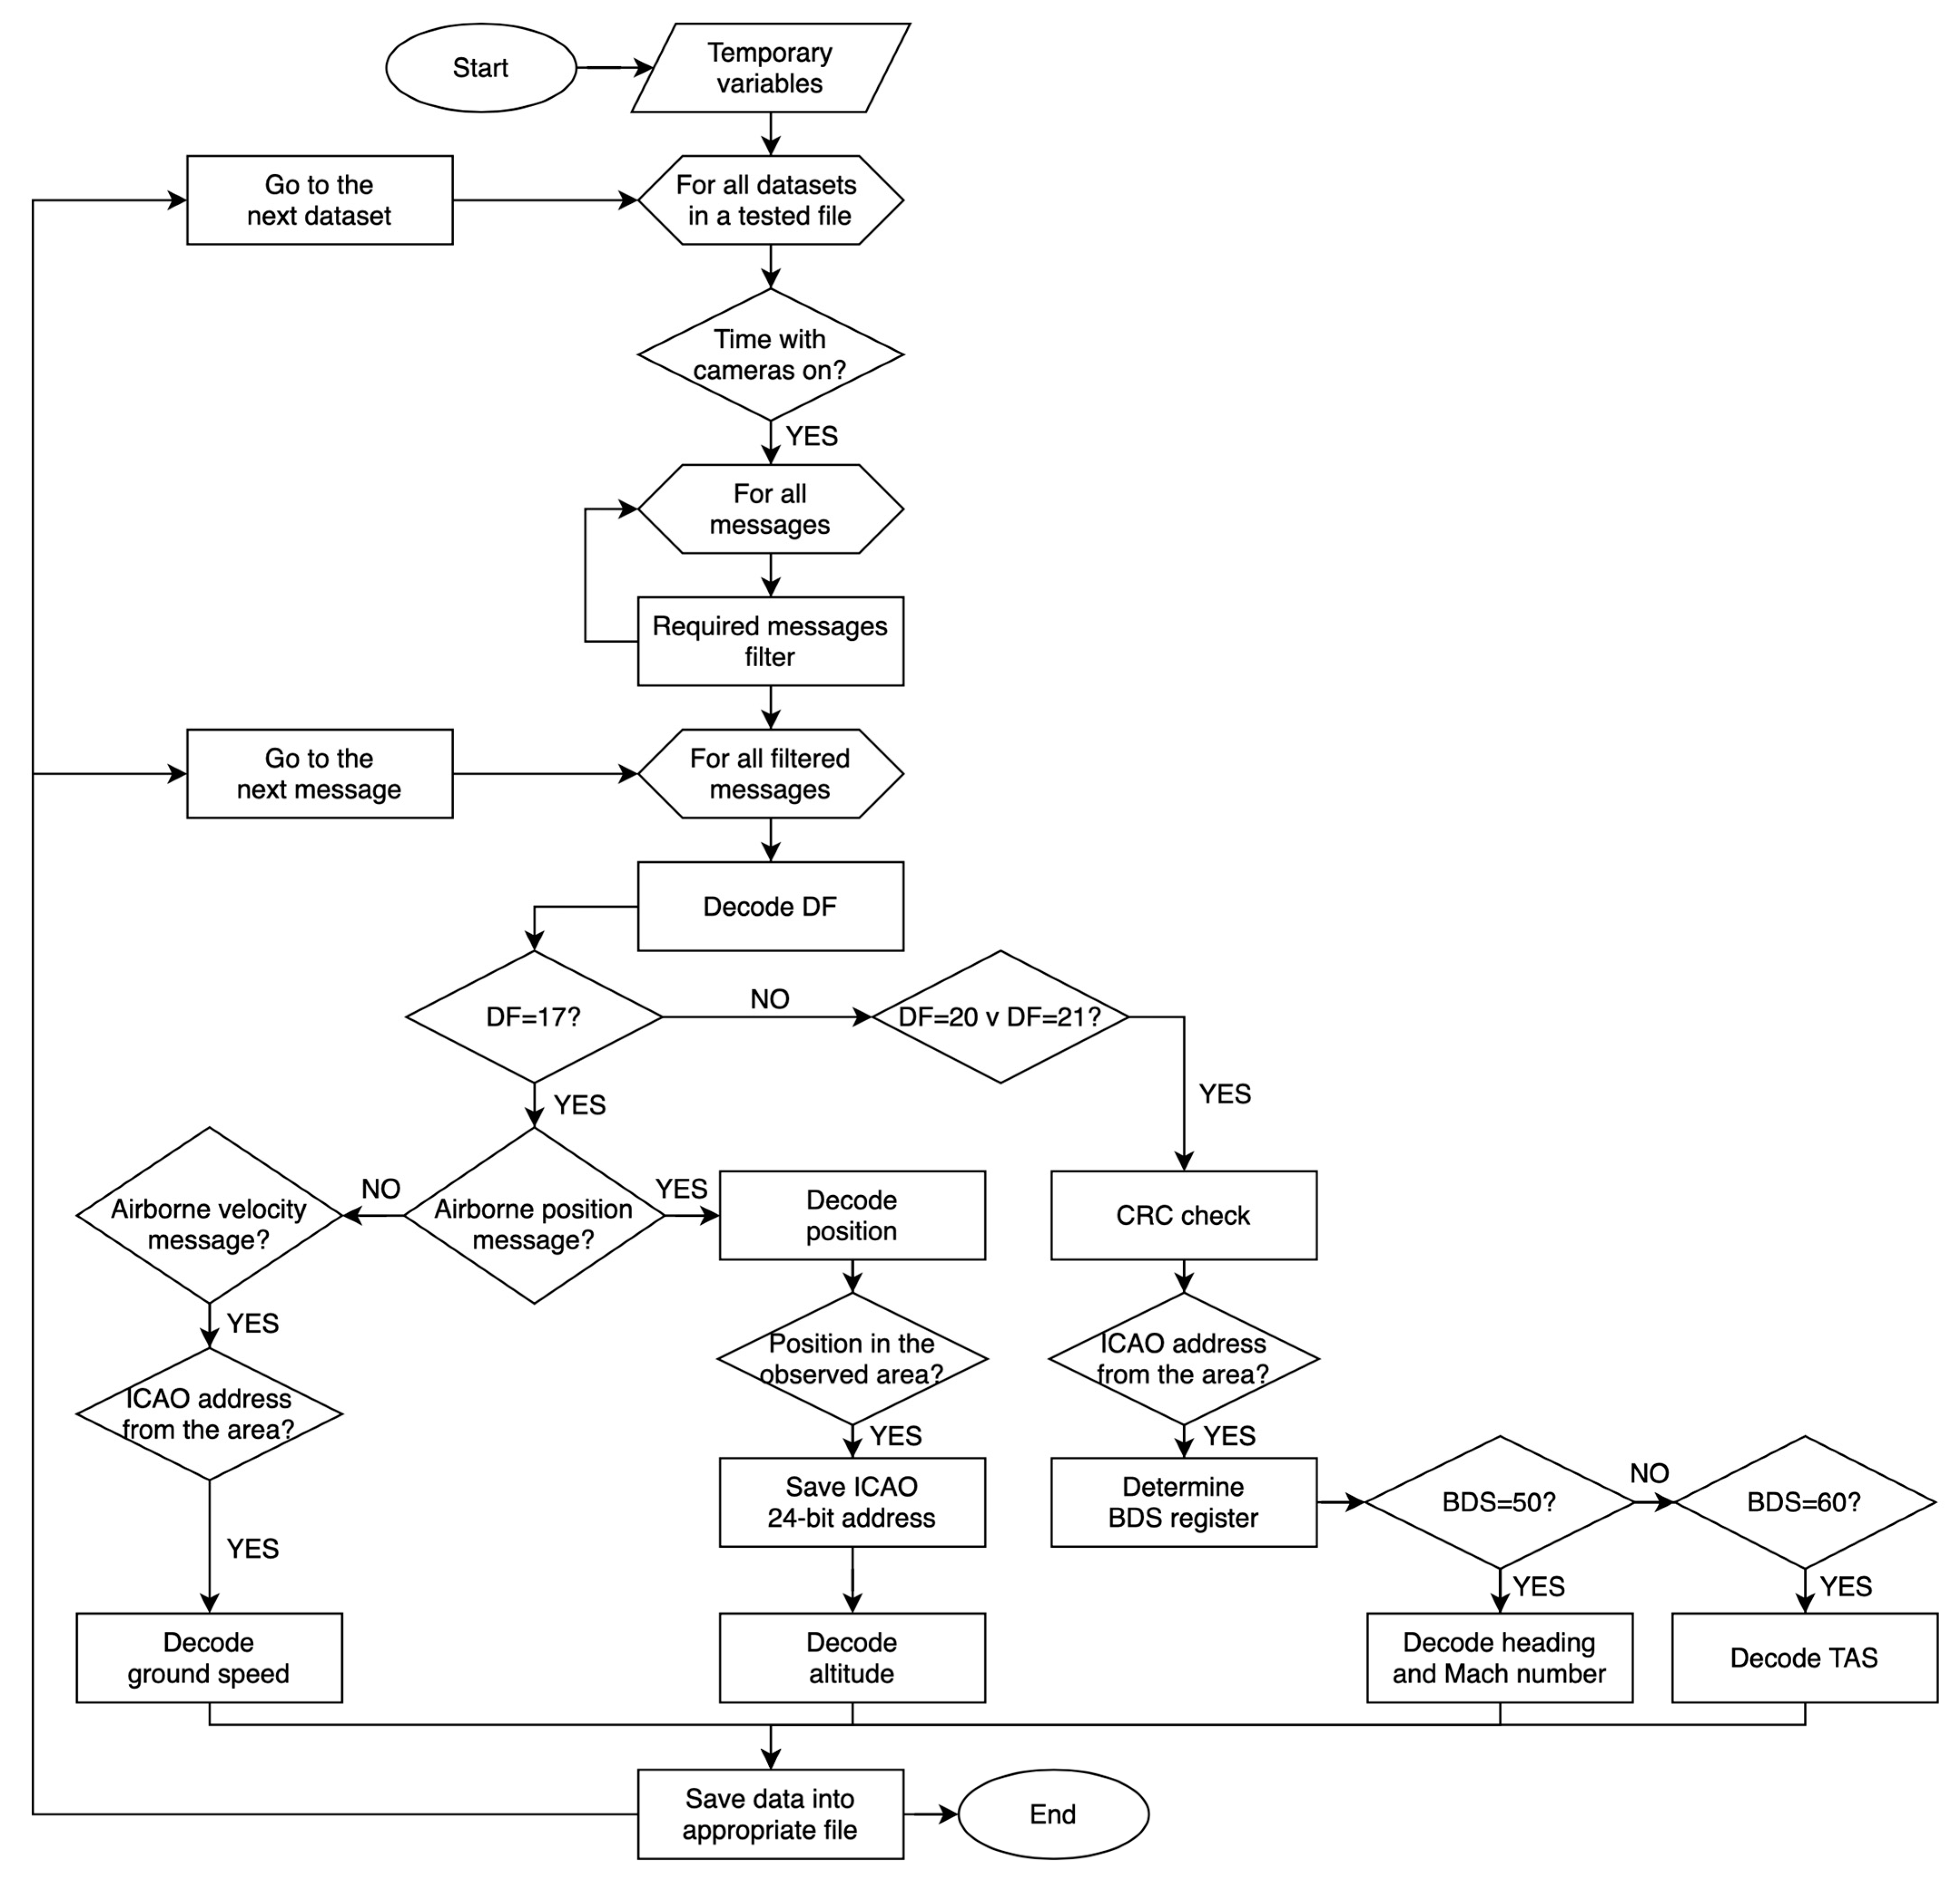
To assign flight data to the aircraft behind which a contrail was observed in the previous step, and to present statistics about the frequency of contrail occurrence concerning the most commonly used flight levels, we have created a MATLAB script suitable for processing the datasets mentioned above. The script can automatically filter received data in the form of ADS-B, and EHS BDS (Comm-B Data Selector) registers and decode relevant information (e.g., coordinates, altitude, speed) for a given period of time. The flowchart of the created script is shown in
Figure 2.
Data received during the period when the camera system is turned off are automatically skipped. Since the range of used receivers covers a larger area than the monitored part of the airspace, it is necessary to filter the data according to the aircraft position. For this purpose, the script uses aircraft coordinates obtained from ADS-B messages. To reduce the number of messages that must be examined and to get only information relevant to our research, the script chooses only data with a specific DF (downlink format). It decodes data with DF 17 to obtain the latitude, longitude, altitude, and ground speed from ADS-B, and data with DF 20 and DF 21 to obtain the heading and Mach number from BDS register 5,0 (Track and turn report) and true airspeed from BDS register 6,0 (Heading and speed report). The script uses a 24-bit ICAO (International Civil Aviation Organization) aircraft address as a unique identifier, ensuring that all relevant information received from one aircraft during the period when this aircraft was flying through the monitored part of airspace is decoded and saved into the appropriate file [
32,
33].
2.3. Contrail-Aircraft Pairing
The last step is contrail-aircraft pairing, connecting the observed contrails from the first step with the filtered and decoded flight data from step two. A database of observed and measured contrails was created for further contrail analysis. Each record is related to one specific contrail, i.e., to one aircraft which flew through the monitored airspace and caused a contrail. It includes the following values: date and time of contrail formation, contrail lifetime, 24-bit ICAO aircraft address, coordinates, heading, altitude, true airspeed, and Mach number.
The pairing process is primarily based on comparing aircraft (or rather contrail) observation time and time of aircraft entry into the monitored area according to the filtered and decoded ADS-B messages. In the case of multiple simultaneous aircraft in the area, contrail direction in the video record compared to the position and heading of each aircraft taken from Mode S messages is considered. The aim is to have enough measured contrails paired with flight data to examine contrail occurrence at an individual contrail/flight level.
3. Results
3.1. Contrail Occurrence
The set of data used in this article for contrail occurrence assessment contains video recordings and Mode S messages from 68 days. A total of 1778 contrails were observed on these randomly selected days: 2 September 2018–12 September 2018, 14 September 2018–16 September 2018, 19 September 2018–22 September 2018, 25 September 2018–30 September 2018, 11 October 2018–14 October 2018, 18 October 2018, 20 October 2018–21 October 2018, 4 February 2019–5 February 2019, 19 March 2019–23 March 2019, 25 March 2019–26 March 2019, 6 November 2019–7 November 2019, 14 November 2019, 16 November 2019, 29 November 2019, 4 December 2019, 6 December 2019, 10 December 2019–11 December 2019, 1 January 2020–2 January 2020, 5 January 2020, 12 January 2020, 16 January 2020–17 January 2020, 21 January 2020, 30 January 2020–31 January 2020, 23 March 2020−24 March 2020, 1 July 2020, 4 July 2020, 7 July 2020, 13 July 2020–14 July 2020, 19 July 2020, 21 July 2020, and 27 July 2020.
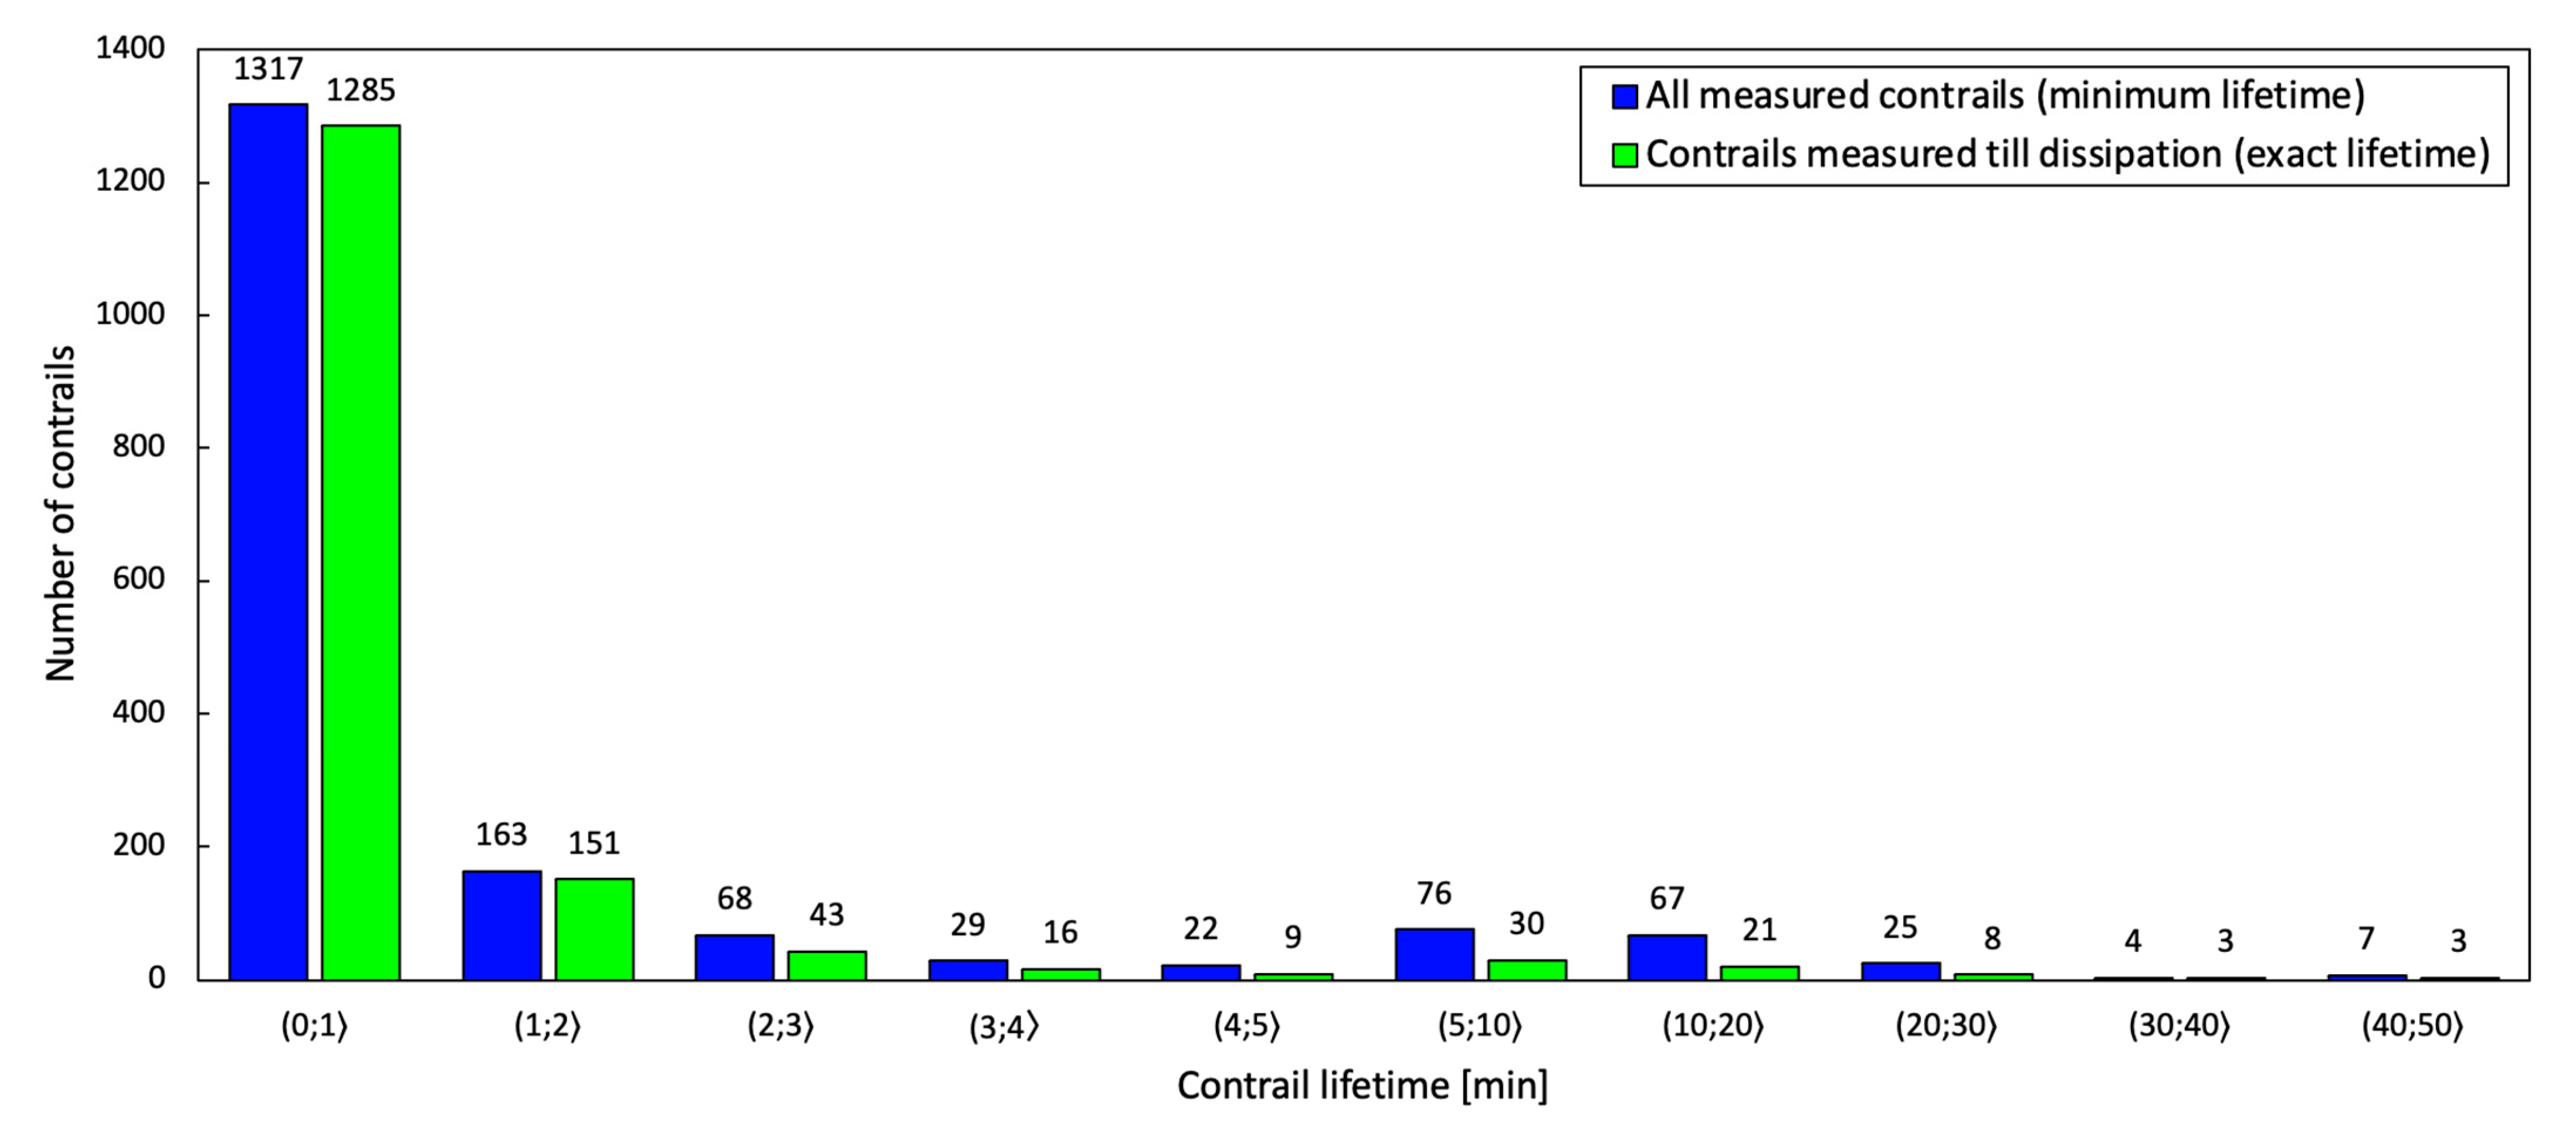
Out of the total number of 1778 contrails, 1569 were measured until their dissipation. For the remaining 209, we could not see the contrail’s disappearance, either because the contrail was obscured by cloud or because it drifted from the camera cone of view because of wind. In other words, in 1569 cases, we know the exact contrail lifetime. In the remaining cases, we know only a minimum contrail lifetime because we could not see these contrails until their dissipation due to the reasons mentioned above.
As displayed in
Figure 3, most of the measured contrails were short-lived. We could detect that 82% of contrails, measured until their disappearance, had a lifetime of less than or equal to one minute. The lifetime of the remaining contrails ranged from minutes to tens of minutes. Almost 26% of all observed contrails had a lifetime longer than one minute.
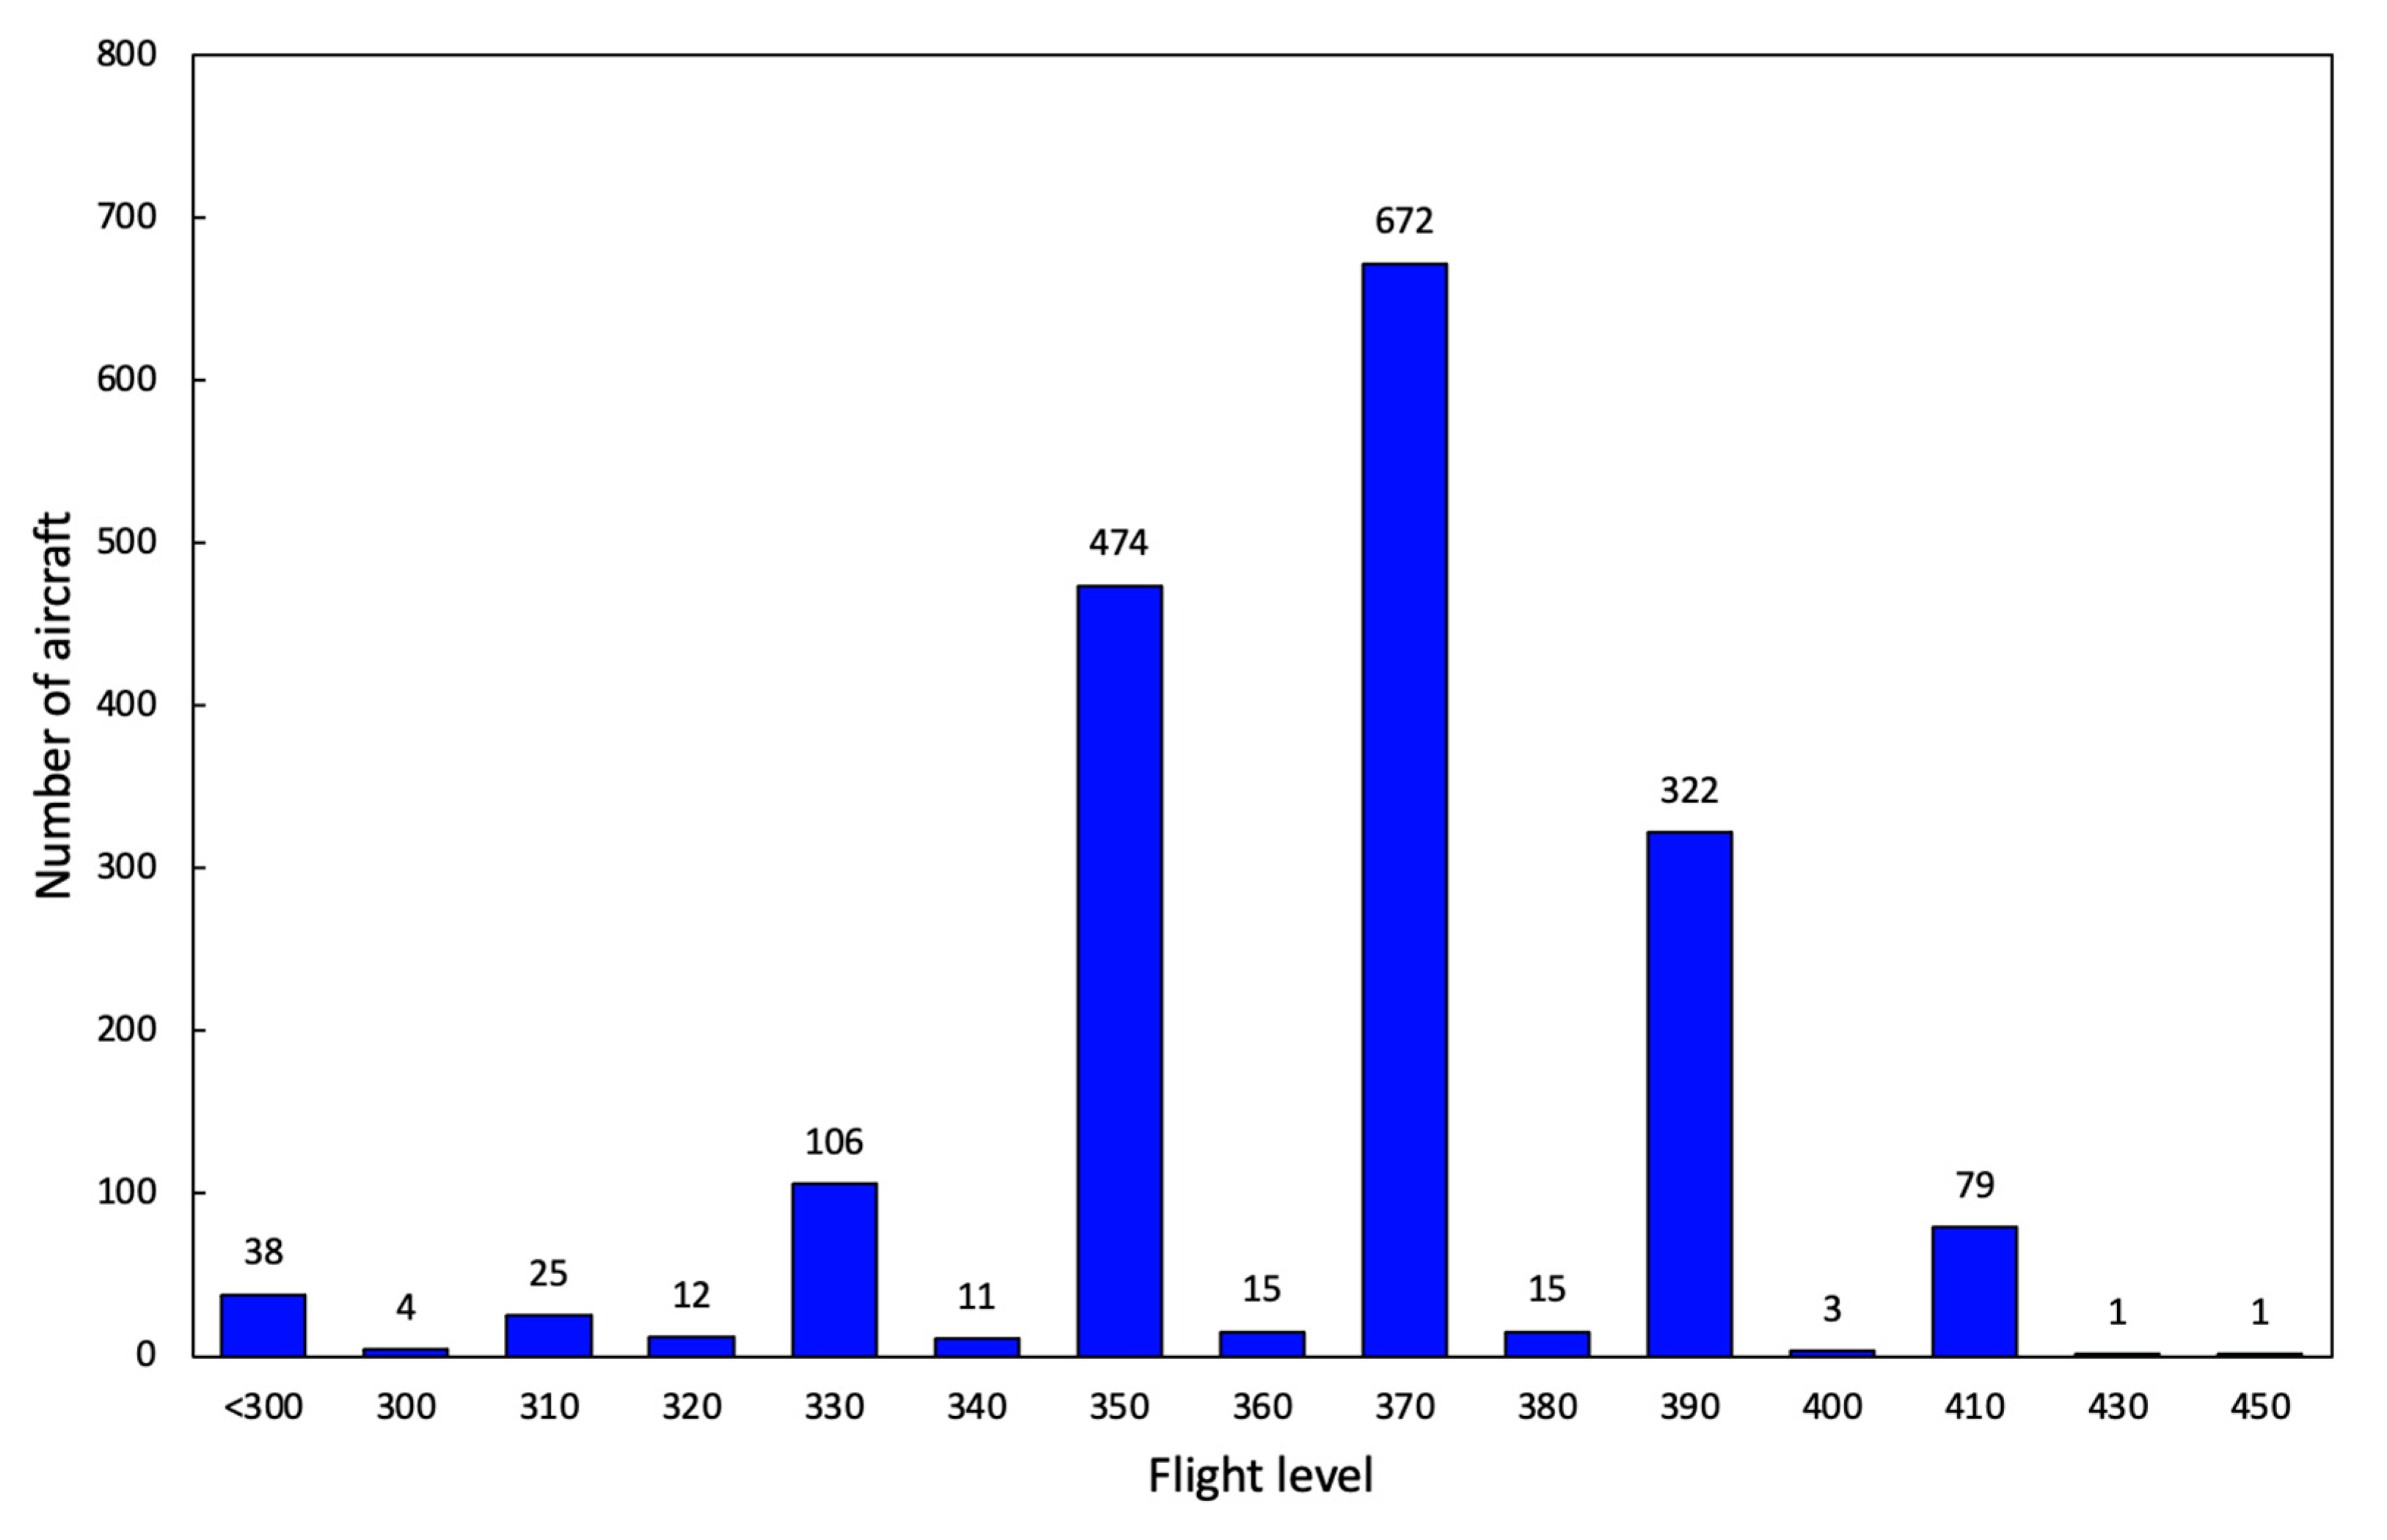
From the perspective of flight levels, most of the observed contrails were formed around FL 370 (see
Figure 4). The flight level was assigned to each measured contrail according to decoded pressure altitude taken from ADS-B data. It was found that 672 contrails, that is 37.8% of all measured contrails, were formed at FL 370. Other levels with the highest number of contrails were FL 330, 350, 390, and 410. Contrails formed between FL 330 and FL 410 in the monitored area represented 95% of all 1778 measured contrails during the given period. Almost all remaining contrails were formed by aircraft which flew at an altitude below 33,000 ft.
The reason odd flight levels are primarily used (FL 350, 370, 390) is that the camera used for the contrail observation was aimed toward former ATS routes L620 and Z21. Both ATS routes were unidirectional, i.e., used for eastbound flights. The Czech airspace applies the ICAO flight level allocation scheme of odd levels for eastbound flights, and even levels for westbound flights. This explains the disparity between the usage of even and odd flight levels in
Figure 4.
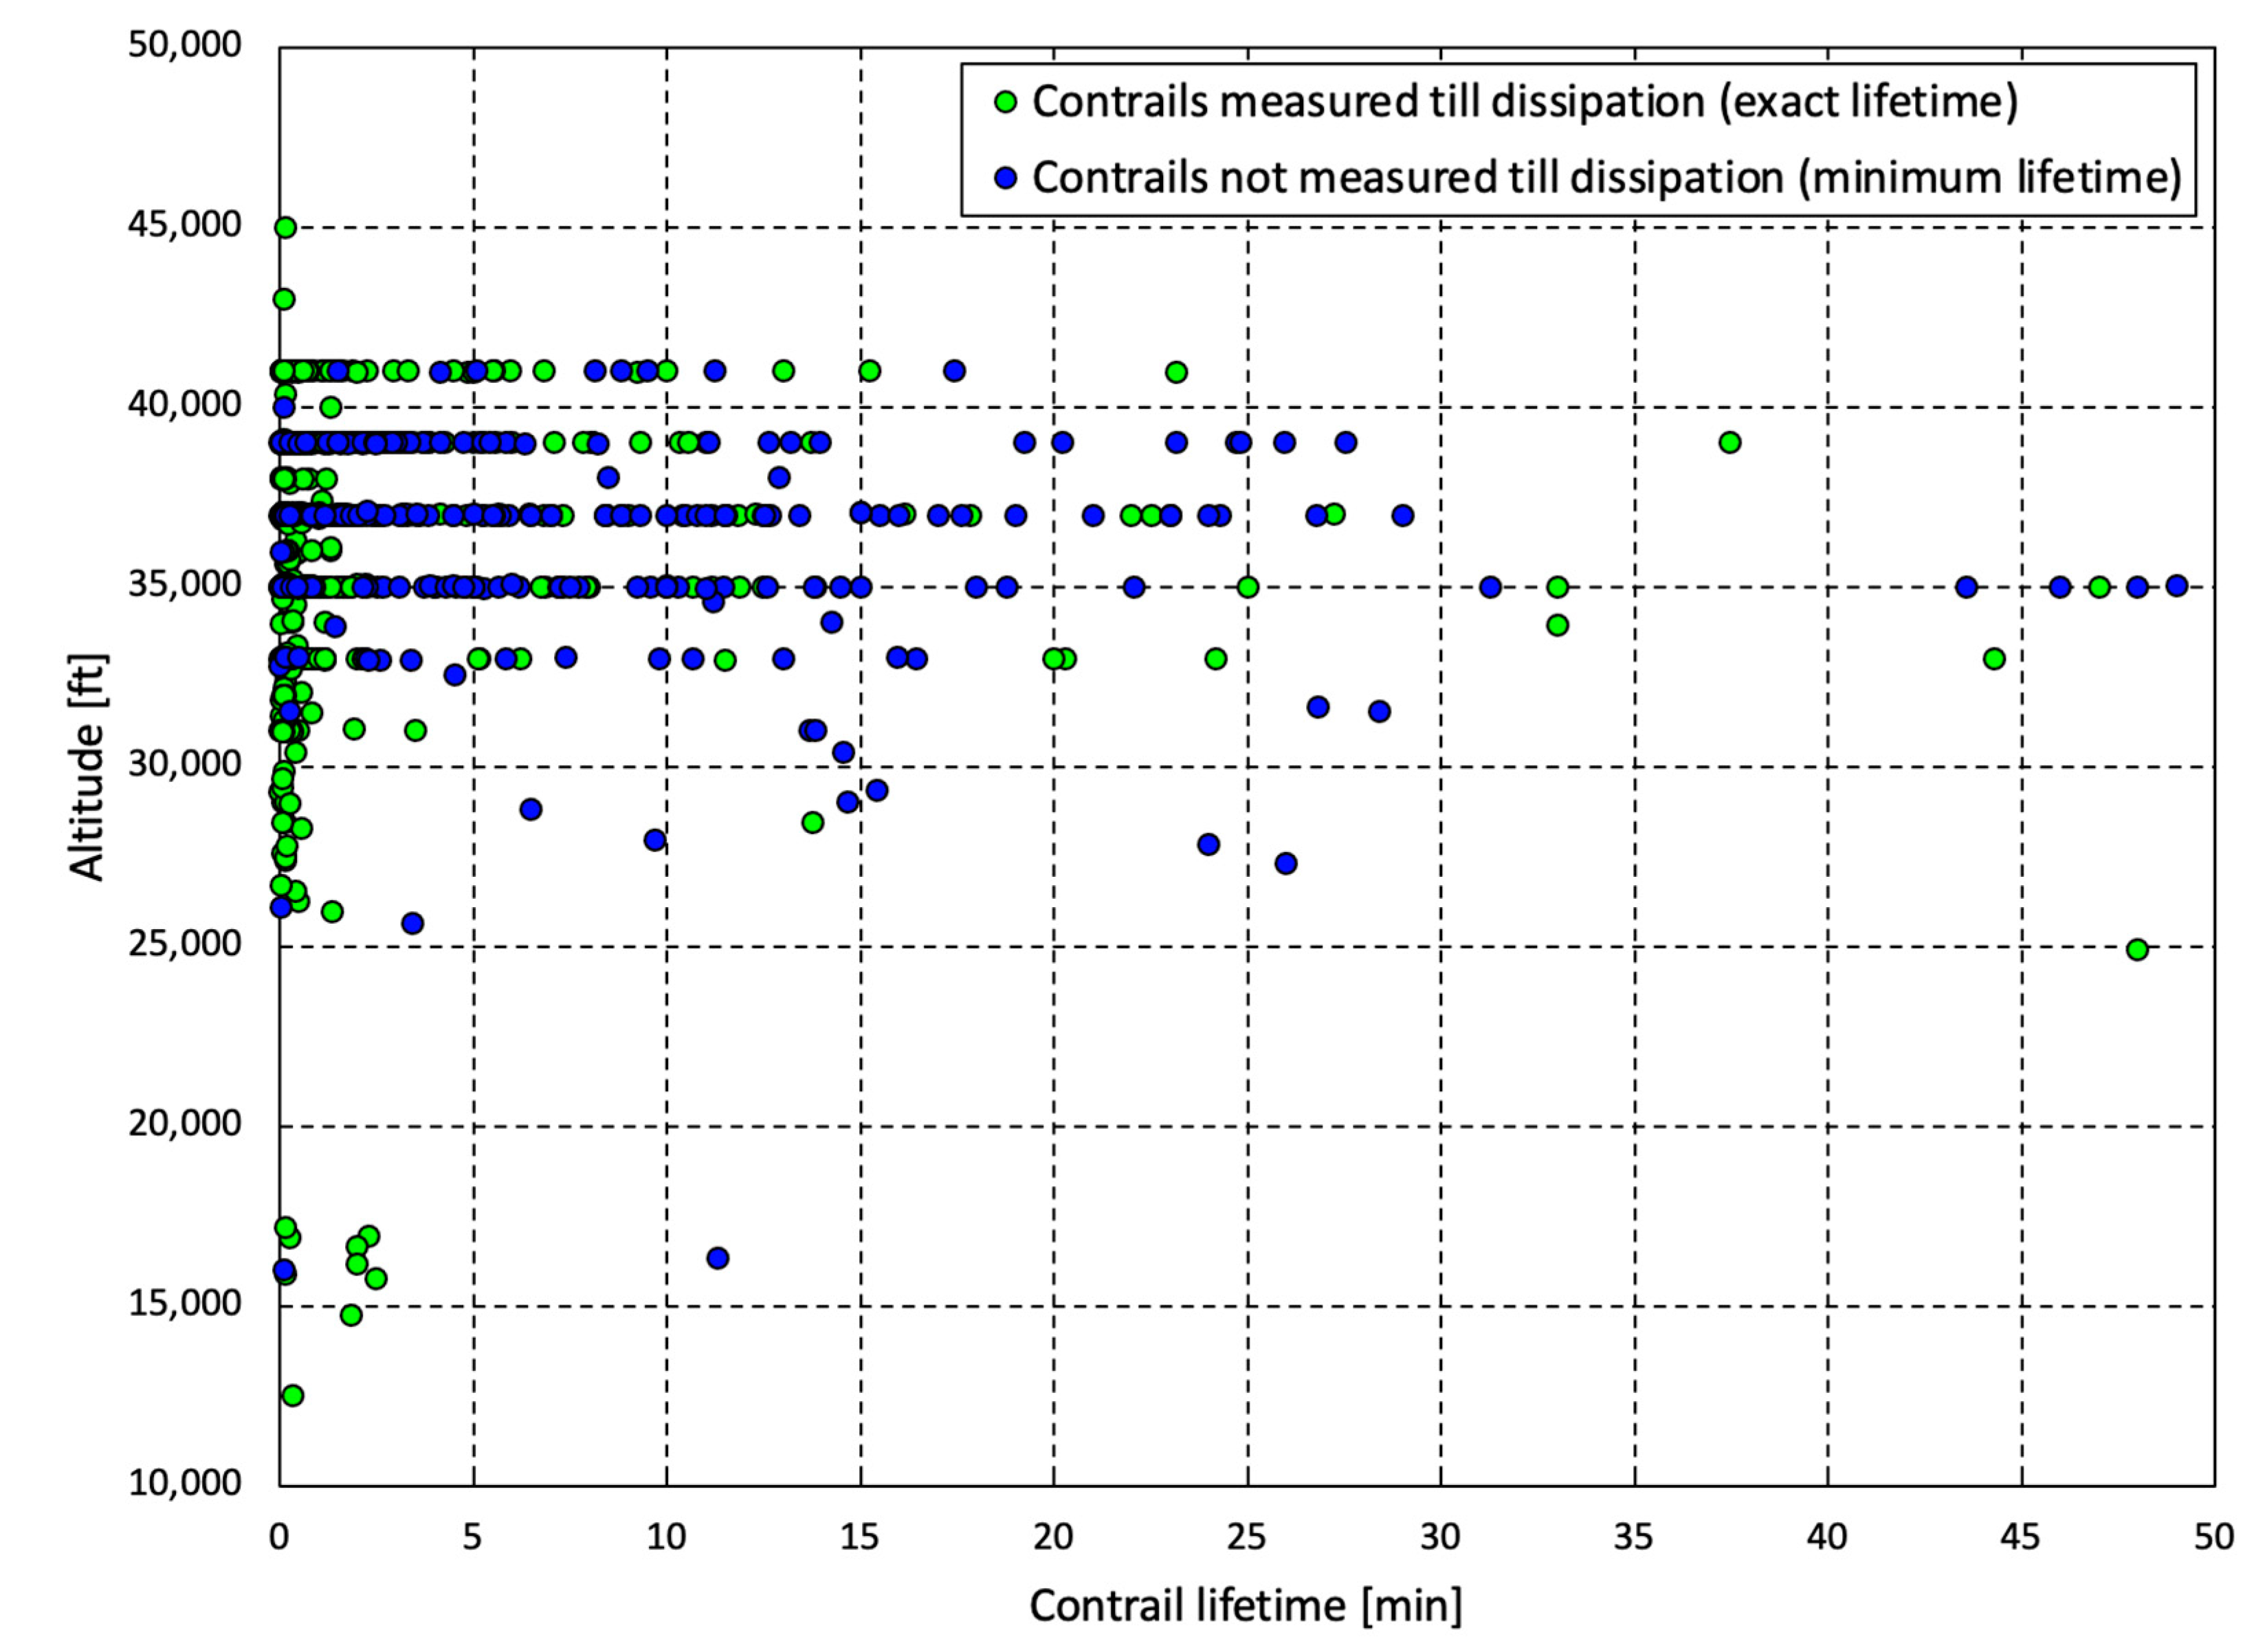
In contrast to long-lived contrails, the altitude of short-lived contrails ranges across flight levels, as shown in
Figure 5. Contrails that persisted for a longer time were mainly observed between FL 330 and FL 410. The average level of all observed contrails with a lifetime greater than 3 min (there were 230 such contrails) was 36,318 ft. Considering only contrails with a lifetime longer than 5 min (179 contrails in total), the average level was 36,122 ft.
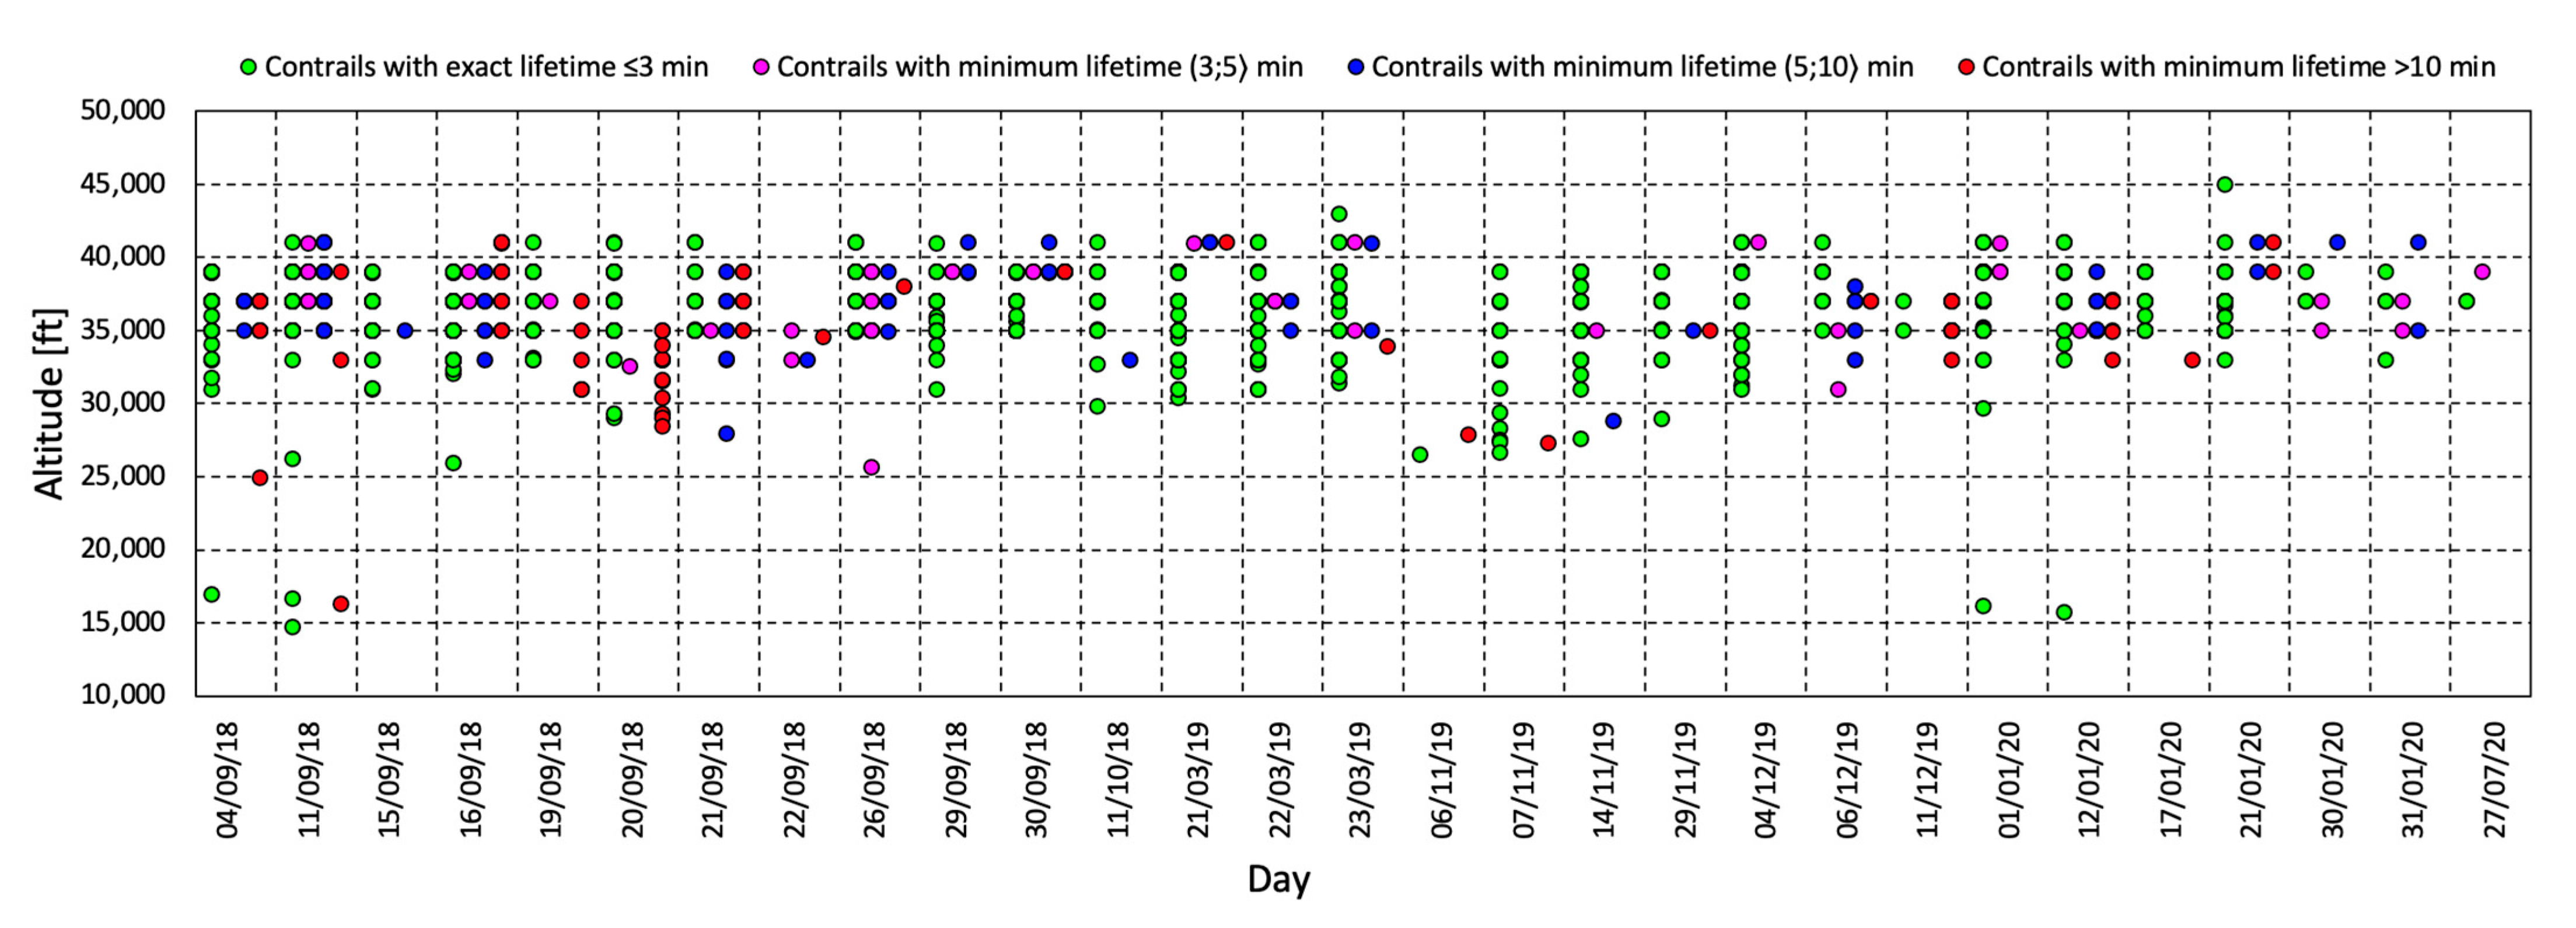
Figure 6 shows the layout of contrails during the days when the longest-lifetime contrails occurred. As displayed in this figure, contrails were observed with very different lifetimes during the same day. Based on the independence on the flight level and since the influence of fuel consumption seems to be minor (see
Section 3.2), it leads to the conclusion that contrail lifetime mainly depends on meteorological variables, which can vary significantly during one day. This also makes a prediction of contrail occurrence very difficult, because for such a prediction, meteorological data of a much higher precision and latency than provided today would be necessary.
3.2. Aircraft Types
To determine if there is any dependence between fuel consumption and contrail lifetime, we analyzed the types of aircraft. As mentioned earlier, contrail occurrence depends partially on the overall efficiency (see Equation (5)), which depends on fuel consumption. To determine if this dependency is strong, we checked if there was any difference between aircraft types and their contrail lifetime. The average fuel consumption per second varies between the observed types from 0.49 kg/s (A319) to 2.6 kg/s (A380). The actual consumption also varies based on the actual mass of the aircraft, where the difference between maximally and minimally loaded aircraft fuel consumption is about 40%. We tried to find if such a difference would also be visible in contrail lifetime. In
Figure 7, you might see data from the observation of seven most often flown types over the Czech Republic. These flights represent 1670 of the 1778 observed flights. We present the number of recorded aircraft, the mean time of contrail occurrence for the given type (including contrails which were not measured till dissipation so the real mean lifetime might be slightly higher), the maximal duration of contrail, and the percentage of flights with contrails with lifetime more than 3 min (see
Table 1). Based on these results, we believe that the dependency of contrail lifetime on aircraft type, and therefore also on the fuel consumption, is not very strong. For example, fuel consumption of a wide-body aircraft, the Boeing 777, is about five times greater than that for a narrow-body aircraft, the Boeing 737, but the difference in the mean contrail lifetime is only 8 s.
3.3. Use of Flight Levels
The second part of this paper focuses on statistics of flight levels used in the defined airspace around Děčín. These data are based on the same ADS-B provided by the same ground stations. However, they cover not only the data covered in the contrail occurrence, but also all aircraft in the specific months to be sure that we do not focus on a non-random group of aircraft because of the limitation of the recorded contrails.
The data concerning flight levels also cover aircraft that flew out of the view cone of the used camera (therefore, there were also aircraft flying in even flight levels), and aircraft we did not identify on flight records because they were above clouds. Therefore, we could not detect the contrail, or in some rare cases aircraft transmitted corrupted ADS-B data, and therefore could not be allocated correctly.
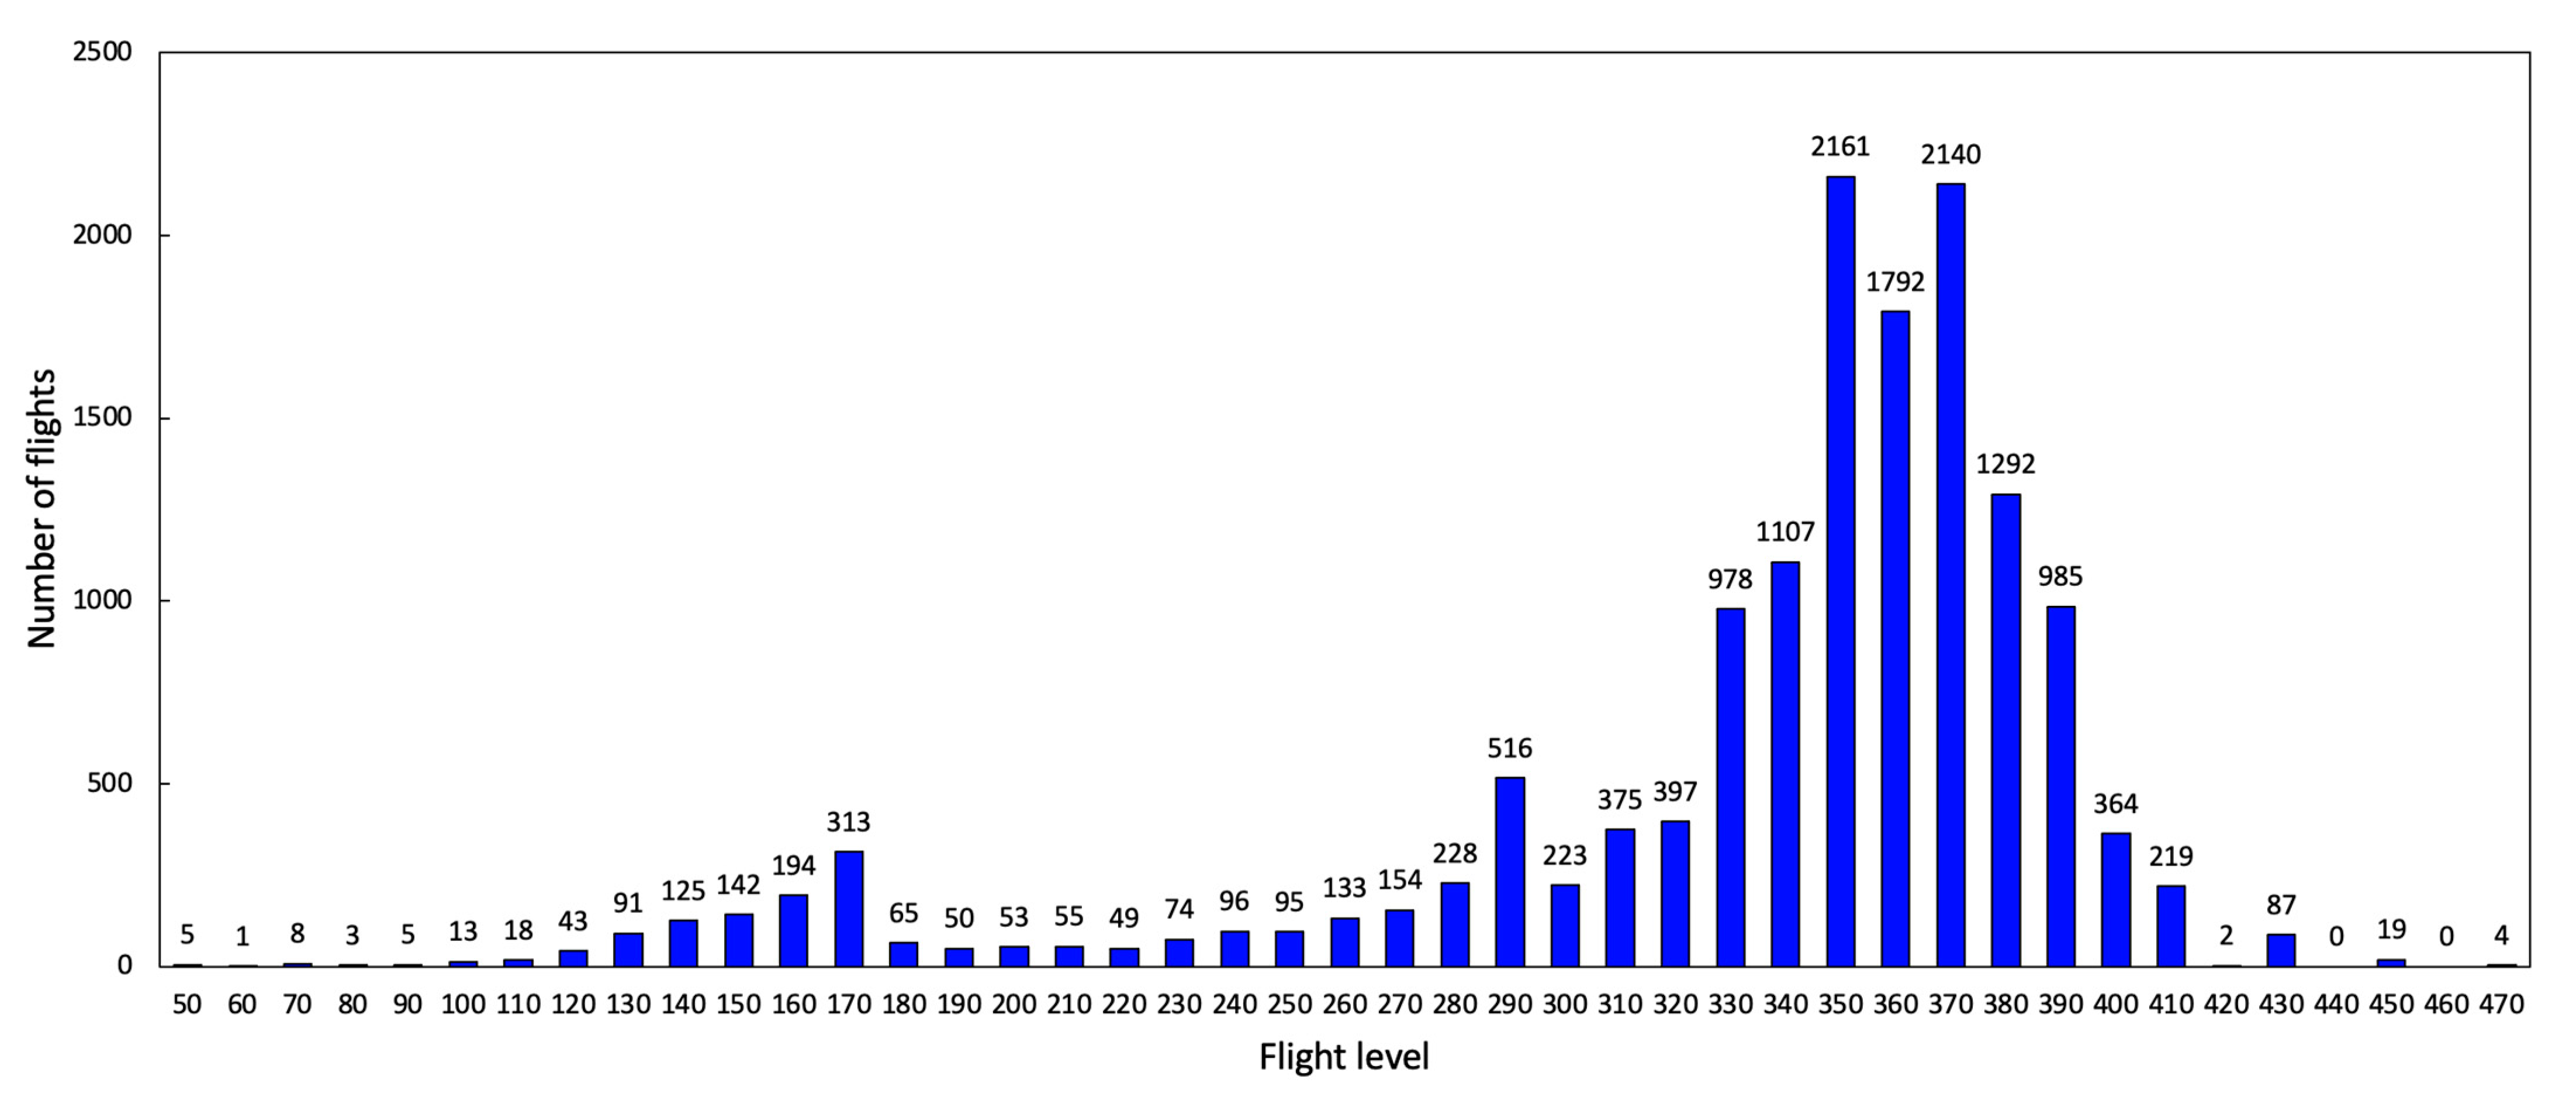
The data set used in this part of the article contains ADS-B messages for a period of 76 days from September 2018, October 2018, March 2019, and November 2019, each day from 04:15 UTC to 16:00 UTC. We have collected data about 14,674 flights between FL 50 and FL 470 in the defined airspace during the mentioned period. As can be seen in
Figure 8, flight levels with the highest air traffic were FL 350, 360, and 370. The share of air traffic at these flight levels was 41.5%. With an extension of plus/minus two flight levels, i.e., flights between FL 330 and FL 390, the share of air traffic was 71.2%. Only 4.7% of all flights took place above FL 390, with the rest of them at altitudes below FL 330. This corresponds with maximal flight levels of commercial jet aircraft, which are typically between FL 290 and FL 390, based on the actual mass and performance of the aircraft. To be precise, commercial aircraft are not operated at their maximal flight levels but at the so-called optimal flight levels, which are always lower than the actual maximal flight levels for safety reasons. Flight levels over FL 390 are optimal only for a limited number of variants of several aforementioned aircraft types.
To make sure that there was no potential influence by the transition of Czech airspace to free route airspace (so-called FRACZECH), we also processed air traffic data for a period of one month after the free route airspace implementation. We chose data from August 2021, which contained records of about 3723 flights between FL 50 and FL 470 (the data set is limited to 04:15–16:00 UTC as before). No significant change in flight level usage was found. Since the correlation coefficient between the number of flights in FL 50 to FL 470 before and after FRACZECH implementation is about 0.98, we can conclude that free route airspace does not influence flight level usage.
4. Discussion
This paper focuses on the dependency between the most common flight levels and contrail occurrence. We discovered that contrail occurrence and the lifetime of contrails are independent of specific flight levels. Based on the data presented in
Figure 3, the importance of the long-lived contrails shall be noticed. Assuming that the actual lifetime of an average contrail is the mean value of the given interval (e.g., 30 s for the first interval, 1.5 min for the second, 2.5 min for the third), the total time of occurrence of 1778 measured contrails is about 3900 min. From these 3900 min, the short-lived contrails represent only 660 min. In other words, 74% of all contrails have a lifetime of less than one minute and represent only 17% of the actual contrail sky coverage. From our data set of 1778 contrails, if only 100 of the aircraft (approximately 6%) with the longest contrail lifetime had been vectored by ATS to different flight levels, and these contrails had been avoided, then total coverage would have dropped to 1800 min, which corresponds to a decrease by more than 50%.
Therefore, it is a good approach for future attempts to mitigate contrail impact to focus merely on the contrails with longer lifetimes. With focused targeting of the long-lived contrails, we can achieve significant changes without the need for global changes in ATM.
In
Figure 8, we also show that any further research of contrail occurrence and prediction should be focused on flight levels 310–400 because these flight levels are the most used. Therefore, aircraft from these specific flight levels generate most contrails as evidenced in
Figure 4. In
Figure 6, you may see that both short-lived and long-lived contrails were observed at used flight levels, so there is no minimal or maximal flight level with contrail occurrence. Moreover, it is shown in
Figure 4 that in the case of the need for an operational change in flight level to avoid areas with supersaturated air, there are enough usable flight levels to divert flights from flight levels which are to be avoided. However, it is essential to notice that a change to a lower flight level will always lead to increased fuel consumption. Therefore, for any operational control from the ATM side, it would first be necessary to precisely estimate the “cost” of an avoided contrail compared to the increased fuel consumption, both from the economic and environmental points of view.
