Article

Elevation-Dependent Fluctuations of the Soil Properties in a Subtropical Forest of Central China

School of Environmental Studies, China University of Geosciences, Wuhan 430074, China
*
Author to whom correspondence should be addressed.
Sustainability 2022, 14(23), 15855; https://doi.org/10.3390/su142315855
Submission received: 15 September 2022 / Revised: 20 November 2022 / Accepted: 24 November 2022 / Published: 28 November 2022
(This article belongs to the Section Environmental Sustainability and Applications)

Abstract

:
Understanding the contents and stoichiometry of carbon (C), nitrogen (N), and phosphorus (P) is vital to evaluate the function and processes of a forest ecosystem. Overall, 18 sites in Shennongjia Forest from an altitude from 800 to 3000 m were selected to collect litterfall, humus, and soil (0–20 and 20–40 cm) samples in May, August, and December. The spatio-temporal distribution of C, N, and P contents and their stoichiometry were quantified, and the underlying driving factors were analyzed. Results revealed total organic carbon (TOC) and total nitrogen (TN) contents decreased from the topsoil to the deeper soil, while total phosphorus (TP) contents in the soil changed slightly with depth. Controlled by various sources and decomposition degrees, the ratios of C:P, C:N, and N:P decreased from litterfall to humus, further increased in topsoil, and decreased again in deeper soil. Considering the average values of all sites, only TN in litterfall and humus dissolved organic carbon (DOC) in soil, and C:N in litterfall exhibited a significant seasonal variation. With increasing altitude, the contents of TOC, TN, and TP significantly increased in soil, particularly in August, but fluctuated in litterfall and humus. This positive relationship in soil was remarkable for TOC and TN compared with TP. Pearson’s correlation and redundancy analysis indicated driving factors exhibited a more noticeable influence on the contents of TOC, TN, and TP in soil than those in litterfall and humus. Moisture content, vegetation pattern, bulk density, total Mn (tMn), total Fe (tFe), and clay content observably influenced the contents of TOC, TN, and TP in the soil, and thus affected its stoichiometry. This investigation provided a comparable dataset on the contents of C, N, and P and their patterns of stoichiometry, which are helpful to optimize forest management and ecosystems.

1. Introduction

As the three essential elements in the forest ecosystem, carbon (C), nitrogen (N), and phosphorus (P), as well as their biochemical reactions, play an essential role in the biogeochemical cycle of the forest ecosystem [1,2]. C is the basic substance of plant structure and provides energy for biochemical reactions [3]. N is one of the essential components of enzymes and chlorophyll [4,5]. P is important for vegetation growth and often serves as a restrictive element for primary production [6]. Stoichiometry provides a comprehensive approach to researching the coupling relationship of C, N, and P in ecological processes [7]. The stoichiometry of the three elements can reflect the nutrient utilization efficiency of plants and the relative nutrient limitation of forest ecosystems, which is important for plant growth, litter decomposition, and the biogeochemical cycle [8,9].
Soil is the key zone for material and energy exchange in a forest ecosystem. Moreover, it is the key place for C, N, and P accumulation, particularly in the shallow layer [6]. C and N in soil mainly originate from litterfall decomposition and other biological residues, whereas P in soil mainly comes from rock weathering [10,11,12]. Variations in the soil’s C, N, and P contents alter the soil’s stoichiometry and, in turn, influence the function of forests [13,14,15].
The C, N, and P contents patterns and their stoichiometry generally vary spatially and temporally. For example, the contents of C and N and C:P and N:P decrease from topsoil to deeper soil; however, P contents and C:N vary little among various soil depths in the Hainan Island Forest [16]. Additionally, geospatial variation, such as different regions and altitudes, has been observed [17,18,19]. Additionally, seasonal fluctuations in the C, N, and P contents and their stoichiometry are observed at some places [20]. This spatio-temporal heterogeneity is significantly influenced by environmental factors, (such as vegetation type, altitude, climate, etc.,) and soil properties [21,22]. However, the soil is a complex system, and factors influencing the patterns are generally interrelated and complicated. For example, Hu et al. (2020) reported that the C and N contents increase with altitude in rhizosphere soil because of the higher moisture content and lower temperature at high altitudes [23]. Additionally, the C and N contents in a forest under temperate conditions were affected by topographic features, including altitude and aspect. In reality, the altitude and aspect directly control vegetation, soil moisture, and temperature regimes [24]. The soil’s parent materials, particle size, and soil type regulate the C, N, and P’s spatial heterogeneity, and some of these factors are connected to soil fertility and moisture [17]. In addition, seasonal change can cause differences in soil moisture, soil fertility, and temperature, and thus affect the soil nutrients [25]. Thus, comprehensive studies on the impacts of various factors on the contents of C, N, and P and their stoichiometry on a spatial-temporal scale are necessary, especially in modern times when the earth’s sphere is seriously disturbed by human activities. The majority of studies to date have only focused on spatial variation, while temporal variation is frequently neglected.
The Shennongjia Forest is the largest primeval forest in central China, with the difference between the highest and lowest altitudes as high as 2700 m [26]. A large altitude scale covers various climate conditions, diverse vegetation patterns, and soil types, which provide us with a typical condition for exploring the altitudinal patterns of C, N, and P contents and their stoichiometry in a forest ecosystem. Earlier investigations have explored the composition of plant species and microbial community structure in the Shennongjia Forest [27]. The relationship between vegetation distribution and climate conditions or altitude has been studied [28]. The ecological services of this forest were assessed using trends of net primary productivity and they exhibited a trend of improving and stabilizing in recent years [29]. However, the studies on the temporal and spatial C, N, and P contents patterns, their ecological stoichiometry, and their response to various factors are still insufficient.
In this study, we selected 18 sites in the Shennongjia Forest from an altitude of 800 to 3000 m to collect litterfall, humus, and soil (0–20 and 20–40 cm) samples in May, August, and December. Thus, the specific objectives were (1) to detect the spatio-temporal distribution patterns of C, N, and P contents and their stoichiometry in litterfall, humus, and soil in the Shennongjia Forest, and (2) to study the influence of driving factors (including environmental factors and soil properties) on the contents of C, N, and P heterogeneity and their stoichiometry.

2. Materials and Methods

2.1. Study Area

The Shennongjia Forest region is located in the northwestern part of Hubei Province, central China, covering an area of 3253 km2 (Figure 1). It is a national nature reserve and has been included in the world biosphere protection network. In this region, the climate is subtropical with mild, wet summers and frigid, arid winters. The annual precipitation is in the range of 800–2500 mm (an average precipitation of 1219.93 mm). The lowest temperature on record was in January (4.3 °C), and the highest was in July (17.2 °C), with a mean annual temperature of 7.4 °C [28]. The difference between the highest and lowest altitudes of the forest are as high as 2700 m, and the temperature decreases and the precipitation increases with altitude. Thus, the vertical climatic zonation is evident, exhibiting the characteristics of north subtropical, temperate, warm temperate, and cold temperate with altitudes of <800 m, 800–1300 m, 1300–2000 m, and >2000 m, respectively [26].
From the altitude of 232 to 2932 m, vegetation patterns shift from evergreen broad-leaved forest to mixed evergreen and broad-leaved deciduous forests, deciduous broad-leaved forests, coniferous forests, mixed broadleaf-conifer forests, and mountain shrub meadow zones [30]. According to the parent material, topography, and altitude, most of the soil belongs to Luvisols, Alisols, and Ferralsols, and a small part of the soil belongs to Cambisols and Regosols based on the Word Reference Base for Soil Resources (WRB).

2.2. Sample Collection

The locations of 18 sampling sites are shown in Figure 1, and detailed information is given in Table S1. At each site, four layers including litterfall, humus, and soil (0–20 and 20–40 cm) were collected in May, August, and December 2019. During the sampling, samples from three sites approximately 3 m apart were collected, combined into one sample, and put into a high-density polyethylene Ziplock bag. For soil samples, gravel and roots were removed before packing and, further, the sampling bags were wrapped in aluminum foil to protect samples from sunlight. Aluminum specimen boxes and cutting rings were used to collect soil samples for the calculation of moisture content and soil bulk density. The altitude was measured using a global position system (GPS). Air temperature and soil temperature were measured by a digital thermocouple thermometer. The vegetation pattern was determined according to blade shape and the height of vegetation.

2.3. Sample Pretreatment and Analysis

The litterfall and humus were dried at 80–90 °C for 20 min in an oven and further air-dried at 35 °C. The soil was directly air-dried at 35 °C. For additional analysis, all samples were run through a sieve with a mesh size of 100.
For litterfall and humus samples, TOC and TN were determined by an elemental analyzer (Elementar Analysensysteme GmbH, Germany), with detection limits of 0.01% and 0.01%. TP was measured using a molybdenum antimony blue colorimetry method after digesting with H2SO4 and H2O2, with a 0.02 mg/g detection limit [31].
For soil samples, the moisture content, bulk density, and acidity (pH in 0.1 M KCl) were analyzed as described previously [32,33]. A TOC analyzer (Elementar, Vario TOC) was employed to determine DOC and TOC. The respective limits of detection were 0.01% and 0.1 mg/L. TN was determined using an ultraviolet spectrophotometer after digesting with alkaline potassium persulfate, with a detection limit of 0.01 mg/g [34]. Available nitrogen (AN) was evaluated utilizing the diffusion method and alkaline hydrolysis, with a detection limit of 0.05 mg/g [35,36]. TP was measured by molybdenum antimony blue colorimetry after digesting with NaOH, with a detection limit of 0.01 mg/g [31]. Available phosphorus (AP) was determined using the same method after digesting with NH4F and HCl, with a detection limit of 0.01 mg/g [37]. Total Fe, Al, and Mn (tFe, tAl, and tMn) contents were analyzed using ICP-OES (PerkinElmer, Avio 200) after digesting with the mixture of HNO3, HCl, and HF, with a detection limit of 0.001 mg/L [38]. After organic matter and inorganic carbon were removed with 10% H2O2 and 10% HCl, soil particle size was measured utilizing a laser particle scanning analyzer (Mastersizer 2000, Marvin, UK).
During the analytical process, standard materials were determined to test the accuracy of methods and monitor the instrument status; duplicate samples and blank samples were analyzed to assure data quality.

2.4. Data Analysis

One-way ANOVA was employed to examine the association of TOC, TN, and TP contents and their stoichiometry in litterfall, humus, and soil layers among the three sampling times. Before analysis, data were rank transformed when they were not normally distributed. Linear regression was performed to test the relations between the altitude and the contents of TOC, TN, and TP, and their stoichiometry in all layers. Pearson’s correlation analysis was used to explore the relationship between driving factors and the contents of TOC, TN, and TP, and their stoichiometry. Boosted regression trees (BRTs) was a composite distribution model to uncover nonlinear relationships between predictors and response variables [39,40,41]. We utilized BRTs to identify the relative influence of driving factors for the contents of TOC, TN, and TP, and their stoichiometry in all layers. BRTs were performed in R program version 4.0.5. The ANOVA and Pearson’s correlation analysis was carried out by employing the SPSS 26.0 software.

3. Results and Discussion

3.1. Comparison of Average Contents of C, N, and P and Their Stoichiometry in Various Layers

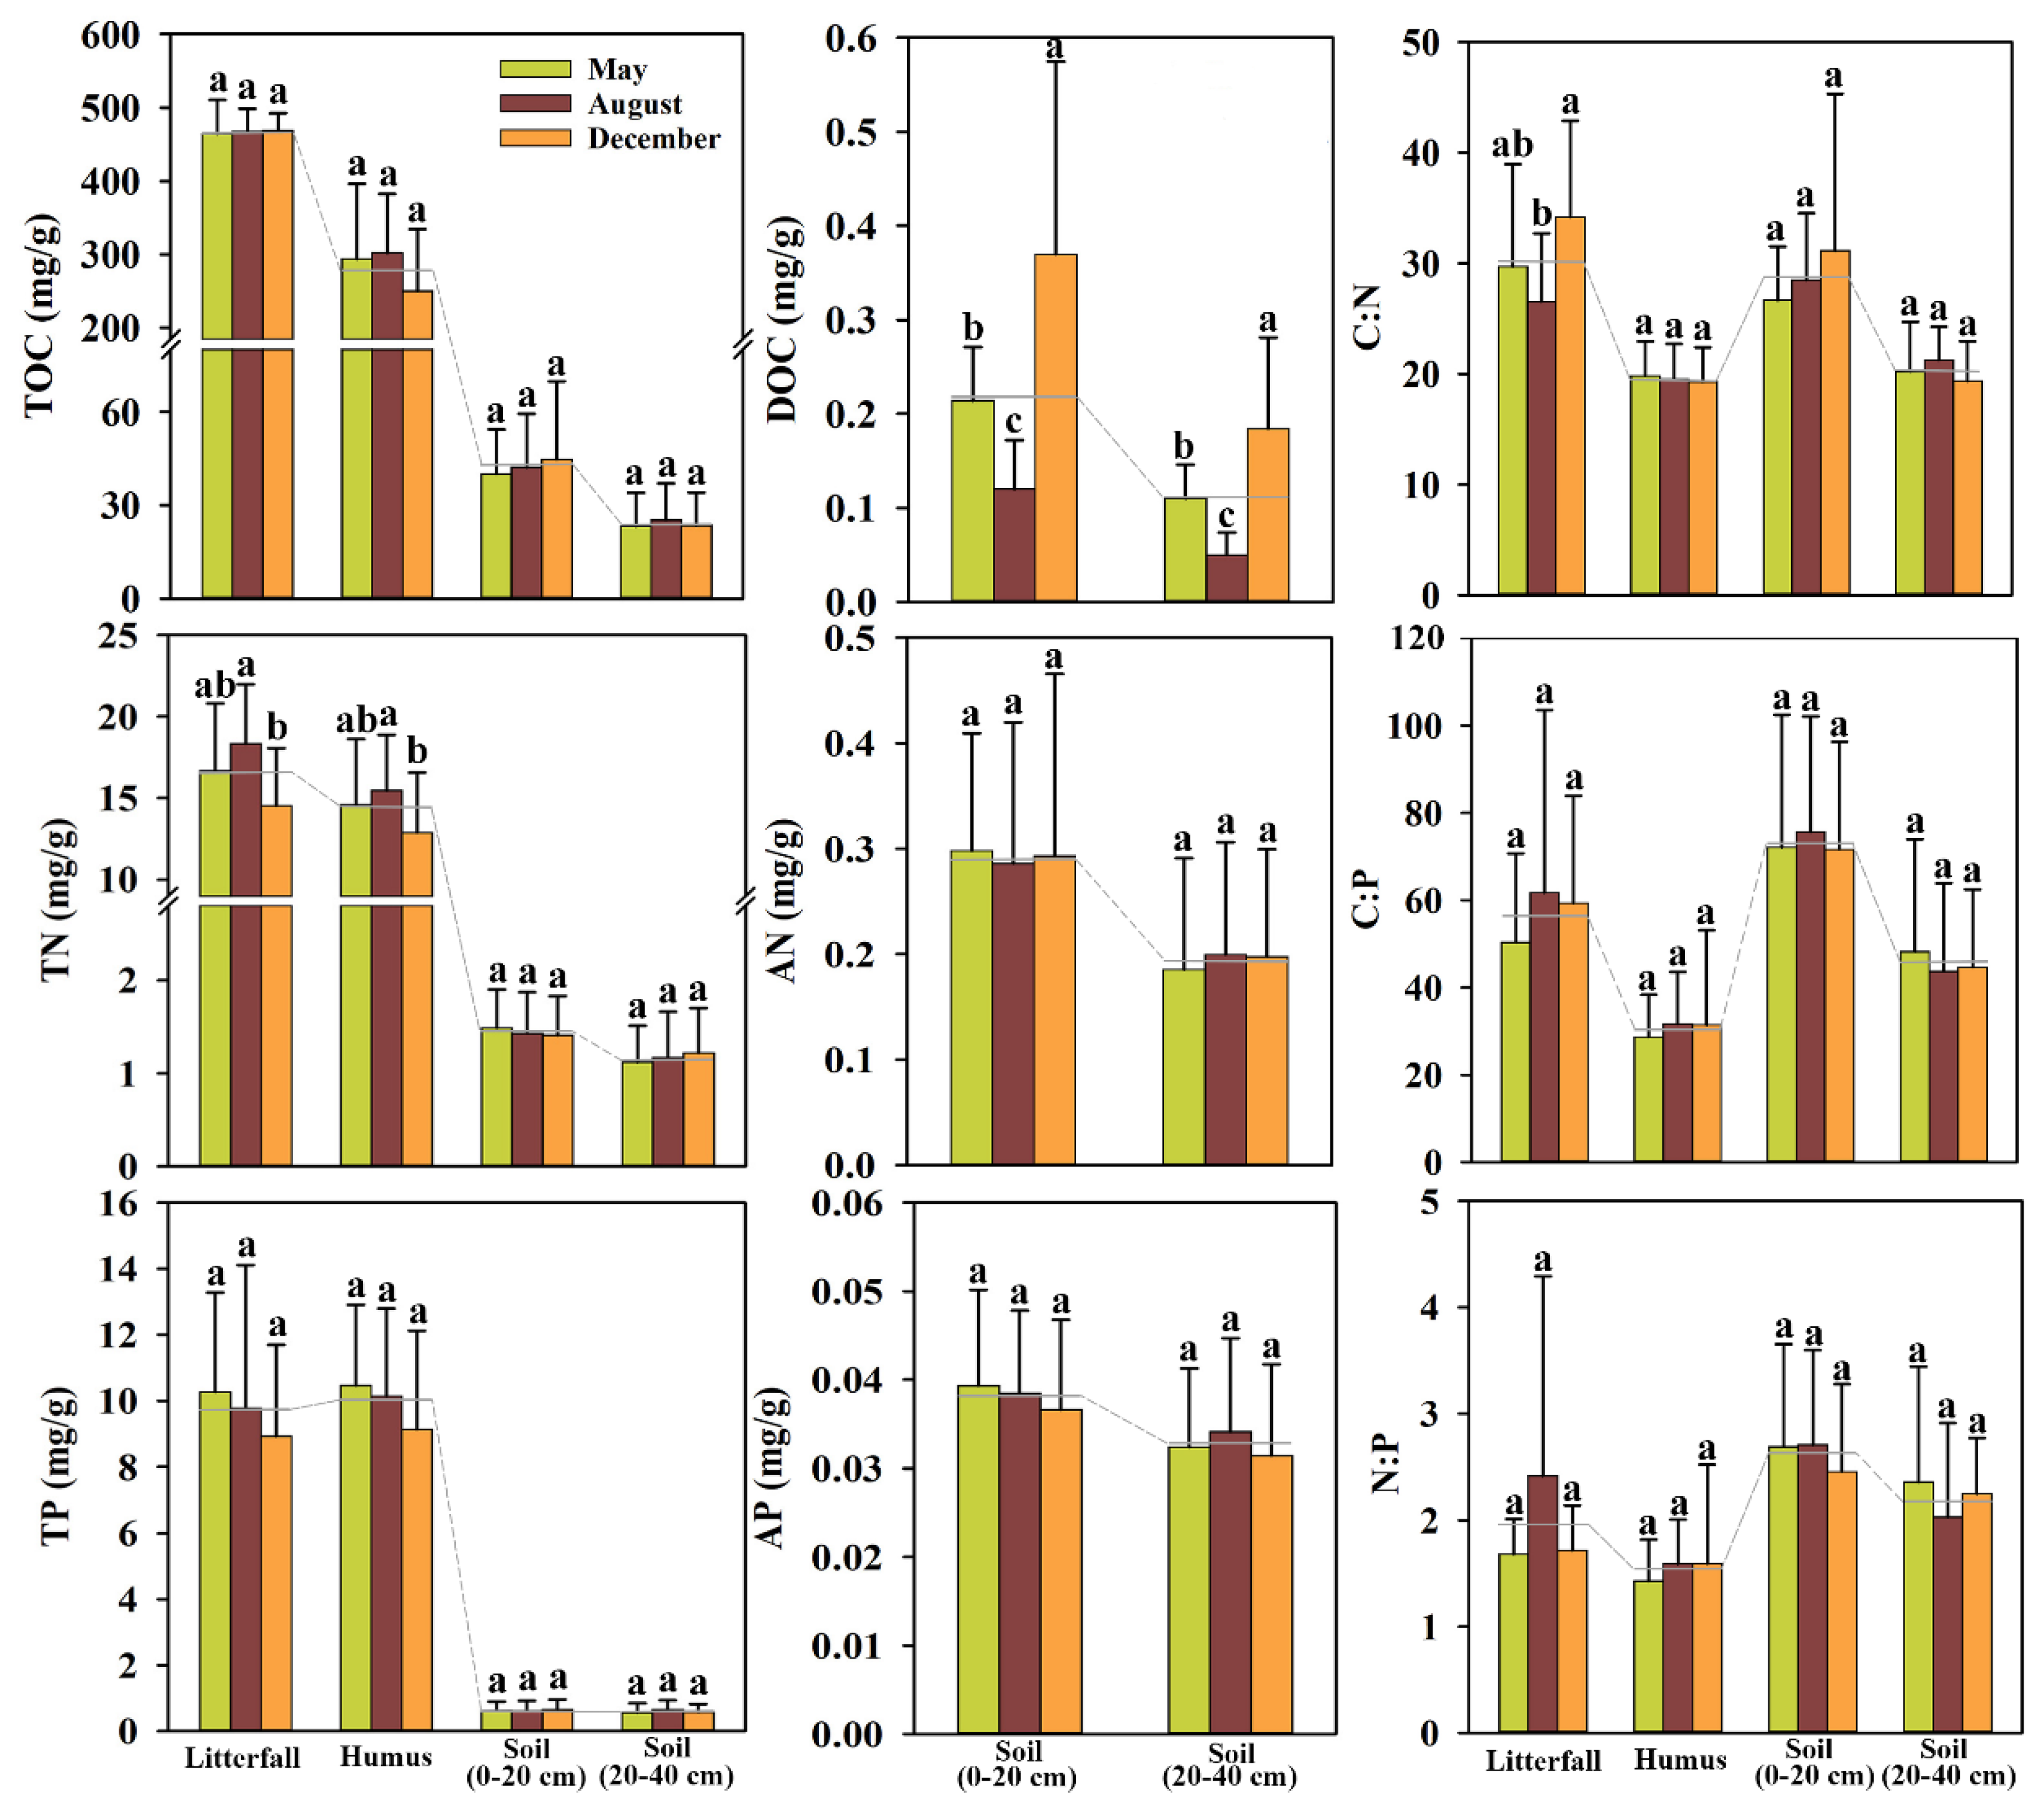
The TOC, TN, and TP contents and their stoichiometry varied in litterfall, humus, and soil (0–20 and 20–40 cm) during the three sampling times (May, August, and December) (Figure 2, Table S2).
Overall, TOC content was 321.30–513.80, 105.90–463.70, 11.44–114.58, and 6.33–49.98 mg/g; TN content was 8.70–26.60, 6.40–21.00, 0.64–2.24, and 0.41–2.15 mg/g; and TP content was 2.01–19.04, 3.73–15.30, 0.16–1.15, and 0.14–1.19 mg/g in the four layers from the top to bottom, respectively (Table S2). The average TOC, TN, and TP contents in litterfall and humus were several times higher than those in soil layers. TOC and TN contents decreased with depth in four layers; however, TP content was higher in humus than in litterfall (Figure 2).
In the 0–20 cm and 20–40 cm soil layers, the DOC content was 0.04–1.03 and 0.02–0.37 mg/g, the AN content was 0.10–0.81 and 0.04–0.45 mg/g, and the AP content was 0.02–0.07 and 0.02–0.06 mg/g, respectively (Table S4). In the 0–20 cm soil layer, the average concentrations of DOC, AN, and AP were significantly greater than in the 20–40 cm soil layer (Figure 2).
The soil organic matter (SOM) in forest ecosystems mainly originates from litterfall and dead animals, and most of the natural biological processes including litterfall decomposition occur on the soil’s surface [42]. Therefore, SOM forms in topsoil and further migrates to the lower soil layers or is washed away with rain [43]. Therefore, the soil nutrient contents decrease from the topsoil to the deep soil. Indeed, in our study, TOC and TN contents decreased with depth in four layers, and the contents of DOC, AN, and AP were higher in the soil layer from 0–20 cm than those in the soil layer from 20–40 cm.
Interestingly, the TP content in litterfall and humus was considerably higher than that in soil layers of 0–20 cm and 20–40 cm, respectively; however, the extent to which it varied with soil depth was less than that for TOC and TN. Compared with TOC and TN, TP is mainly present in water-soluble form and is more easily washed off [44]. Moreover, TP is derived from not only the migration of SOM from topsoil, but also the mineral weathering in soil. In summary, TP in natural soil is controlled by parent material, weathering degree, and eluviation. Similarly, some previous studies reported that TP existed largely in inorganic form and was driven by abiotic factors, whereas TOC and TN existed mostly in organic form and were greatly controlled by biotic factors [17,45]. Furthermore, microbial activity and physicochemical interaction were the most intense in surface soil layers [21]; thus, the active and available part of TOC, TN, and TP contents were higher in surface soil, which also explained why the contents of DOC, AN, and AP were higher in the 0–20 cm soil layer than in the 20–40 cm soil layer.
The average C:N, C:P, and N:P ratios decreased from litterfall to humus, further increased in the 0–20 cm soil layer, and again decreased in the 20–40 cm soil layer (Figure 2, Table S3). C:N is a sensitive indicator reflecting soil quality, which is inversely related to SOM humification degree [46]. The decomposition degree of humus is obviously higher than that of litterfall and soil; therefore, humus had the lowest C:N compared with litterfall and soil [47]. Usually, C:N < 25 in soil indicates optimal conditions for the SOM microbial decomposition, leading to rapid carbon loss and sufficient nitrogen availability. C:N > 25 indicates a competition between microorganisms and plants for nitrogen and difficulty in the decomposition of SOM [48]. In our study, the average C:N in the 0–20 cm soil layer (28.77) was greater than that in the 20–40 cm soil layer (20.28), which was in accordance with previous research, indicating that the soil C:N decreased along the profile [49]. This could be because SOM in deeper soil is older and forms through microbial decomposition to a larger extent [50].
C:P is used to assess the availability of P in forest ecosystems. C:P > 300 indicates the net retention of P and a decrease in P availability; C:P < 200 indicates a net release of P and an increase in P availability [22]. The C:P values in our study were <200, demonstrating the abundant availability of P for plant growth in the Shennongjia Forest.
N:P reflects nutrient limitations [51]. P limitation is indicated by N:P >16, P and N co-limitation is indicated by N:P of 14–16, and N:P <14 denotes N limitation [52]. N:P in this investigation was within the range of 1.43–2.70 in all layers, which indicated that the vegetation growing in the Shennongjia Forest was significantly restricted by N.
Moreover, from litterfall to humus, the TOC content decreased to a greater extent than TN. The decrease in the TP content was the least; therefore, the C:P and N:P in humus were lower than those in litterfall. Similarly, in soil (0–20 and 20–40 cm), the TP decreased to a smaller extent than TOC and TN; therefore, C:P and N:P ratios were greater in the 0–20 cm soil layer than in the 20–40 cm soil layer. In general, the TOC, TN, and TP contents exhibited different variations among the depths because of the different sources and conversion mechanisms, which led to the significant vertical patterns of C:N, C:P, and N:P [52,53].
One-way ANOVA indicated that only TN in litterfall and humus, DOC in soil, and C:N in litterfall exhibited a significant relationship with the sampling times (May, August, and December) (Figure 2).
August had the highest average TN content in litterfall and humus, followed by May, and December had the lowest (Figure 2). This could be explained by the different N resorption efficiency of plants in different seasons. It is well known that compared with May and December, more plant litter are observed in August; their humification degree is higher due to the warm and humid climate and, because of which, more nutrients are provided from the soil for living plants in August [25,54]. Hence, leaves transfer less N to living plant organs before falling off [23], and the N that remained in the leaves was the highest in August. On the contrary, because of the cold and dry climate in December, the N remaining in the leaves is the lowest. This phenomenon was only observed for TN but not for TOC and TP, because N was a restrictive element in our study area.
It is reported that DOC in the soil is easier to be absorbed and used by plants, and it mainly originates from the organic matter from recent leaf litter and humus [55]. Though more fresh plant litter in topsoil were observed in August, the lag effect of the leaching and microbial decomposition occurred and resulted in an increase in DOC content in December. Moreover, under different vegetation types, DOC is consumed in the process from the early growing season (April) to the vigorous growing season (July) because the uptake of DOC by plants reaches the peak when they enter the most active growth period [56]. As a result, the mean DOC contents in soil layers between 0 and 20 cm and between 20 and 40 cm decreased from December to May to August. In addition, compared with AN and AP, DOC is more sensitive to environmental factors such as temperature, humidity, and pH [57]. Therefore, only the DOC in the soil changed significantly with seasons.
Our explanation was partly supported by research on the long-term effects of seasonal precipitation changes on two species that found the leaf N and P content showed fluctuations with rainfall [58]. However, the research also indicated that the tree transpiration and response parameters to environmental variables showed slight treatment effects. Combined with our results, the large seasonal variation of the DOC in the soil might not only result from the plants but also from the hydrothermal condition.
Influenced by the variation in TOC and TN in litterfall, C:N exhibited an opposite changing trend with the sampling times compared with TN. The highest C:N value was in December, followed by May, and the lowest value was in August. According to this finding, organic matter underwent the greatest humification in August and the least in December.

3.2. Response of C, N, and P Contents and Their Stoichiometry to Altitude

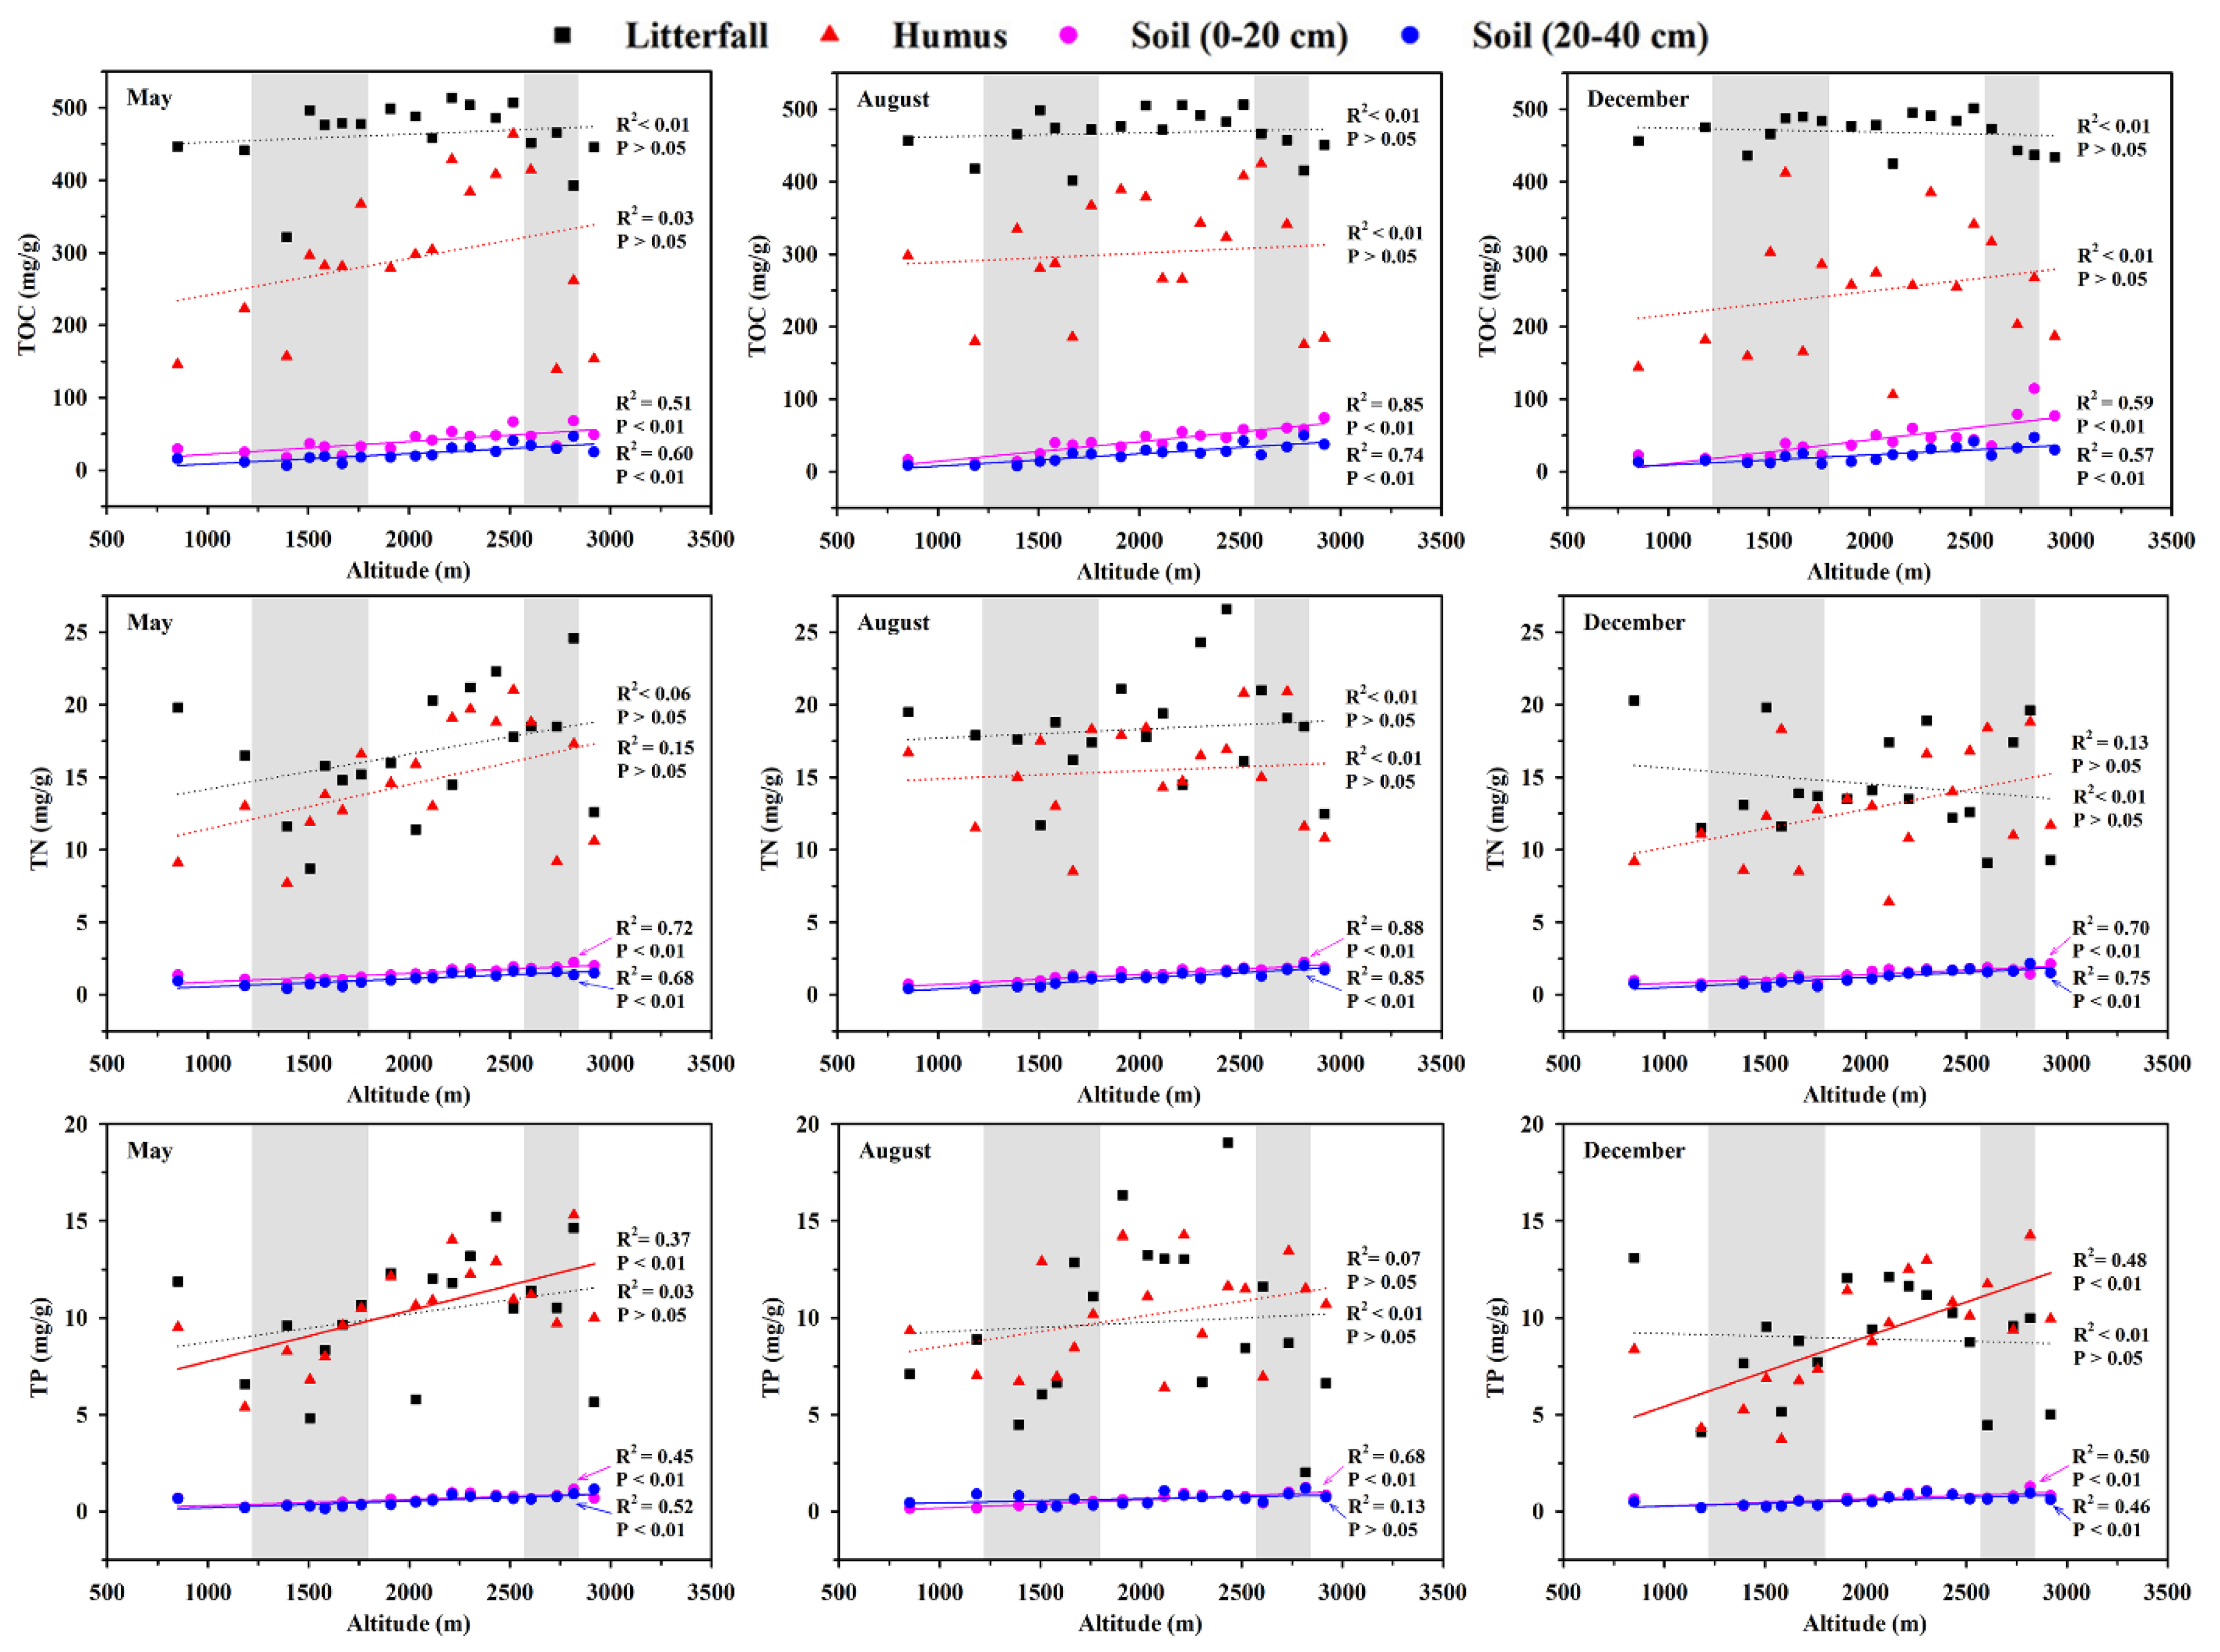
The generalized linear regression illustrated the relationships of altitude with C, N, and P contents and their stoichiometry in various layers and sampling times (Figure 3, Figure 4 and Figure 5).
TOC and TN showed a significant positive relationship with altitude in soil layers (p < 0.01). The correlations were the highest in August (R2 > 0.7), particularly for the 0–20 cm soil layer (R2 were 0.85 and 0.88, respectively). A significantly positive correlation between TP in soil layers and altitude was observed (p < 0.01), except for the 20–40 cm soil layer in August. However, this positive correlation was weak compared with that of TOC and TN. TOC, TN, and TP contents in litterfall and humus fluctuated with altitude. Overall, they displayed a decreasing trend, followed by an increase and lastly a decrease with altitude; the highest TOC, TN, and TP contents were observed In the middle altitude area (1500–2500 m).
The DOC in the soil layers was positively correlated with altitude, and this positive correlation (R2) decreased from August (p < 0.05) and December (p < 0.01) to May (nonsignificant). AN in soil layers exhibited a significant positive association with altitude (p < 0.01), particularly in August (Figure S1). AP fluctuated and roughly decreased with altitude and was only correlated with altitude (p < 0.01) in 20–40 cm of soil. C:N, C:P, and N: P in the four layers fluctuated with altitude (p > 0.05); however, C:N in the 0–20 cm soil layer in August and December and N:P in the 0–20 cm soil layer in August did not fluctuate with altitude (Figure S2).
Altitude is a crucial environmental factor influencing soil nutrients. This study found that the TOC, TN, and TP contents increased with altitude in the 0–20 cm and 20–40 cm soil layers, which was consistent with research conducted in the southern tropics [17]. The temperature lowers and soil moisture increases with altitude; thus, the soil microbial activity and organic matter decomposition rate slows down, resulting in TOC, TN, and TP accumulation [59,60,61]. Moreover, because of the warm and humid climate, the effect was stronger in August than in May and December. However, the correlation between altitude and TOC and TN was more significant than that between altitude and TP, which further indicated that TP was derived from not only litterfall decomposition, but also mineral weathering and correlated with the bedrock property [17,45]. The TP contents in the 20–40 cm soil layer were relatively low at the altitude of 1506–2032 m in August (Figure 3). This could be because the rainfall and temperature were moderate in the middle altitude area compared with high temperature and low precipitation in the low altitude region and low temperature and high precipitation in the high-altitude region, and it was easier for P to leach with rain [62].
Based on the aforementioned explanation, DOC and AN also mainly originated from organic matter decomposition and were positively correlated with TOC and TN. As a result, in the soil layers of 0–20 cm and 20–40 cm, their contents increased significantly with altitude. However, there was a tendency for the AP contents in the soil layers between 0 and 20 cm and between 20 and 40 cm to decrease with altitude. AP contained more inorganic and water-soluble components and was easy to be lost [63]. The precipitation increased with altitude in our study area, and the loss of AP also increased.
In our study, the change with altitude in TOC, TN, and TP in litterfall and humus and that in C:N, C:P, and N:P in all layers was observed; however, it was not obvious but complex and interactional. As expected, increasing altitude changed the climate factors (temperature, precipitation, and light intensity), vegetation types, and weathering conditions of parent material and resulting in variations in soil microbial community diversity and enzyme activity, leading to the differences in the accumulation capacity of TOC, TN, and TP [64].
In Figure 3, the highest TOC, TN, and TP contents in litterfall and humus were observed in frigid temperate monsoon climates at altitudes from 1900–2600 m but not in the warmer or colder zones. This might be explained by the mixed broadleaf–conifer deciduous forest vegetation type that was present in this altitude range (1900–2600 m). It was reported that deciduous tree species had higher C, N, and P contents than evergreen tree species [65]. Hence, the distribution of TOC, TN, and TP in litterfall and humus with altitude mainly resulted from the tree species and climate factors. Unfortunately, the change in C:N, C:P, and N:P in all layers were not consistent with altitude, and it was determined by the TOC, TN, and TP contents.

3.3. Driving Factors for C, N, and P Contents and Their Stoichiometric Patterns

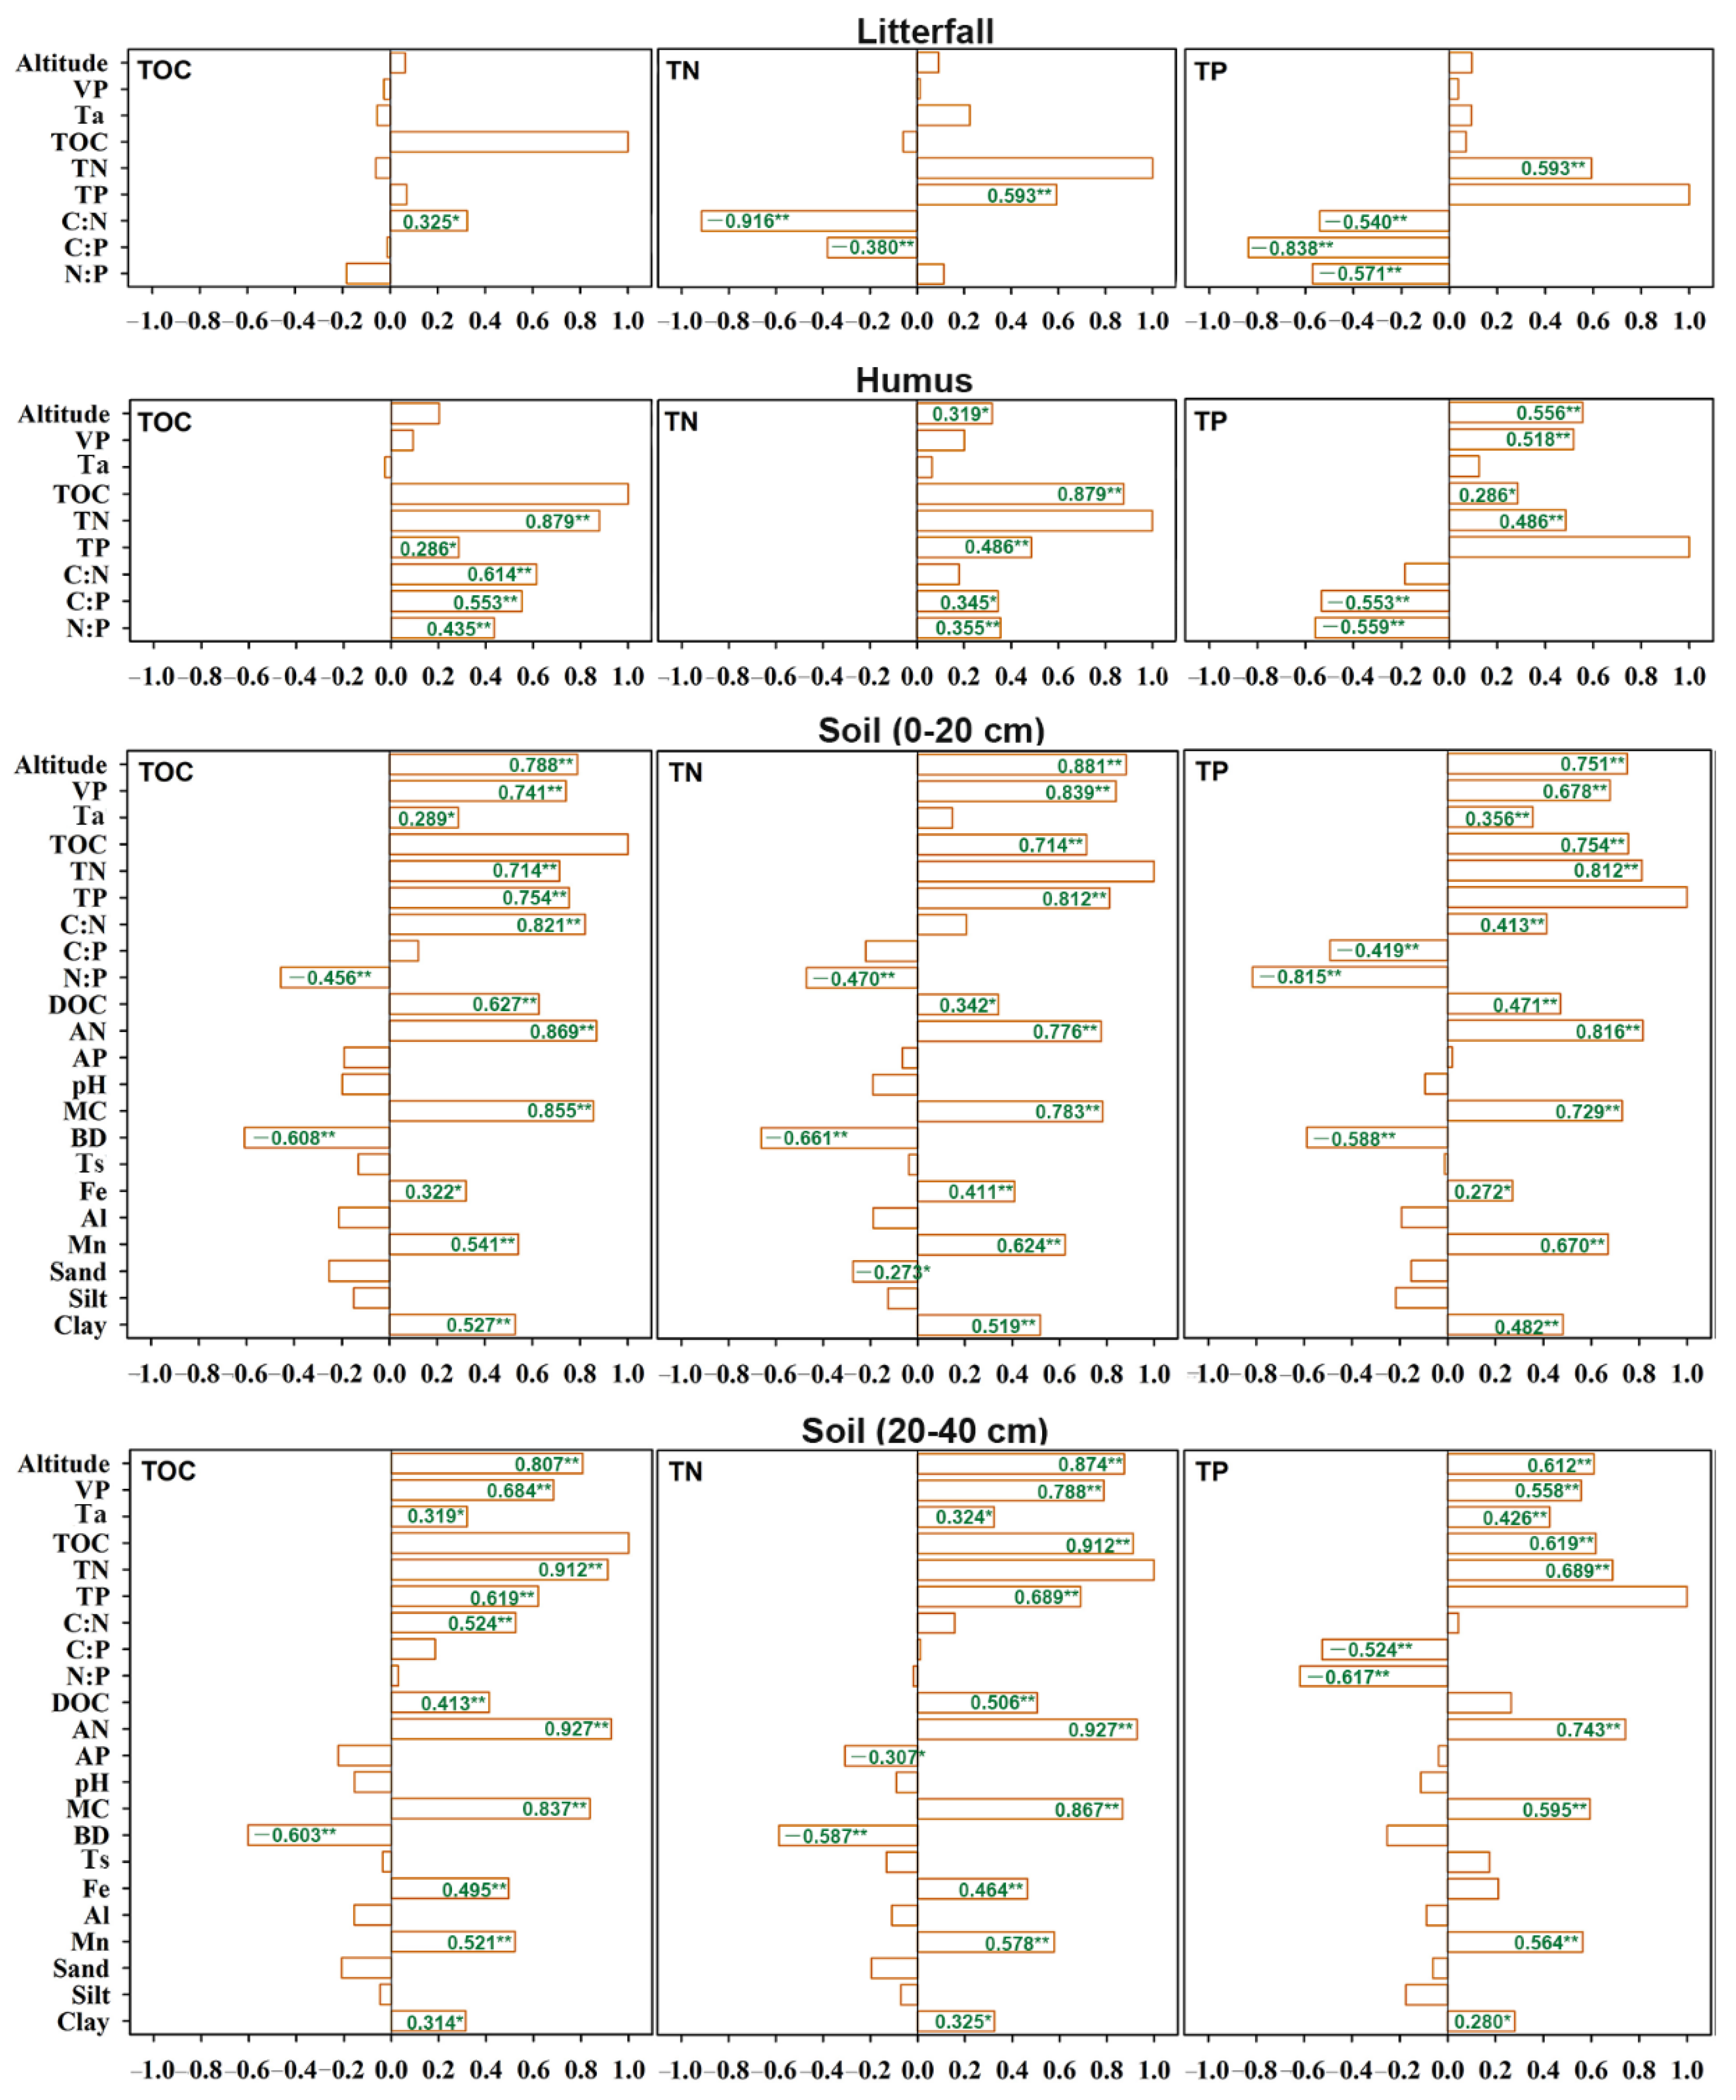
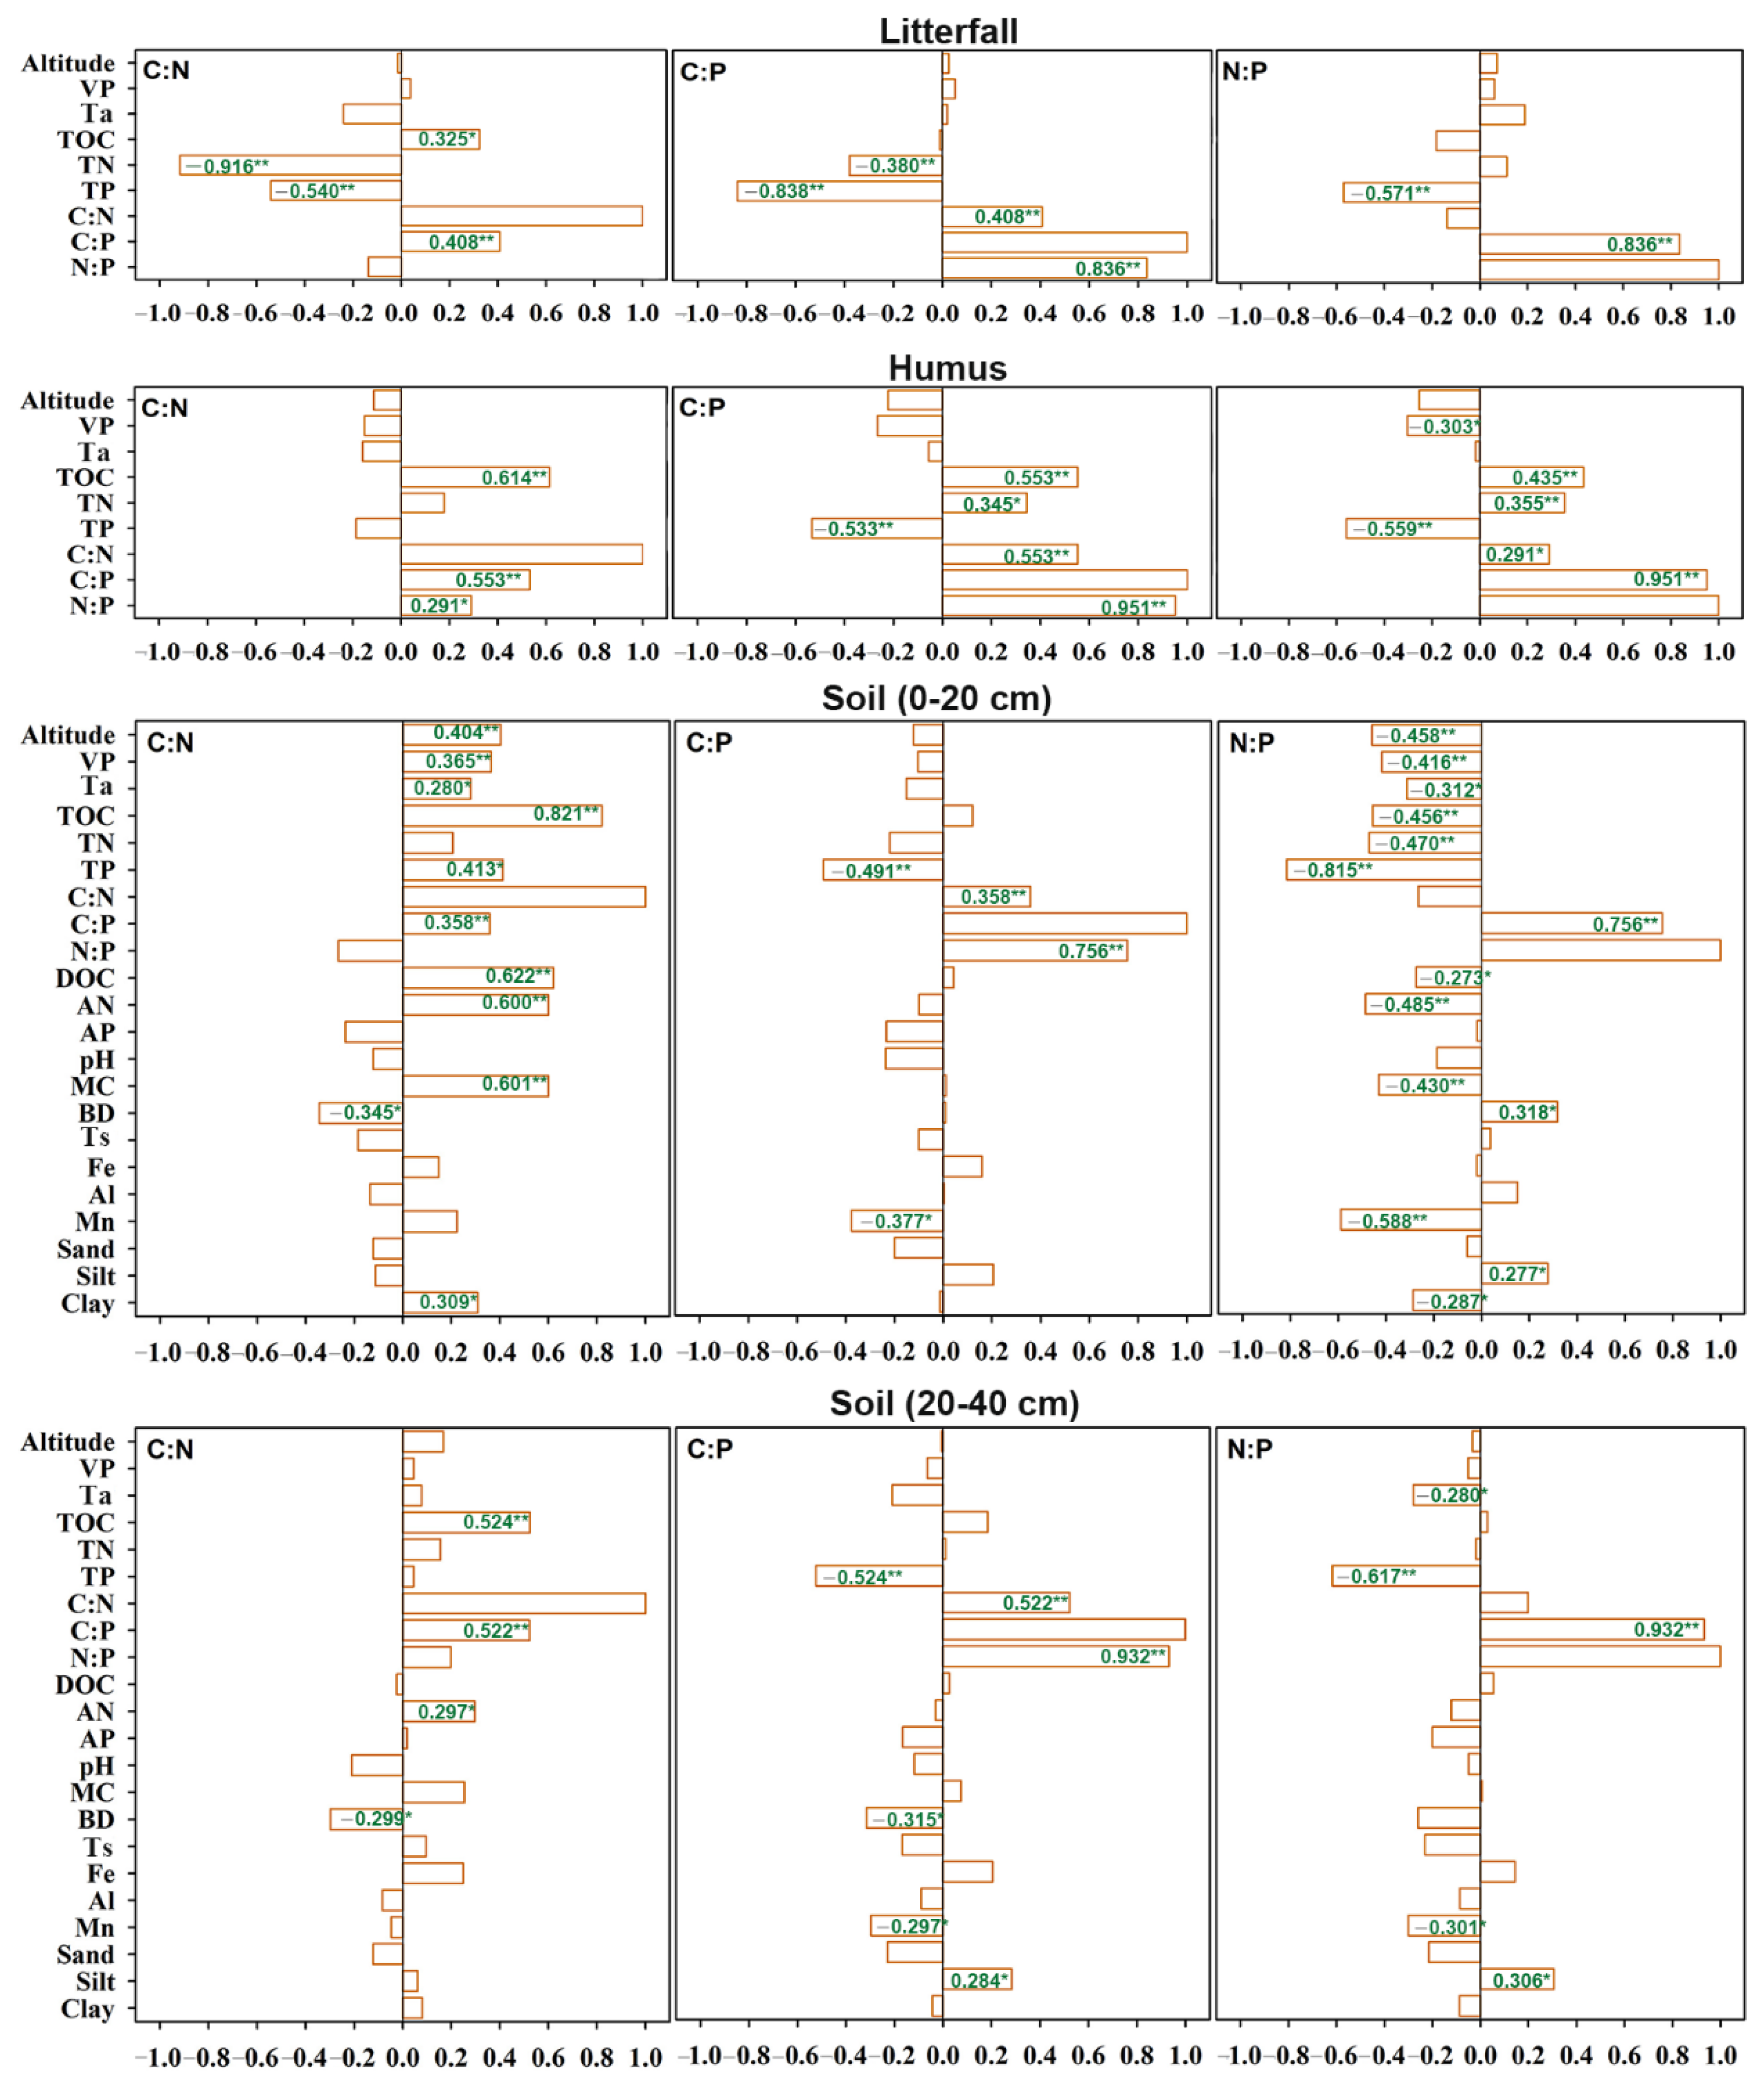
The relationship between the driving factors, the contents of C, N, and P, and their stoichiometry was analyzed using Pearson’s correlation (Figure 6 and Figure 7).
No significant correlations were observed between TOC, TN, and TP and their stoichiometry in litterfall and environmental factors including altitude, vegetation pattern, and air temperature. TOC, TN, and TP in litterfall were influenced by C:N. Additionally, TN and TP influenced each other and were also influenced by the C, N, P stoichiometry.
In humus, TOC, TN, and TP were related to each other. Humification (C:N) had a significant influence on TOC, whereas the influence was smaller on TN and TP. TN was significantly associated with altitude (p < 0.05), and TP was significantly associated with altitude and vegetation pattern (p < 0.01). C:N and C:P were not significantly associated with environmental factors; however, N:P was negatively correlated to vegetation patterns.
In the soil layers of 0–20 cm and 20–40 cm, TOC, TN, and TP contents were positively correlated with driving factors including altitude, vegetation pattern, air temperature, moisture content, total Fe, total Mn, and the fraction of clay and negatively related to bulk density. The association between contents of TOC, TN, and TP and environmental factors (altitude, vegetation pattern, and air temperature) in the 0–20 cm and 20–40 cm soil layers were greater than those in litterfall and humus. In addition, TOC, TN, and TP contents in the soil were correlated with each other and significantly correlated with DOC and AN, whereas their correlation with AP was comparatively not strong. C:N and N:P ratios were associated with a larger number of driving factors than C:P ratio in the soil. Moreover, the C:N and N:P ratios in the 0–20 cm soil had a stronger relationship with driving factors than those in the 20–40 cm soil.
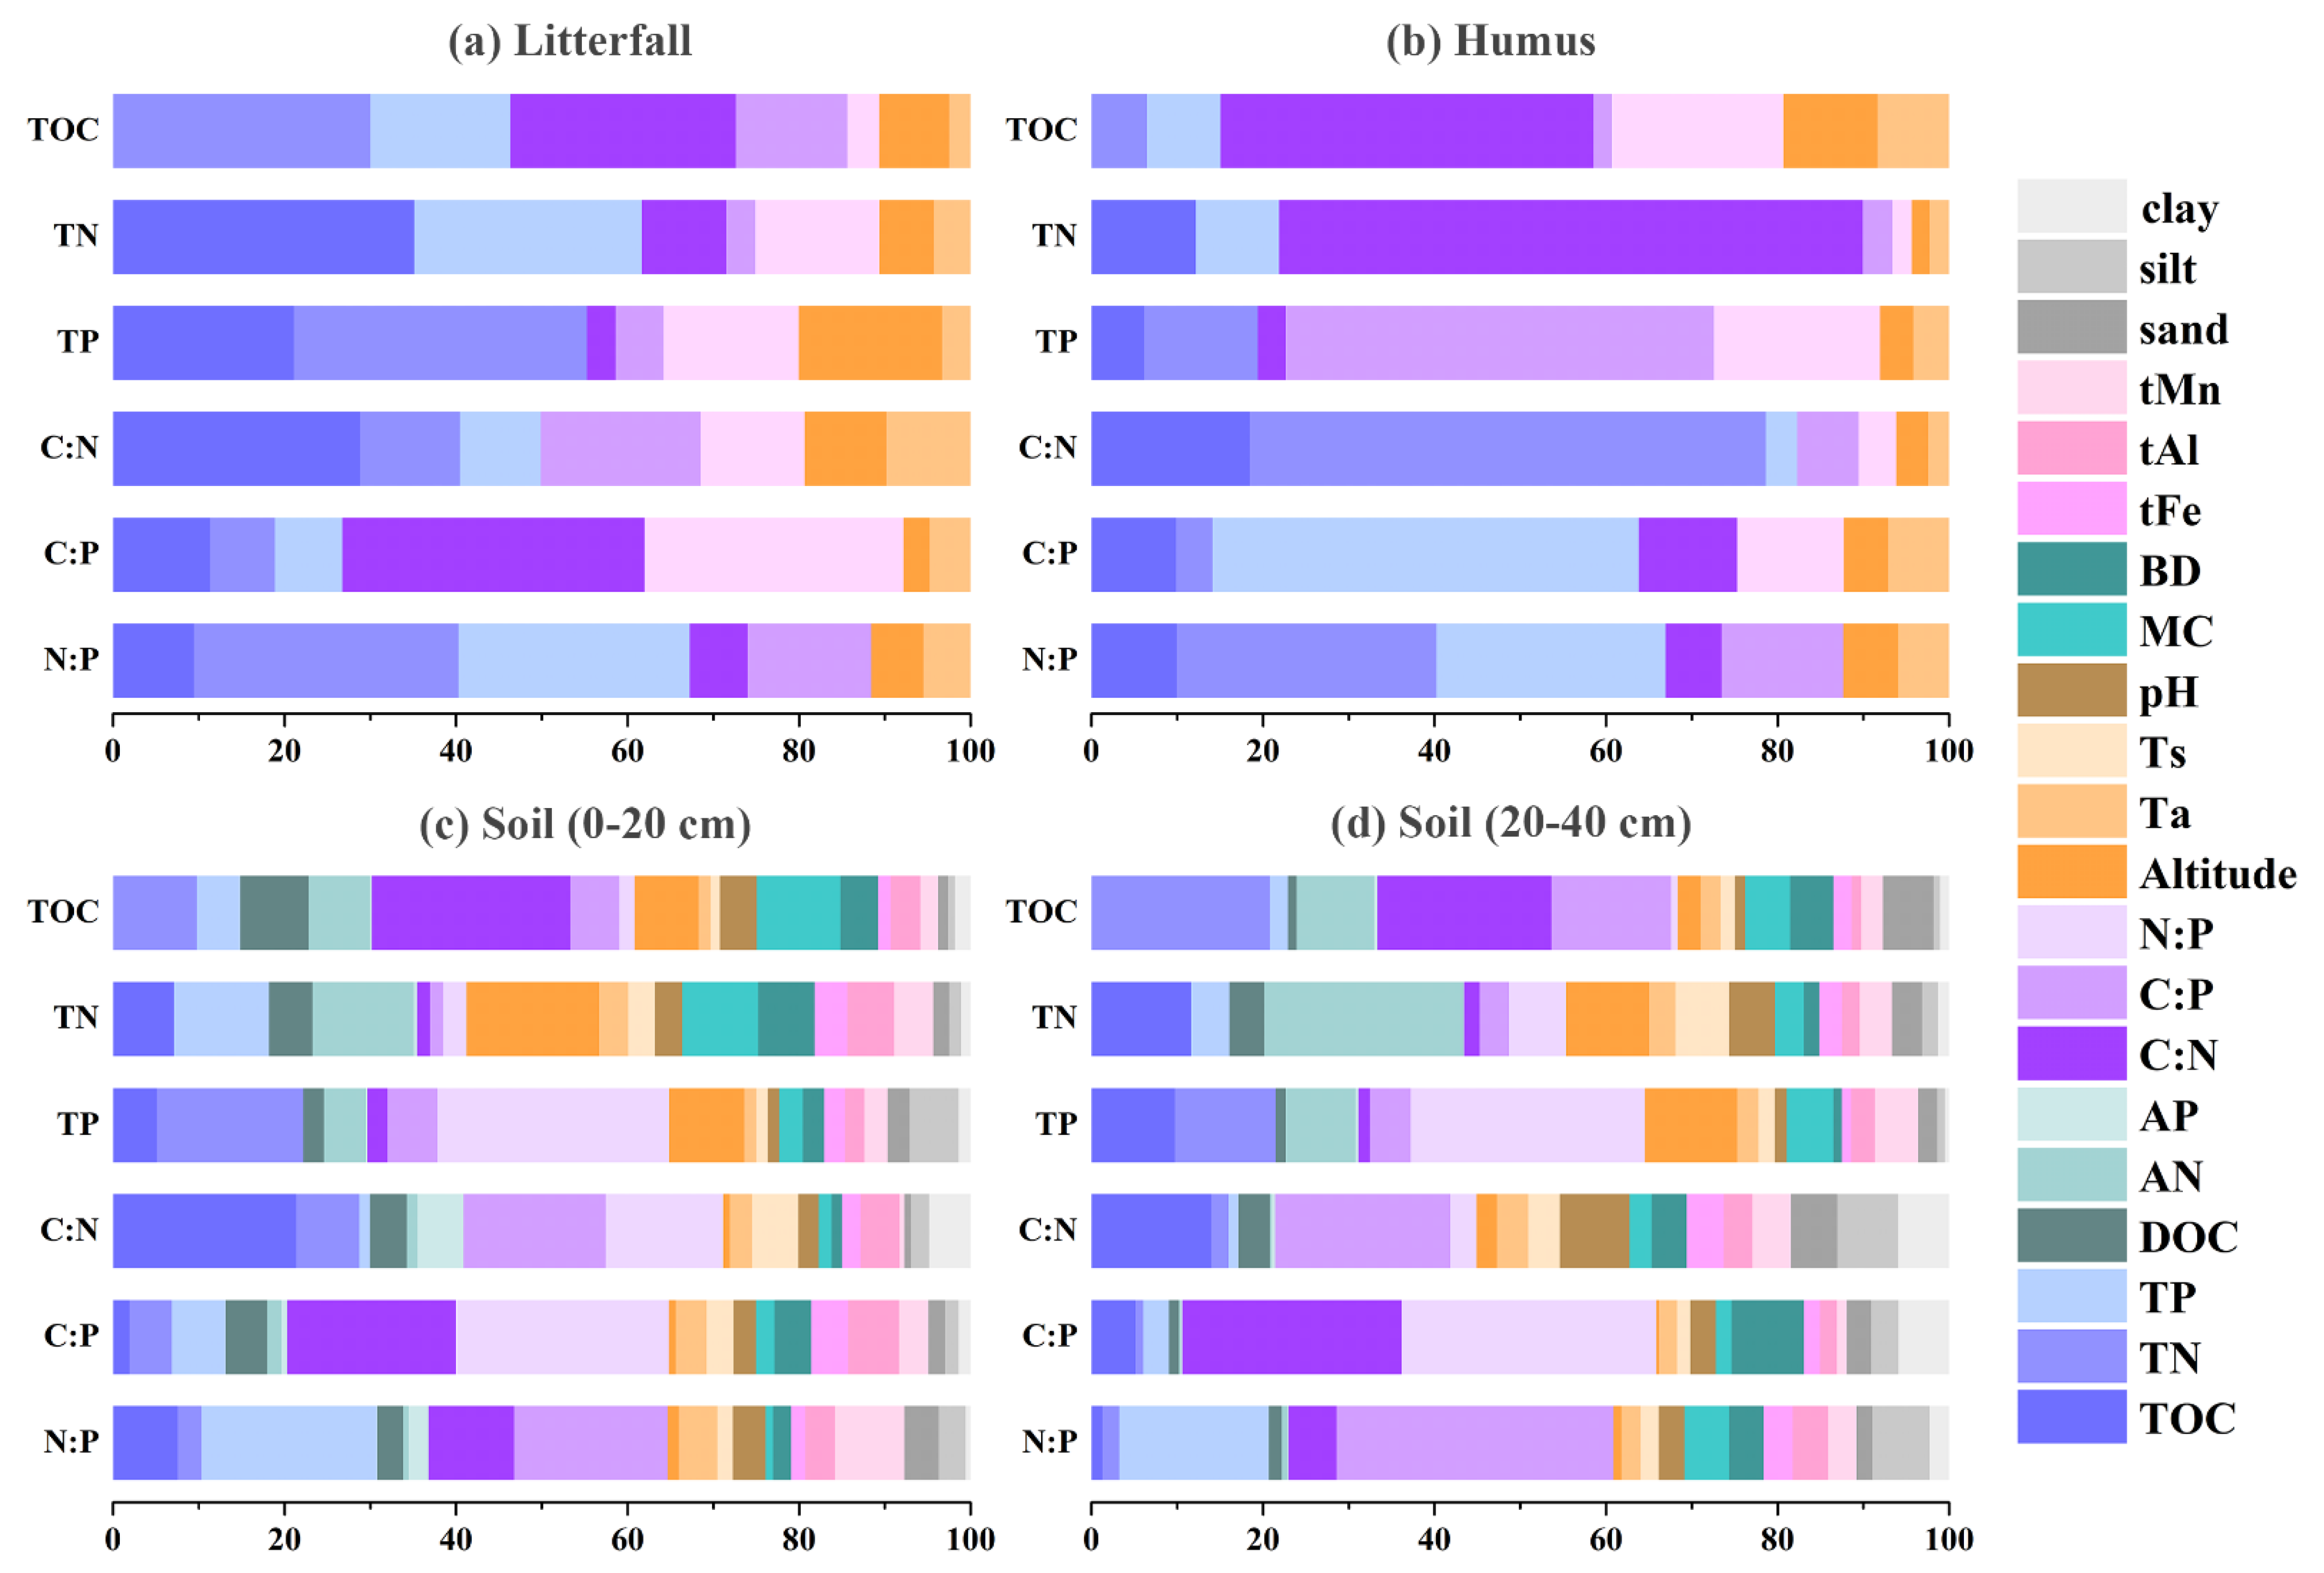
For a better analysis of the relative influence of various driving factors on the contents of C, N, and P and their stoichiometry, BRTs were conducted in litterfall, humus, and the soil layers of 0–20 cm and 20–40 cm (Figure 8, Table S5).
For litterfall and humus, TOC, TN, TP, C:N, C:P, and N:P contributed to each other. The environmental factors analyzed in BRTs only included altitude and air temperature. The vegetation pattern was excluded because its value was not fit for BRTs. Compared with other factors, environmental factors had a relatively small impact on TOC, TN, and TP and their stoichiometry, with a relative influence of 4.33–20.04%. Additionally, the C:N had a larger impact on TOC and TN in humus than that in litterfall.
For the 0–20 cm and 20–40 cm soil, TOC, TN, TP, C:N, C:P and N:P also contributed to each other. The environmental factors (altitude and air temperature) and soil properties (soil temperature, pH, moisture content, bulk density, tFe, tAl, tMn, sand, silt, and clay) affected the TOC, TN, and TP and their stoichiometry together, with a relative influence of 28.82%–58.75%. Additionally, the effect in TOC, TN, and TP for the 0–20 cm soil was larger than that for the 20–40 cm soil. Combining the results of the 0–20 cm and 20–40 cm soil, the effect of C:N on TOC was the largest, and altitude, metal ions (tFe, tAl, and tMn), and the particle size of the soil (sand, silt, and clay) were the important driving factors among environmental factors and soil properties for TOC, TN, and TP.
Combining the results of Pearson’s correlation analysis and BRTs, the TOC, TN, and TP contents were correlated with each other in humus and the 0–20 cm and 20–40 cm soil layers, indicating that the source of nutrients in humus and soil was similar and thus was controlled by some driving factors in common.
In litterfall, the TOC, TN, and TP were controlled by humification (C:N). Additionally, TN and TP restricted each other and thus limited plant growth together [24]. In humus, the humification was stronger so the effect of C:N on TOC and TN was larger than that in litterfall. Additionally, TP was less affected by humification than TOC and TN because of its special source stated in 3.1. Meanwhile, C:N was positively related to C:P and N:P. P is a vital component of RNA in the ribosomes of organisms and, the higher the P content, the faster the growth of organisms [66]. That is, the lower the C:P and N:P, the higher the humification degree (C:N).
Unexpectedly, the effect of altitude on TOC, TN, and TP content was the greatest in soil, followed by that in humus, and the least in litterfall. Studies have reported that the C, N, and P contents in soil principally originated from the decomposition of organic matter and soil weathering, which were dramatically regulated by altitude [67,68], and the C, N, and P contents originated from humification in humus were also partly affected by altitude [21]. In litterfall, the degree of humification was very low, and the C, N, and P were not significantly correlated with environmental factors; however, they were also not significantly affected by vegetation patterns. This could be because of the complexity of the outside environment.
For the 0–20 cm and 20–40 cm soil layers, the analysis of Pearson’s correlation showed that the contents of TOC, TN, and TP were positively associated with altitude, vegetation pattern, air temperature, moisture content, tFe, tMn, and the fraction of clay, and negatively correlated with bulk density, which was generally consistent with the results of BRTs. Considering the fact that the vegetation pattern changed vertically with increasing altitude in our study area, it is noteworthy that some studies reported that plants could absorb nutrients from the soil and the litterfall could serve as a medium returning the nutrients to the soil [49,64]. Therefore, different vegetation patterns could affect the accumulation of C, N, and P in soil. In this study, the soil moisture content raised and the soil bulk density decreased significantly with altitude. (Figures S3 and S4). The high air temperature and soil moisture content were more advantageous to soil weathering and promoted the accumulation of soil nutrients to some degree [69]. For example, the rocks could release 40%–60% of N in topsoil by chemical weathering [70]. Moreover, when experiencing strong chemical weathering, the soil could contain large clay minerals and have a greater power of fixation and accumulation of C, N, and P [71].
The soil bulk density is a vital index indicating soil porosity. The high values indicated the high compactness of soil and resulted in the condition of low moisture, air, and heat, which was not conducive to organic matter decomposition in soil [72]. This could explain why the TOC, TN, and TP contents in soil were negatively related to bulk density. However, the TP in the 20–40 cm soil layer was not related to bulk density. This could be because the TP in deeper soil was mainly originated from mineral weathering and affected by soil components [61]. In addition, the soil texture significantly influenced soil nutrients. Specifically, the fine-grained soil rich in clay could have a large surface area and high surface activity to stop the soil nutrients from leaching, and the SOC in the fine-grained fraction was more chemically recalcitrant because of the higher alkyl C to O-alkyl C ratio [73,74]. Thus, the TOC, TN, and TP contents in the soil were positively correlated with the fraction of clay, and the correlation was more significant in the 0–20 cm soil layer. In particular, the soil rich in clay could adsorb amorphous iron oxides and form a large number of aggregates, which reduced soil erosion and prevented nutrient loss from soil [75]. The contents of tFe, tAl, and tMn fluctuated with altitude (Figures S5–S7). In our study, the high tFe and tMn contents promoted the accumulation of C, N, and P in soil, which was explained by the aggregates of amorphous iron and manganese oxides with clay. Additionally, some previous studies suggested that iron minerals in acidic forest soils possessed the ability of adsorption and precipitation of P [76,77]. The iron minerals that were primarily produced by silicate mineral weathering existed in the surface soil [78]; as a result, the TP in the 20–40 cm soil layer was not correlated with tFe. From the result of RBTs and Pearson’s correlation analysis, the C:N, C:P, and N:P ratios in all layers were controlled by driving factors but not highly associated with them. In reality, the driving factors regulated primarily the TOC, TN, and TP concentrations, and consequently influenced their stoichiometry in litterfall, humus, and soil. In addition, the 0–20 cm soil layer was more sensitive to environmental conditions than the 20–40 cm soil layer; therefore, the TOC, TN, TP, C:N, and N:P in the 0–20 cm soil layer were more responsive to driving factors than that in the 20–40 cm soil layer.

4. Conclusions

This study revealed that the contents of TOC, TN, and TP, as well as their stoichiometry, and displayed different spatio-temporal patterns in the Shennongjia Forest. Litterfall and humus contained significantly more TOC, TN, and TP than soil and decreased from the topsoil to the deeper soil layer. However, the TP changed slightly with soil depth, resulting from the homogeneity of mineral weathering. C:N, C:P, and N:P ratios decreased from litterfall to humus, increased from humus to the 0–20 cm soil layer, and again decreased from the 0–20 cm to 20–40 cm soil layers; this was mainly induced by varying decomposition degrees and conversion mechanisms. In addition, the low N:P ratio indicated that N was a restrictive element in our study area. Only TN in litterfall and humus, DOC in soil, and C:N in litterfall was sensitive to the sampling times. Most importantly, the altitude controlled the variation of temperature, moisture content, bulk density, and vegetation pattern in the Shennongjia Forest. The contents of TOC, TN, and TP increased in all layers at high altitudes. Altitude, tFe, and tMn contents, and clay fraction had an effect on the contents of TOC, TN, and TP and the stoichiometry in soil ultimately.

Supplementary Materials

The following supporting information can be downloaded at: https://www.mdpi.com/article/10.3390/su142315855/s1, Table S1. Elemental information of sampling sites. Table S2. Statistical results of TOC, TN, and TP contents in litterfall, humus, and soil (0–20 and 20–40 cm) among three sampling time. Table S3. Statistical results of C:N, C:P, and N:P in litterfall, humus, and soil (0–20 and 20–40 cm) among three sampling time. Table S4. Statistical results of DOC, AN, and AP contents in soil (0–20 and 20–40 cm) among sampling time. Table S5. BRT model settings (learning rate, number of trees) and performance diagnostics (CV deviance, CV deviance SE, CV correction, CV corerelation SE) in the BRT model. Figure S1. Linear correlations between altitude and DOC, AN, and AP concentrations in soil (0–20 and 20–40 cm) for different sampling times (May, August, and December). The solid line represents a significant correlation and the dotted line represents a non-significant correlation. Figure S2. Linear correlations between altitude and C:N, C:P, and N:P ratios in different layers (litterfall, humus, and soil (0–20 and 20–40 cm)) for different sampling times (May, August, and December). The solid line represents a significant correlation and the dotted line represents a non-significant correlation. Figure S3. Distribution of moisture content of soil with altitude in May, August, and December. Background of white and gray represent different vegetations of mixed evergreen and deciduous broad-leaved forest, broadleaved deciduous forest, mixed broadleaf-conifer forest, coniferous forest and mountain shrub meadow zone from left to right. Figure S4. Distribution of bulk density of soil with altitude in May, August, and December. Background of white and gray represent different vegetations of mixed evergreen and deciduous broad-leaved forest, broadleaved deciduous forest, mixed broadleaf-conifer forest, coniferous forest and mountain shrub meadow zone from left to right. Figure S5. Distribution of tFe of soil with altitude in May, August, and December. Background of white and gray represent different vegetations of mixed evergreen and deciduous broad-leaved forest, broadleaved deciduous forest, mixed broadleaf-conifer forest, coniferous forest and mountain shrub meadow zone from left to right. Figure S6. Distribution of tAl of soil with altitude in May, August, and December. Background of white and gray represent different vegetations of mixed evergreen and deciduous broad-leaved forest, broadleaved deciduous forest, mixed broadleaf-conifer forest, coniferous forest and mountain shrub meadow zone from left to right. Figure S7. Distribution of tMn of soil with altitude in May, August, and December. Background of white and gray represent different vegetations of mixed evergreen and deciduous broad-leaved forest, broadleaved deciduous forest, mixed broadleaf-conifer forest, coniferous forest and mountain shrub meadow zone from left to right.

Author Contributions

Methodology, F.J. and L.C.; Software, F.J.; Investigation, F.J., L.C., J.Z., Z.C., X.W. and X.X.; Resources, J.Z., Z.C. and X.W.; Data curation, F.J. and J.Z.; Writing—original draft, F.J.; Writing—review & editing, F.J. and L.C.; Supervision, L.C.; Project administration, L.C. All authors have read and agreed to the published version of the manuscript.

Funding

This research was funded by the Natural Science Foundation of China grant number 41807207.

Institutional Review Board Statement

Not applicable.

Informed Consent Statement

Not applicable.

Data Availability Statement

The data sources presented in this study are available in the manuscript.

Acknowledgments

The authors would like to thank Wenkai Qiu for his assistance with the instrument application.

Conflicts of Interest

The authors declare no conflict of interest.

References

  1. Marschner, H. Marschner’s Mineral Nutrition of Higher Plants; Academic Press: London, UK, 2012. [Google Scholar]
  2. He, J.Z.; Zheng, Y.; Qu, J. Soil environmental micro-interfaces and pollution control. Huanjing Kexue Xuebao/Acta Sci. Circumstantiae 2009, 29, 21–27. [Google Scholar]
  3. Wang, M.; Gong, Y.; Lafleur, P.; Wu, Y. Patterns and drivers of carbon, nitrogen and phosphorus stoichiometry in Southern China’s grasslands. Sci. Total Environ. 2021, 785, 147201. [Google Scholar] [CrossRef]
  4. Buchkowski, R.; Schmitz, O.; Bradford, M. Microbial stoichiometry overrides biomass as a regulator of soil carbon and nitrogen cycling. Ecology 2015, 96, 1139–1149. [Google Scholar] [CrossRef] [Green Version]
  5. Wang, X.G.; Lu, X.T.; Han, X.G. Responses of nutrient concentrations and stoichiometry of senesced leaves in dominant plants to nitrogen addition and prescribed burning in a temperate steppe. Ecol. Eng. 2014, 70, 154–161. [Google Scholar] [CrossRef]
  6. Liu, L.; Gundersen, P.; Zhang, T.; Mo, J.M. Effects of phosphorus addition on soil microbial biomass and community composition in three forest types in tropical China. Soil Biol. Biochem. 2012, 44, 31–38. [Google Scholar] [CrossRef]
  7. Sistla, S.A.; Schimel, J.P. Stoichiometric flexibility as a regulator of carbon and nutrient cycling in terrestrial ecosystems under change. New Phytol. 2021, 196, 68–78. [Google Scholar] [CrossRef] [PubMed]
  8. Cleveland, C.C.; Houlton, B.Z.; Smith, W.K.; Marklein, A.R.; Reed, S.C.; Parton, W.; Del Grosso, S.J.; Running, S.W. Patterns of new versus recycled primary production in the terrestrial biosphere. Proc. Natl. Acad. Sci. USA 2013, 110, 12733–12737. [Google Scholar] [CrossRef] [PubMed] [Green Version]
  9. Zhou, Y.; Wang, L.F.; Chen, Y.M.; Zhang, J.; Liu, Y. Litter stoichiometric traits have stronger impact on humification than environment conditions in an alpine treeline ecotone. Plant Soil 2020, 453, 545–560. [Google Scholar] [CrossRef]
  10. Chadwick, O.A.; Derry, L.A.; Vitousek, P.M.; Huebert, B.J.; Hedin, L.O. Changing sources of nutrients during four million years of ecosystem development. Nature 1999, 397, 491–497. [Google Scholar] [CrossRef]
  11. Leff, J.W.; Wieder, W.R.; Taylor, P.G.; Townsend, A.R.; Nemergut, D.R.; Grandy, A.S.; Cleveland, C.C. Experimental litterfall manipulation drives large and rapid changes in soil carbon cycling in a wet tropical forest. Glob. Change Biol. 2012, 18, 2969–2979. [Google Scholar] [CrossRef] [PubMed]
  12. Santiago, L.S. Nutrient limitation of eco-physiological processes in tropical trees. Trees 2015, 29, 1291–1300. [Google Scholar] [CrossRef]
  13. Elser, J.J.; Andersen, T.; Baron, J.S.; Bergstroem, A.K.; Jansson, M.; Kyle, M.; Nydick, K.R.; Steger, L.; Hessen, D.O. Shifts in lake N:P stoichiometry and nutrient limitation driven by atmospheric nitrogen deposition. Science 2009, 326, 835–837. [Google Scholar] [CrossRef] [PubMed]
  14. Sardans, J.; Rivas-Ubach, A.; Peñuelas, J. The C:N:P stoichiometry of organisms and ecosystems in a changing world: A review and perspectives. Perspect. Plant Ecol. Evol. Syst. 2012, 14, 33–47. [Google Scholar] [CrossRef]
  15. Yang, Y.; Fang, J.; Ji, C.; Datta, A.; Li, P.; Ma, W.; Mohammat, A.; Shen, H.; Hu, H.; Knapp, B.O.; et al. Stoichiometric shifts in surface soils over broad geographical scales: Evidence from China’s grasslands. Glob. Ecol. Biogeogr. 2014, 23, 947–955. [Google Scholar] [CrossRef]
  16. Hui, D.F.; Yang, X.T.; Deng, Q.; Liu, Q.; Wang, X.; Yang, H.; Ren, H. Soil C:N:P stoichiometry in tropical forests on Hainan Island of China: Spatial and vertical variations. Catena 2021, 201, 105228. [Google Scholar] [CrossRef]
  17. Liu, F.T.; Wang, X.Q.; Chi, Q.H.; Tian, M. Spatial variations in soil organic carbon, nitrogen, phosphorus contents and controlling factors across the “Three Rivers” regions of southwest China. Sci. Total Environ. 2021, 794, 148795. [Google Scholar] [CrossRef]
  18. Perez-Quezada, J.F.; Pérez, C.A.; Brito, C.E.; Fuentes, J.P.; Gaxiola, A.; Aguilera-Riquelme, D.; Lopatin, J. Biotic and abiotic drivers of carbon, nitrogen and phosphorus stocks in a temperate rainforest. For. Ecol. Manag. 2021, 494, 119341. [Google Scholar] [CrossRef]
  19. Soethe, N.; Lehmann, J.; Engels, C. Carbon and nutrient stocks in roots of forests at different altitudes in the Ecuadorian Andes. J. Trop. Ecol. 2007, 23, 319–328. [Google Scholar] [CrossRef] [Green Version]
  20. Sundqvist, M.K.; Wardle, D.A.; Vincent, A.; Giesler, R. Contrasting nitrogen and phosphorus dynamics across an elevational gradient for subarctic tundra heath and meadow vegetation. Plant Soil 2014, 383, 387–399. [Google Scholar] [CrossRef]
  21. Lu, S.J.; Si, J.H.; Qi, Y.; Wang, Z.Q.; Wu, X.C.; Hou, C.Y. Distribution characteristics of TOC, TN and TP in the wetland sediments of Longbao Lake in the San-Jiang head waters. Acta Geophys. 2016, 64, 2471–2486. [Google Scholar] [CrossRef] [Green Version]
  22. Wang, Z.C.; He, G.X.; Hou, Z.H.; Luo, Z.; Chen, S.X.; Lu, J.; Zhao, J. Soil C:N:P stoichiometry of typical coniferous (Cunninghamia lanceolata) and/or evergreen broadleaved (Phoebe bournei) plantations in south China. For. Ecol. Manag. 2021, 486, 118974. [Google Scholar] [CrossRef]
  23. Hu, Q.J.; Sheng, M.Y.; Bai, Y.X.; Jie, Y.; Xiao, H.L. Response of C, N, and P stoichiometry characteristics of Broussonetia papyrifera to altitude gradients and soil nutrients in the karst rocky ecosystem, SW China. Plant Soil 2020, 475, 123–136. [Google Scholar] [CrossRef]
  24. Bangroo, S.A.; Najar, G.R.; Rasool, A. Effect of altitude and aspect on soil organic carbon and nitrogen stocks in the Himalayan Mawer Forest Range. Catena 2017, 158, 63–68. [Google Scholar] [CrossRef]
  25. Svensson, T.; Sandén, P.; Bastviken, D.; Öberg, G. Chlorine transport in a small catchment in southeast Sweden during two years. Biogeochemistry 2007, 82, 181–199. [Google Scholar] [CrossRef]
  26. Zhao, C.M.; Chen, W.L.; Tian, Z.Q.; Xie, Z.Q. Altitudinal pattern of plant species diversity in Shennongjia mountains, central China. J. Integr. Plant Biol. 2005, 47, 1431–1449. [Google Scholar] [CrossRef]
  27. Wang, M.; Wang, C.H.; Yang, L.; Guo, H. Impacts of short-term nitrogen addition on the thallus nitrogen and phosphorus balance of the dominant epiphytic lichens in the Shennongjia mountains, China. J. Plant Ecol. 2019, 12, 751–758. [Google Scholar] [CrossRef]
  28. Dang, H.S.; Zhang, Y.J.; Zhang, K.R.; Jiang, M.X.; Zhang, Q.F. Climate-growth relationships of subalpine fir (Abies fargesii) across the altitudinal range in the Shennongjia Mountains, central China. Clim. Chang. 2013, 117, 903–917. [Google Scholar] [CrossRef]
  29. Wang, H.; Hou, P.; Jiang, J.B.; Xiao, R.L.; Zhai, J.; Fu, Z.; Hou, J. Ecosystem health assessment of Shennongjia National Park, China. Sustainability 2020, 12, 7672. [Google Scholar] [CrossRef]
  30. Zhong, Z.L.; Bing, H.J.; Xiang, Z.X.; Wu, Y.H.; Zhou, J.; Ding, S.M. Terrain-modulated deposition of atmospheric lead in the soils of alpine forest, central China. Sci. Total Environ. 2021, 790, 148106. [Google Scholar] [CrossRef] [PubMed]
  31. Borovec, J.; Sirová, D.; Mošnerová, P.; Rejmánková, E.; Vrba, J. Spatial and temporal changes in phosphorus partitioning within a freshwater cyanobacterial mat community. Biogeochemistry 2010, 101, 323–333. [Google Scholar] [CrossRef]
  32. Kaal, J.; Costa-Casais, M.; Ferro-Vázquez, C.; Pontevedra-Pombal, X.; Martínez-Cortizas, A. Soil formation of “Atlantic Rankers” from NW Spain—A high resolution aluminium and iron fractionation study. Pedosphere 2008, 18, 441–453. [Google Scholar] [CrossRef]
  33. Vereecken, H.; Maes, J.; Feyen, J.; Darius, P. Estimating the soil moisture retention characteristic from texture, bulk density, and carbon content. Soil Sci. 1989, 148, 389–403. [Google Scholar] [CrossRef]
  34. Chen, D.V.; Ding, J. Study on Influencing Factors of Measurement of Total Nitrogen by Digestion with UV-Alkaline Potassium Persulfate and Reduction with Hydrazine Sulphate Spectrophotometric Method and Application. 2008. Available online: https://ieeexplore.ieee.org/stamp/stamp.jsp?tp=&arnumber=4536020&tag=1 (accessed on 14 September 2022).
  35. Hadas, A.; Kautsky, L.; Goek, M.; Erman Kara, E. Rates of decomposition of plant residues and available nitrogen in soil, related to residue composition through simulation of carbon and nitrogen turnover. Soil Biol. Biochem. 2004, 36, 255–266. [Google Scholar] [CrossRef]
  36. Wilson, S.D.; Kleb, H.R. The influence of prairie and forest vegetation on soil moisture and available nitrogen. Am. Midl. Nat. 1996, 136, 222. [Google Scholar] [CrossRef]
  37. Zibilske, L.M.; Bradford, J.M.; Smart, J.R. Conservation tillage induced changes in organic carbon, total nitrogen and available phosphorus in a semi-arid alkaline subtropical soil. Soil Tillage Res. 2002, 66, 153–163. [Google Scholar] [CrossRef]
  38. Tüzen, M. Determination of heavy metals in soil, mushroom and plant samples by atomic absorption spectrometry. Microchem. J. 2003, 74, 289–297. [Google Scholar] [CrossRef]
  39. De’Ath, G. Boosted trees for ecological modeling and prediction. Ecology 2007, 88, 243–251. [Google Scholar] [CrossRef]
  40. Frey, S.J.K.; Hadley, A.S.; Johnson, S.L.; Schulze, M.; Jones, J.A.; Betts, M.G. Spatial models reveal the microclimatic buffering capacity of old-growth forests. Sci. Adv. 2016, 2, e1501392. [Google Scholar] [CrossRef] [PubMed] [Green Version]
  41. Zeng, Z.Z.; Chen, A.P.; Piao, S.L.; Rabin, S.; Shen, Z.H. Environmental determinants of tropical forest and savanna distribution: A quantitative model evaluation and its implication. J. Geophys. Res. Biogeosci. 2014, 119, 1432–1445. [Google Scholar] [CrossRef]
  42. Liu, R.; Ma, T.; Qiu, W.K.; Peng, Z.Q.; Shi, C.X. The environmental functions and ecological effects of organic carbon in silt. J. Earth Sci. 2020, 31, 834–844. [Google Scholar] [CrossRef]
  43. Hu, L.; Ade, L.J.; Wu, X.W.; Zi, H.B.; Luo, X.P.; Wang, C.T. Changes in soil C:N:P stoichiometry and microbial structure along soil depth in two forest soils. Forests 2019, 10, 113. [Google Scholar] [CrossRef]
  44. Yu, P.; Zhang, X.; Gu, H.Y.; Pan, J.P.; Chen, X.W. Soil phosphorus fractions and their availability over natural succession from clear-cut of a mixed broadleaved and Korean pine forest in northeast China. J. For. Res. 2022, 33, 253–260. [Google Scholar] [CrossRef]
  45. Smeck, N.E. Phosphorus dynamics in soils and landscapes. Geoderma 1985, 36, 185–199. [Google Scholar] [CrossRef]
  46. Chen, X.; Feng, J.G.; Ding, Z.J.; Tang, M.; Zhu, B. Changes in soil total, microbial and enzymatic C-N-P contents and stoichiometry with depth and latitude in forest ecosystems. Sci. Total Environ. 2022, 816, 151583. [Google Scholar] [CrossRef]
  47. Wei, X.Y.; Yang, Y.L.; Shen, Y.; Chen, Z.H.; Dong, Y.L.; Wu, F.Z.; Zhang, L. Effects of Litterfall on the Accumulation of Extracted Soil Humic Substances in Subalpine Forests. Front. Plant Sci. 2020, 11, 254. [Google Scholar] [CrossRef] [PubMed]
  48. Norby, R.J.; Cotrufo, M.F. Global change: A question of litter quality. Nature 1998, 396, 17–18. [Google Scholar] [CrossRef]
  49. Bing, H.J.; Wu, Y.H.; Zhou, J.; Sun, H.Y.; Luo, J.; Wang, J.P.; Yu, D. Stoichiometric variation of carbon, nitrogen, and phosphorus in soils and its implication for nutrient limitation in alpine ecosystem of Eastern Tibetan Plateau. J. Soils Sediments 2016, 16, 405–416. [Google Scholar] [CrossRef]
  50. Boutton, T.W.; Liao, J.D. Changes in soil nitrogen storage and δ15N with woody plant encroachment in a subtropical savanna parkland landscape. J. Geophys. Res. 2010, 115, G03019. [Google Scholar] [CrossRef] [Green Version]
  51. Tessier, J.T.; Raynal, D.J. Vernal nitrogen and phosphorus retention by forest understory vegetation and soil microbes. Plant Soil 2003, 256, 443–453. [Google Scholar] [CrossRef]
  52. Reich, P.B.; Oleksyn, J. Global patterns of plant leaf N and P in relation to temperature and latitude. Proc. Natl. Acad. Sci. USA 2004, 101, 11001–11006. [Google Scholar] [CrossRef] [Green Version]
  53. Han, W.X.; Fang, J.Y.; Guo, D.L.; Zhang, Y. Leaf nitrogen and phosphorus stoichiometry across 753 terrestrial plant species in China. New Phytol. 2005, 168, 377–385. [Google Scholar] [CrossRef] [PubMed]
  54. Öberg, G.; Holm, M.; Sandén, P.; Svensson, T.; Parikka, M. The role of organic-matter-bound chlorine in the chlorine cycle: A case study of the Stubbetorp Catchment, Sweden. Biogeochemistry 2005, 75, 241–269. [Google Scholar] [CrossRef]
  55. Kaiser, K.; Kaupenjohann, M.; Zech, W. Sorption of dissolved organic carbon in soils: Effects of soil sample storage, soil-to-solution ratio, and temperature. Geoderma 2001, 99, 317–328. [Google Scholar] [CrossRef]
  56. Weintraub, M.N.; Scott-Denton, L.E.; Schmidt, S.K.; Monson, R.K. The effects of tree rhizodeposition on soil exoenzyme activity, dissolved organic carbon, and nutrient availability in a subalpine forest ecosystem. Oecologia 2007, 154, 327–338. [Google Scholar] [CrossRef]
  57. Kopáček, J.; Evans, C.D.; Hejzlar, J.; Kaňa, J.; Porcal, P.; Šantrůčková, H. Factors affecting the leaching of dissolved organic carbon after tree dieback in an Unmanaged European Mountain Forest. Environ. Sci. Technol. 2018, 52, 6291–6299. [Google Scholar] [CrossRef] [PubMed] [Green Version]
  58. Gao, J.G.; Zhao, P.; Shen, W.J.; Rao, X.Q.; Hu, Y.T. Physiological homeostasis and morphological plasticity of two tree species subjected to precipitation seasonal distribution changes. Perspect. Plant Ecol. Evol. Syst. 2017, 25, 1–19. [Google Scholar] [CrossRef]
  59. Li, W.B.; Jin, C.J.; Guan, D.X.; Wang, Q.K.; Wang, A.Z.; Yuan, F.H.; Wu, J.B. The effects of simulated nitrogen deposition on plant root traits: A meta-analysis. Soil Biol. Biochem. 2015, 82, 112–118. [Google Scholar] [CrossRef]
  60. Oleksyn, J.; Reich, P.B.; Zytkowiak, R.; Karolewski, P.; Tjoelker, M.G. Nutrient conservation increases with latitude of origin in European Pinus sylvestris populations. Oecologia 2003, 136, 220–235. [Google Scholar] [CrossRef]
  61. Zhou, T.; Geng, Y.J.; Ji, C.; Xu, X.R.; Wang, H.; Pan, J.J.; Bumberger, J.; Haase, D.; Lausch, A. Prediction of soil organic carbon and the C:N ratio on a national scale using machine learning and satellite data: A comparison between Sentinel-2, Sentinel-3 and Landsat-8 images. Sci. Total Environ. 2021, 755, 142661. [Google Scholar] [CrossRef] [PubMed]
  62. Gerdol, R.; Iacumin, P.; Brancaleoni, L. Differential effects of soil chemistry on the foliar resorption of nitrogen and phosphorus across altitudinal gradients. Funct. Ecol. 2019, 33, 1351–1361. [Google Scholar] [CrossRef]
  63. Xu, G.C.; Li, Z.B.; Li, P.; Zhang, T.G.; Cheng, S.D. Spatial variability of soil available phosphorus in a typical watershed in the source area of the middle Dan River, China. Environ. Earth Sci. 2014, 71, 3953–3962. [Google Scholar] [CrossRef]
  64. McGroddy, M.E.; Daufresne, T.; Hedin, L.O. Scaling of C:N:P stoichiometry in forests worldwide: Implications of terrestrial redfield-type ratios. Ecology 2004, 85, 2390–2401. [Google Scholar] [CrossRef]
  65. Cao, Y.M.; Chen, Y. Ecosystem C:N:P stoichiometry and carbon storage in plantations and a secondary forest on the Loess Plateau, China. Ecol. Eng. 2017, 105, 125–132. [Google Scholar] [CrossRef]
  66. Qualls, R.G.; Richardson, C.J. Phosphorus enrichment affects litter decomposition, immobilization, and soil microbial phosphorus in Wetland Mesocosms. Soil Sci. Soc. Am. J. 2020, 64, 799–808. [Google Scholar] [CrossRef] [Green Version]
  67. Huggett, R.J. Soil chronosequences, soil development, and soil evolution: A critical review. Catena 1998, 32, 155–172. [Google Scholar] [CrossRef]
  68. Torn, M.S.; Trumbore, S.E.; Chadwick, O.A.; Vitousek, P.M.; Hendricks, D.M. Mineral control of soil organic carbon storage and turnover. Nature 1997, 389, 170–173. [Google Scholar] [CrossRef] [Green Version]
  69. Morford, S.L.; Houlton, B.Z.; Dahlgren, R.A. Direct quantification of long-term rock nitrogen inputs to temperate forest ecosystems. Ecology 2016, 97, 54–64. [Google Scholar] [CrossRef] [PubMed] [Green Version]
  70. Houlton, B.Z.; Morford, S.L.; Dahlgren, R.A. Convergent evidence for widespread rock nitrogen sources in Earth’s surface environment. Science 2018, 360, 58–62. [Google Scholar] [CrossRef] [PubMed] [Green Version]
  71. Kabala, C.; Chachulski, A.; Gądek, B.; Korabiewski, B.; Mętrak, M.; Suska-Malawska, M. Soil development and spatial differentiation in a glacial river valley under cold and extremely arid climate of East Pamir Mountains. Sci. Total Environ. 2021, 758, 144308. [Google Scholar] [CrossRef]
  72. Abera, T.; Bekele, L. Soil bulk density, soil moisture content and yield of Tef (Eragrostis tef) influenced by Acacia seyal Del canopy in Parkland agro-forestry system. J. Soil Sci. Environ. Manag. 2019, 10, 124–129. [Google Scholar] [CrossRef] [Green Version]
  73. Quijano, L.; Kuhn, N.J.; Navas, A. Effects of interrill erosion on the distribution of soil organic and inorganic carbon in different sized particles of Mediterranean Calcisols. Soil Tillage Res. 2020, 196, 104461. [Google Scholar] [CrossRef]
  74. Zhou, W.X.; Han, G.L.; Liu, M.; Zeng, J.; Liang, B.; Liu, J.K.; Qu, R. Determining the distribution and interaction of soil organic carbon, nitrogen, pH and texture in soil profiles: A Case Study in the Lancangjiang River Basin, Southwest China. Forests 2020, 11, 532. [Google Scholar] [CrossRef]
  75. Zhang, K.; Su, Y.Z.; Yang, R. Variation of soil organic carbon, nitrogen, and phosphorus stoichiometry and biogeographic factors across the desert ecosystem of Hexi Corridor, northwestern China. J. Soils Sediments 2019, 19, 49–57. [Google Scholar] [CrossRef]
  76. Olander, L.P.; Vitousek, P.M. Biological and geochemical sinks for phosphorus in soil from a Wet Tropical Forest. Ecosystems 2004, 7, 404–419. [Google Scholar] [CrossRef]
  77. Vitousek, P.M.; Porder, S.; Houlton, B.Z.; Chadwick, O.A. Terrestrial phosphorus limitation: Mechanisms, implications, and nitrogen-phosphorus interactions. Ecol. Appl. 2010, 20, 5–15. [Google Scholar] [CrossRef] [PubMed] [Green Version]
  78. Colombo, C.; Palumbo, G.; He, J.; Pinton, R.; Cesco, S. Review on iron availability in soil: Interaction of Fe minerals, plants, and microbes. J. Soils Sediments 2014, 14, 538–548. [Google Scholar] [CrossRef]
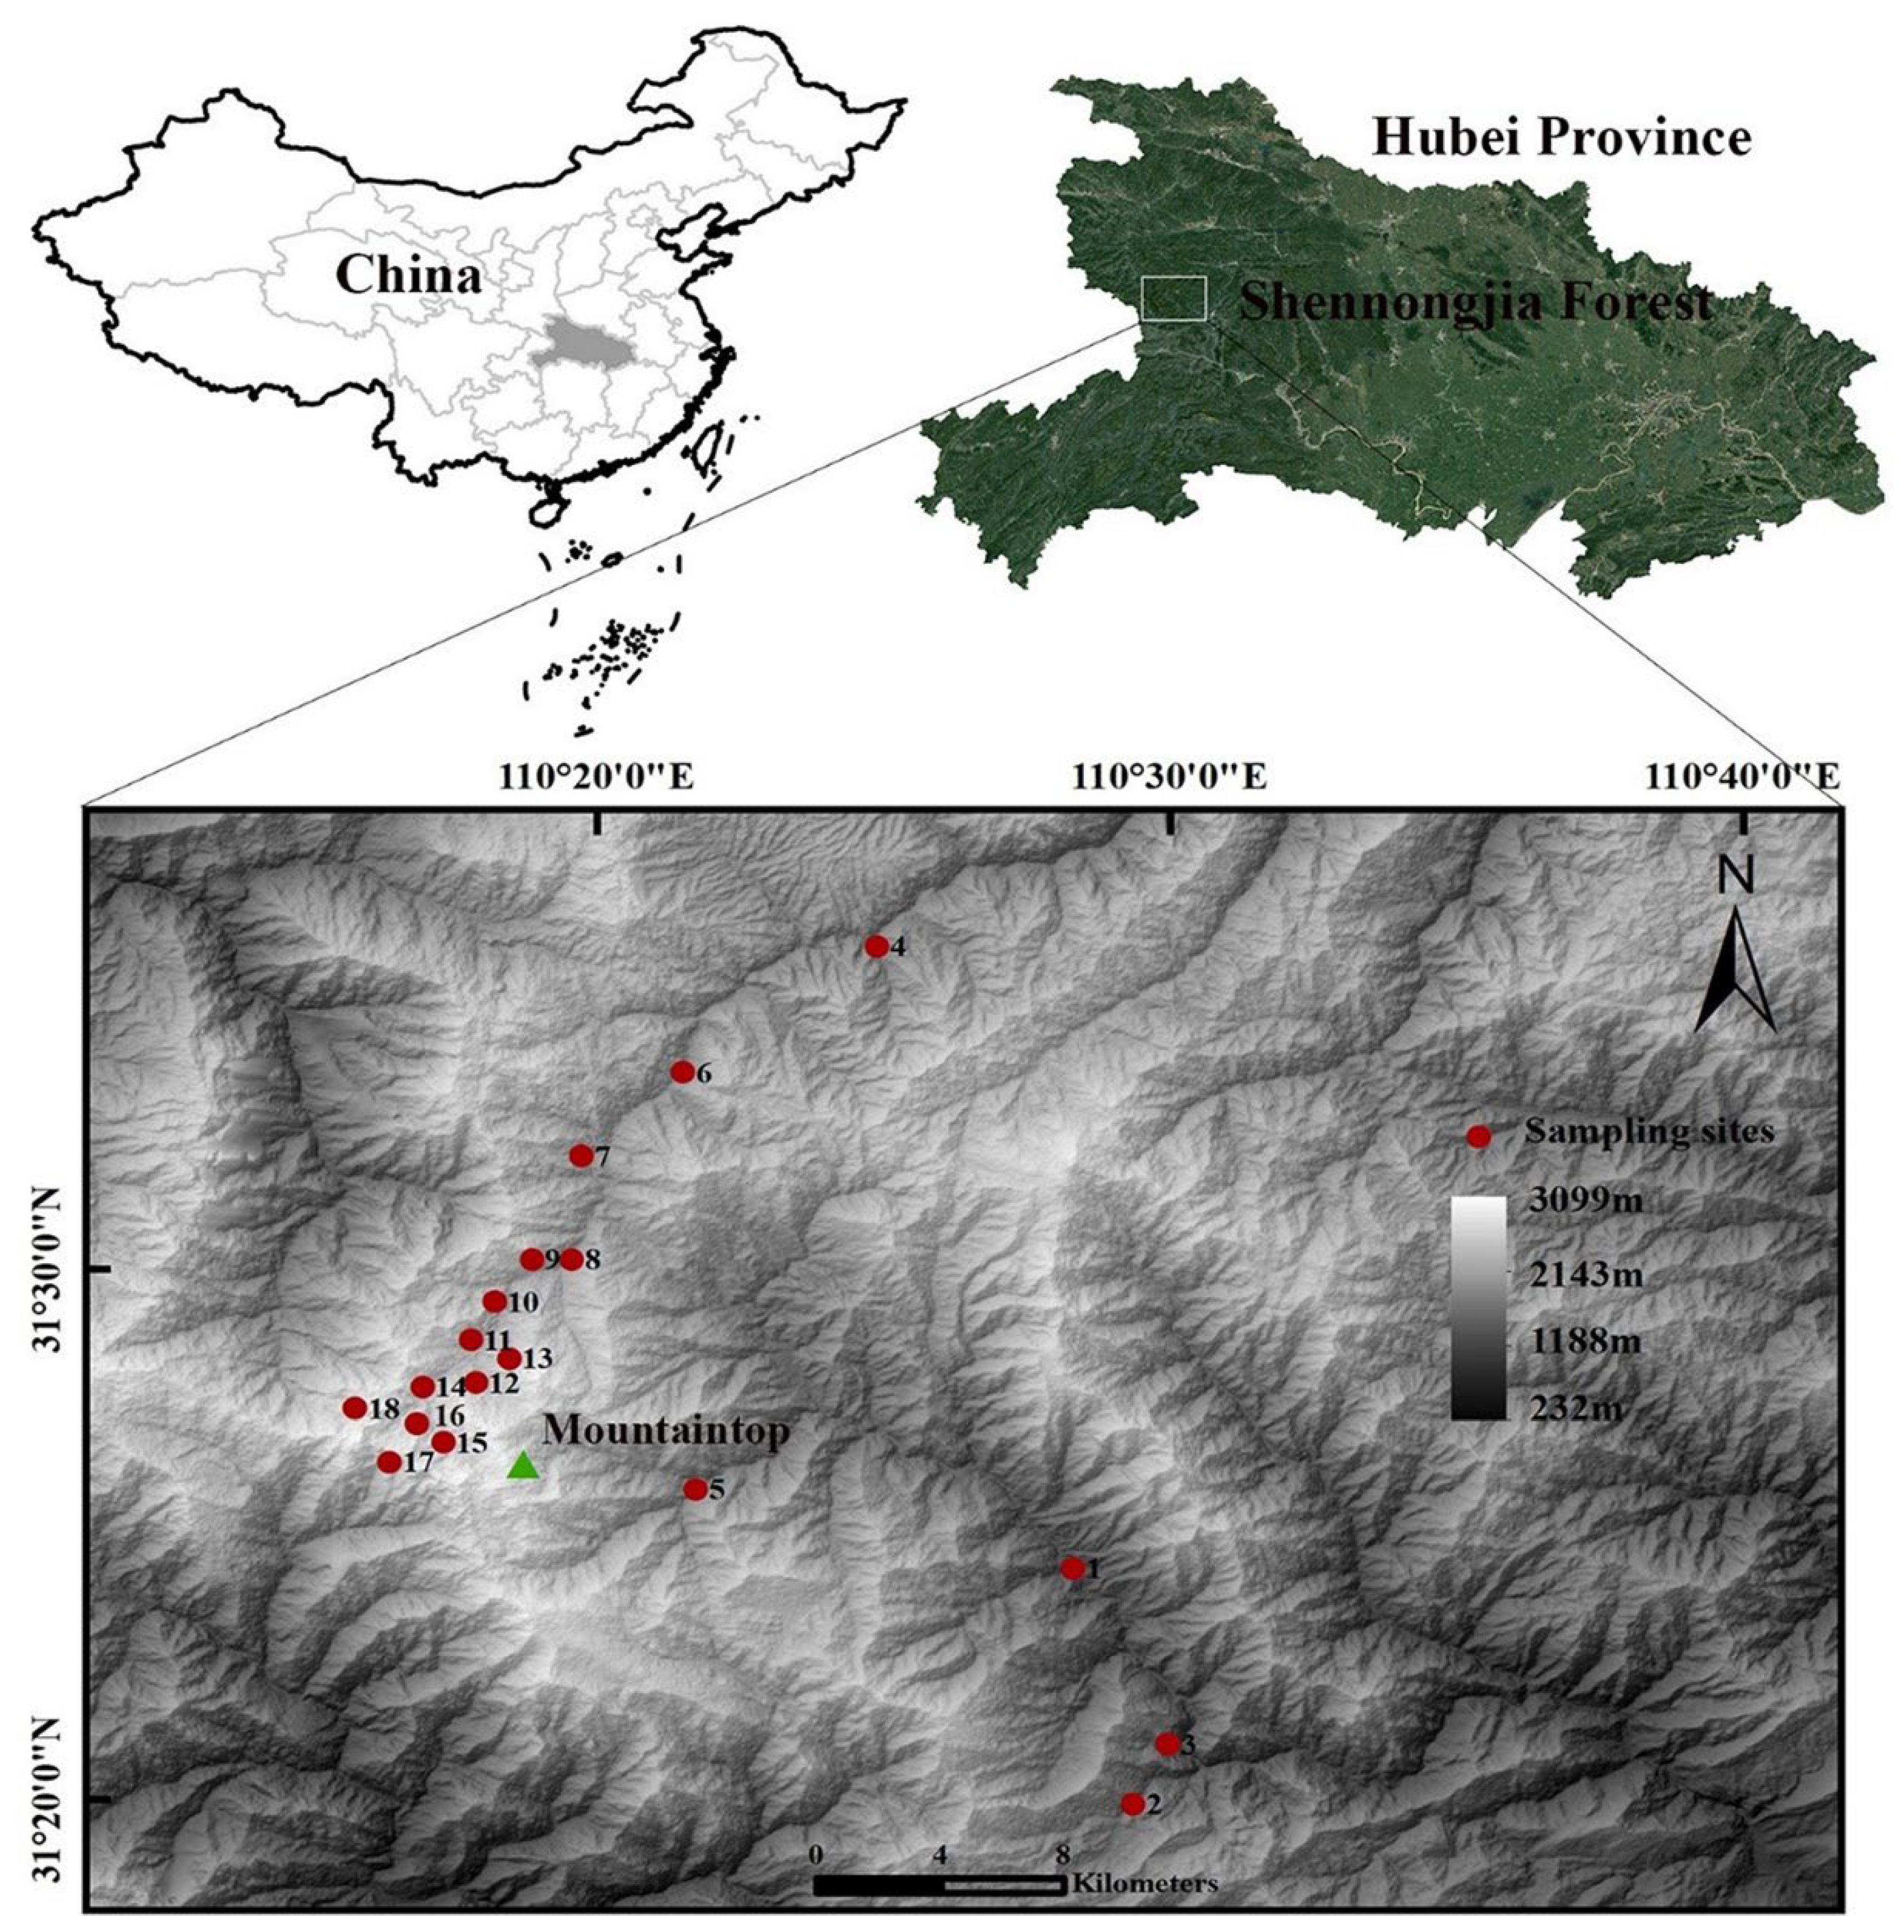
Figure 1. Locations of sampling sites in the Shennongjia Forest. (The altitude of sampling sites 1 to 18 are 851, 1183, 1309, 1506, 1581, 1668, 1761, 1908, 2032, 2115, 2213, 2303, 2431, 2517, 2605, 2733, 2817, and 2918 m, respectively.)
Sustainability 14 15855 g001
Figure 2. Average contents and ratios of TOC, TN, and TP in litterfall, humus, and soil (0–20 and 20–40 cm) and average contents of DOC, AN, and AP in soil (0–20 and 20–40 cm) during three sampling times (May, August, and December). Values are the means of contents across 18 sampling sites with error bars denoting standard deviation. The different lowercase letters indicate a significant difference (p < 0.05) in May, August, and December assessed by one-way ANOVA followed by Duncan’s test for multiple comparisons. The gray lines represent the average concentrations of the three sampling times.
Sustainability 14 15855 g002
Figure 3. Linear correlations between altitude and TOC, TN, and TP contents in different layers (litterfall, humus, and soil (0–20 and 20–40 cm)) for the different sampling times (May, August, and December). The solid line represents a significant correlation and the dotted line represents a non-significant correlation. Background of white and gray represent different vegetations of mixed evergreen and deciduous broad-leaved forest, broadleaved deciduous forest, mixed broadleaf-conifer forest, coniferous forest and mountain shrub meadow zone from left to right.
Sustainability 14 15855 g003
Figure 4. Linear correlations between altitude and DOC, AN, and AP concentrations in soil (0–20 and 20–40 cm) for all the sampling times (May, August, and December). The solid line represents a significant correlation and the dotted line represents a non-significant correlation. Background of white and gray represent different vegetations of mixed evergreen and deciduous broad-leaved forest, broadleaved deciduous forest, mixed broadleaf-conifer forest, coniferous forest and mountain shrub meadow zone from left to right.
Sustainability 14 15855 g004
Figure 5. Linear correlations between altitude and C:N, C:P, and N:P ratios in different layers (litterfall, humus, and soil (0–20 and 20–40 cm)) for all the sampling times (May, August, and December). The solid line represents a significant correlation and the dotted line represents a non-significant correlation. Background of white and gray represent different vegetations of mixed evergreen and deciduous broad-leaved forest, broadleaved deciduous forest, mixed broadleaf-conifer forest, coniferous forest and mountain shrub meadow zone from left to right.
Sustainability 14 15855 g005
Figure 6. Correlation coefficients between driving factors and TOC, TN, and TP in different layers (litterfall, humus, and soil (0–20 and 20–40 cm)). (* Correlation is significant at the 0.05 level; ** Correlation is significant at the 0.01 level. VP, Ta, MC, BD, and Ts are, respectively, vegetation patterns, air temperature, moisture content, bulk density, and soil temperature).
Sustainability 14 15855 g006
Figure 7. Correlation coefficients between driving factors and C:N, C:P, and N:P in different layers (litterfall, humus, and soil (0–20 and 20–40 cm)). (* Correlation is significant at the 0.05 level; ** Correlation is significant at the 0.01 level. VP, Ta, MC, BD, and Ts are, respectively, vegetation patterns, air temperature, moisture content, bulk density, and soil temperature).
Sustainability 14 15855 g007
Figure 8. The relative influence of driving factors for TOC, TN, and TP and their stoichiometry in different layers (litterfall, humus, and soil (0–20 and 20–40 cm)). Ta, Ts, MC, and BD are, respectively, air temperature, soil temperature, moisture content, and bulk density.
Sustainability 14 15855 g008
Publisher’s Note: MDPI stays neutral with regard to jurisdictional claims in published maps and institutional affiliations.