Article

Comprehensive Evaluation of the Level of Water Ecological Civilization Construction in the Min River Basin, China

1
College of Computer and Information Sciences, Fujian Agriculture and Forestry University, Fuzhou 350002, China
2
Fujian Statistical Information Research Center, Fuzhou 350000, China
3
Fujian Huatong Marketing Research Co., Ltd., Fuzhou 350000, China
4
State Grid CommunicationYili Technology Co., Ltd., Fuzhou 350000, China
*
Author to whom correspondence should be addressed.
Sustainability 2022, 14(23), 15753; https://doi.org/10.3390/su142315753
Submission received: 14 October 2022 / Revised: 19 November 2022 / Accepted: 21 November 2022 / Published: 26 November 2022

Abstract

:
Water Ecological Civilization Construction (WECC) is critical for promoting long-term resource, economic, and social development. The Min River is the longest in Fujian Province, China, and is known as the “golden canal” for shipping. In this study, data from cities around the Min River were used to build an evaluation index system for WECC in the Min River, incorporating the Pressure–State–Response model, and the matter element extension model was used to examine the WECC level in the Min River Basin. The results indicate that notable progress has been made for WECC in the Min River Basin, despite evident regional variation. The upper parts of the Min River have seen the most development; however, the downstream regions have been mainly stable and retained a high WECC level. Changes in industrial structure and government actions substantially affect the degree of WECC. This study can act as a reference for river basin WECC.

1. Introduction

Water has a vital function in ecosystems and influences their equilibrium and development [1]. Rapid industrialization and urbanization have markedly strained urban water ecosystems in China over the last several decades [2]. The ecological integrity of rivers has been severely compromised. Various aquatic ecological issues have successively occurred, such as eutrophication of water bodies, falls in groundwater, river diversion, lake degradation, and biodiversity loss [3,4,5]. All United Nations Member States adopted the 2030 Agenda for Sustainable Development in 2015. At its heart are the 17 Sustainable Development Goals, which include ensuring the availability and sustainable management of water and sanitation for all [6]. In light of the present difficulties confronting China’s water resources and their sustainable development, the Chinese Ministry of Water Resources proposed the idea of “water ecological civilization”. The goal of water ecological civilization is to protect the ecological health of water, make smart use of water resources, create a “water economy,” and help people grow in harmony with nature [7,8]. The water conservancy department combined the ideas of “ecological civilization” and “water resources” to create the idea of “water ecological civilization,” which is based on “harmony” between people and the environment [7,9,10].
The Min River is the biggest river in Fujian Province to empty into the sea. The river passes through four cities in the province, which occupy half of the province’s total area. The river is crucial for the culture and economy of the towns around the basin. The Min River Basin is a core site of pre-Qin and Han cultural development in Fujian Province, and a breeding ground for Minyue, Neo-Confucianism, and pottery cultures, among others [11,12]. Other interesting locations are found along the river, including Jiufeng Mountain in Nanping, Jinshan Temple in Fuzhou, and Luoxing Pagoda. Since the late Ming Dynasty, the Min River has served as a trade link between Zhejiang Province and Fujian Province, earning it the nickname “golden stream” [13]. In modern times, sections of the Min River Basin in Fujian have developed into an important transportation corridor. There are more than 30 ports with a throughput of over 10,000 tons (10,000 passengers), of which Fuzhou Port is one of China’s most significant primary hub ports [14]. In addition, eight hydropower plants have been constructed on the Min River, with the Shuikou hydropower station being the largest. This construction has made Fujian Province a well-developed hydropower area [15,16].
Evaluating ecosystems may help us obtain complete knowledge of the environment, which is crucial for its preservation [17]. However, regional environmental variables make the evaluation of ecosystems different in every case, and the indicators and weights in commonly applied frameworks are ambiguous [18,19]. The Organization for Economic Cooperation and Development and the United Nations Environment Programme proposed the “Pressure–State–Response” (PSR) model [20]. The model has been used extensively to build an assessment index system for watersheds, fisheries, forests, and other industries [21,22,23]. To evaluate the connection between human production, life, and the ecological environment, the PSR model incorporates three components: pressure, state, and response. When pressure is put on an ecosystem in a particular state, the system responds by changing to a different state; this new state can be changed by human actions [24]. Stress determines the effects of human production and existence on ecosystems [25]; typically, indicators at this layer are negative. The “state” is the quality that reflects the biological, physical, and chemical characteristics of the current ecosystem [26]. The term “response” refers to the measures and actions taken by human beings to restore and protect the ecology.
In this study, the Min River Basin and its Water Ecological Civilization Construction (WECC) level are assessed. When choosing indicators, the vast majority of published articles have used only qualitative analytic methods and the subjective judgment of academics. In the present study, a factor analysis approach based on R-type clustering is employed to screen assessment indicators quantitatively. The analytic hierarchy process and the entropy technique are applied to precisely estimate the index weight. The PSR and matter-element extension models are used to precisely evaluate the degree of WECC in the Min River Basin. In the Min River Basin, people are investigating how to create a water society that is good for the environment and can grow. The primary contributions of this study are as follows: (1) The R-type factor clustering method is used to screen the indicators, guaranteeing that each indication is the most representative of its kind. (2) The PSR model and the matter-element extension model are linked to make a system for judging how far the Min River Basin has come in terms of WECC.

2. Materials and Methods

2.1. Study Area

The Min River begins in Jianning County, between Fujian and Jiangxi provinces. The river’s three main tributaries, which are the Jianxi, Futun, and Shaxi, are found in the upper reaches. The three tributaries join the central river basin in Nanping and flow through 36 counties and cities in Fujian Province. The province has a subtropical marine climate with warm and humid weather, a well-developed monsoon, and abundant water resources. The Min River Basin covers half of the land area of Fujian Province and is the largest water system in the province (Figure 1). The basin’s economic production accounts for almost 40% of the province’s entire output, and the area possesses the province’s most important ecological and economic advantages. The ecological civilization building of this area is inextricably linked to the living, production, urban construction, and economic growth of coastal people, which is critical to the ecological civilization building for the province as a whole [27].

2.2. Collection and Preparation of Data

The majority of the data for this study came from the Fujian Statistical Yearbook, Fujian Municipalities Statistical Yearbook, China Urban Construction Statistical Yearbook, Fujian Province Water Resources Bulletin, Fujian Municipalities Water Resources Bulletin, and water quality data from 31 surface water automated environmental monitoring stations in five major cities along the Min River. The water quality data incorporate three indicators: dissolved oxygen, permanganate, and ammonia nitrogen concentration in the water. Data from the Min River Basin were thoroughly processed using MATLAB, EXCEL, SPSS, and STATA (latest versions) to comprehensively assess the degree of WECC in the Min River Basin from 2011 to 2020.
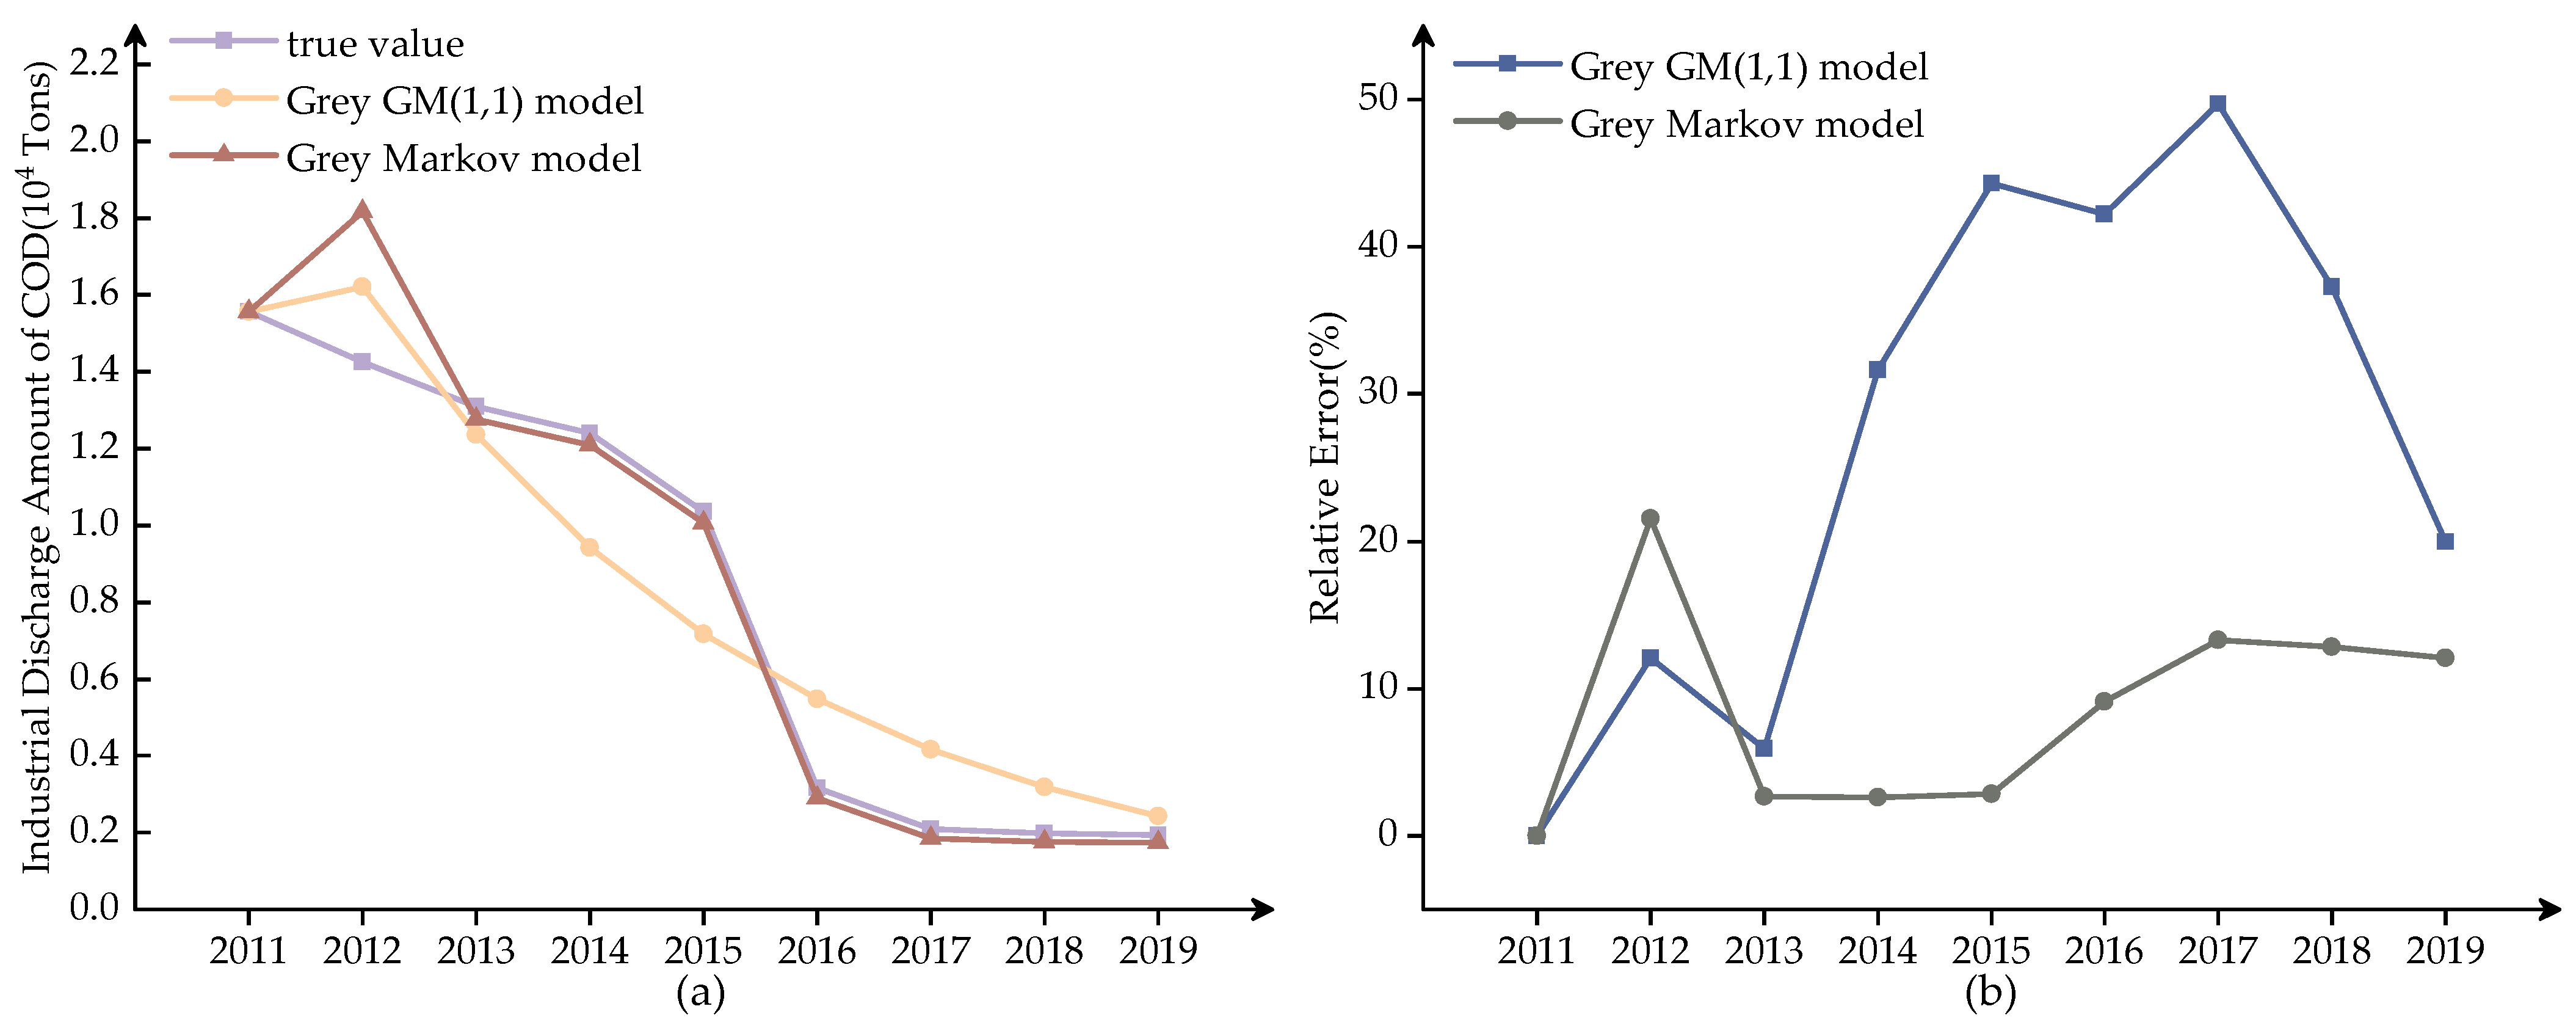
In the present study, a Grey Markov prediction model was employed to augment the 2020 data for locations for which the 2020 data have not been released, hence ensuring data integrity and availability. The Grey Markov model does not have any side effects and better fits irregularly changing data, making up for the flaws in the Grey prediction model [28]. Figure 2 depicts the estimated values and relative error of the Grey prediction model and the Grey Markov model for filling in the missing values of the industrial discharge of COD (Chemical Oxygen Demand) in Nanping, China. Overall, the predicted values of the Grey Markov model are very close to the actual values, and the relative error is also smaller than the relative error of the Grey GM (1,1) model (Figure 2).
Due to the complexity of the indicators used in the assessment process, the dimensions of the coefficients are not always similar; as a result, the indications were often incomparable. Therefore, the Z - Score normalization method was used to make the data more comparable and lessen the effect of the different ranges and units of the indicators. In addition, the economic data in the article remove the impact of inflation.

2.3. Establishment of an Assessment System for WECC

2.3.1. Selection of Initial Indicators

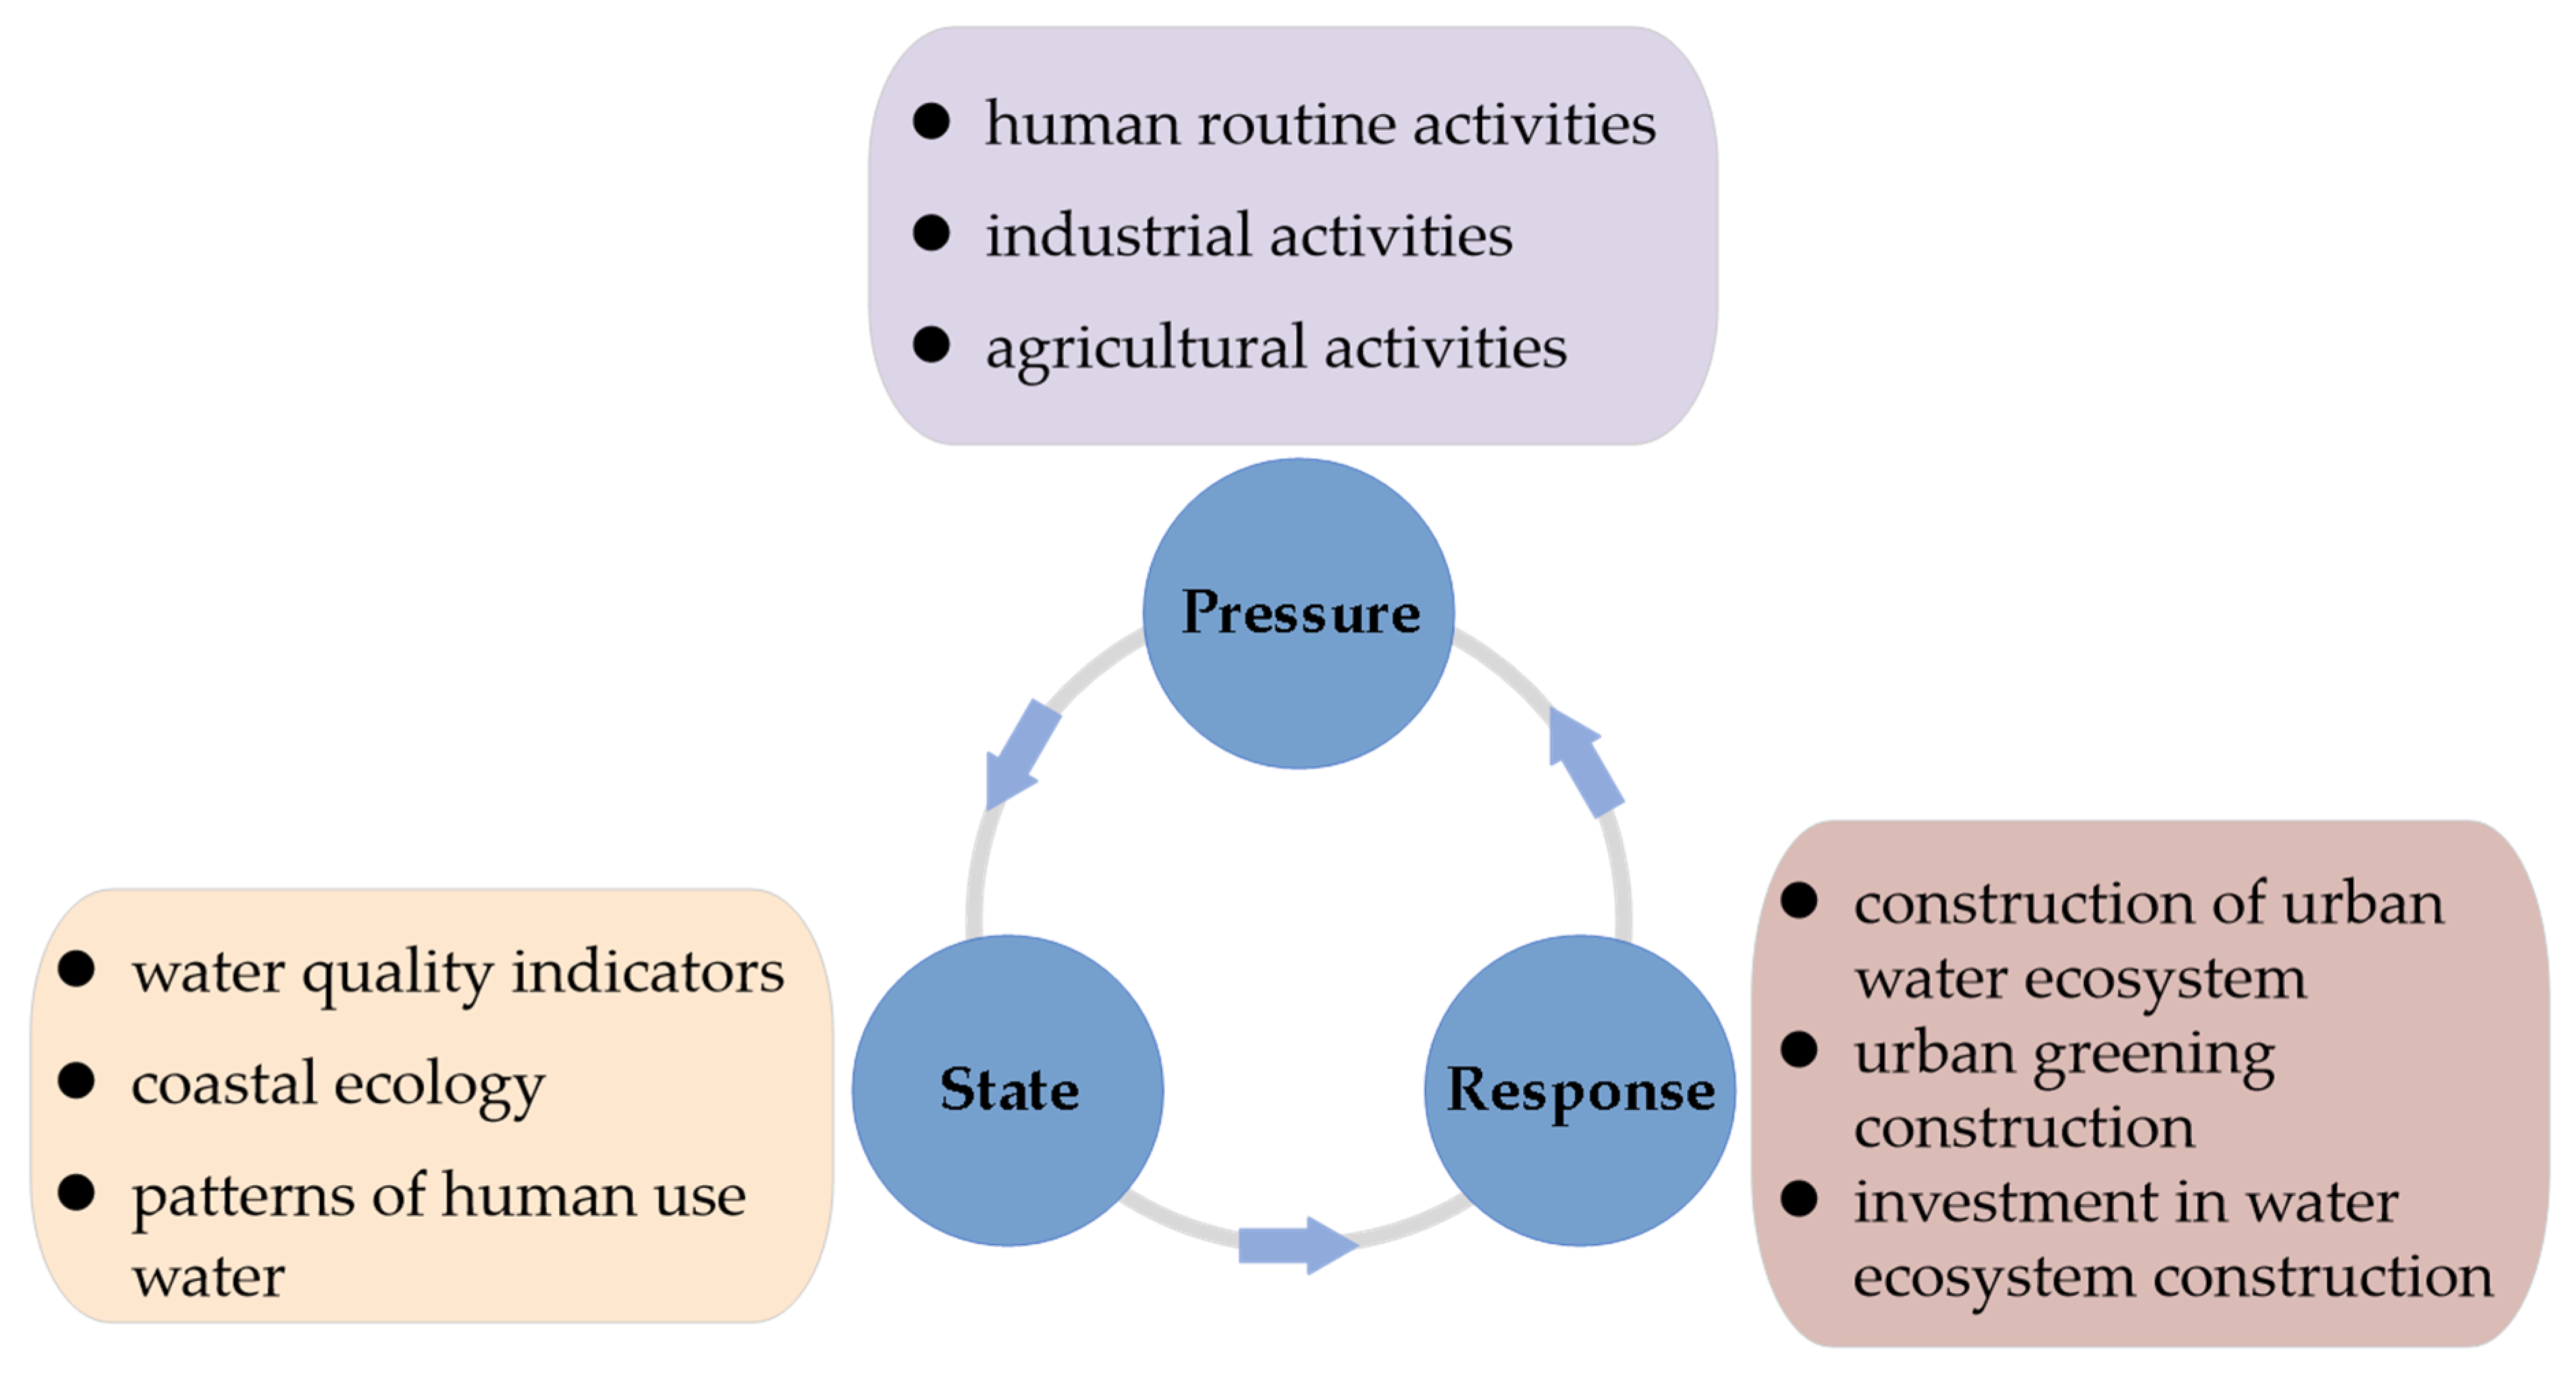
The three components of the PSR model interact with and constrain each other, allowing the evaluation of the health of the water ecology and the impact of human activity on the water ecology (Figure 3).
For pressure, we chose twelve independent indicators based on the actual situation in the study area. For human routine activities, we selected urban water population, per capita daily water usage, and three other indicators. For industrial activities, industrial water consumption and wastewater outputs were used, and, for agriculture, selected indicators were water for forestry, animal care, fishing, and farmland irrigation.
The state of the water ecology in the Min River Basin was primarily represented by water quality, coastal ecology, and human water use. Indicators of water quality are nitrogen oxide concentration, dissolved oxygen concentration, and water quality compliance rate. Two indicators are used to express human water usage: water consumption of 10k CNY GDP and the production capacity of year-end water supply. The ratio of green areas to city areas and per capita public green areas are indicative of the coastal ecology.
We chose urban water ecosystem construction, greening construction, and water ecosystem construction investment to represent human responses. Newly increased green area and forest coverage rate can indicate urban greening construction. The construction of an urban water ecosystem may be represented by the city’s sewage disposal proportion and the proportion of regular rubbish disposal. Investments in water conservation, environmental governance, and flood control demonstrate the government’s involvement in water conservation and ecological development.

2.3.2. Index Screening

The R-type clustering factor analysis method was used for the quantitative selection of indicators. On the basis of the clustering of variables, representative indicators are selected for each category by factor analysis [29]. First, R-type clustering is carried out on each layer, i.e., 30 variables are clustered hierarchically to ensure that there is a high correlation between the factor analysis indicators and that the different categories of indicators are relatively independent. Currently, there is no traditional method for determining the number of clusters. A Kruskal–Wallis (KW) test for each category after clustering to determine the number of clusters can ensure the scientific validity of the number of clusters. The K-W test assumes no significant difference between the index values. If the P value of the test is greater than the significant level of 0.05, the original hypothesis is accepted; that is, there is no significant difference between the index values of each category, and the classification results are reasonable [30].
Factor analysis using R-type clustering was carried out for each index, and the factor load matrix screened out the index with the most significant contribution rate to the factor. Supposing the factor contribution rate of the same indicators or categories includes a coefficient of variation of 0 and cannot be the factor analysis of indicators, in that case, in this study, the coefficients of variation of more minor indicators were deleted on the basis of the size of the coefficient of variation screening. The calculation formula for the coefficient of variation is expressed as Equation (1). The filtering process and results are shown in Table 1.
v i = σ j x ¯ j
where v i is the coefficient of variation of indicators for a single year and x ¯ i is the average for that year.

2.4. Determination of Indicator Weights

Establishing indicator weights is critical for assessing the degree of WECC. The main existing techniques for calculating the weight of indicators are the entropy weight method, the standard deviation method, and CRITIC. The main subjective weighting methods are hierarchical analysis and expert scores [31,32,33,34]. This paper uses the entropy weight method and the analytic hierarchy process to find the index weight. This approach both overcomes the issue that the objective weighting of the entropy weight technique is inconsistent with the actual situation, owing to inadequate data, and compensates for the fact that subjective weighting elements heavily influence the analytic hierarchy process. This weighting approach combines subjective and objective factors and makes weight determination more scientific.

2.5. Matter-Element Extension Evaluation Model

2.5.1. Determining Classical Domains, Node Domains, and Matter-Element Matrix to Be Evaluated

In the matter-element extension model, things are represented as ordered triples comprising three elements: objects, characteristics, and values. This three-part description is also known as “matter-element.” Equation (2) shows that the matter element N of the WECC level comprises n characteristic indexes c 1 , c 2 , , c n that reflect the WECC level with matching values v 1 , v 2 , , v n .
R = | N c 1 c 2 c n v 1 v 2 v n | = | R 1 R 2 R n |
R = ( N , c , v ) can be used to keep track of the amount of water in WECC matter elements R . The matter-element extension model can be split into three groups: classical domain matter element, nodal domain matter element, and matter element to be assessed. The classical domain matter element is a matrix that lists the properties of objects and the standard scale range of those properties at each level R o p . The value interval of each item’s attribute at all levels, denoted by R q , makes up the nodal matter element. The features of the object and the values of each feature’s index R x make up the assessed object element.
Equation (3) shows how the classical domain element matrix R o p = ( N o p , C i , V o ) of the WECC level is constructed.
R o p = | N o p c 1 c 2 c n ( a o p 1 , b o p 1 ) ( a o p 2 , b o p 2 ) ( a o p n , b o p n ) |
where, in the classical domain matter element R o p , the p - t h evaluation level of the WECC level is designated as N o p , the evaluation value of the i - t h indicator is denoted by c i , and the range of values of level p is denoted by ( a o p 1 , b o p 1 ) .
The nodal domain matter-element matrix R q = ( N p , C n , V p ) of the WECC level is given by Equation (4).
R o p = | N q c 1 c 2 c n ( a q 1 , b q 1 ) ( a q 2 , b q 2 ) ( a q n , b q n ) |
where the whole level of WECC is denoted by q in the nodal matter element R q , and the range of values for the feature c i in the nodal domain elements is denoted by v q i = ( a q i , b q i ) .
The matter-element matrix R x = ( N x , C n , V n ) of the item to be assessed for the WECC level is obtained as follows:
R x = | N c 1 c 2 c n v 1 v 2 v n | = | R 1 R 2 R n |

2.5.2. Determination of Correlation Function

The correlation function analyzes the value of each characteristic attribute index and the degree of attribution between assessment levels, i.e., the object elements are assessed by the classical domain elements through a variety of evaluation level values. Calculating the association function allows for the quantitative examination of the incompatibility issue. Before generating the correlation function, the distance between the values of the characteristic indicators of the evaluated item and each evaluation level in the classical and nodal domains must be determined. The formulas for these are written as follows:
ρ ( X , X o ) = | X 1 2 ( a o + b o ) | 1 2 ( b o a o )
ρ ( X , X q ) = | X 1 2 ( a q + b q ) | 1 2 ( b q a q )
where | b a | are the modulus of the bounded interval [ a , b ] and ρ ( X , X o ) , ρ ( X , X q ) is the distance between the midpoint of the object and both the classical domain and the node domain. Equation (8) expresses the formula for the correlation function K ( x ) of the WECC level indicators.
K ( x i ) = { ρ ( X , X o ) | X o | , X X o ρ ( X , X o ) ρ ( X , X q ) ρ ( X , X o ) , X X o

2.5.3. Calculation of the Degree of Comprehensive Correlation

Based on the correlation function and the weight ω i for each characteristic index, Equation (9) can be used to find the integrated correlation K p ( N x ) of the assessed item N x for rank p .
K p ( N x ) = i = 1 n ω i k p ( x i )
If K p i = max [ k p ( x i ) ] , ( p = 1 , 2 , , n ) , the indicator’s level is p for indicator i . If K p x = max [ k p ( N x ) ] , ( p = 1 , 2 , , n ) , the level of the item to be assessed is p if i is being evaluated.

3. Results

3.1. Weights of Assessment Index

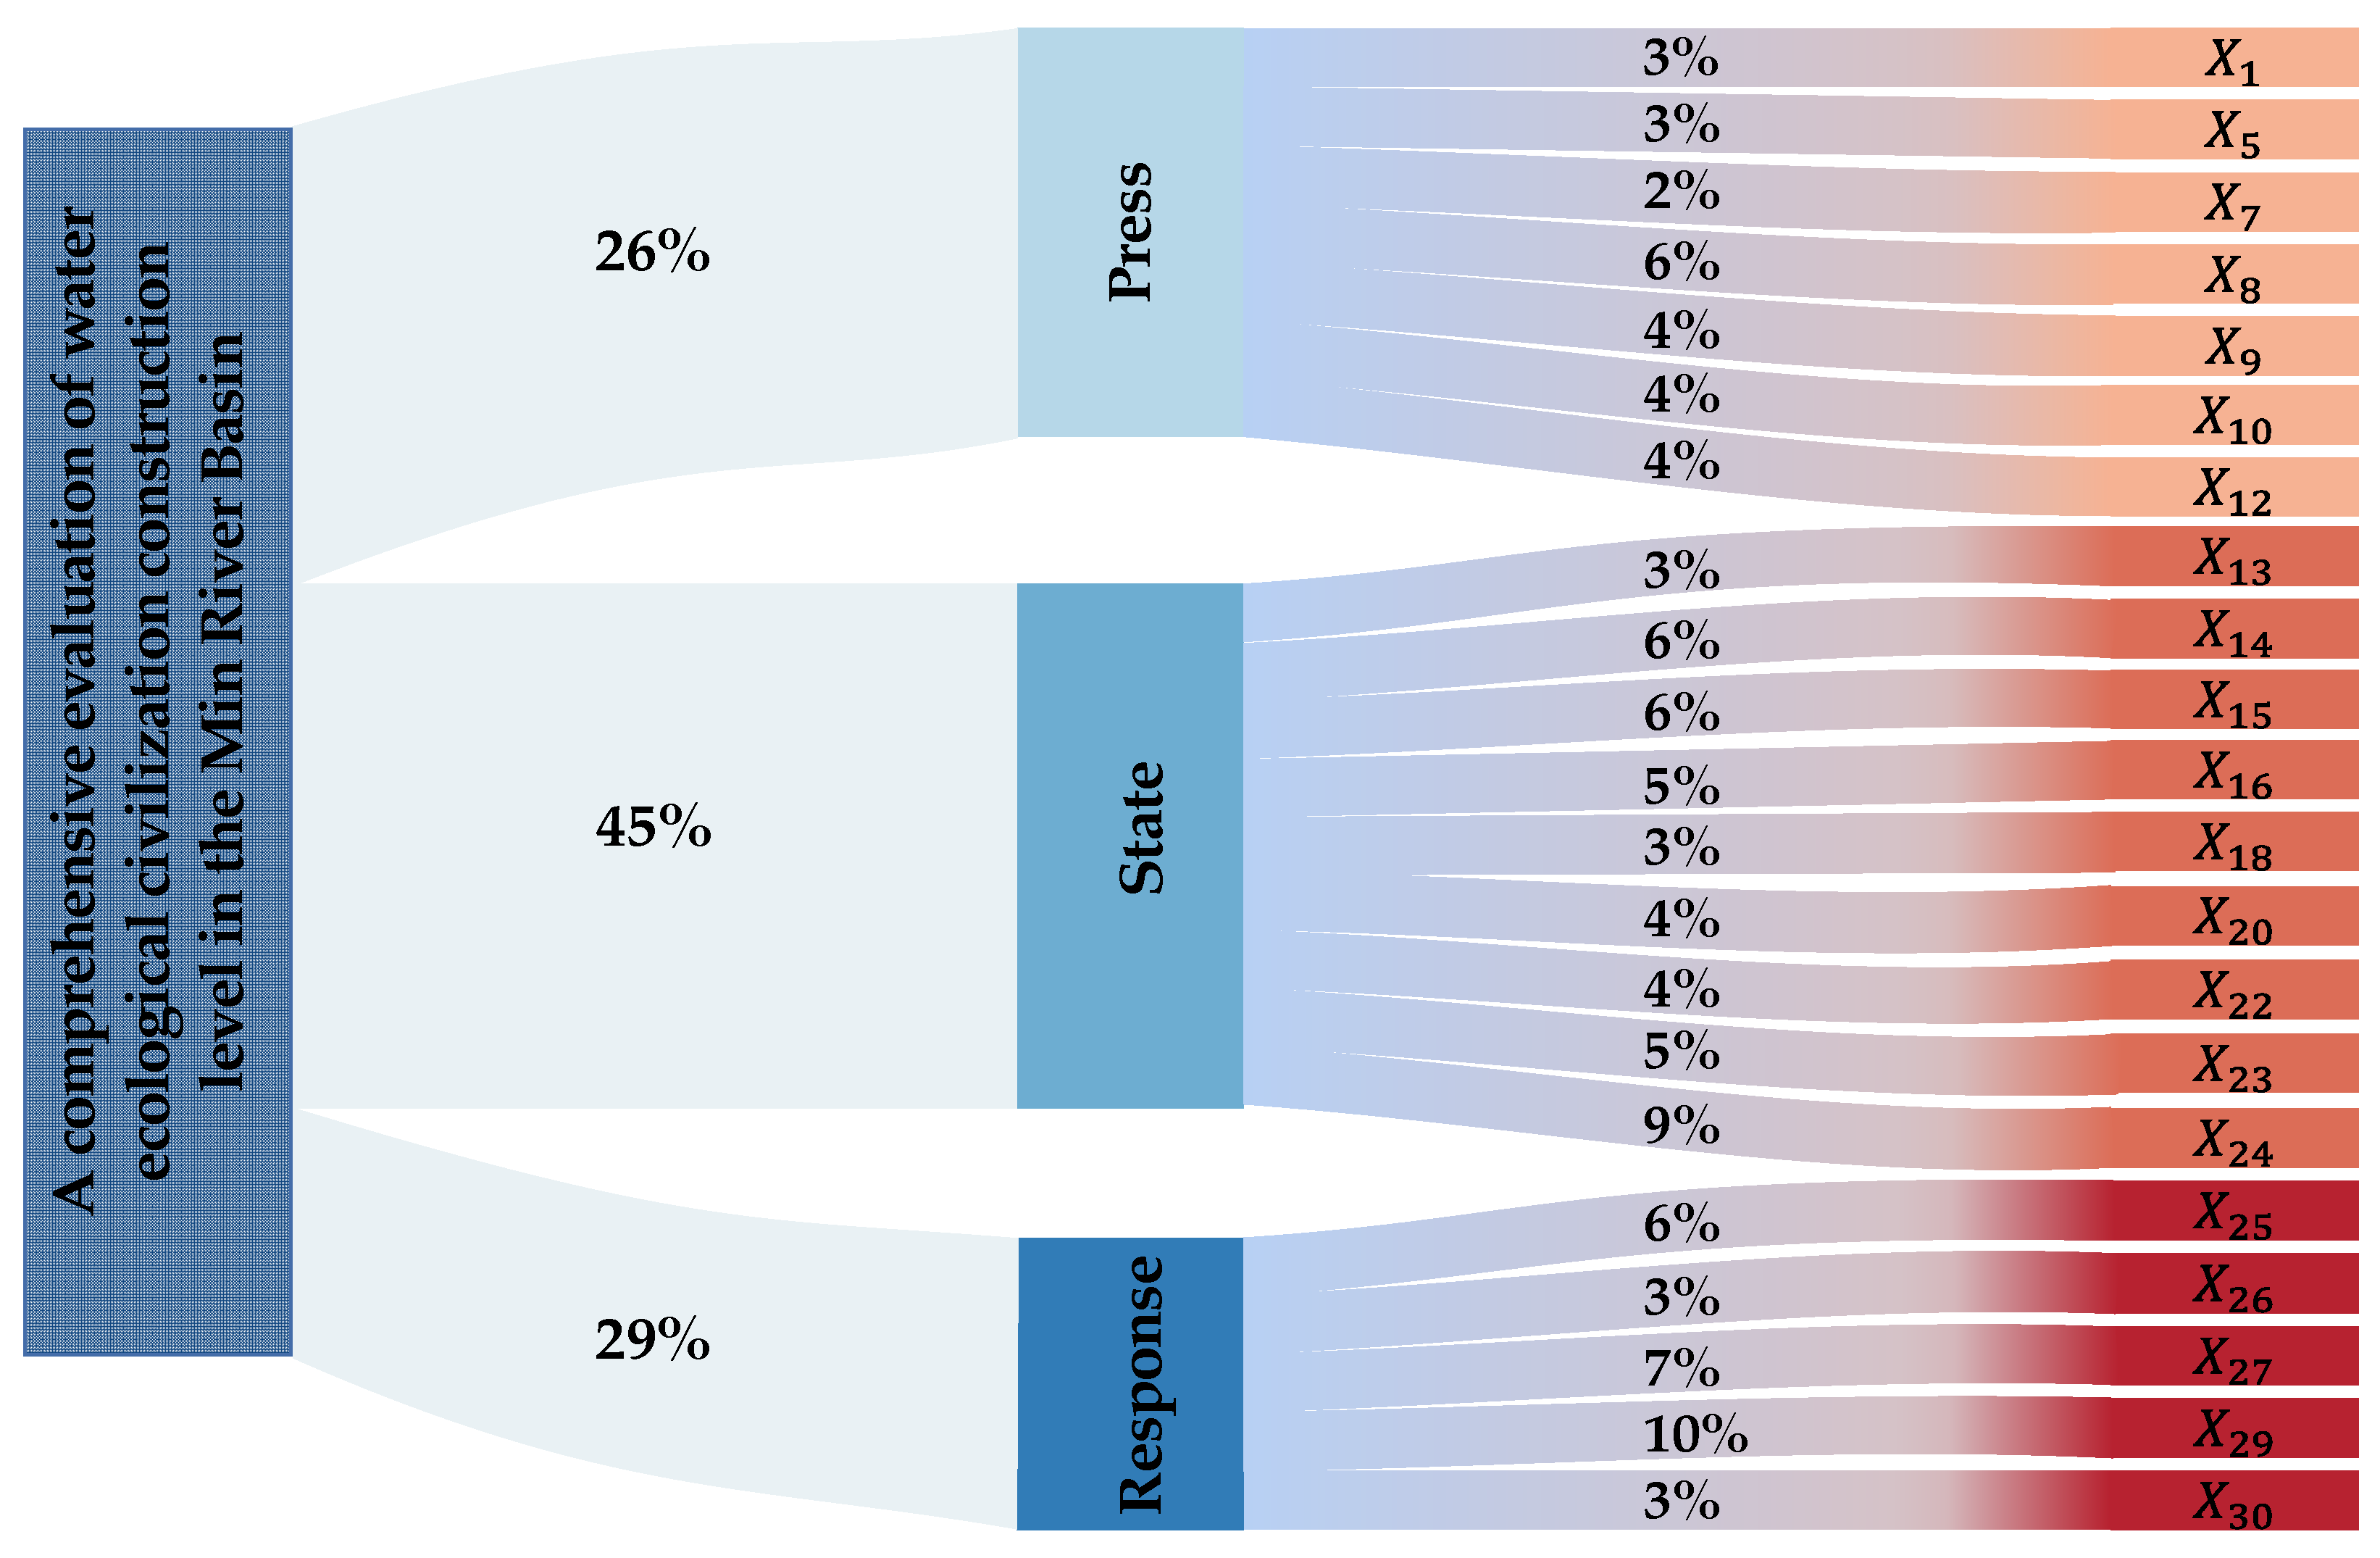
The weight of each indicator for the WECC evaluation system was calculated with the entropy weight method and the analytic hierarchy shown in Figure 4. The state layer accounted for the largest weight (45%), followed by social response (29%). The pressure of WECC was the smallest weight (26%) in the first-grade indices.
Herein, the degree of WECC in the Min River Basin is categorized as follows: excellent (I), good (II), medium (III), poor (IV), and very poor (V). For the classic domain and section domain, the categories were established by consulting the Surface Water Environmental Quality Standards, the Guidelines for the Evaluation of Water Ecological Civilization City Construction, and worldwide and national industry standards for each index. The analysis considers the actual conditions of the Min River Basin to develop the classic domain and section domain scope of the WECC evaluation system (Table S1).

3.2. Spatial-Temporal Characteristics of WECC

Changes in the WECC of cities around the Min River from 2011 to 2020 are illustrated in Figure 5. The amount of WECC in the basin changed markedly throughout the period. During the first five years, the degree of WECC in the Min River Basin was relatively poor and regionally prominent, and in the upper reaches of Sanming and Nanping, WECC was poor and very poor. During 2011–2014, the degree of WECC in Nanping was very poor, but by 2015 it had vastly improved and reached the level of good. From 2011–2015, Sanming’s WECC level was not stable and often poor. The degree of WECC was higher in Fuzhou and Ningde than in upstream areas. The development of Ningde’s WECC steadily progressed from medium to excellent by 2015. Fuzhou’s WECC remained either medium or good from 2011 to 2015. The WECC in towns along the Min River has attained an excellent level during the last five years. From 2016 to 2020, Ningde and Nanping were exceptional, and Sanming and Fuzhou varied between good and excellent. Overall, the level of WECC in all four areas has improved over time, with the two upstream areas making the most progress.
Moreover, we constructed a spatial and temporal distribution of the Standardized Precipitation Index (SPI) in the Min River Basin and compared it to the level of WECC (Figure 6). McKee came up with the SPI in 1993 to describe weather droughts over time scales [35]. According to the spatial-temporal distribution of the SPI, the association of Sanming and Nanping with the SPI is more obvious, particularly in 2011, 2014, and 2015. In 2011, Nanping, Ningde, and parts of Fuzhou all had droughts of varying severity, while most of Sanming was flooded. However, the level of WECC in Sanming and Nanping is poor. In 2014, there was a drought in Sanming and Nanping, and the WECC levels in both regions were between medium and very poor. Despite severe floods in the southeast of Fuzhou, the level of WECC remained good. In 2015, the southeastern section of Sanming was affected by a severe drought, and the region’s WECC level was very poor. This should relate to the arrangement of water infrastructure in the Min River Basin [36]. The first terraced hydropower plant in New China was constructed at Ningde [37]. The middle part of the Min River, upstream of Fuzhou, is the location of the largest Shuikou hydroelectric station in East China [15,16]. This has significantly decreased the effects of floods and drought in both areas [38].

3.3. Changes in the WECC Evaluation Index

The differences in pressure, state, and response evaluation indexes were compared to learn more about the degree of WECC in the Min River Basin.
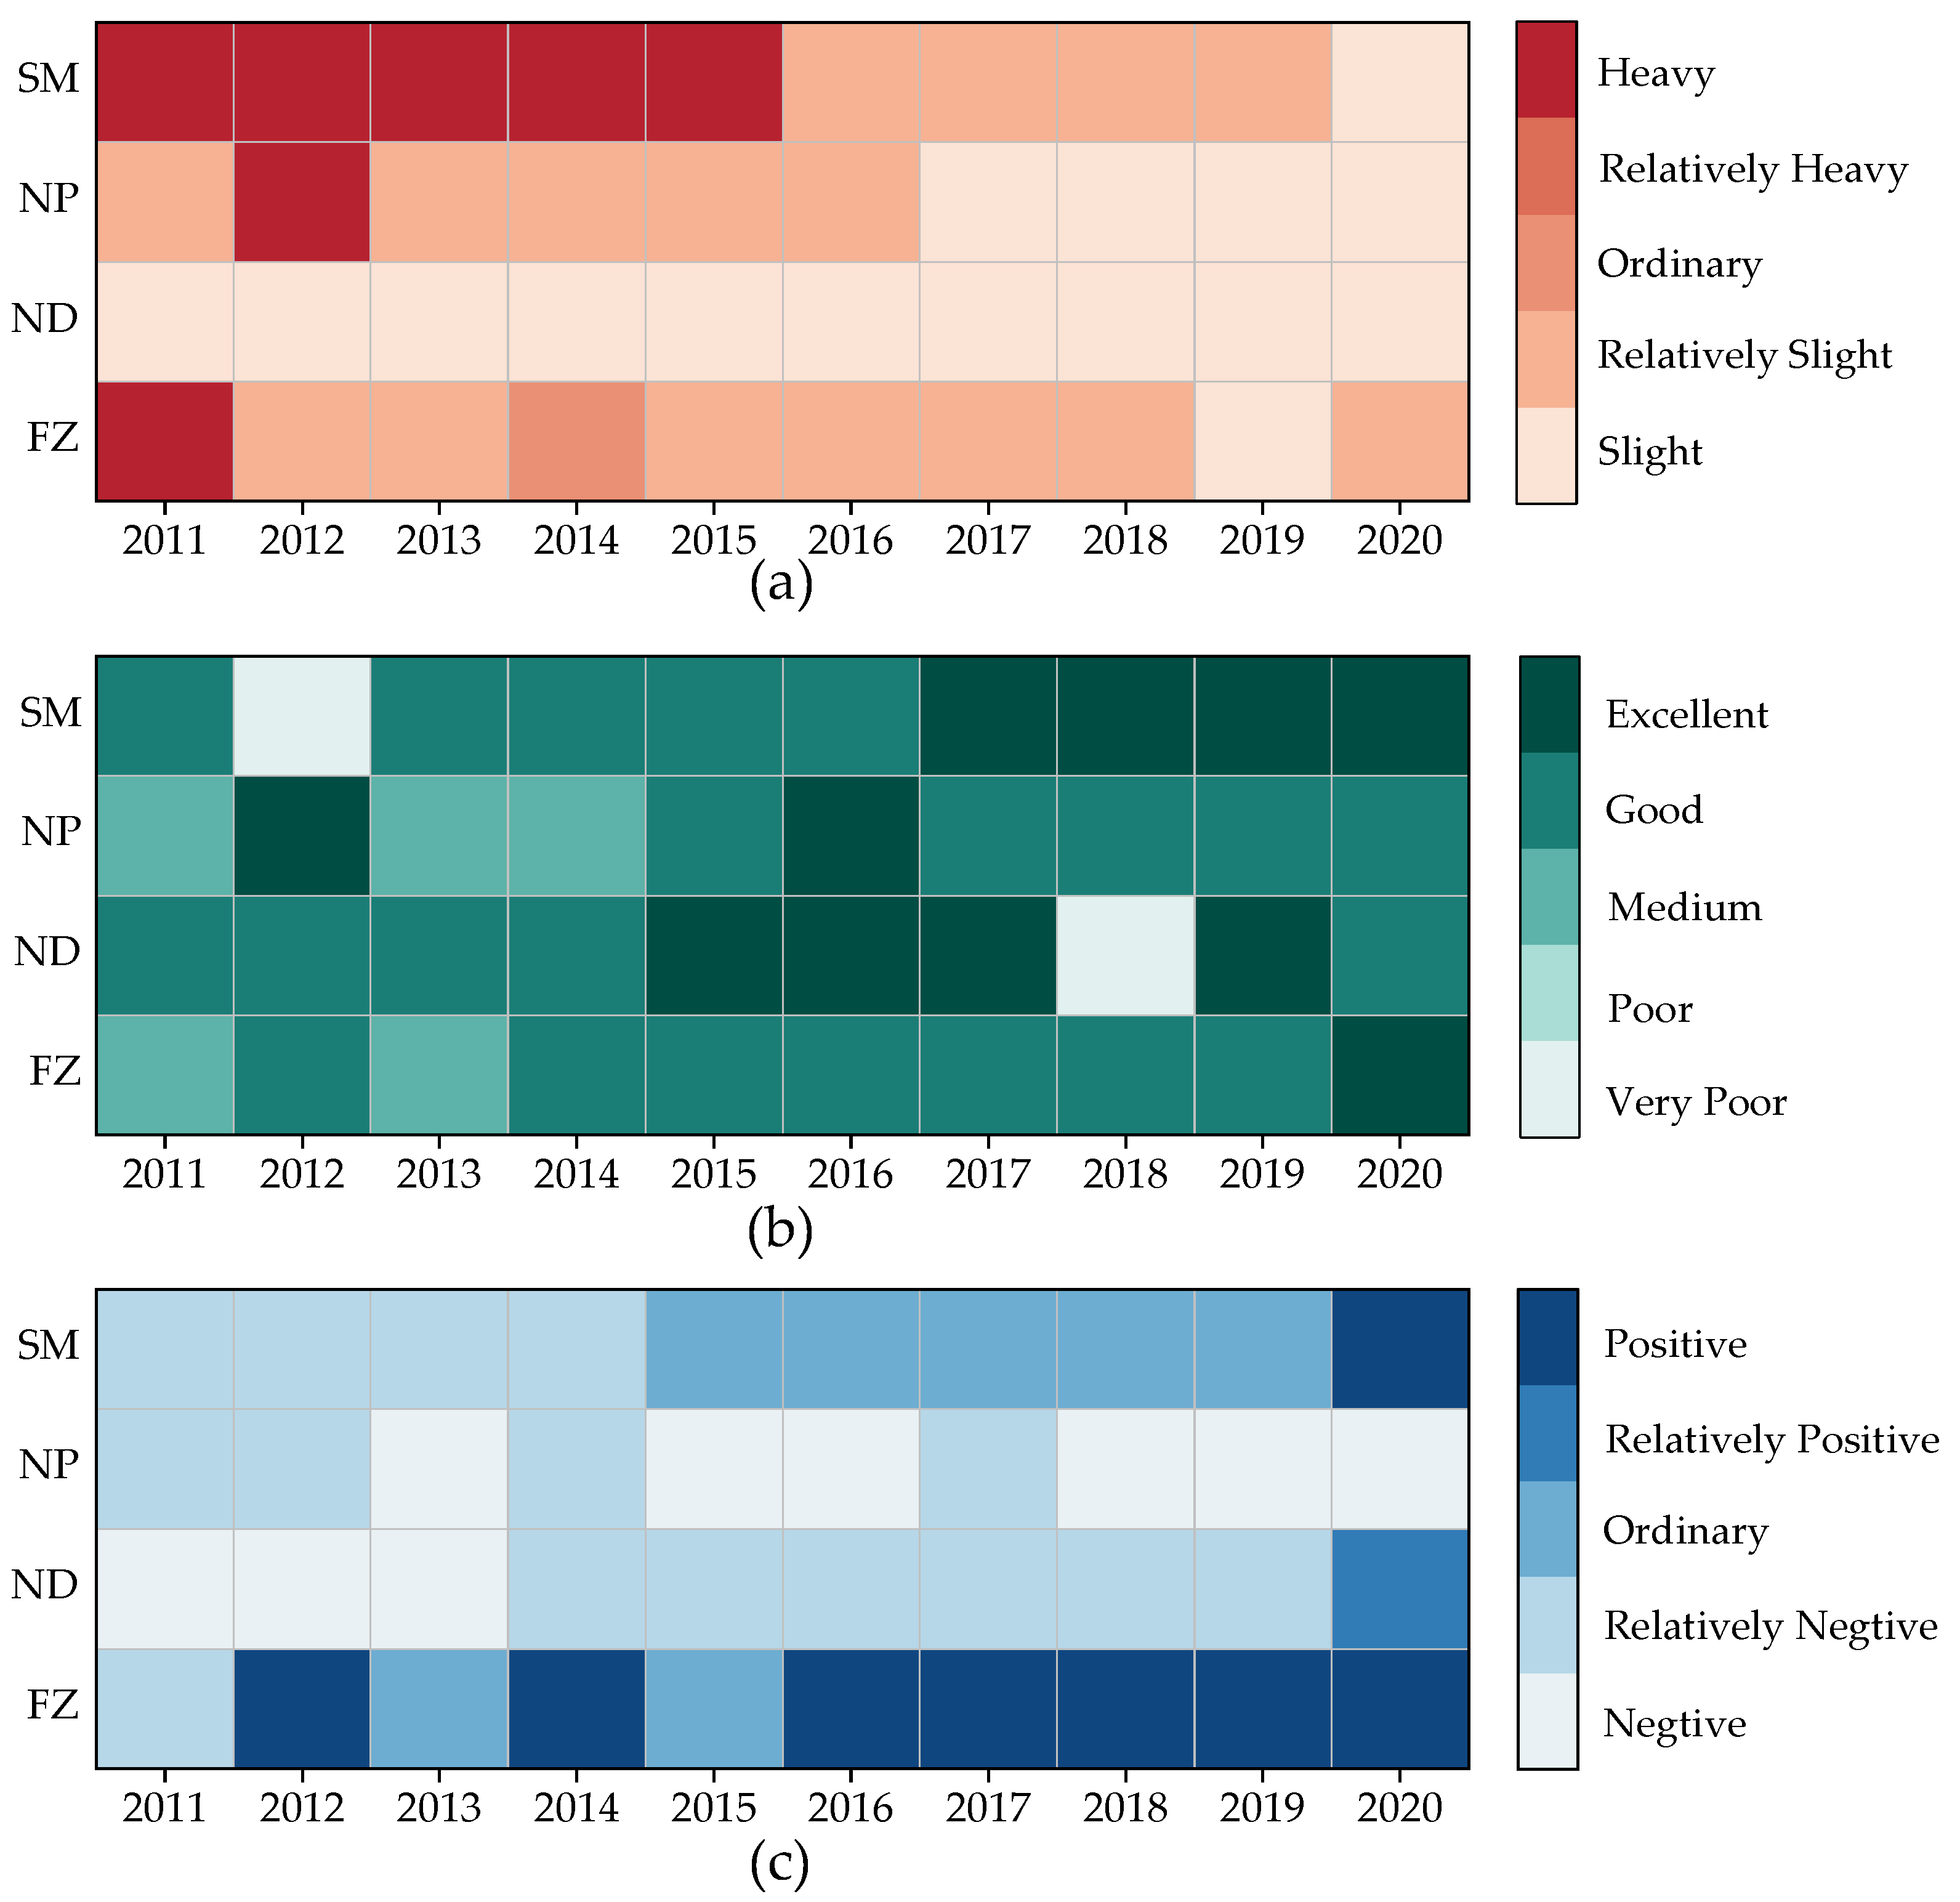
Pressure indicates opposition to the creation of WECC, namely, population increase and urban industrial endeavors. When the 10-year pressure on the cities around the basin was compared, it was found that Ningde experienced very little pressure during the study period. From 2011 to 2015, Sanming suffered high stress, which decreased to a comparatively low level in 2016. Nanping experienced heavy pressure in 2012, but the pressure was relatively mild and light in other years. During the research period, Fuzhou’s stress improved, with most years exhibiting relatively low stress levels, but particular years exhibiting high stresses (Figure 7a).
The state indicates the city’s water quality, coastal ecology, and other factors. The overall condition of the Min River Basin stayed above the medium level during the research period (Figure 7b), with only a few areas being in bad shape for some years.
The response is the human reaction to the WECC. Fuzhou’s response level showed a positive level. Sanming and Ningde’s reactions became progressively more positive during the research period. In 2011, Sanming was primarily negative but became medium and positive. Ningde shifted from negative to relatively positive. During the research period, Nanping’s response levels were negative and relatively pessimistic, and the region’s investments in WECC must be increased (Figure 7c).

4. Discussion

4.1. Multiple Regression Analysis

In order to comprehend the impact of each indicator on the level of WECC, a multiple regression analysis was undertaken, and a multiple linear regression equation was developed for the level of WECC and each indicator.
Y = 0.237 5.401 X 1 2.814 X 5 1.709 X 7 2.144 X 8 1.146 X 9 6.8 X 10 2.546 X 12 + 1.105 X 13 + 0.497 X 14 0.555 X 15 2.296 X 16 + 0.568 X 18 + 0.67 X 20 0.081 X 22 + 0.524 X 23 + 2.886 X 24 + 0.641 X 25 + 1.658 X 26 + 1.507 X 27 + 5.537 X 29 + 0.032 X 30
where the regression equation passed the significance test at p = 0.01 . All indicators passed the significance test at p = 0.05 . The model’s explainability on the level of WECC is 83.1% (Adjusted R 2 = 0.831 ).
In the multiple regression model, the sign of the coefficient shows whether an indicator is good for the WECC or bad for it. For example, the coefficient of population per square kilometer is −5.401, meaning that the level of WECC decreases by 5.401 units for each unit increase in population per square kilometer.

4.2. Negative Influence of Human Behavior on WECC

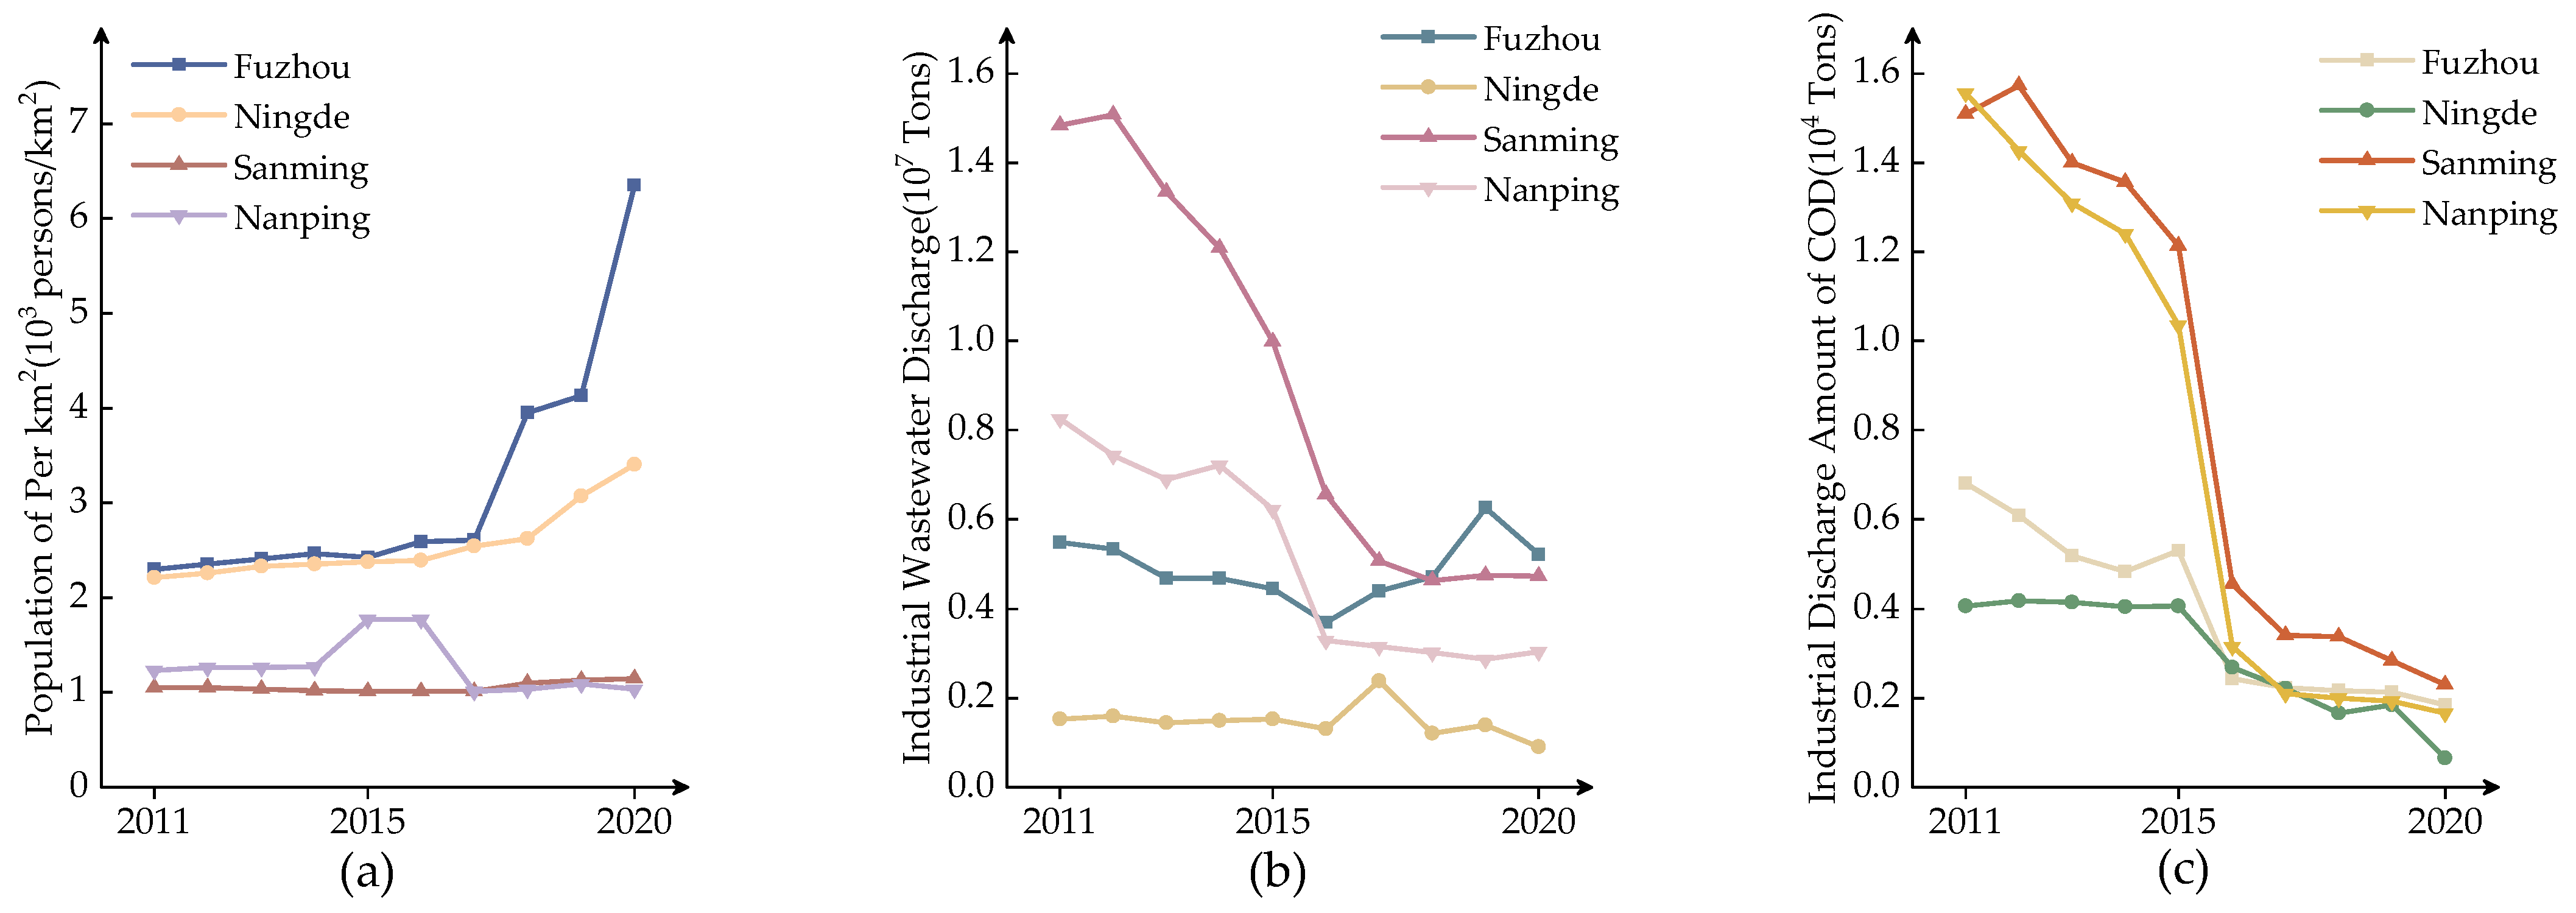
Human influences affect the aquatic ecological environment markedly more than other elements [39]. Social factors and industrial structures negatively influence the WECC [40]. Typically, in cities with a high degree of urbanization, as the urban population grows, the city’s infrastructure and scale also expand, as does the need for water [41]. As the population migrates, residential water demand and pollution rise, putting a greater strain on water supplies [42]. According to studies, the scale of Fuzhou city has grown by more than 20% in the past decade [43]. During the study interval, Fuzhou’s population density was much higher than in the other three cities (Figure 8a). With increasing population density, the carrying capacity of water resources in cities cannot keep up with the rate of urbanization.
Most cities in China have a secondary sector of the economy that is growing quickly, but industrial sophistication is low compared to developed countries [44]. The secondary industry is resource-intensive, energy-hungry, and one of the primary sources of environmental pollution [45,46]. Sanming and Nanping are the province’s oldest industrial centers, although, in recent years, to save resources and enhance the ecological quality of water, Sanming and Nanping have undertaken industrial upgrading. The industrial discharge of COD and wastewater discharge indexes of the two cities showed a declining trend year by year (Figure 8b,c). However, because regional manufacturing techniques cannot be modified, Sanming will not alter its secondary industry-driven growth quickly. The secondary sector remains the primary contributor to the region’s GDP [47]. Sanming’s industrial wastewater discharge and chemical oxygen demand emissions remain greater than in other locations. In Fuzhou, industrial wastewater discharge has also risen recently (Figure 8b). Therefore, compared to the other two regions, Sanming and Fuzhou are under more pressure.

4.3. Positive Influence of Human Behavior and Policies on WECC

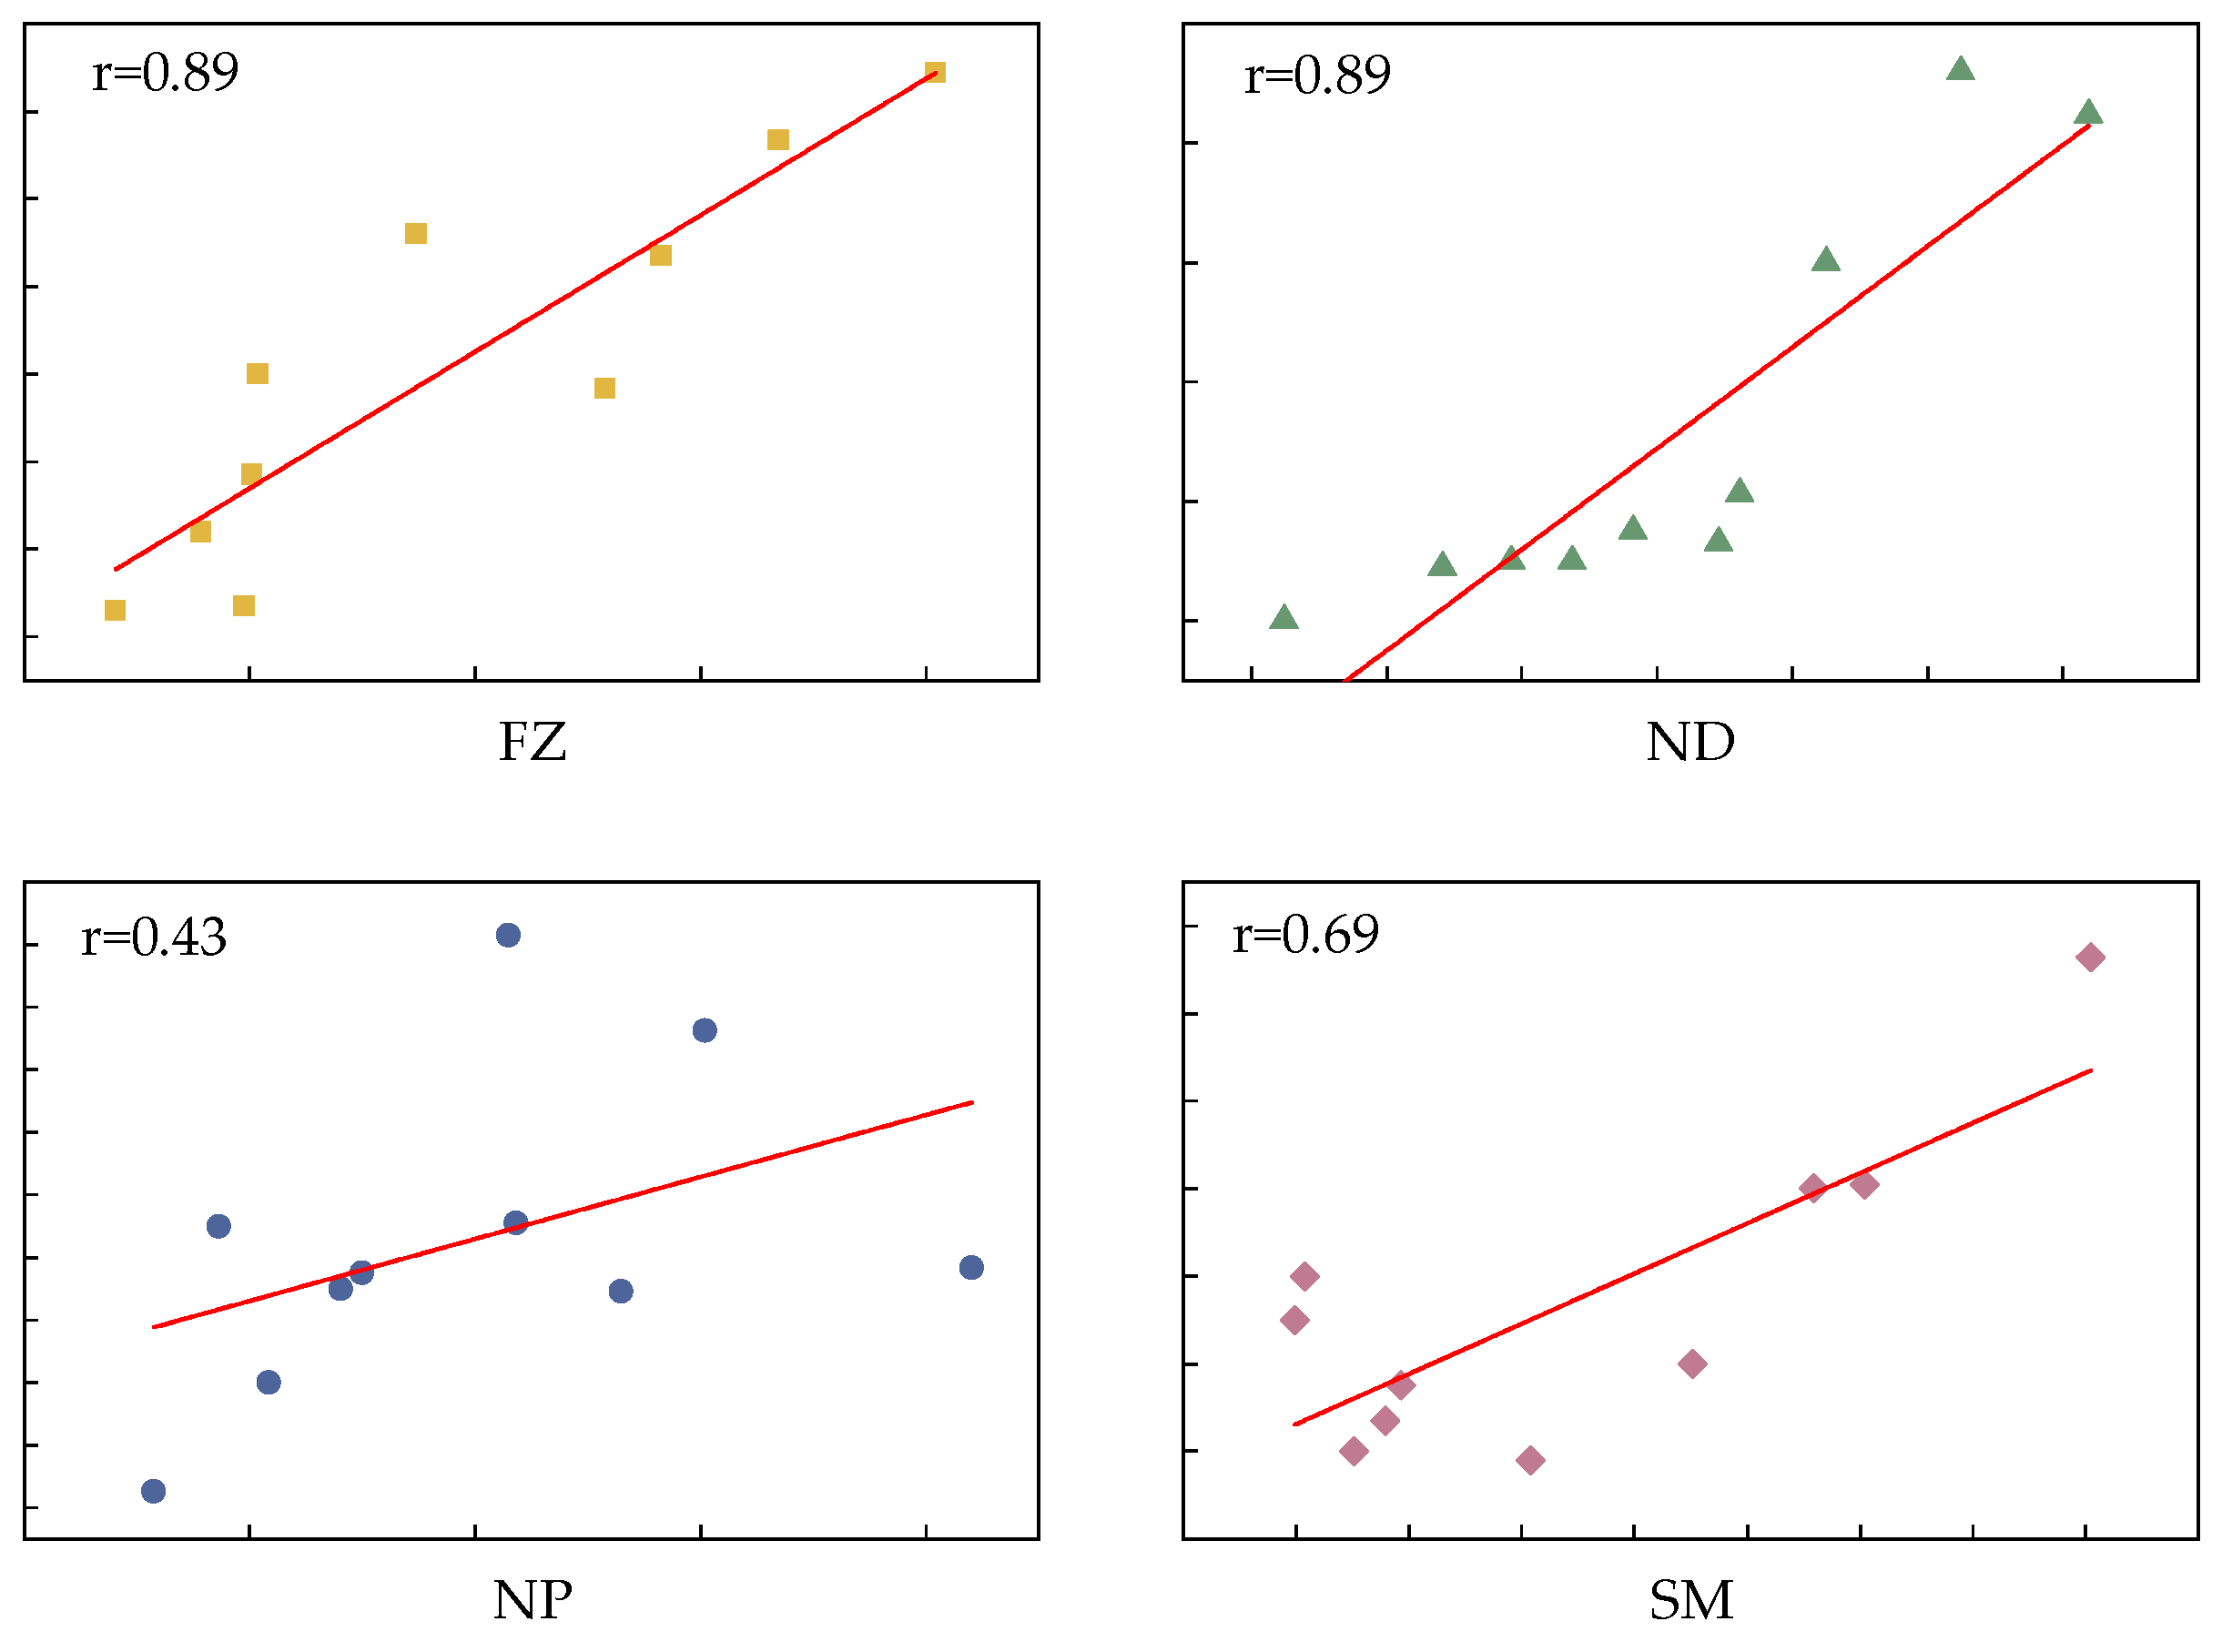
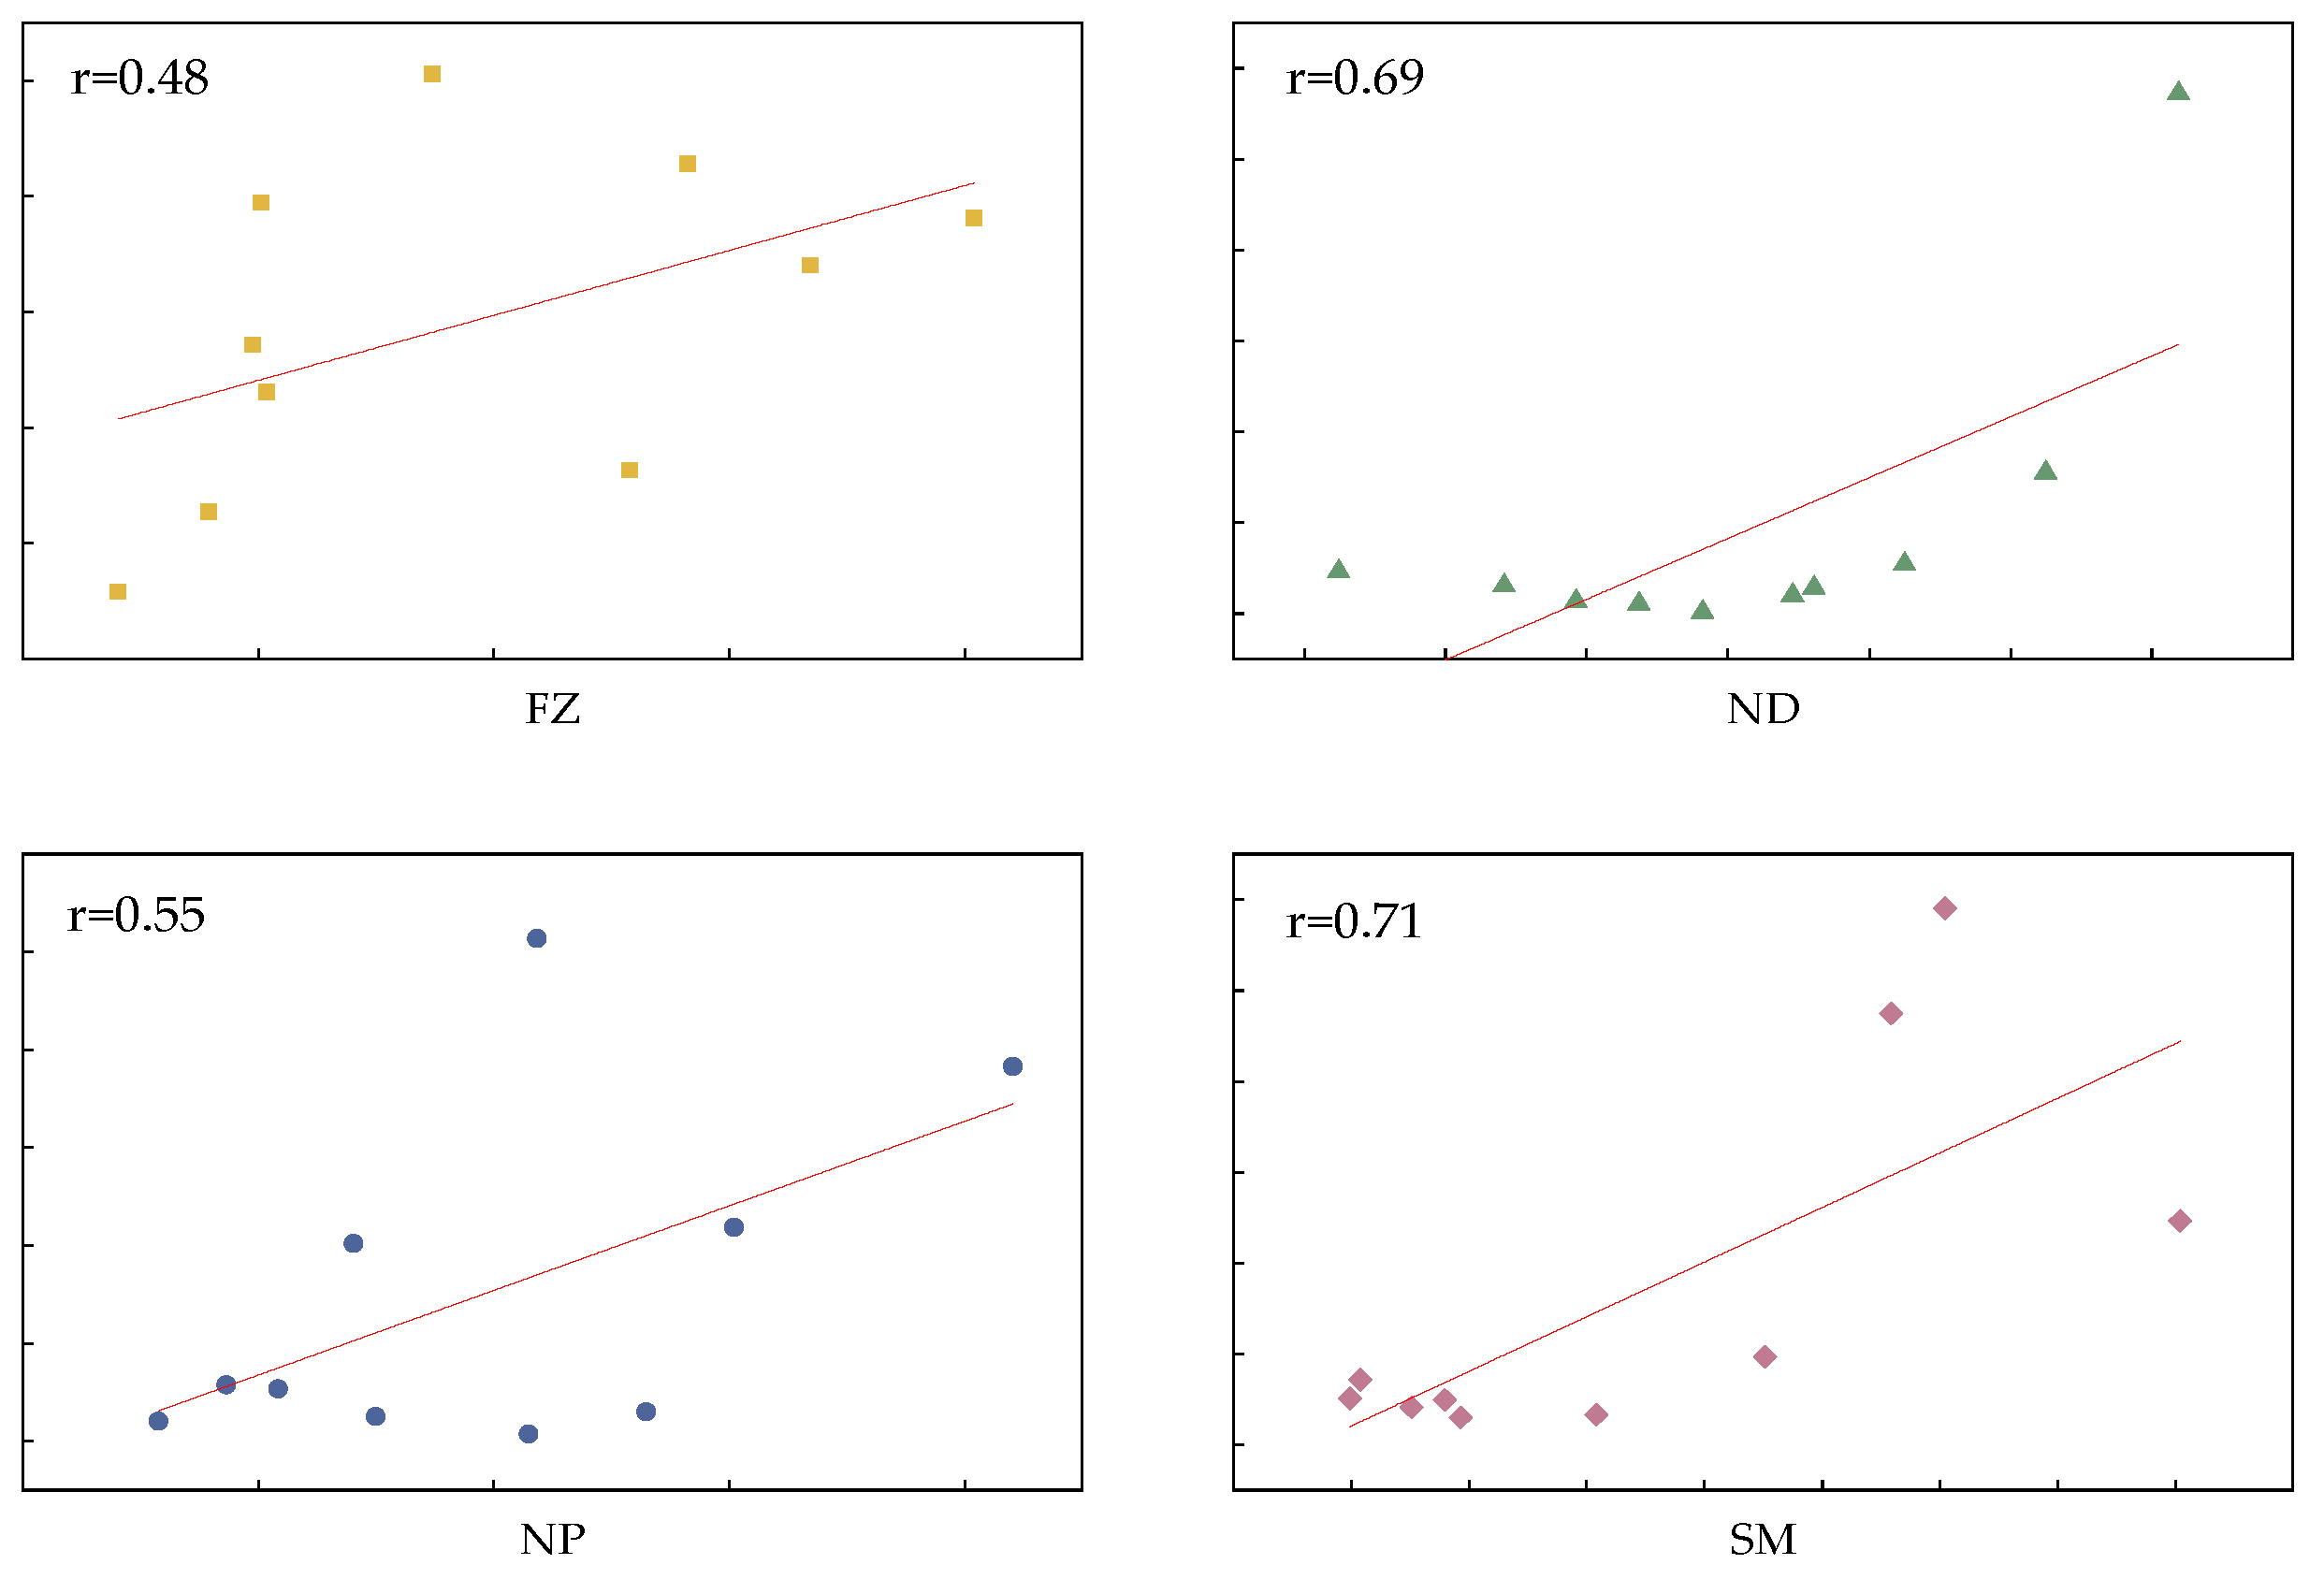
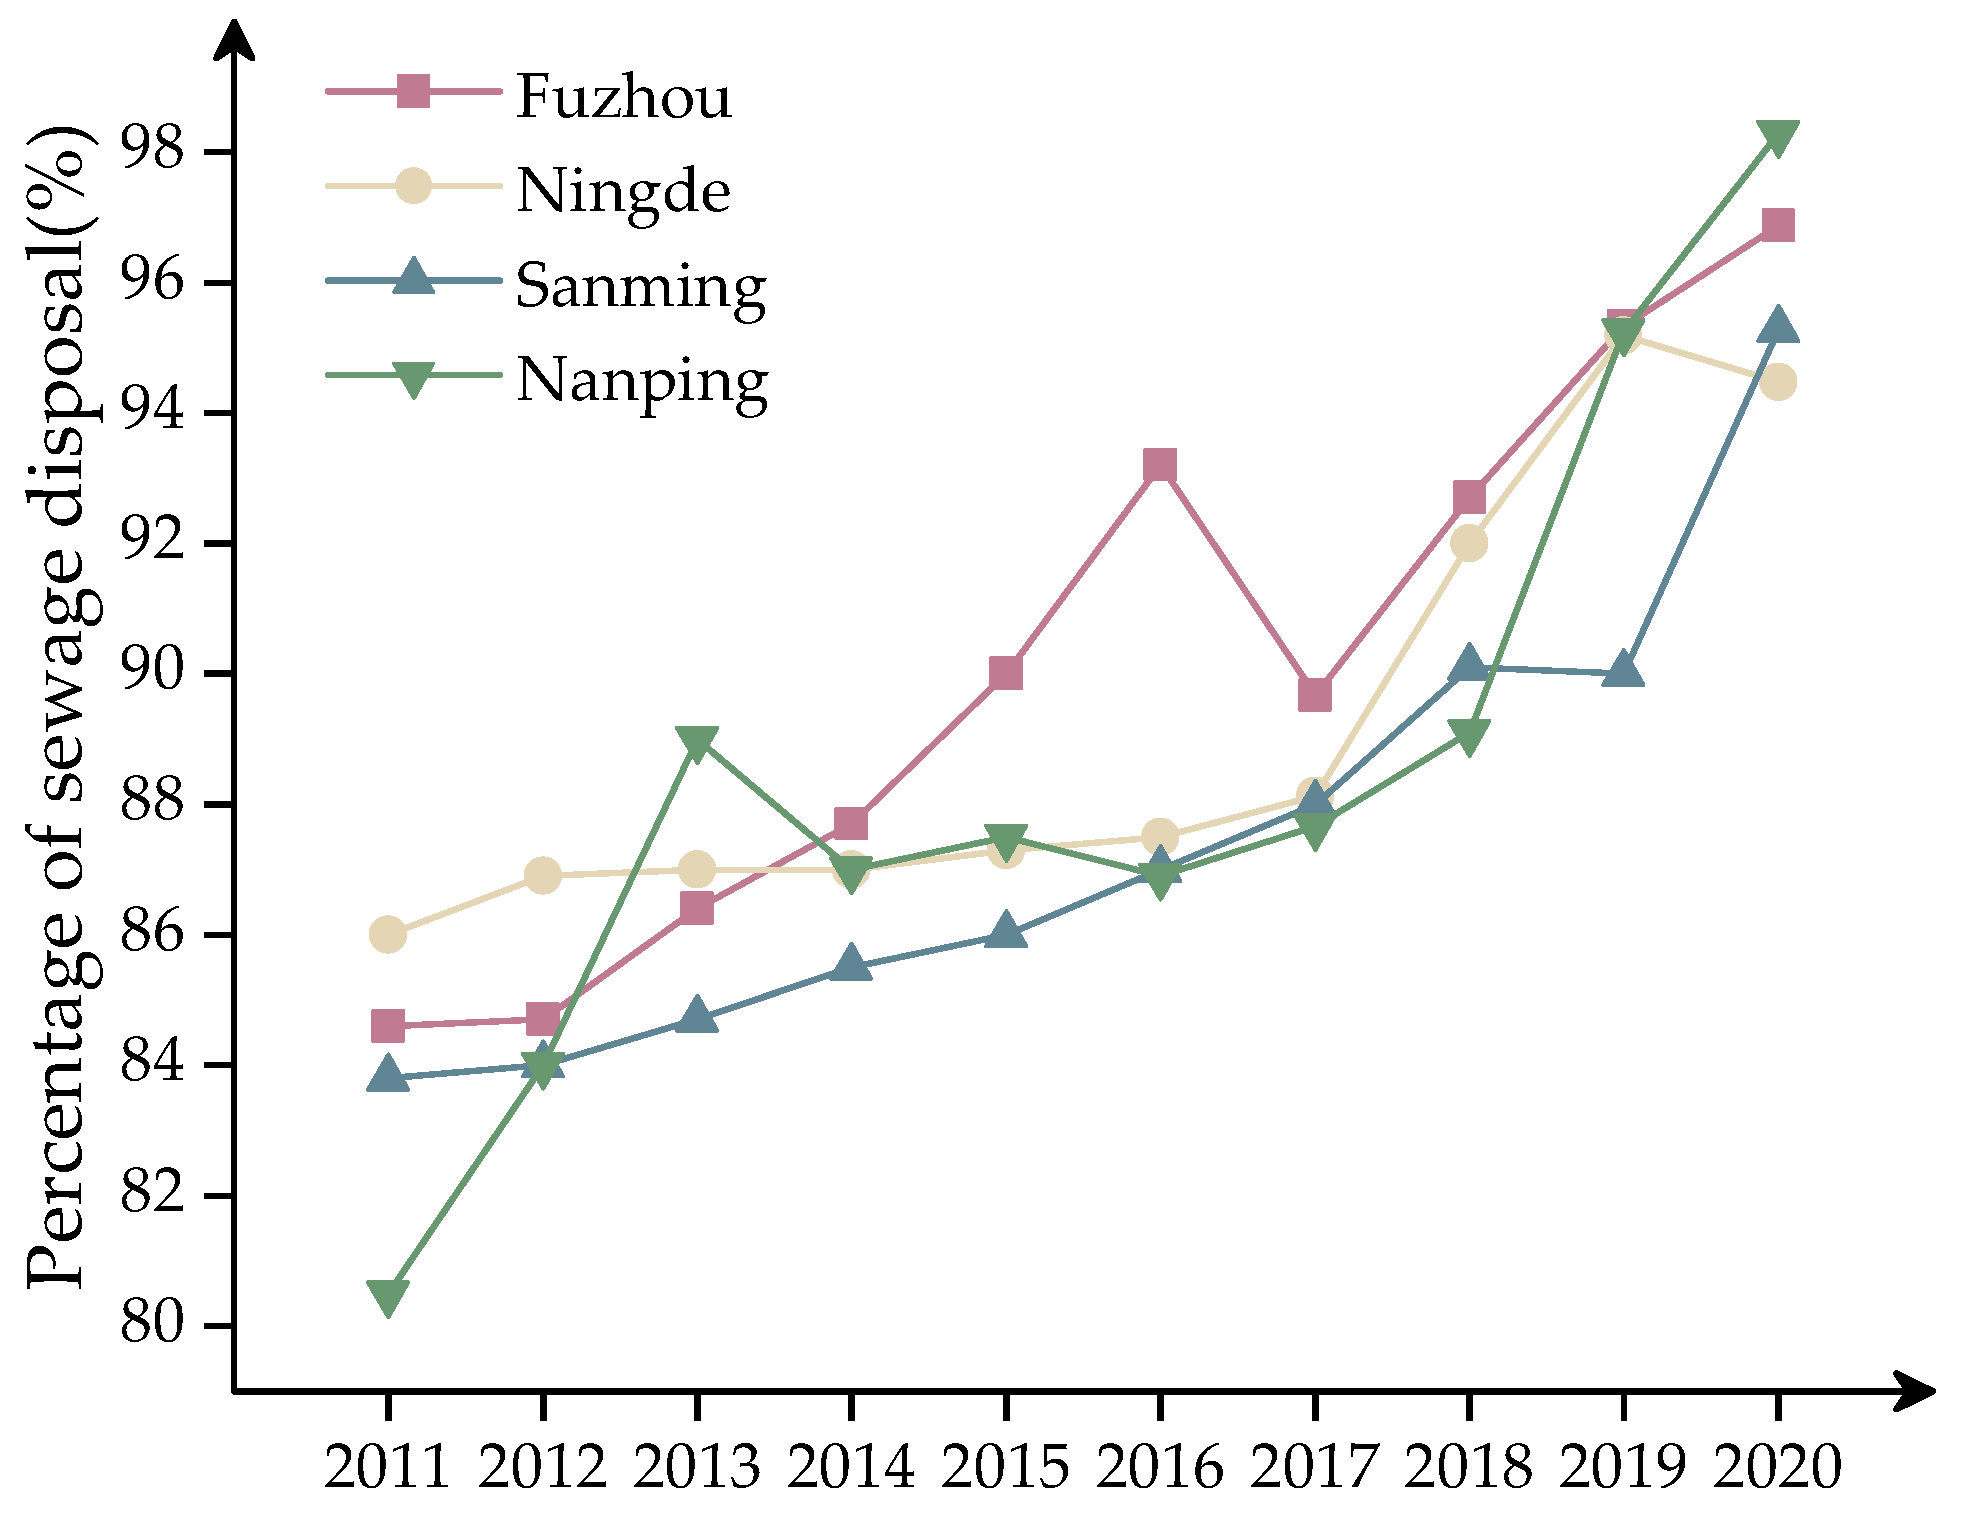
According to the findings, economic and environmental policies positively impact the WECC [40]. The economy’s growth raises government spending on environmental management and protection [48]. Financial environmental protection expenditures can improve the ecological environment [49]. We calculated the correlation coefficients between the regional GDP of the Min River Basin and the percentage of sewage disposal, and fixed asset investment in urban drainage and sewage treatment in each region (Figure 9 and Figure 10). Indeed, there is a positive association between investment in environmental management and preservation and, to varying degrees, the economic status of each area. The percentage of sewage disposal in Fuzhou, Ningde, and Sanming are strongly related to the level of economic development in those cities. In Nanping, however, the relationship is moderately correlated. Figure 11 shows that the percentage of sewage disposal in each area improved over the study.
In addition, Fujian Province enacted its important watershed ecological compensation method rules in 2015, spending over 1 billion (RMB) annually on ecological compensation in the watershed [50,51]. Local governments have taken various measures to safeguard the basin’s aquatic ecosystem. The municipal government of Nanping strictly manages water resources, including industrial, animal, and poultry water, and regulates pollution emissions [52]. Sanming carried out the conservation and restoration of the Min River Basin’s mountains, rivers, woods, farms, lakes, and grasses [53]. Fuzhou has put a high priority on preventing and taking care of sewage from urban and rural homes, as well as sewage from industrial parks [54]. These measures are essential for creating a water-friendly civilization.

5. Conclusions

In this study, the level of WECC in the Min River Basin is thoroughly evaluated, and WECC development and distribution are further studied by using relevant indicators. This work is predicated chiefly on the PSR model to develop a unique index system for a complete assessment of the degree of WECC in the Min River Basin. Grey Markov prediction and R-type factor clustering were applied to supplement and filter the data, and indicators were used to provide a more comprehensive and appropriate index system. The matter-element extension model was applied to determine how much WECC there is in the Min River Basin. Our findings indicate that there are substantial disparities in the degree of WECC across areas and that, through time, the level of each region has increased and the disparity has shrunk. The modernization of national policies and industrial structures has played a notable role in developing a water-friendly society. These findings may guide the development of an urban water ecological civilization and assist in enhancing its environment.

Supplementary Materials

The following supporting information can be downloaded at: https://www.mdpi.com/article/10.3390/su142315753/s1, Table S1: Classical domain and segmental domain of the evaluation system.

Author Contributions

Conceptualization, Y.W. and T.Y.; methodology, Y.W. and Y.X. (Yihan Xu); software, S.L.; validation, S.L.; J.N. and X.Y.; formal analysis, Y.X. (Yihan Xu); investigation, X.Y.; resources, J.N.; data curation, Y.X. (Yanglan Xiao); writing—original draft preparation, Y.W. and Y.X. (Yihan Xu); writing—review and editing, Y.W.; supervision, T.Y.; project administration, S.L. All authors have read and agreed to the published version of the manuscript.

Funding

This research was funded by the Social Science Foundation of Fujian Province, China (Grant No.FJ2018B063).

Institutional Review Board Statement

Not applicable.

Informed Consent Statement

Not applicable.

Data Availability Statement

Not applicable.

Acknowledgments

Thanks to the reviewers and their suggestions for this work. We thank Lucy Muir for editing the English text of a draft of this manuscript.

Conflicts of Interest

The authors declare no conflict of interest.

References

  1. Grizzetti, B.; Lanzanova, D.; Liquete, C.; Reynaud, A.; Cardoso, A.C. Assessing Water Ecosystem Services for Water Resource Management. Environ. Sci. Policy 2016, 61, 194–203. [Google Scholar] [CrossRef]
  2. Day, K.A. China’s Environment and the Challenge of Sustainable Development, 1st ed.; Routledge: London, UK, 2004. [Google Scholar]
  3. Poff, N.L.; Allan, J.D.; Bain, M.B.; Karr, J.R.; Prestegaard, K.L.; Richter, B.D.; Sparks, R.E.; Stromberg, J.C. The Natural Flow Regime. BioScience 1997, 47, 769–784. [Google Scholar] [CrossRef]
  4. Yunus, A.P.; Masago, Y.; Hijioka, Y. COVID-19 and Surface Water Quality: Improved Lake Water Quality during the Lockdown. Sci. Total Environ. 2020, 731, 139012. [Google Scholar] [CrossRef]
  5. Wang, J.; Wei, X.; Guo, Q. A Three-Dimensional Evaluation Model for Regional Carrying Capacity of Ecological Environment to Social Economic Development: Model Development and a Case Study in China. Ecol. Indic. 2018, 89, 348–355. [Google Scholar] [CrossRef]
  6. UN Department of Economic and Social Affairs. The 2030 Agenda for Sustainable Development. Available online: https://sdgs.un.org/goals (accessed on 8 October 2022).
  7. Liu, H.; Wang, L. Construction of Urban Water Ecological Civilization System. IOP Conf. Ser. Earth Environ. Sci. 2018, 170, 032111. [Google Scholar] [CrossRef]
  8. Hansen, M.H.; Li, H.; Svarverud, R. Ecological Civilization: Interpreting the Chinese Past, Projecting the Global Future. Glob. Environ. Chang. 2018, 53, 195–203. [Google Scholar] [CrossRef]
  9. Jiang, M.D.; Wang, H.L.; Wang, J. Construction of Eco-Civilization of Water Based on Human-Water Harmony. Appl. Mech. Mater. 2014, 641–642, 477–480. [Google Scholar] [CrossRef]
  10. Zhang, L.; Wang, H.; Zhang, W.; Wang, C.; Bao, M.; Liang, T.; Liu, K. Study on the Development Patterns of Ecological Civilization Construction in China: An Empirical Analysis of 324 Prefectural Cities. J. Clean. Prod. 2022, 367, 132975. [Google Scholar] [CrossRef]
  11. Wu, C. A Preliminary Study of the Cultures of the Pre-Qin and Han Periods in the Minjiang River Vally. Acta Archaeol. Sin. 1995, 2, 147–172. [Google Scholar]
  12. Zhong, H. The Multi-Cultural Factors in the Process of Civilization Origin of Min River Basin. Master’s Thesis, Xiamen University, Xiamen, China, 2009. [Google Scholar]
  13. Shui, H. On the Economic Relations Between the Ports and Their Hinterlands in Morern Times. J. Xiamen Univ. Arts Soc. Sci. 2006, 2006, 42–49. [Google Scholar]
  14. Luo, P.; Zhang, M.; Cheng, J. A Discussion on the Problems of Tourism Transportation in Fuzhou City and Its Developing Countermeasures. J. Fujian Norm. Univ. Nat. Sci. Ed. 2001, 3, 96–102. [Google Scholar]
  15. Wang, J. Comprehensive Evaluation of the Effect of the Later Stage Supporting Policy to the Reservoir Resettlements. Master’s Thesis, North China University of Water Resources and Electric Power, Zhengzhou, China, 2014. [Google Scholar]
  16. The Min River. Available online: https://baike.baidu.com/item/%E9%97%BD%E6%B1%9F?fromModule=lemma_search-box (accessed on 8 October 2022).
  17. Tang, D.; Liu, X.; Zou, X. An Improved Method for Integrated Ecosystem Health Assessments Based on the Structure and Function of Coastal Ecosystems: A Case Study of the Jiangsu Coastal Area, China. Ecol. Indic. 2018, 84, 82–95. [Google Scholar] [CrossRef]
  18. Li, W.; Liu, C.; Su, W.; Ma, X.; Zhou, H.; Wang, W.; Zhu, G. Spatiotemporal Evaluation of Alpine Pastoral Ecosystem Health by Using the Basic-Pressure-State-Response Framework: A Case Study of the Gannan Region, Northwest China. Ecol. Indic. 2021, 129, 108000. [Google Scholar] [CrossRef]
  19. Mariano, D.A.; dos Santos, C.A.C.; Wardlow, B.D.; Anderson, M.C.; Schiltmeyer, A.V.; Tadesse, T.; Svoboda, M.D. Use of Remote Sensing Indicators to Assess Effects of Drought and Human-Induced Land Degradation on Ecosystem Health in Northeastern Brazil. Remote Sens. Environ. 2018, 213, 129–143. [Google Scholar] [CrossRef]
  20. Neri, A.C.; Dupin, P.; Sánchez, L.E. A Pressure–State–Response Approach to Cumulative Impact Assessment. J. Clean. Prod. 2016, 126, 288–298. [Google Scholar] [CrossRef]
  21. Martins, J.H.; Camanho, A.S.; Gaspar, M.B. A Review of the Application of Driving Forces—Pressure—State—Impact—Response Framework to Fisheries Management. Ocean Coast. Manag. 2012, 69, 273–281. [Google Scholar] [CrossRef]
  22. Wolfslehner, B.; Vacik, H. Evaluating Sustainable Forest Management Strategies with the Analytic Network Process in a Pressure-State-Response Framework. J. Environ. Manag. 2008, 88, 1–10. [Google Scholar] [CrossRef]
  23. Pirrone, N.; Trombino, G.; Cinnirella, S.; Algieri, A.; Bendoricchio, G.; Palmeri, L. The Driver-Pressure-State-Impact-Response (DPSIR) Approach for Integrated Catchment-Coastal Zone Management: Preliminary Application to the Po Catchment-Adriatic Sea Coastal Zone System. Reg. Environ. Chang. 2005, 5, 111–137. [Google Scholar] [CrossRef]
  24. Yang, W.; Zhang, Z.; Sun, T.; Liu, H.; Shao, D. Marine Ecological and Environmental Health Assessment Using the Pressure-State-Response Framework at Different Spatial Scales, China. Ecol. Indic. 2021, 121, 106965. [Google Scholar] [CrossRef]
  25. Li, W.; Qi, J.; Huang, S.; Fu, W.; Zhong, L.; He, B. A Pressure-State-Response Framework for the Sustainability Analysis of Water National Parks in China. Ecol. Indic. 2021, 131, 108127. [Google Scholar] [CrossRef]
  26. Malekmohammadi, B.; Jahanishakib, F. Vulnerability Assessment of Wetland Landscape Ecosystem Services Using Driver-Pressure-State-Impact-Response (DPSIR) Model. Ecol. Indic. 2017, 82, 293–303. [Google Scholar] [CrossRef]
  27. Li, Y.; Li, Z.; Wang, J.; Zeng, H. Analyses of Driving Factors on the Spatial Variations in Regional Eco-Environmental Quality Using Two Types of Species Distribution Models: A Case Study of Minjiang River Basin, China. Ecol. Indic. 2022, 139, 108980. [Google Scholar] [CrossRef]
  28. Govindan, K.; Ramalingam, S.; Broumi, S. Traffic Volume Prediction Using Intuitionistic Fuzzy Grey-Markov Model. Neural Comput. Appl. 2021, 33, 12905–12920. [Google Scholar] [CrossRef]
  29. Liu, D.; Feng, J.; Li, H.; Fu, Q.; Li, M.; Faiz, M.A.; Ali, S.; Li, T.; Khan, M.I. Spatiotemporal Variation Analysis of Regional Flood Disaster Resilience Capability Using an Improved Projection Pursuit Model Based on the Wind-Driven Optimization Algorithm. J. Clean. Prod. 2019, 241, 118406. [Google Scholar] [CrossRef]
  30. Xu, J. Construction of the Evaluation Index System of “Five Development Concepts” Based on R-Type Clustering and Variation Coefficient in Hunan Province. IOP Conf. Ser. Mater. Sci. Eng. 2018, 11, 742–750. [Google Scholar] [CrossRef] [Green Version]
  31. Wang, S.-X.; Ge, L.-J.; Cai, S.-X.; Zhang, D. An Improved Interval AHP Method for Assessment of Cloud Platform-Based Electrical Safety Monitoring System. J. Electr. Eng. Technol. 2017, 12, 959–968. [Google Scholar] [CrossRef] [Green Version]
  32. Ahmed, F.; Kilic, K. Fuzzy Analytic Hierarchy Process: A Performance Analysis of Various Algorithms. Fuzzy Sets Syst. 2019, 362, 110–128. [Google Scholar] [CrossRef]
  33. Wang, Y.-Q.; Ge, L.; Zhang, N. Hybrid Evaluation Method for Dispatching Control Level of Smart Distribution Network. J. Electr. Eng. Technol. 2019, 14, 2263–2275. [Google Scholar] [CrossRef]
  34. Hsiao, Y.-T. Multiobjective Evolution Programming Method for Feeder Reconfiguration. IEEE Trans. Power Syst. 2004, 19, 594–599. [Google Scholar] [CrossRef]
  35. Thomas, B.M.; Doesken, N.J.; Kleist, J.R. The Relationship of Drought Frequency and Duration to Time Scales. In Proceedings of the 8th Conference on Applied Climatology, Anaheim, CA, USA, 17–22 January 1993; pp. 17–22. [Google Scholar]
  36. Li, S.; Yang, G.; Wang, H. The Runoff Evolution and the Differences Analysis of the Causes of Runoff Change in Different Regions: A Case of the Weihe River Basin, Northern China. Sustainability 2019, 11, 5295. [Google Scholar] [CrossRef] [Green Version]
  37. Huang, C.; Li, H. Interview of Liang Baoxiang: From the Construction of Xin’anjiang Hydropower Station to the Regulation of Qiantang River Estuary. Zhejiang Hydrotech. 2021, 2021, 91–99. [Google Scholar]
  38. Xie, J.; Yang, Y.; Chen, G. Discussion on Causes of Frequent Flood Disaster the Upper Reaches of Minjiang River. Soil Water Conserv. Fujian 1999, 11, 12–17. [Google Scholar]
  39. Zhang, W. Research on the Harmonious Relationship between Human and Water. Master’s Thesis, Chang’an University, Xi’an, China, 2019. [Google Scholar]
  40. Li, J. Evaluation and Influencing Factors of Water Ecological Civilization in Central City of Urban Agglomeration in China. Master’s Thesis, Shaanxi Normal University, Xi’an, China, 2019. [Google Scholar]
  41. Fay, M.; Wang, J.; Draugelis, G.; Deichmann, U. Role of Green Governance in Achieving Sustainable Urbanization in China. China World Econ. 2014, 22, 19–36. [Google Scholar] [CrossRef]
  42. Hogan, D.J. Population Growth and the Environment. Rev. Bras. Estud. Popul. 1991, 8, 61–71. [Google Scholar]
  43. Duan, W.; Wu, F.; Wang, M. Policy Bias, Primacy of Provincial Capital and City-Size Distribution. China Ind. Econ. 2020, 2020, 42–60. [Google Scholar]
  44. Li, Z.; Zhang, Y.; Yu, F.; Tang, X. The Temporal and Spatial Evolution of the Upgrading Level of China’s Industrial Structure. J. Hubei Univ. Arts Sci. 2021, 42, 31–36. [Google Scholar]
  45. Li, Y. Prediction of Energy Consumption: Variable Regression or Time Series? A Case in China. Energy Sci. Eng. 2019, 7, 2510–2518. [Google Scholar] [CrossRef]
  46. Lv, M. Research on Coordinated Development of Automobile Industry and Ecological Environment in Chongqing Based on Coupling Model. Master’s Thesis, Chongqing University of Technology, Chongqing, China, 2021. [Google Scholar]
  47. People’s Government of Sanming City. 2021 Sanming City National Economic and Social Development Statistical Bulletin. Available online: http://www.sm.gov.cn/zw/tjxx/tjgb/202203/t20220314_1765255.htm (accessed on 16 November 2022).
  48. Mavragani, A.; Nikolaou, I.; Tsagarakis, K. Open Economy, Institutional Quality, and Environmental Performance: A Macroeconomic Approach. Sustainability 2016, 8, 601. [Google Scholar] [CrossRef]
  49. Tang, K. A Study on the Influence of Fiscal Expenditure on Energy Conservation and Environmental Protection on Ecological Quality in Jisngxi Province—Based on STIRPAT Model. Master’s Thesis, Jiangxi University of Finance Economics, Nanchang, China, 2020. [Google Scholar]
  50. People’s Government of Fujian Province. Measures for Ecological Protection Compensation in Key River Basins of Fujian Province. Available online: http://zfgb.fujian.gov.cn/8332 (accessed on 16 November 2022).
  51. National Development and Reform Commission, PRC. Ecological Compensation in Fujian Province to Achieve a Win-Win Situation for Both the Protector and the Beneficiary. Available online: https://www.ndrc.gov.cn/fggz/202008/t20200812_1236044.html?code=&state=123 (accessed on 16 November 2022).
  52. Wang, S.; Li, D.; Li, T. Development of Ecological Environment Protection in PRC in the Past 70 Years: Evolution from Pollution Control to Ecological Compensation. Contemp. Econ. Manag. 2021, 43, 36–42. [Google Scholar]
  53. People’s Government of Sanming City. Sanming City Promoted Comprehensive Ecological and Environmental Improvement in the Minjiang River Basin. Available online: http://www.sm.gov.cn/zw/zfxxgkzdgz/hjbh/wrfz0/202106/t20210624_1677686.htm (accessed on 16 November 2022).
  54. People’s Government of Fuzhou City. Notice of the General Office of Fuzhou Municipal People’s Government on Printing and Distributing the Work Plan for Further Promoting the Comprehensive Ecological Environment Management in Fuzhou Section of Minjiang River Basin. Available online: http://www.fuzhou.gov.cn/zfxxgkzl/szfbmjxsqxxgk/szfbmxxgk/fzsrmzfbgt/zfxxgkml/hjbhggwsaqscspypcpzldjdjcqk_2579/202104/t20210421_4080744.htm (accessed on 16 November 2022).
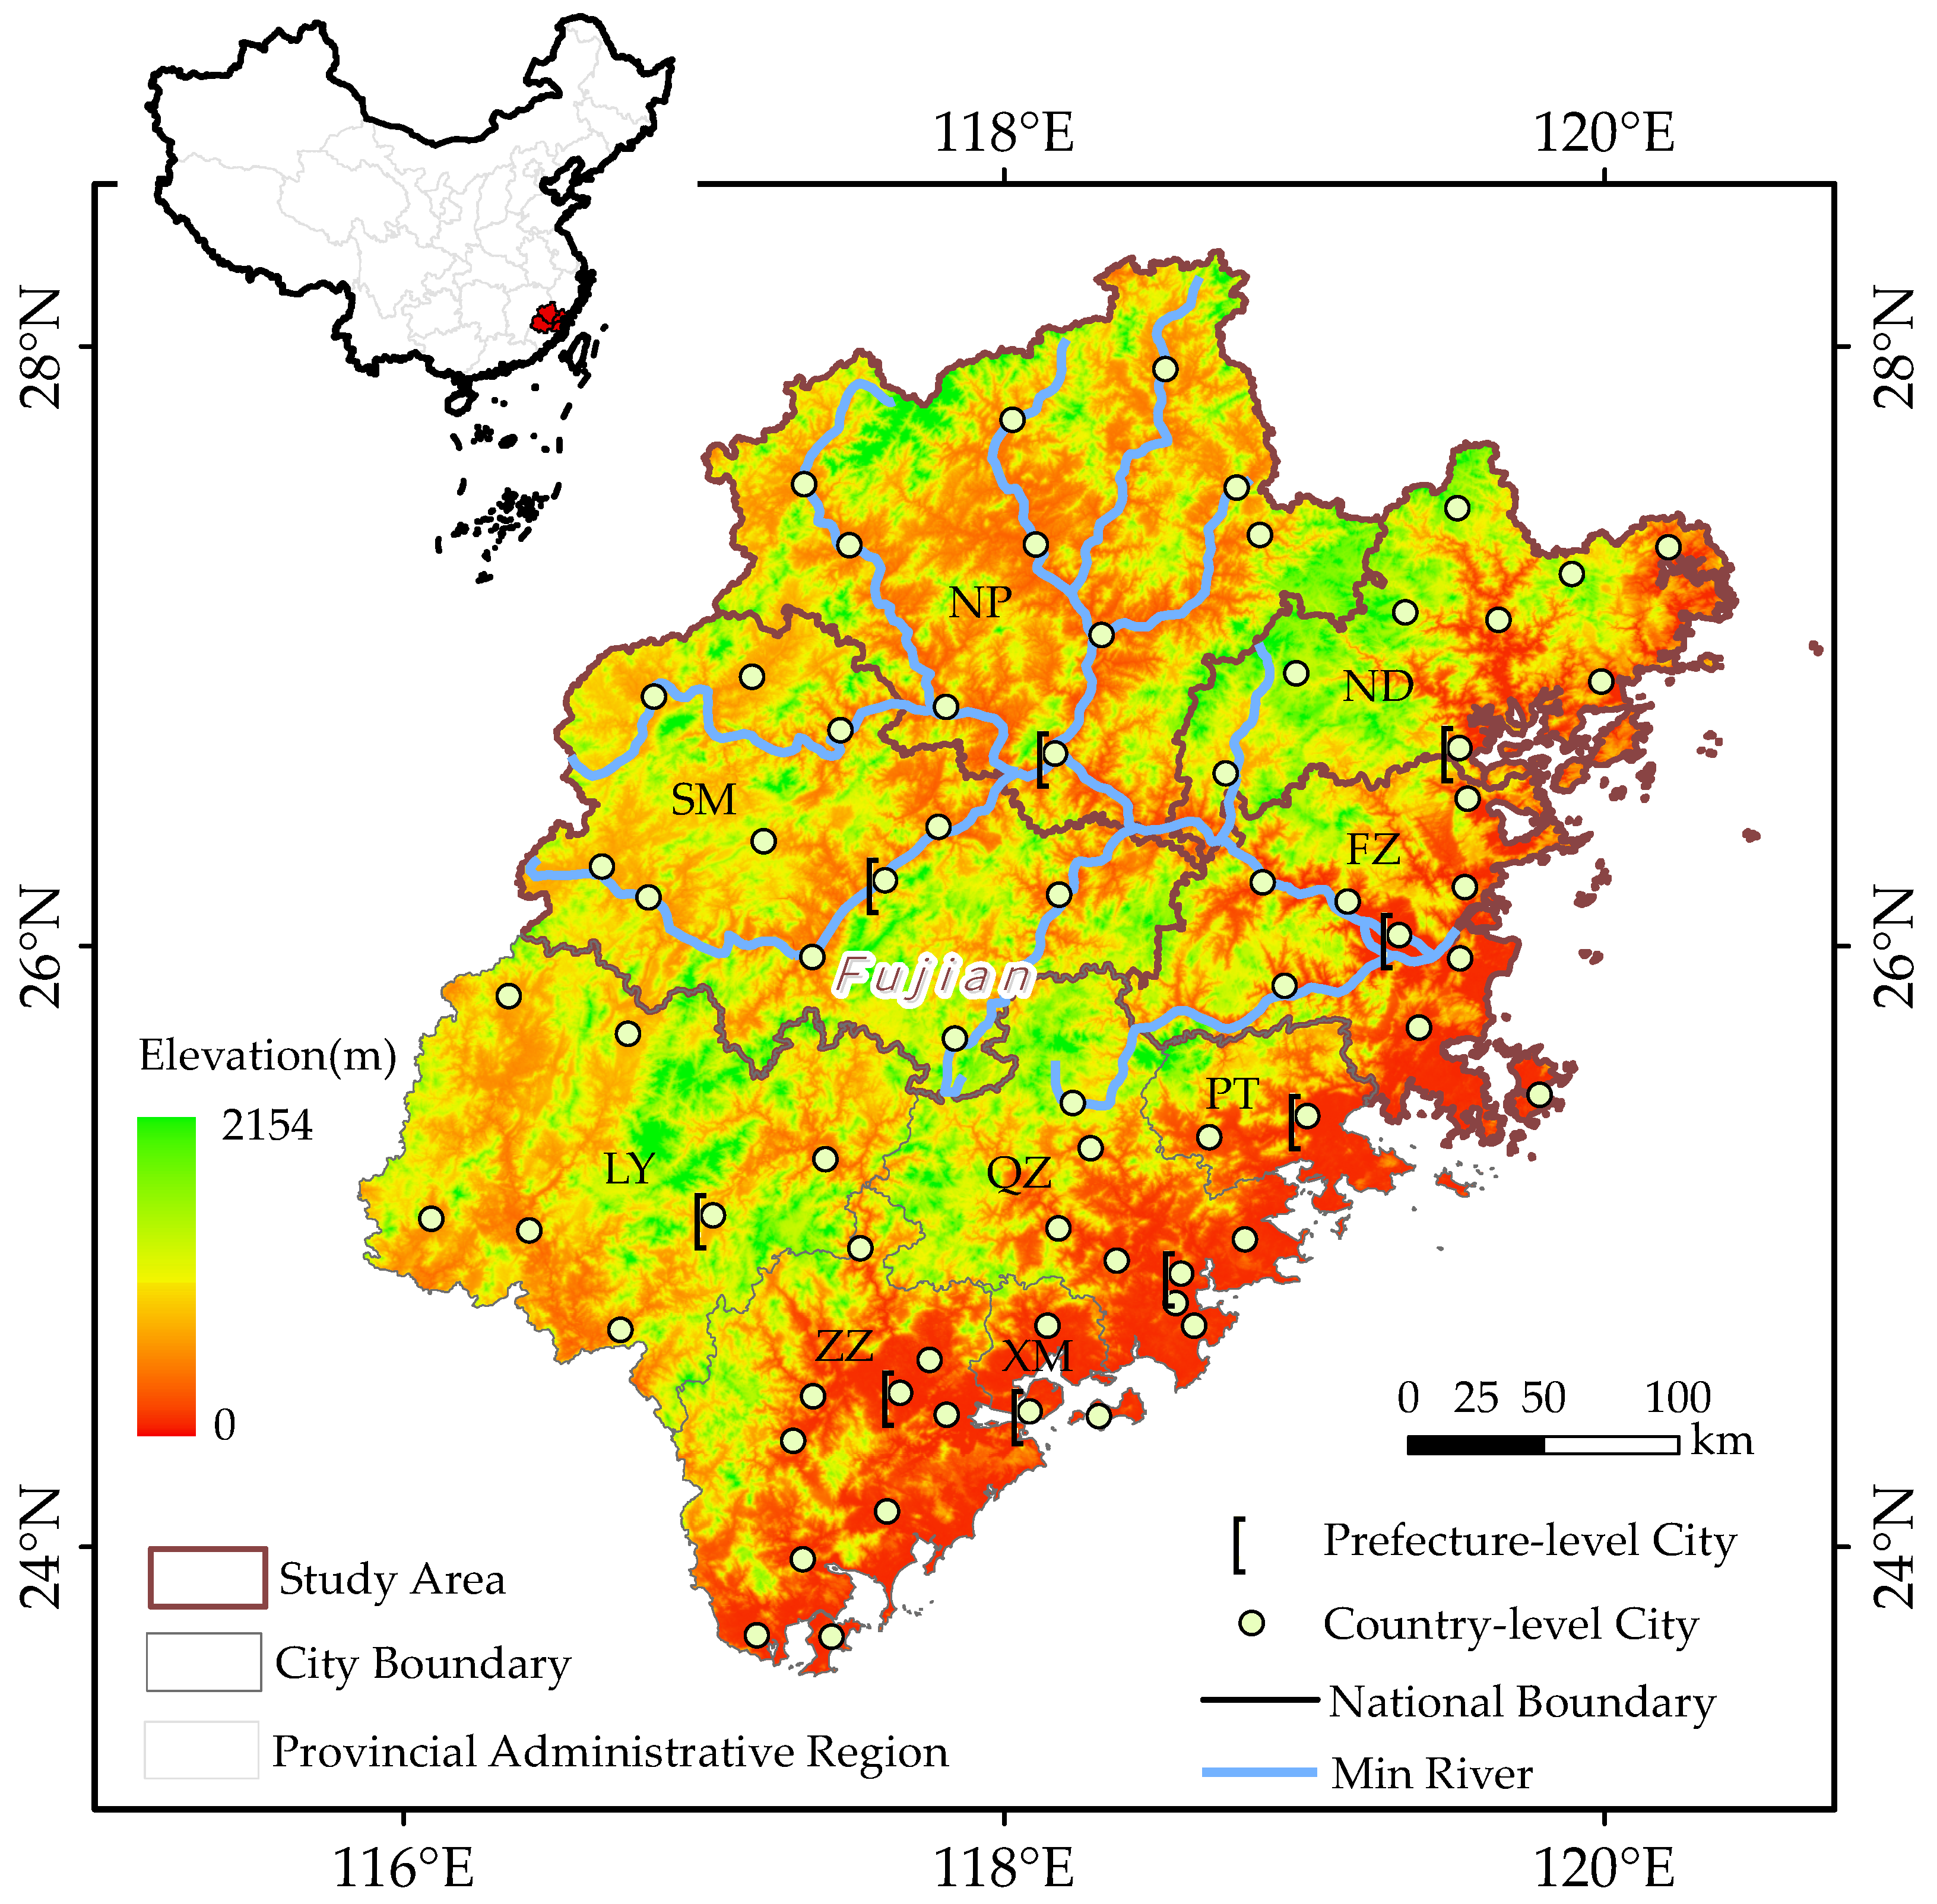
Figure 1. Location of the study area (NP: Nanping city, ND: Ningde city, FZ: Fuzhou city, SM: Sanming city, PT: Putian city, QZ: Quanzhou city, XM: Xiamen city, LY: Longyan city, ZZ: Zhangzhou city).
Sustainability 14 15753 g001
Figure 2. Comparison of the Grey prediction model and Grey Markov model. (a) Comparison of the predicted and true values; (b) the relative error of the Grey prediction model and the Grey Markov model.
Sustainability 14 15753 g002
Figure 3. The Pressure–State–Response framework and the selected indicators.
Sustainability 14 15753 g003
Figure 4. Weight of each indicator for the WECC evaluation system.
Sustainability 14 15753 g004
Figure 5. Spatial-temporal variation of WECC in the Min River Basin from 2011 to 2020.
Sustainability 14 15753 g005
Figure 6. Spatial-temporal variation of the SPI in the Min River Basin from 2011 to 2020 ( S P I 1.5 : severe flooding, 1 S P I < 1.5 : medium flooding, 0.5 S P I < 1 : light flooding, 0.5 S P I < 0.5 : normal, 1 S P I < 0.5 : light drought, 1.5 S P I < 1 : medium drought, S P I 1.5 : severe drought, lack of data for some small islands in the southeast of the study area).
Sustainability 14 15753 g006
Figure 7. Changes in the WECC evaluation index through time. (a) Variation in pressure; (b) variation in state; (c) variation in response.
Sustainability 14 15753 g007
Figure 8. Negative influences of human behavior on WECC from 2011 to 2020. (a) Changes in the population per square kilometer; (b) changes in industrial wastewater discharge; (c) changes in industrial discharge of COD.
Sustainability 14 15753 g008
Figure 9. Correlation coefficients between the regional GDP of the Min River Basin and the percentage of sewage disposal (p = 0.05).
Sustainability 14 15753 g009
Figure 10. Correlation coefficients between the regional GDP of the Min River Basin and the fixed asset investment in urban drainage and sewage treatment (p = 0.05).
Sustainability 14 15753 g010
Figure 11. Percentage of sewage disposal of Min River Basin from 2011 to 2020.
Sustainability 14 15753 g011
Table 1. Details of the screening of the R clustering factor analysis index.
Target LayerGuideline LayerIndicator LayerUnitTypeWhether to Keep
A comprehensive evaluation of WECC in the Min River BasinPresspopulation of per square kilometer, X 1 10 3 persons / m 2 Y
number of residents with access to tap water, X 2 10 4 persons N
natural growth rate of the resident population, X 3 %N
industrial ammonia nitrogen discharge, X 4 tonN
water consumption of industry, X 5 10 8 m 3 Y
per capita water consumption for residential use, X 6 LN
water consumption in forestry, animal husbandry, fishery, and livestock industry, X 7 10 8 m 3 Y
industrial wastewater discharge, X 8 10 7 tons Y
volume of sulfur dioxide emission, X 9 tonY
industrial discharge amount of COD, X 10 10 4 tons Y
average water consumption of irrigated acres of farmland, X 11 m 3 / acre N
per capita comprehensive water consumption, X 12 m 3 / person Y
Stateannual precipitation of the administrative area, X 13 mm+Y
dissolved oxygen, X 14 mg/L+Y
permanganate index, X 15 mg/LY
ammonia nitrogen, X 16 mg/LY
water consumption of 10k CNY of industrial added value, X 17 m 3 / 10 4 CNY N
per capita public green areas, X 18 m 2 +Y
ratio of green areas to city areas, X 19 %+N
per capita water resources, X 20 m 3 / person +Y
water quality standard rate, X 21 %+N
water consumption of 10k CNY GDP, X 22 m 3 / 10 4 CNY Y
the ratio of surface water resources to multi-year average, X 23 %+Y
production capacity of year-end water supply, X 24 10 5 m 3 / day +Y
Responsefixed asset investment in urban drainage and sewage treatment, X 25 10 7 CNY +Y
additional green coverage area, X 26 hm 2 +Y
percentage of sewage disposal of city, X 27 %+Y
percentage of garbage disposal with standard, X 28 %+N
volume of wastewater treated, X 29 10 4 m 3 +Y
forest coverage, X 30 %+Y
Note: In the table, “+” means that the index is conducive to WECC, and “−” means that the index is not conducive to WECC.
Publisher’s Note: MDPI stays neutral with regard to jurisdictional claims in published maps and institutional affiliations.